Abstract
The emergence of diversified applications of laser-induced breakdown spectroscopy in the biomedical field, electronics, space physics, and material processing necessitates a comprehensive understanding of plasma parameters. The present work delineates the structure and evolution of copper plasma under different ambient pressures (0.01 mbar to 100 mbar) along with other plasma parameters. The study reveals the role of ambient pressure in the increase of plasma temperature (Te), electron density (Ne), number of particles in the Debye sphere, plasma frequency, inverse bremsstrahlung absorption coefficient, electron thermal velocity, electron–ion collision frequency and in the decrease of Debye length (λD) and plasma skin depth (PSD). The experimental techniques and the theoretical explanations for the variation of plasma parameters and their applications are also detailed. As the ambient pressure increases, the motion of plasma species becomes restricted, resulting in the increase of Te, calculated using the Boltzmann plot. From the values of λD, PSD, and Ne, it is understood that the copper plasma under investigation is thermally non-relativistic and satisfies McWhirter’s criterion, thus, revealing the local thermodynamic equilibrium condition of plasma. The effects of Debye shielding and stark broadening on the spectral lines are also investigated. Thus, the study helps bring newfangled dimensions to the application of plasma by exploring the possibility of tailoring plasma parameters.
1. Introduction
The advent of ultrashort pulsed laser and detection systems triggered research in the field of laser-induced breakdown spectroscopy (LIBS) [1]. LIBS is an atomic emission spectroscopic technique that uses highly energetic laser pulses to ablate and excite elements from the surface of materials—solid, liquid, and gas–resulting in plasma formation. Aside from the various analytical techniques based on atomic emission and absorption (atomic emission spectroscopy and atomic absorption spectroscopy), LIBS stands unique in terms of its excellent detection limit, accuracy, minimal sample requirement and preparation, and speedy analysis [2]. The adaptability of LIBS in the study of various classes of solids, liquids, and gases makes it a promising tool in elemental analysis. Today, we observe the far-reaching applications of LIBS in various fields such as pharmaceutics, medicine, cosmochemistry, mineralogy, meteoritics geochemistry, archaeology, foodomics, agronomy, pollution studies, and the nuclear industry [3,4,5,6].
Studies on plasma parameters of metals/alloys are one of the emerging research areas in plasma physics since they play an influential role in applications such as laser material processing and thin film deposition [7,8,9,10]. In LIBS, the excited ions and atoms in the plasma give out a unique set of spectral lines that are its characteristic spectral signatures [11]. A proper analysis of the LIBS spectra can throw light into the composition of the material, which helps in the analysis of biological, gaseous, and archaeological samples for trace detection.
The need for high-quality thin films for diversified applications in semiconductor physics necessitates the development of precise thin film deposition techniques. The pulsed laser deposition technique (PLD) offers greater control in tailoring the morphology and characteristics of thin films through plasma engineering. The fast temporal and spatial changes in plasma lead to inhomogeneity, transient nature, and thermal nonequilibrium, which challenge the extensive study of plasma parameters [12,13]. The literature reports that the plasma characteristics are markedly influenced by laser fluence, pulse repetition rate, duration of film deposition, substrate temperature, and ambient pressure and medium [9,14,15]. The important characteristic features of plasma are electron temperature, density, Debye length, number of particles in the Debye sphere, electron plasma frequency, skin depth, inverse Bremsstrahlung absorption, electron thermal velocity, electron-ion collision frequency, and electron thermal de-Broglie wavelength. The quality of the film deposited depends on these parameters. Hence, precise measurement of these parameters is essential in preparing thin films by the PLD technique.
Several plasma diagnostic studies show the possibility of plasma parameter characterization with a single event from one pulse or repetition of pulses using high-power lasers [16,17,18,19]. From all these studies, the physical picture of laser-induced plasma (LIP) is not yet conclusively understood due to the complexity of laser ablation mechanisms, such as the plasma–target interaction, laser–plasma shielding, and plasma plume expansion. Numerous LIBS diagnostic techniques have been developed for element detection and quantification from the characteristic features of plasma [20,21]. The temporal and spatial inhomogeneity in the plasma composition and temperature suggests the possibility of exploring the plasma parameters mentioned above for the practical application of the LIBS technique. The present work gives a comprehensive investigation of the parameters of LIP from the copper target, as an example, under different ambient pressure.
2. Materials and Methods
2.1. Instrumentation
The experimental arrangement shown in Figure 1 comprises a frequency-doubled Q-switched Nd: YAG laser (Quanta Ray-INDI Series-Spectra Physics) of 532 nm wavelength, seven nanosecond pulse width, and 10 Hz pulse repetition rate. The beam is focused onto the copper target (dimension 50 mm × 20 mm × 3 mm) using a convex lens (L1) of focal length 40 cm, at 45° to the target surface. The energy fluence of the laser beam is kept at 80 mJ, and the beam spot size at the target is 0.2 cm. The target is fixed on a rotating target holder placed inside the multiport plasma chamber, and the pressure inside is varied with the help of a turbomolecular pump and a rotary pump. Laser irradiation vaporizes the material generating a plasma of the target in a direction vertical to the sample surface, irrespective of the angle of the interaction of the laser beam. The size of the plume varies with the chamber pressure. The plasma emission is focused, with a plano-convex lens (L2) of focal length 10 cm, imaged and recorded using the Andor Shamrock 500i (500 mm focal length, motorized) Czerny-Turner Spectrograph equipped with Andor iStar sCMOS of 50 frames/s high-speed acquisition rate. For recording the plasma spectrum, the spectrograph with a grating of 300 lines/mm blazed at 500 nm is set perpendicular to the target surface, keeping the entrance slit width at 20 µm and grating. The spectrum is visualized using Andor Solis software. The spectral data are recorded (i) at a vacuum level of 0.01 mbar, (ii) from 0.2 mbar to 1 mbar with an interval of 0.2 mbar, and (iii) at 100 mbar.
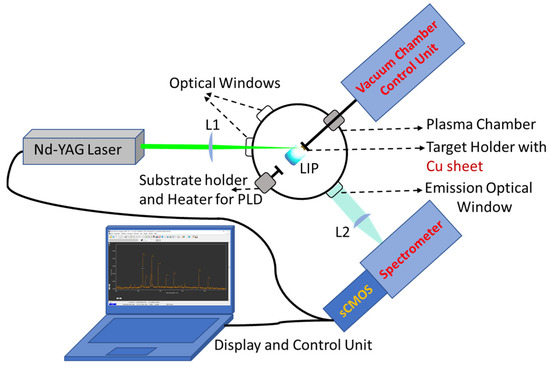
Figure 1.
Schematic of LIBS experimental setup.
2.2. Plasma Parameters
LIP plume can be characterized by its fundamental parameters—the plasma electron temperature and density. Within the plume expansion, the plasma condition changes with space and time, where the global thermodynamic laws are not applicable to validate the behavior of the plasma parameters. Therefore, a localized evaluation is relevant to measure these parameters, where, for different particle species, the plasma parameters are maintained constant. This condition is called the local thermodynamic equilibrium (LTE) [22,23]. At LTE, where all population and depopulation processes are in equilibrium, the relative population of states with atom or ion is given by the Boltzmann distribution:
where Te is the plasma electron temperature, kB is Boltzmann’s constant, and gi and gj are the degeneracy of excited i and ground j state. The minimum electron density (Ne) necessary for the LTE between two states separated in energy by ΔE (in eV) is a function of Te(K) and is given by the McWhirter criterion (Equation (2)) [24]. Under the LTE condition, the Te is calculated from the intensities (Equation (3)) of spectral lines using the Boltzmann plot method [22,25,26].
Taking the natural logarithm of Equation (3), we get,
where I—intensity of the spectral line of wavelength λ, U(T)—partition function, Aij—transition probability, Ei—excited level energy of the upper state i, F—experimental factor, and C—the species concentration. From the slope of the plot of vs. Ei, the electron temperature Te can be deduced.
From the full width half maximum (FWHM), Δλ1/2, of the spectral lines, Ne can be calculated using Equation (5) [27,28,29]. The Δλ1/2 of a well-isolated Stark-broadened line arises due to the contribution from electron impact and ion impact (first and second term of the Equation (5), respectively) [30].
where ω is the electron impact parameter, SI is the ion-broadening parameter, and ND is the number of particles in Debye Length. By neglecting the contribution of ion impact broadening, being small, Equation (5) can be expressed as [22,31]
The measured values of the fundamental parameters (Ne and Te) can be used to calculate the other essential plasma parameters. To reduce the effect of the local electric field and to maintain the quasi-neutrality characteristics inside the plasma, the charged particles respond to give a shielding called Debye Shielding. The shielding length is referred to as the Debye length (λD), also called the Debye radius. The λD and the number of particles inside it, ND, can be obtained from Equations (7) and (8) [32].
The influence of electromagnetic waves (i.e., the laser pulse) or particle beams on Debye shielding makes the plasma oscillate at a characteristic frequency called electron plasma frequency (fb). The value of fb that depends only on Ne can be calculated using Equation (9) [33].
For laboratory plasmas with particular fp, the depth to which electromagnetic radiation can penetrate is called plasma skin depth (PSD) and is given by Equation (10), where c = 3 × 10⁸ m/s.
In underdense plasma, the energy of the refracted laser gets absorbed by the plasma species. Of the main photon absorption mechanisms—inverse bremsstrahlung (IB) and the photoionization of excited species—IB is the dominant [34], and the coefficient of IB () is given by Equation (11).
At a particular Te, the electron of mass me attains an average velocity called electron thermal velocity , given by Equation (12). In dense plasma, the electron–ion collision rate is high, and the rate of collision is given by Equation (13).
where is the Coulomb logarithm, and Z is the ionization state of the plasma species. The average de Broglie wavelength of the electron at a particular temperature is called electron thermal de Broglie wavelength and is given by Equation (14).
where h is the Planck’s constant.
3. Results and Discussion
LIBS is one of the powerful spectroscopic techniques to determine the plasma parameters by measuring the atomic emission intensity and wavelength [35,36,37]. The atomic emission spectrum of the copper metal is recorded in the wavelength range of 325–840 nm, excluding the laser excitation wavelength, at ambient air pressure (P) variations from 0.01 mbar to 100 mbar. The plasma plume images at different ambient pressures for 500 ns gate width, captured through an entrance slit of width 2500 μm, are shown in Figure 2. Upon laser ablation, electrons, ions, and neutral atoms of the target are ejected and travel in the forward direction, constituting the plume. The velocities of the plasma constituents vary with their masses, emitted direction, and ambient gas pressure. At low pressures, the resistance to the movement of plasma species being less, the plume expands above the target surface showing the weak confinement of plasma. The plasma density being less, the spectral intensity is also less. The spectra recorded under different chamber pressure are shown in Figure 3. The increase in chamber pressure restricts the motion of plasma species, thereby preventing the expansion of the plasma plume. The plasma confinement to a smaller volume at 100 mbar, shown in Figure 2, justifies this. The increased confinement effect of plasma with ambient pressure leads to an enhanced collision rate of the plasma species and the release of energy appearing as an increase in spectral intensity and plasma, which is evident from the variation of the hottest region in the image of the plasma plume. Figure 2 also shows the detachment of the plasma plume from the target surface, which can be explained by the plume expansion and subsequent cooling with the trailing end of the laser pulse. Upon cooling, after the trailing end of the laser pulse, the cooler adjacent air molecules rush in and detach the hotter region of the plasma plume from the target surface.
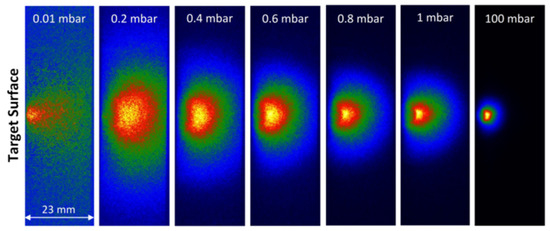
Figure 2.
sCMOS images of the induced plasma plume at varying ambient air pressure.
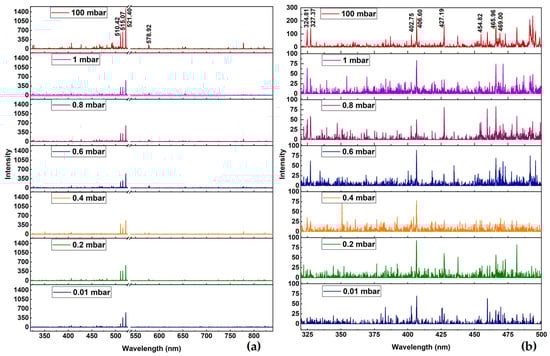
Figure 3.
(a) Copper plasma emission spectrum at different ambient air pressure and (b) the enlarged portion of the spectrum in the range 320 to 500 nm.
The Cu I and Cu II emission spectrum recorded with a gate delay of 400 ns for different air pressure is shown in Figure 3a with 320 to 500 nm region enlarged in Figure 3b. The analysis reveals a more significant number of well-resolved emission lines of Cu I. Hence, in the present study, only the Cu I emission lines are analyzed to understand the behavior of plasma parameters. Using the spectroscopic parameters—upper-level energy, transition probability, and upper-level degeneracy—from the NIST database, shown in Table 1, for the Cu I emission lines, the Boltzmann plot (Figure 4a) is drawn [38]. From the slope of the Boltzmann plot (Equation (4)), the plasma electron temperature (Te) is calculated, and its variation with P is shown in Figure 4b. It is observed that the value of Te is less at low chamber pressure and increases with the pressure for a given laser fluence (80 mJ), which is reflected as a decrease in the slope of the Boltzmann plot. When the chamber pressure is increased to 100 mbar, the value of Te is 11,273.46 K. This temperature is not included in Figure 4b as there is a greater difference in the values of pressure. The observation justifies the analysis of Figure 2 that the increase of P restricts the plume expansion and enhances the collision of energetic plasma species. Knowledge of plasma temperature is essential in magnetically confined plasma, to obtain fusion continuity for a long time in nuclear power plants [39].

Table 1.
Copper plasma emission peaks and spectral transition parameter assignment.
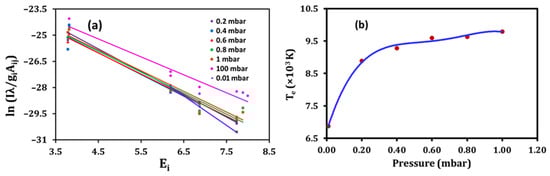
Figure 4.
(a) Boltzmann plot for Cu I emission lines and (b) variation of electron plasma temperature, Te, (R2 = 0.9957) at different ambient air pressure.
The width of peaks in the plasma spectrum, shown in Figure 3, is a function of the plasma electron density, Ne, which can be estimated from the average FWHM of the Stark-broadened profile of the non-overlapped peaks in a spectrum. For example, at pressure 0.2 mbar, the peaks corresponding to Cu I—402.67, 406.52, 454.02, 459.63, 466.04, 510.42, 515.07, and 521.48 nm—are considered for the calculation of Ne using the value of ω from the literature [40,41] in Equation (6). The representative peak at 515.07 nm at a pressure of 0.2 mbar for Cu I, showing stark broadening, is displayed in Figure 5a. Out of the three broadening mechanisms—Doppler broadening, collision broadening, and stark broadening—the third is the dominant broadening mechanism in the laser plasma, which influences the spectral linewidth more. The local electric field greatly influences the spectral emission from the densest region of the plasma, leading to a stark broadening and shift in the atomic and ionic emission line. The pressure dependence of Ne in the range of 0.01 mbar to 1 mbar is shown in Figure 5b. The study reveals that irrespective of the chamber pressure, the value of Ne is greater than the critical value set by McWhirter’s criterion, indicating the LTE condition. It can also be understood from Figure 5b that Ne increases, with P reaching a value of 2.24 × 1016 cm−3 at 100 mbar, which agrees well with the explanation given for plasma plume and Te. The greater the chamber pressure, the greater the number of air molecules in contact with the target surface, which plays a significant role in the energy exchange between them. The higher P reduces the mean free path of the species in the plasma, producing denser plasma with higher temperatures [42].
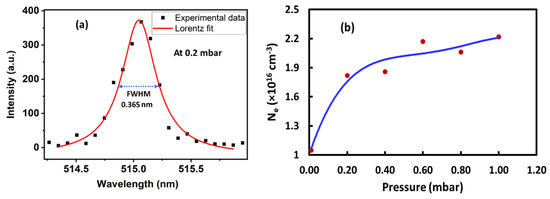
Figure 5.
(a) FWHM measurement of a Stark broadened peak at Cu I 515.07 nm and (b) variation of density, Ne (R2 = 0.9580) with ambient air pressure.
The increase of plasma density with P results in a shielding effect and reduces laser energy density at the target surface. Figure 5b shows that the rate of change of electron density is rapid initially up to 0.4 mbar and slows down later. This observation justifies the shielding mechanism involved. As the charged particles initially build up in the plasma, the local electric field and temperature increase with which the laser pulse interacts. The change in Te and the field refracts and reduces the laser energy density at the target. This accounts for the reduced rate of increase of Te and Ne beyond 0.4 mbar. Another factor that comes into play is the inverse bremsstrahlung arising due to the increased collision frequency of plasma species. Knowledge of the plasma temperature and density is needed to realize the dissociation, atomization, ionization, and excitation processes in plasma that play a vital role in the quantitative analysis of materials using LIBS.
A laser-produced plasma is always in a quasi-neutral state, where the fundamental parameters actively try to be in an ideal equilibrium state by readjusting the charge distribution in response to an external disturbance [33]. With the initiation of plasma formation, the electric field due to the charged species increases, which builds up a shielding mechanism to the incident photon. Hence, the effective electric field at the target surface due to the laser pulse decreases. This mechanism is known as Debye shielding, which extends over a distance called Debye length (λD), calculated using Equation (7). Thus, λD can be regarded as one of the fundamental properties of plasma, a function of Ne and Te. The significance of investigating λD is that it gives information about the quasi-neutrality of the plasma, as λD is the characteristic distance of separation between electrons and ions in the plasma. The difference between the electron density (Ne) and ion density (Ni) ΔN = , tells about the quasi-neutrality of the plasma system of length L. The variation of λD and the total number of particles in the Debye sphere (ND—calculated using Equation (8)) with P is shown in Figure 6a,b. Figure 6a shows the decrease of λD with ambient pressure. A comparison of λD with plume size (L) reveals that λD << L, which agrees with the literature [43]. The quasi-neutrality condition demands ΔN << Ne and Ni or L >> λD, which suggests that the plasma plume shown in Figure 2 is in a quasi-neutral state. The quasi-neutrality of a plasma can be defined on a macroscopic scale, while there may be deviations in the microscopic scale. From Figure 6b, it can be seen that ND increases with P. From Figure 5b and Figure 6b, it can be inferred that as the chamber pressure increases, the number density of charged species dominates in ND.
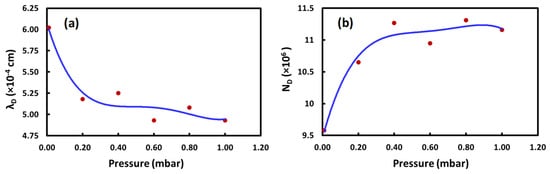
Figure 6.
Variation of (a) Debye length, λD (R2 = 0.9288), and (b) number of particles in the Debye sphere, ND (R2 = 0.9570), with ambient air pressure.
Since the reflection and absorption of the laser pulse depend on fp, the oscillating nature of the plasma is also investigated. The pressure dependence of fp, the characteristic plasma frequency, is shown in Figure 7a, which shows an increase with P due to the rise in Te and Ne. The plasma electrons oscillate at high frequencies due to thermal distress. At larger fp (overdense plasma) the electromagnetic waves will get reflected from the plasma, and at smaller fp (underdense plasma) it will get refracted through the plasma. The decreasing nature of PSD, as evident from Figure 7b, is due to its inverse dependence on fp. From Equations (7) and (10) it is evident that the λD and PSD are inversely proportional to the square root of Ne. PSD can give information on the relativistic nature of the plasma in comparison with λD, i.e., when λD < PSD this means that the plasma is thermally non-relativistic (kTe << mec2 = 0.5 MeV), and when λD ≥ PSD, plasma is said to be thermally relativistic [44]. Knowledge of the relativistic nature of plasma is highly essential in the applications such as ion propulsion, fast ignitor fusion, proton therapy, astrophysics, time-resolved radio-biological studies, and radio-chemistry experiments [45]. From Figure 6a and Figure 7b, it is evident that for the copper plasma in the present investigation, λD < PSD, revealing that the plasma is thermally non-relativistic.
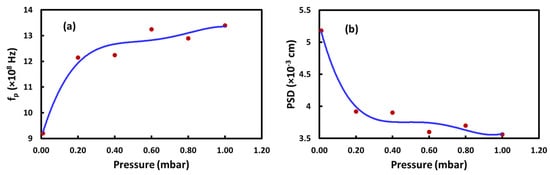
Figure 7.
Variations in (a) electron plasma frequency, fp, (R2 = 0.9613) and (b) plasma skin depth, PSD, (R2 = 0.9718) with ambient air pressure.
The IB becomes significant when the electron in the plasma absorbs a photon and thereby undergoes a momentum change. Such absorption is a highly dominant mechanism of photon absorption in laser plasma. From Figure 5b and Figure 6b, it is evident that Ne and ND increase with P. The variation of IB co-efficient, αIB, with P from 0.01 mbar to 1 mbar is shown in Figure 8a. The value of αIB at 100 mbar is 9.78 × 10⁻¹⁵ cm−1. As the increase of P increases Ne and ND, the probability of interaction of a photon with an electron in the plasma becomes high, which accounts for the increased absorption leading to the IB. As IB changes the electron momentum, the electron thermal velocity () also changes. The variation of average velocity , calculated using Equation (11), with P is shown in Figure 8b. The increase of Te, Ne, ND, and with P enhances the electron–ion collision frequency (Vei), as shown in Figure 8c. The increase of with Te which in turn with P increases the electron momentum and, hence, lowers the electron de Broglie wavelength (λth,e), is shown in Figure 8d.
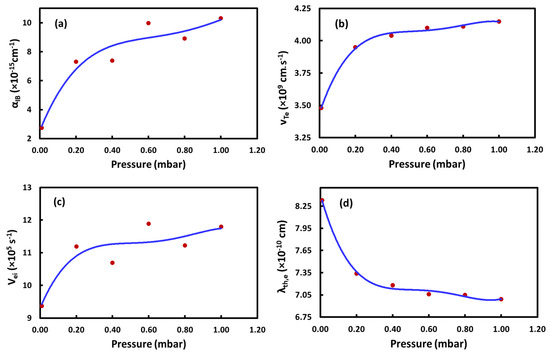
Figure 8.
Variation of (a) IB coefficient—αIB (R2= 0.9319) and (b) electron-thermal velocity— (R2 = 0.9967), (c) electron-ion collision frequency—Vei (R2 = 0.8068) and (d) electron thermal de Broglie wavelength—λth,e (R2 = 0.9957)with varying ambient air pressure.
4. Conclusions
Comprehensive analysis of LIP has become inevitable, considering the applications of LIBS in diversified fields of science and technology. In this work, the second harmonic radiation of a Q-switched Nd: YAG laser (532 nm) of pulse width 7 ns at a fluency of 80 mJ is used for plasma generation on a copper sheet surface. As a function of ambient air pressure from 0.01 mbar to 100 mbar, a systematic analysis of different plasma parameters, e.g., plasma electron temperature, plasma electron density, Debye length, number of particles in a Debye sphere, electron plasma frequency, plasma skin depth, inverse bremsstrahlung absorption, electron thermal velocity, electron–ion collision frequency is performed. The analysis of plasma plumes at low pressures showed the weak confinement of plasma due to less resistance to the movement of plasma species. As the P increases, the confinement effect and the collision rate of the plasma species are enhanced, resulting in the release of energy. This is reflected as an increase in spectral intensity and plasma temperature estimated from the Boltzmann plot of several singly ionized and well-isolated spectral lines of Cu. At the same time, the electron density measurement using the Stark broadened profile confirmed that the LIP obeys the LTE condition where the value of Ne is greater than the critical value set by McWhirter’s criterion. Thus, the increase of plasma density with pressure causes a shielding effect, decreasing the Debye length and increasing the total number of particles in the Debye sphere. The analysis of copper plasma also revealed that it fulfills the condition for quasi-neutrality, ΔN ˂˂ Ne and Ni or L >> λD, which also agrees well with the plasma plume analysis. Since the plasma electrons oscillate at high frequency due to thermal distress, as Te and Ne increase, the value of fp also increases with P. The variation of PSD with P throws light into the relativistic nature of plasma, which is highly significant for applications in astrophysics, proton therapy, and radiochemistry. In the present work, as λD < PSD, the copper plasma is said to be thermally non-relativistic. Information regarding the highly dominant absorption mechanism, IB, in plasma is also studied. The variation of IB co-efficient, αIB, shows an increase with P, which is attributed to the enhanced interaction of photons with electrons in the plasma accounting for the increased IB absorption. This results in increased electron momentum, increasing electron thermal velocity, electron–ion collision frequency, and electron de Broglie wavelength with ambient pressure. Thus, the comprehensive analysis of the laser-induced copper plasma opens up the potential of LIBS in panoramic fields of science, where the plasma parameters play a significant role.
Author Contributions
Methodology, A.A.; software, A.A.; validation, M.N.S.S. and S.I.S.; formal analysis, A.A., M.N.S.S. and S.I.S.; writing—original draft, A.A.; writing—review and editing, M.N.S.S., H.C. and S.I.S.; Supervision, H.C. and S.I.S. All authors have read and agreed to the published version of the manuscript.
Funding
This research received no external funding.
Institutional Review Board Statement
Not applicable.
Informed Consent Statement
Not applicable.
Data Availability Statement
The data that support the finding of this study are available from the corresponding author upon reasonable request.
Conflicts of Interest
The authors declare no conflict of interest.
References
- Cremers, D.A.; Radziemski, L.J. History and Fundamentals of LIBS. In Laser-Induced Breakdown Spectroscopy (LIBS); Miziolek, A.W., Palleschi, V., Schechter, I., Eds.; Cambridge University Press: Cambridge, UK, 2006; Volume 9780521852, pp. 1–39. ISBN 9780511541261. [Google Scholar]
- Noll, R. Laser-Induced Breakdown Spectroscopy; Springer Berlin Heidelberg: Berlin, Heidelberg, 2012; ISBN 978-3-642-20667-2. [Google Scholar]
- Kanyinda Jean-Noëla, M.; Tshamala Arthurb, K.; Jean-Marcc, B. LIBS Technology and Its Application: Overview of the Different Research Areas. J. Environ. Sci. Public Heal. 2020, 04, 134–149. [Google Scholar] [CrossRef]
- Zhang, Q.; Liu, Y.; Chen, Y.; Zhangcheng, Y.; Zhuo, Z.; Li, L. Online Detection of Halogen Atoms in Atmospheric VOCs by the LIBS-SPAMS Technique. Opt. Express 2020, 28, 22844. [Google Scholar] [CrossRef]
- Zhou, Z.; Ge, Y.; Liu, Y. Real-Time Monitoring of Carbon Concentration Using Laser-Induced Breakdown Spectroscopy and Machine Learning. Opt. Express 2021, 29, 39811. [Google Scholar] [CrossRef]
- Ye, Y.; Wan, E.; Sun, Z.; Zhang, X.; Zhang, Z.; Liu, Y. Online Detection and Source Tracing of Crop Straw Burning. J. Laser Appl. 2022, 34, 042049. [Google Scholar] [CrossRef]
- Kochuev, D.A.; Voznesenskaya, A.A.; Galkin, A.F.; Khorkov, K.S.; Chernikov, A.S.; Chkalov, R. V Influence of Laser-Induced Plasma Parameters on the Formation of Laser-Induced Surface-Periodic Structures. J. Phys. Conf. Ser. 2021, 2077, 012009. [Google Scholar] [CrossRef]
- Lachko, I.M.; Volkov, R.V.; Golishnikov, D.M.; Gordienko, V.M.; Dzhidzhoev, M.S.; Mar’in, B.V.; Mikheev, P.M.; Savel’ev, A.B.; Uryupina, D.S.; Shashkov, A.A. Control of Femtosecond Laser Plasma Parameters by Surface Contaminants Cleaning with Preceding Laser Pulse. In Proceedings of the Volume 5482, Laser Optics 2003: Superintense Light Fields and Ultrafast Processes, St. Petersburg, Russia, 30 June–4 July 2003; pp. 102–111. [Google Scholar]
- Ojeda-G-P, A.; Döbeli, M.; Lippert, T. Influence of Plume Properties on Thin Film Composition in Pulsed Laser Deposition. Adv. Mater. Interfaces 2018, 5, 1701062. [Google Scholar] [CrossRef]
- Escobar-Alarcón, L.; Arrieta, A.; Camps, E.; Romero, S.; Fernandez, M.; Haro-Poniatowski, E. Influence of the Plasma Parameters on the Properties of Aluminum Oxide Thin Films Deposited by Laser Ablation. Appl. Phys. A 2008, 93, 605–609. [Google Scholar] [CrossRef]
- Radziemski, L.J.; Cremers, D.A. Laser-Induced Plasmas and Applications; Marcel Dekker: New York, NY, USA, 1989; ISBN 9780511541261. [Google Scholar]
- Diwakar, P.K.; Hahn, D.W. Study of Early Laser-Induced Plasma Dynamics: Transient Electron Density Gradients via Thomson Scattering and Stark Broadening, and the Implications on Laser-Induced Breakdown Spectroscopy Measurements. Spectrochim. Acta Part B At. Spectrosc. 2008, 63, 1038–1046. [Google Scholar] [CrossRef]
- Irimiciuc, S.A.; Gurlui, S.; Bulai, G.; Nica, P.; Agop, M.; Focsa, C. Langmuir Probe Investigation of Transient Plasmas Generated by Femtosecond Laser Ablation of Several Metals: Influence of the Target Physical Properties on the Plume Dynamics. Appl. Surf. Sci. 2017, 417, 108–118. [Google Scholar] [CrossRef]
- Krebs, H.-U.; Weisheit, M.; Faupel, J.; Süske, E.; Scharf, T.; Fuhse, C.; Störmer, M.; Sturm, K.; Seibt, M.; Kijewski, H.; et al. Pulsed Laser Deposition (PLD)—A Versatile Thin Film Technique. In Advances in Solid State Physics; Springer: Berlin, Germany, 2003; pp. 505–518. [Google Scholar]
- Richter, A. Characteristic Features of Laser-Produced Plasmas for Thin Film Deposition. Thin Solid Films 1990, 188, 275–292. [Google Scholar] [CrossRef]
- Kumar, N.; Dash, S.; Tyagi, A.K.; Raj, B. Dynamics of Plasma Expansion in the Pulsed Laser Material Interaction. Sadhana 2010, 35, 493–511. [Google Scholar] [CrossRef]
- Sarkar, A.; Shah, R.V.; Alamelu, D.; Aggarwal, S.K. Studies on the Ns-IR-Laser-Induced Plasma Parameters in the Vanadium Oxide. J. At. Mol. Opt. Phys. 2011, 2011, 1–7. [Google Scholar] [CrossRef]
- Harilal, S.S.; Bindhu, C.V.; Issac, R.C.; Nampoori, V.P.N.; Vallabhan, C.P.G. Electron Density and Temperature Measurements in a Laser Produced Carbon Plasma. J. Appl. Phys. 1997, 82, 2140–2146. [Google Scholar] [CrossRef]
- Harilal, S.S.; Phillips, M.C.; Froula, D.H.; Anoop, K.K.; Issac, R.C.; Beg, F.N. Optical Diagnostics of Laser-Produced Plasmas. arXiv 2022, arXiv:2201.08783. [Google Scholar]
- Hussain Shah, S.K.; Iqbal, J.; Ahmad, P.; Khandaker, M.U.; Haq, S.; Naeem, M. Laser Induced Breakdown Spectroscopy Methods and Applications: A Comprehensive Review. Radiat. Phys. Chem. 2020, 170, 108666. [Google Scholar] [CrossRef]
- Pasquini, C.; Cortez, J.; Silva, L.M.C.; Gonzaga, F.B. Laser Induced Breakdown Spectroscopy. J. Braz. Chem. Soc. 2007, 18, 463–512. [Google Scholar] [CrossRef]
- Hafez, M.A.; Khedr, M.A.; Elaksher, F.F.; Gamal, Y.E. Characteristics of Cu Plasma Produced by a Laser Interaction with a Solid Target. Plasma Sources Sci. Technol. 2003, 12, 185–198. [Google Scholar] [CrossRef]
- Griem, H.R. Principles of Plasma Spectroscopy; Cambridge University Press: Cambridge, UK, 1997; ISBN 9780521455046. [Google Scholar]
- McWhirter, R.W.P.; Richard, H. Plasma Diagnostic Techniques; Huddlestone, R.H., Leonard, S.L., Eds.; Academic Press: New York, NY, USA, 1965. [Google Scholar]
- Liu, H.C.; Mao, X.L.; Yoo, J.H.; Russo, R.E.U. Early Phase Laser Induced Plasma Diagnostics and Mass Removal during Single-Pulse Laser Ablation of Silicon. Spectrochim. Acta Part B At. Spectrosc. 1999, 54, 1607–1624. [Google Scholar] [CrossRef]
- Fikry, M.; Tawfik, W.; Omar, M.M. Investigation on the Effects of Laser Parameters on the Plasma Profile of Copper Using Picosecond Laser Induced Plasma Spectroscopy. Opt. Quantum Electron. 2020, 52, 249. [Google Scholar] [CrossRef]
- Gornushkin, I.B.; King, L.A.; Smith, B.W.; Omenetto, N.; Winefordner, J.D. Line Broadening Mechanisms in the Low Pressure Laser-Induced Plasma. Spectrochim. Acta Part B At. Spectrosc. 1999, 54, 1207–1217. [Google Scholar] [CrossRef]
- Colón, C.; Alonso-Medina, A.; Herrán-Martínez, C. Spectroscopic Study of a Laser-Produced Lead Plasma: Experimental Atomic Transition Probabilities for Pb III Lines. J. Phys. B At. Mol. Opt. Phys. 1999, 32, 3887–3897. [Google Scholar] [CrossRef]
- Shaikh, N.M.; Rashid, B.; Hafeez, S.; Jamil, Y.; Baig, M.A. Measurement of Electron Density and Temperature of a Laser-Induced Zinc Plasma. J. Phys. D. Appl. Phys. 2006, 39, 1384–1391. [Google Scholar] [CrossRef]
- Sarkar, A.; Singh, M. Laser-Induced Plasma Electron Number Density: Stark Broadening Method versus the Saha–Boltzmann Equation. Plasma Sci. Technol. 2017, 19, 025403. [Google Scholar] [CrossRef]
- Search, H.; Journals, C.; Contact, A.; Iopscience, M.; Address, I.P. Characteristics of Excimer Laser Induced Plasma from an Aluminum Target by Spectroscopic Study Characteristics of Excimer Laser Induced Plasma from an Aluminum Target by Spectroscopic Study. Jpn. J. Appl. Phys. 1999, 2958, 18–24. [Google Scholar]
- Gibbon, P. Introduction to Plasma Physics. In Proceedings of the 2014 CAS-CERN Accelerator School: Plasma Wake Acceleration, Geneva, Switzerland, 23–29 November 2014; pp. 51–65. [Google Scholar] [CrossRef]
- Chen, F.F. Introduction to Plasma Physics and Controlled Fusion; Springer International Publishing: Cham, Switzerland, 2016; ISBN 978-3-319-22308-7. [Google Scholar]
- Haq, S.U.; Ahmat, L.; Mumtaz, M.; Shakeel, H.; Mahmood, S.; Nadeem, A. Spectroscopic Studies of Magnesium Plasma Produced by Fundamental and Second Harmonics of Nd:YAG Laser. Phys. Plasmas 2015, 22, 083504. [Google Scholar] [CrossRef]
- Hahn, D.W.; Lunden, M.M. Detection and Analysis of Aerosol Particles by Laser-Induced Breakdown Spectroscopy. Aerosol Sci. Technol. 2000, 33, 30–48. [Google Scholar] [CrossRef]
- Jaspers, R.J.E. Plasma Spectroscopy. Fusion Sci. Technol. 2012, 61, 384–393. [Google Scholar] [CrossRef]
- Unnikrishnan, V.K.; Alti, K.; Kartha, V.B.; Santhosh, C.; Gupta, G.P.; Suri, B.M. Measurements of Plasma Temperature and Electron Density in Laser-Induced Copper Plasma by Time-Resolved Spectroscopy of Neutral Atom and Ion Emissions. Pramana 2010, 74, 983–993. [Google Scholar] [CrossRef]
- NIST Atomic Spectra Database. Available online: http://physics.nist.gov (accessed on 1 January 2021).
- National Academies of Sciences, Engineering, and Medicine. Plasma Science:Enabling Technology, Sustainability, Security, and Exploration; The National Academies Press: Washington, DC, USA, 2021; ISBN 9780309677639. [Google Scholar]
- Konjević, N.; Wiese, W.L. Experimental Stark Widths and Shifts for Spectral Lines of Neutral and Ionized Atoms. J. Phys. Chem. Ref. Data 1990, 19, 1307–1385. [Google Scholar] [CrossRef]
- Konjević, N.; Lesage, A.; Fuhr, J.R.; Wiese, W.L. Experimental Stark Widths and Shifts for Spectral Lines of Neutral and Ionized Atoms (A Critical Review of Selected Data for the Period 1989 Through 2000). J. Phys. Chem. Ref. Data 2002, 31, 819–927. [Google Scholar] [CrossRef]
- Farid, N.; Bashir, S.; Mahmood, K. Effect of Ambient Gas Conditions on Laser-Induced Copper Plasma and Surface Morphology. Phys. Scr. 2012, 85, 015702. [Google Scholar] [CrossRef]
- Wiesemann, K. A Short Introduction to Plasma Physics. arXiv 2014, arXiv:1404.0509. [Google Scholar]
- Stenson, E.V.; Horn-Stanja, J.; Stoneking, M.R.; Pedersen, T.S. Debye Length and Plasma Skin Depth: Two Length Scales of Interest in the Creation and Diagnosis of Laboratory Pair Plasmas. J. Plasma Phys. 2017, 83, 595830106. [Google Scholar] [CrossRef]
- Umstadter, D. Review of Physics and Applications of Relativistic Plasmas Driven by Ultra-Intense Lasers. Phys. Plasmas 2001, 8, 1774. [Google Scholar] [CrossRef]


Disclaimer/Publisher’s Note: The statements, opinions and data contained in all publications are solely those of the individual author(s) and contributor(s) and not of MDPI and/or the editor(s). MDPI and/or the editor(s) disclaim responsibility for any injury to people or property resulting from any ideas, methods, instructions or products referred to in the content. |
© 2023 by the authors. Licensee MDPI, Basel, Switzerland. This article is an open access article distributed under the terms and conditions of the Creative Commons Attribution (CC BY) license (https://creativecommons.org/licenses/by/4.0/).