Methylene Blue Optical Fiber Sensor Filled with Calcium Alginate Hydrogel

Abstract
:1. Introduction
2. Materials and Methods
2.1. Sensor Structure and Principle
2.2. Sensitive Materials
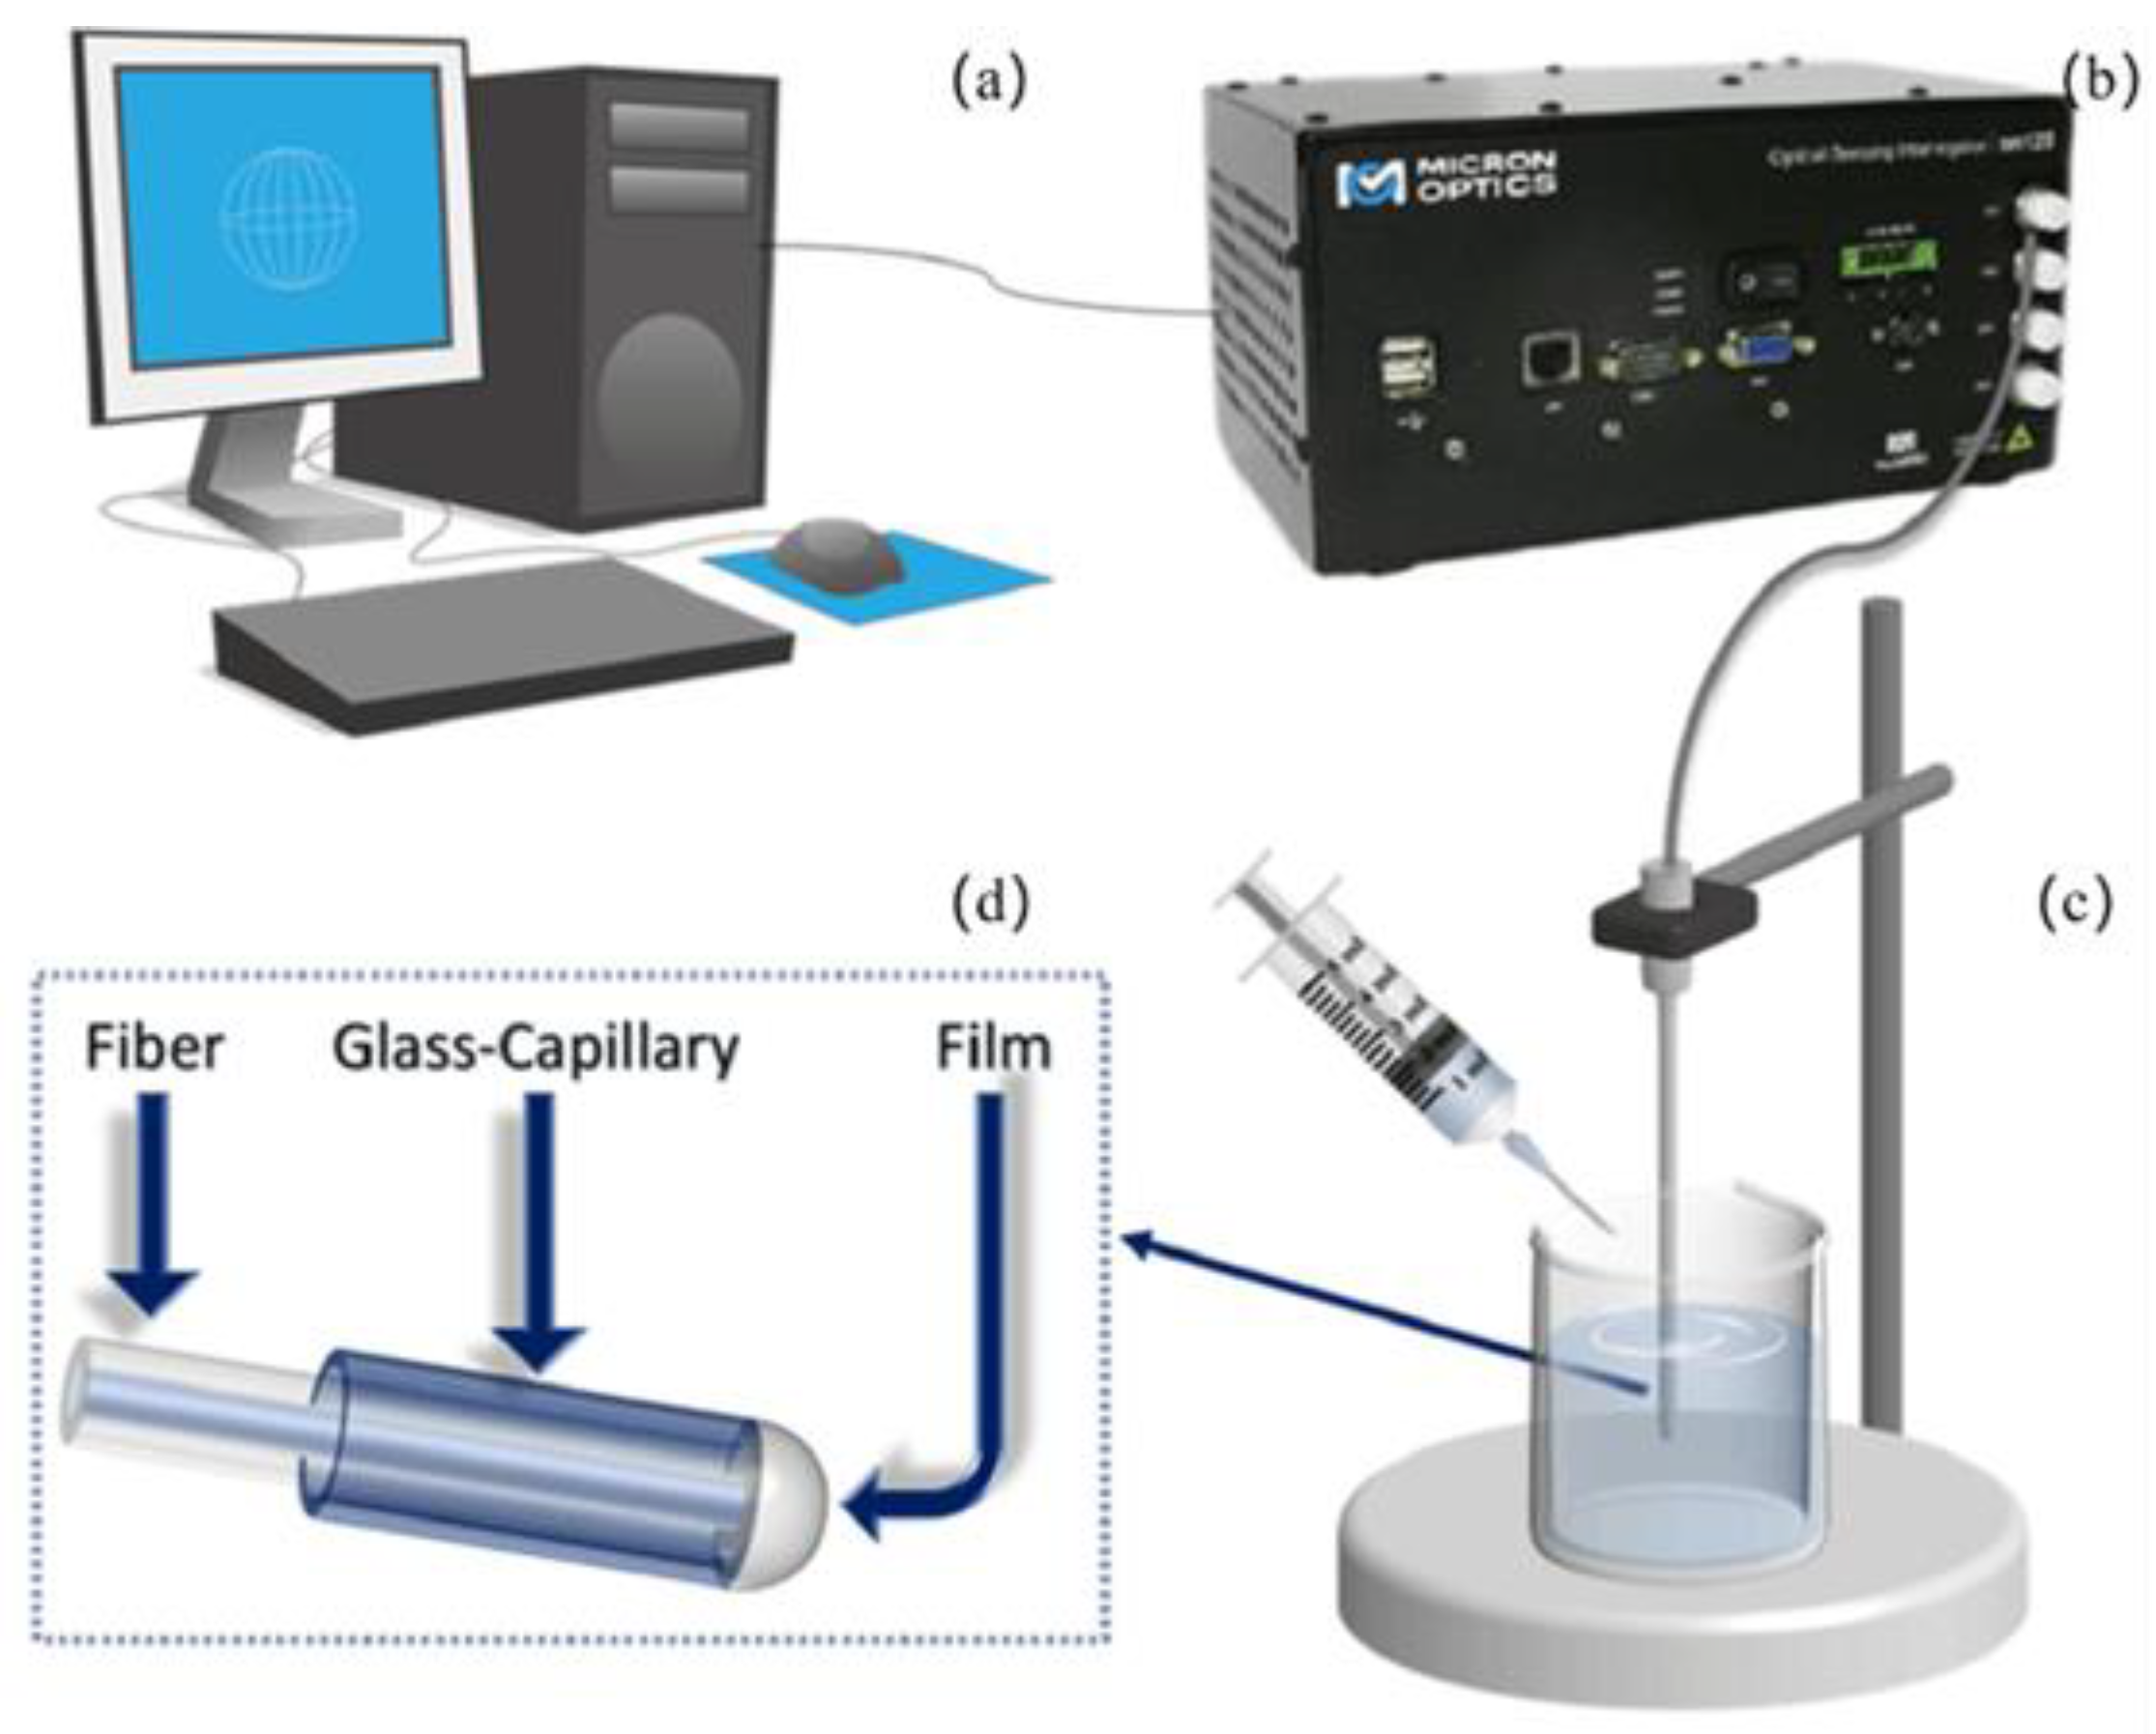
2.3. Experimental System
3. Results and Discussions
3.1. Methylene Blue Response Experiments
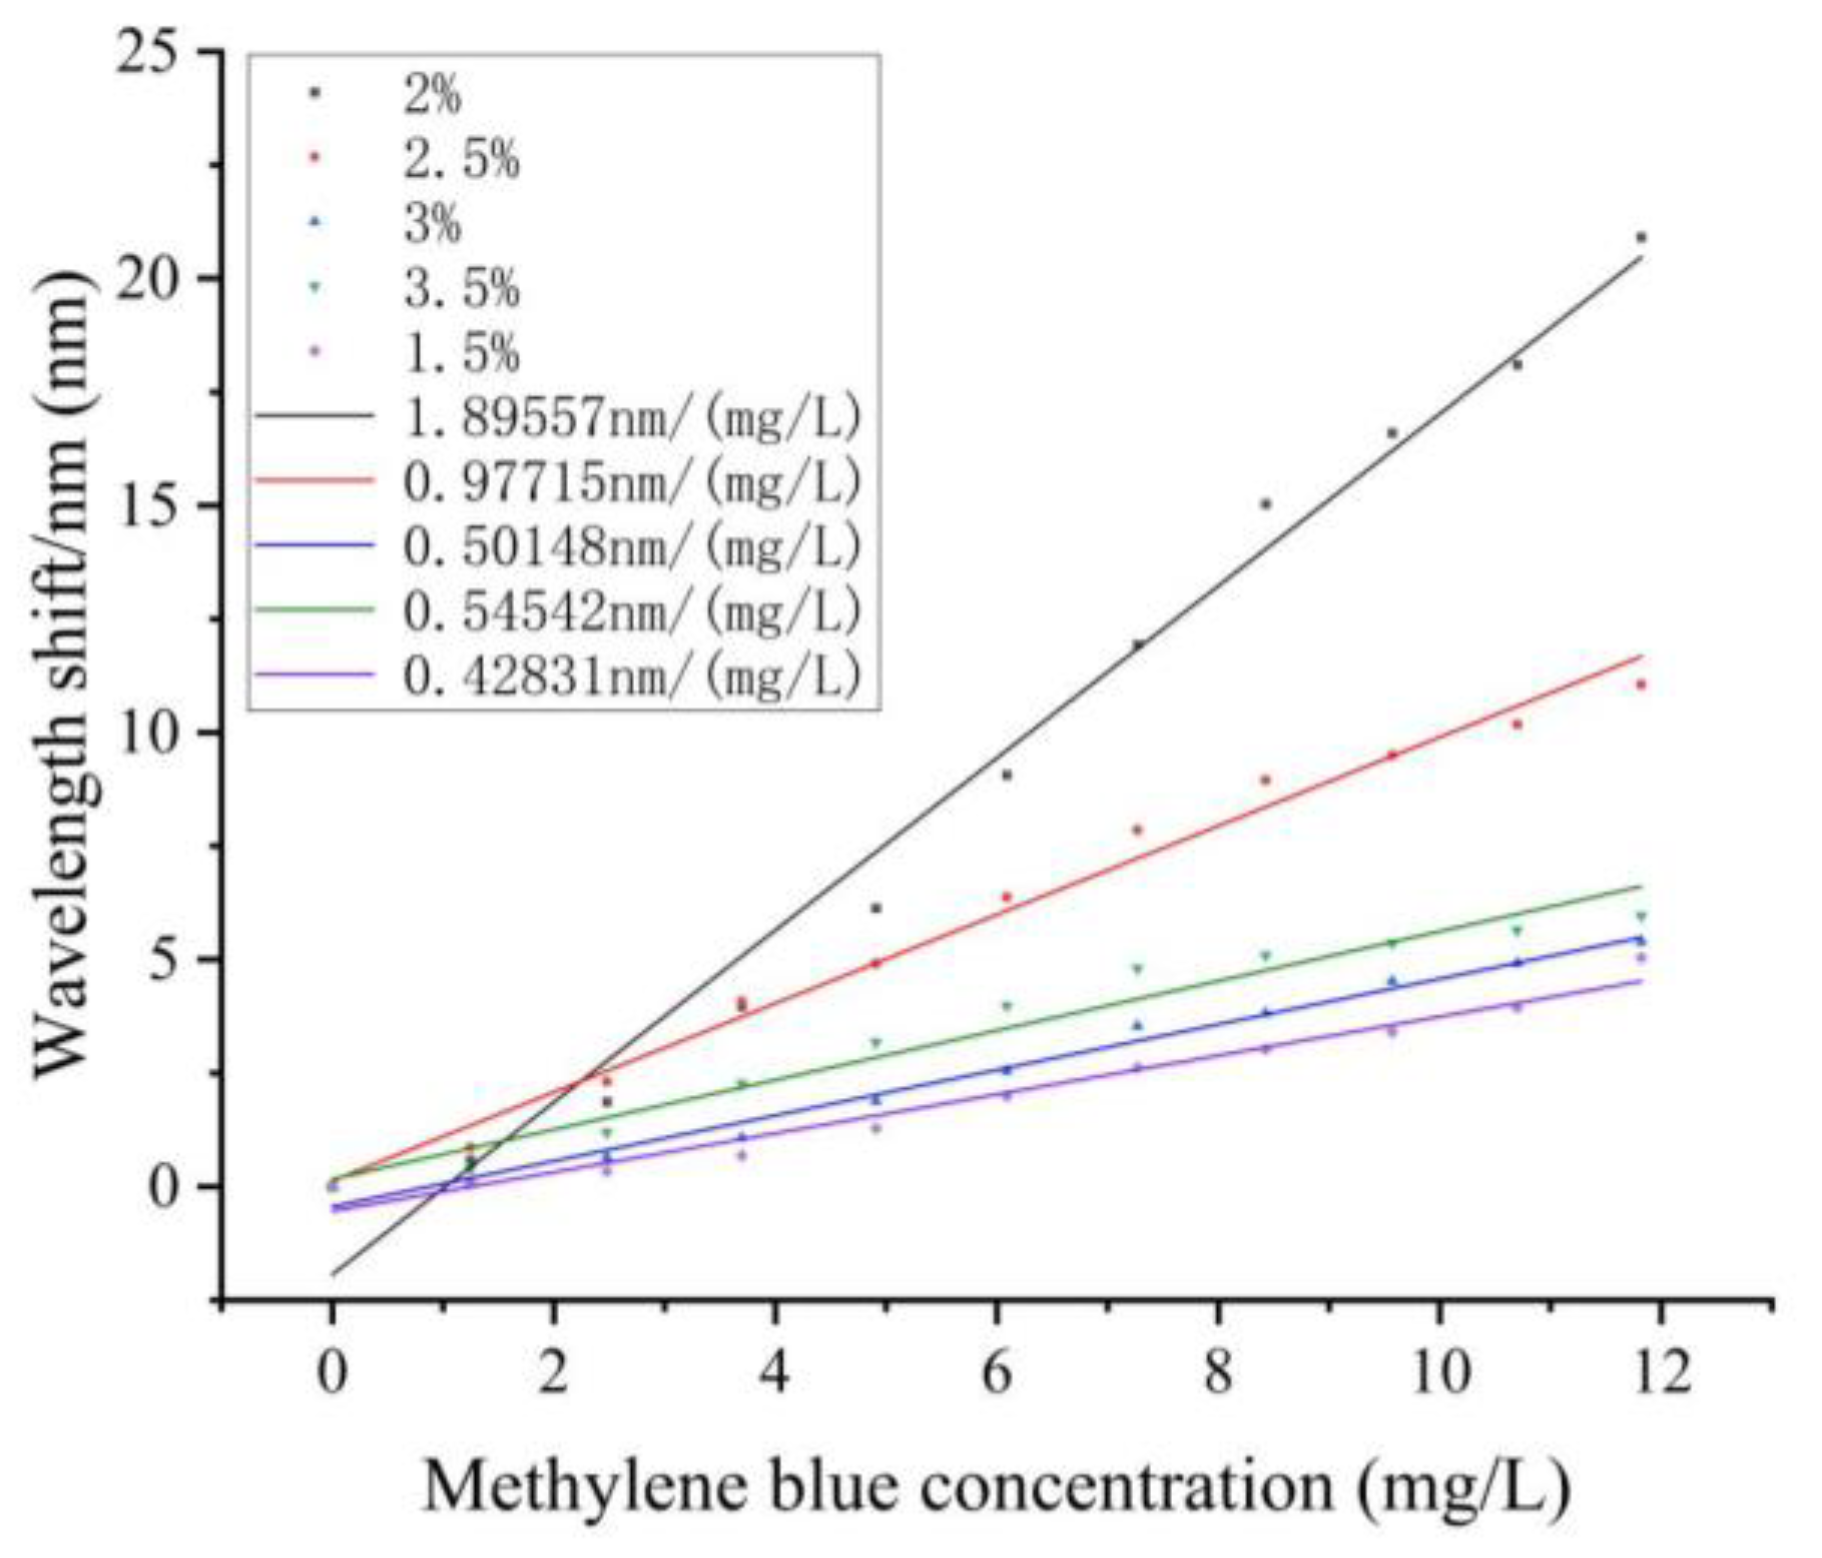
3.2. Sodium Alginate Concentration Influence Investigation
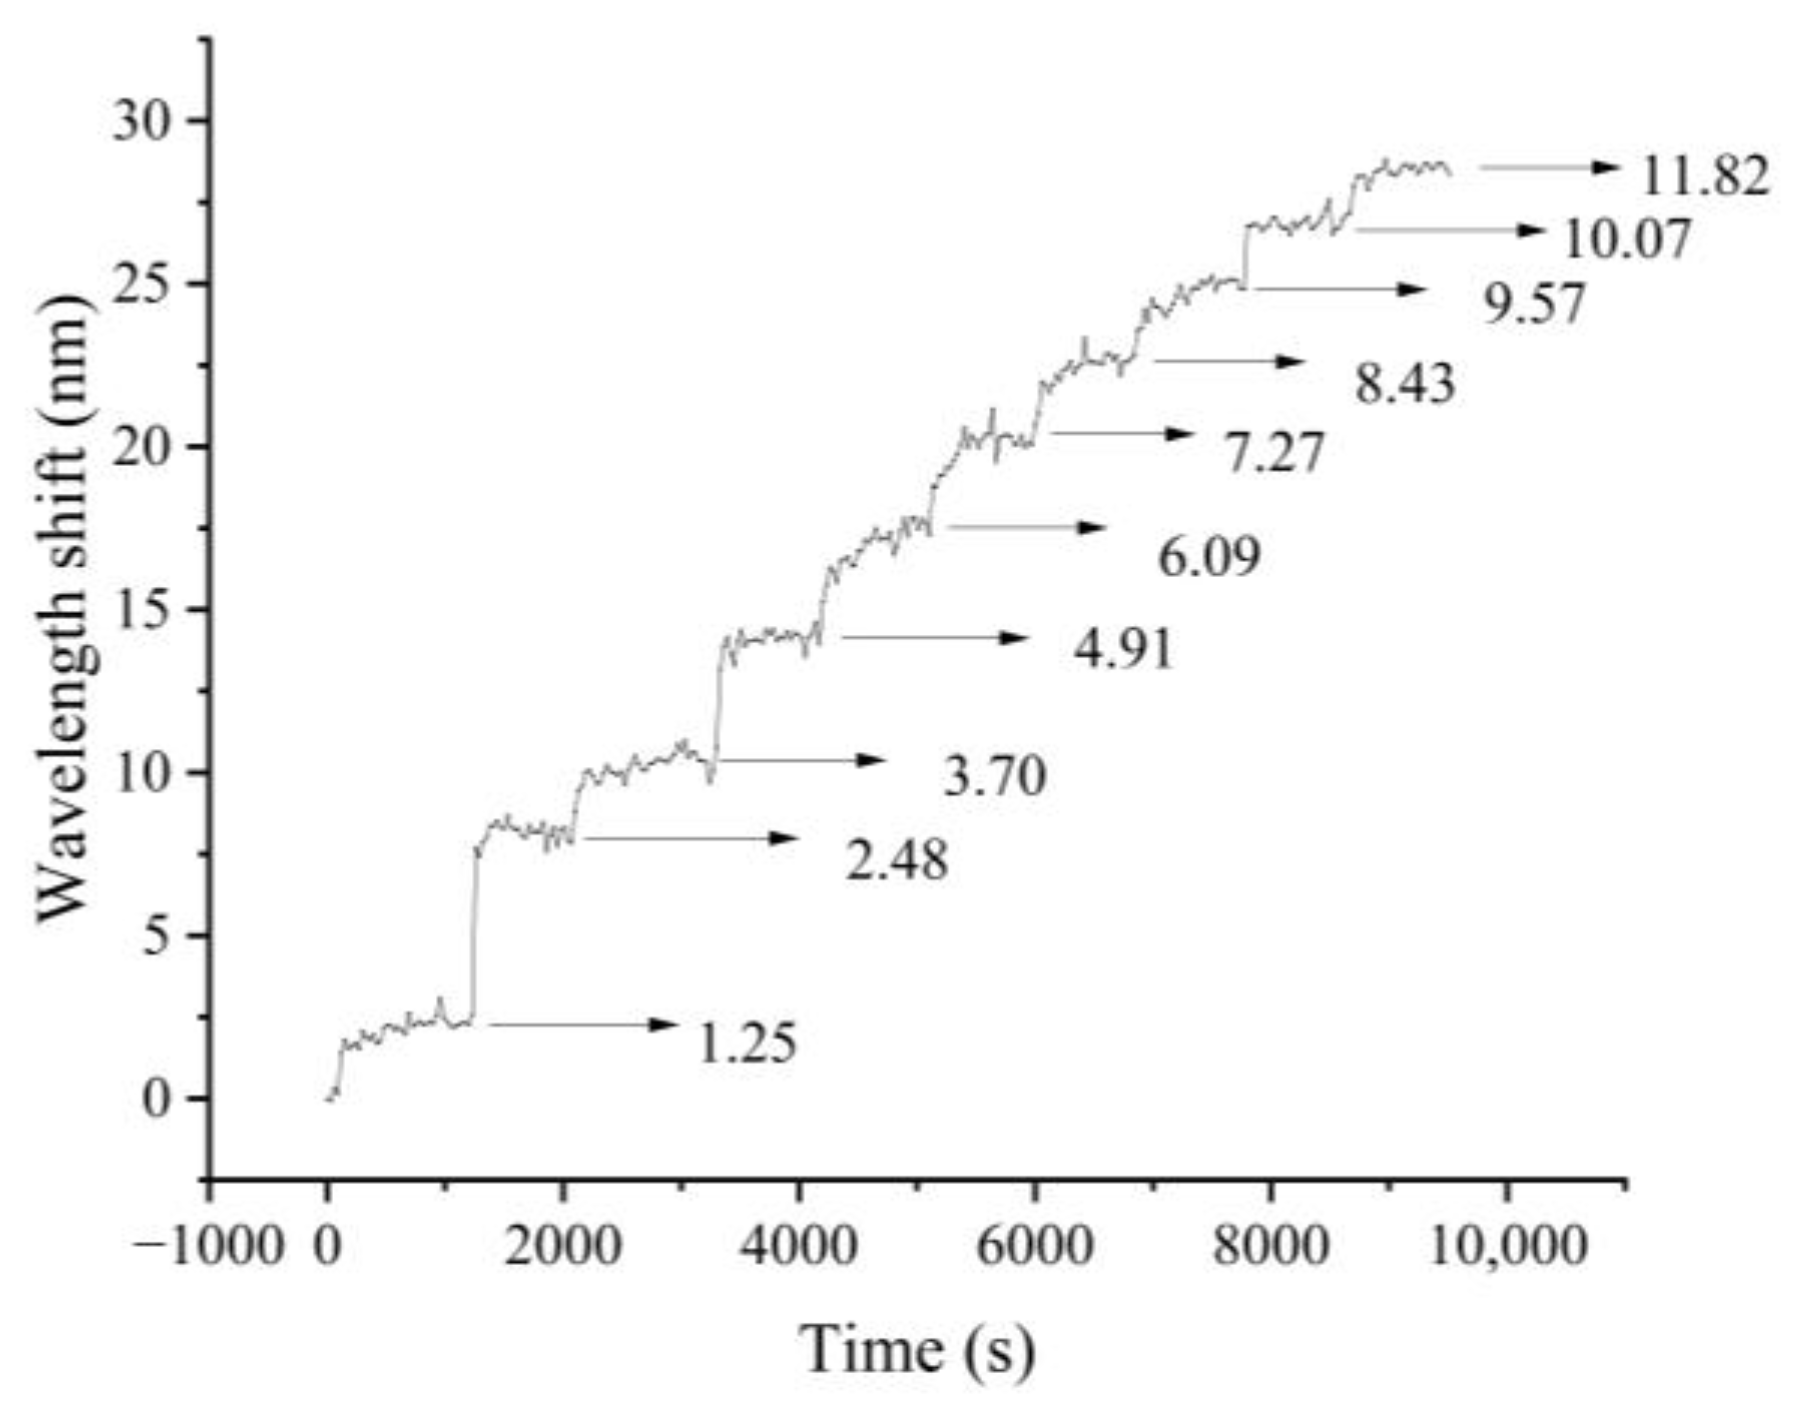
3.3. Dynamic Response
3.4. Comparison with other Methylene Blue Sensors
4. Conclusions
Author Contributions
Funding
Data Availability Statement
Conflicts of Interest
References
- Oladoye, P.O.; Ajiboye, T.O.; Omotola, E.O.; Oyewola, O.J. Methylene Blue Dye: Toxicity and Potential Elimination Technology from Wastewater. Results Eng. 2022, 16, 100678. [Google Scholar] [CrossRef]
- Erdem, A.; Kerman, K.; Meric, B.; Ozsoz, M. Methylene Blue as a Novel Electrochemical Hybridization Indicator. Electroanalysis 2001, 13, 219–223. [Google Scholar] [CrossRef]
- Oz, M.; Lorke, D.E.; Hasan, M.; Petroianu, G.A. Cellular and Molecular Actions of Methylene Blue in the Nervous System. Med. Res. Rev. 2011, 31, 93–117. [Google Scholar] [CrossRef] [PubMed]
- Auerbach, S.S.; Bristol, D.W.; Peckham, J.C.; Travlos, G.S.; Hébert, C.D.; Chhabra, R.S. Toxicity and Carcinogenicity Studies of Methylene Blue Trihydrate in F344N Rats and B6C3F1 Mice. Food Chem. Toxicol. 2010, 48, 169–177. [Google Scholar] [CrossRef]
- Kishor, R.; Purchase, D.; Saratale, G.D.; Saratale, R.G.; Ferreira, L.F.R.; Bilal, M.; Chandra, R.; Bharagava, R.N. Ecotoxicological and Health Concerns of Persistent Coloring Pollutants of Textile Industry Wastewater and Treatment Approaches for Environmental Safety. J. Environ. Chem. Eng. 2021, 9, 105012. [Google Scholar] [CrossRef]
- Rifici, L.M.; Cherry, D.S.; Farris, J.L.; Cairns, J. Acute and Subchronic Toxicity of Methylene Blue to Larval Fathead Minnows (Pimephales Promelas): Implications for Aquatic Toxicity Testing. Environ. Toxicol. Chem. 1996, 15, 1304–1308. [Google Scholar] [CrossRef]
- Khan, I.; Saeed, K.; Zekker, I.; Zhang, B.; Hendi, A.H.; Ahmad, A.; Ahmad, S.; Zada, N.; Ahmad, H.; Shah, L.A.; et al. Review on Methylene Blue: Its Properties, Uses, Toxicity and Photodegradation. Water 2022, 14, 242. [Google Scholar] [CrossRef]
- Kolomaznik, K.; Adamek, M.; Andel, I.; Uhlirova, M. Leather Waste—Potential Threat to Human Health, and a New Technology of Its Treatment. J. Hazard. Mater. 2008, 160, 514–520. [Google Scholar] [CrossRef]
- Xu, T.; Wang, X.; Huang, Y.; Lai, K.; Fan, Y. Rapid Detection of Trace Methylene Blue and Malachite Green in Four Fish Tissues by Ultra-Sensitive Surface-Enhanced Raman Spectroscopy Coated with Gold Nanorods. Food Control 2019, 106, 106720. [Google Scholar] [CrossRef]
- Li, X.; Lin, L.; Chiang, W.H. Microplasma synthesized gold nanoparticles for surface enhanced Raman spectroscopic detection of methylene blue. React. Chem. Eng. 2022, 7, 346–353. [Google Scholar] [CrossRef]
- Zhang, X.; Hui, Y.; Fang, C.; Wang, Y.; Han, F.; Lou, X.; Fodjo, E.K.; Cai, Y.; Kong, C. Determination of Methylene Blue and Its Metabolite Residues in Aquatic Products by High-Performance Liquid Chromatography–Tandem Mass Spectrometry. Molecules 2021, 26, 4975. [Google Scholar] [CrossRef] [PubMed]
- Hayat, M.; Shah, A.; Nisar, J.; Shah, I.; Haleem, A.; Ashiq, M.N. A Novel Electrochemical Sensing Platform for the Sensitive Detection and Degradation Monitoring of Methylene Blue. Catalysts 2022, 12, 306. [Google Scholar] [CrossRef]
- Bahrololoomi, A.; Bilan, H.K.; Podlaha, E.J. Electrodeposited Ni-Fe onto Glassy Carbon for the Detection of Methylene Blue. J. Electrochem. Soc. 2022, 169, 012501. [Google Scholar] [CrossRef]
- Matsuhisa, K.; Ohzeki, K.; Kambara, T. Coagulated Ion-exchanger Colorimetry for the Determination of Trace Amounts of Sulfide as Methylene Blue. Bull. Chem. Soc. Jpn. 1983, 56, 3847–3848. [Google Scholar] [CrossRef]
- Xu, Y.-J.; Tian, X.-H.; Zhang, X.-Z.; Gong, X.-H.; Liu, H.-H.; Zhang, H.-J.; Huang, H.; Zhang, L.-M. Simultaneous Determination of Malachite Green, Crystal Violet, Methylene Blue and the Metabolite Residues in Aquatic Products by Ultra-Performance Liquid Chromatography with Electrospray Ionization Tandem Mass Spectrometry. J. Chromatogr. Sci. 2012, 50, 591–597. [Google Scholar] [CrossRef]
- Kalmár, J.; Lente, G.; Fábián, I. Kinetics and Mechanism of the Adsorption of Methylene Blue from Aqueous Solution on the Surface of a Quartz Cuvette by On-Line UV–Vis Spectrophotometry. Dye. Pigment. 2016, 127, 170–178. [Google Scholar] [CrossRef]
- Ashok, K.E.; Jiann, W.T.; Chang, Y.-H. Ultrasensitive SERS Substrates Based on Au Nanoparticles Photo-Decorated on Cu2O Microspheres for the Detection of Rhodamine B and Methylene Blue. Appl. Surf. Sci. 2022, 585, 152696. [Google Scholar] [CrossRef]
- Zahran, M.; Khalifa, Z.; Zahran, M.A.-H.; Azzem, M.A. Gum Arabic-Capped Silver Nanoparticles for Electrochemical Amplification Sensing of Methylene Blue in River Water. Electrochim. Acta 2021, 394, 139152. [Google Scholar] [CrossRef]
- Okazaki, T.; Orii, T.; Tan, S.-Y.; Watanabe, T.; Taguchi, A.; Rahman, F.A.; Kuramitz, H. Electrochemical Long Period Fiber Grating Sensing for Electroactive Species. Anal. Chem. 2020, 92, 9714–9721. [Google Scholar] [CrossRef]
- Liu, T. Fibre Optic Sensors for Coal Mine Hazard Detection. In Handbook of Optical Fibers; Peng, G.-D., Ed.; Springer: Singapore, 2018; pp. 1–27. [Google Scholar] [CrossRef]
- Nascimento, M.; Ferreira, M.S.; Pinto, J.L. Real Time Thermal Monitoring of Lithium Batteries with Fiber Sensors and Thermocouples: A Comparative Study. Measurement 2017, 111, 260–263. [Google Scholar] [CrossRef]
- Alwis, L.; Sun, T.; Grattan, K.T.V. Optical Fibre-Based Sensor Technology for Humidity and Moisture Measurement: Review of Recent Progress. Measurement 2013, 46, 4052–4074. [Google Scholar] [CrossRef]
- Memon, S.F.; Ali, M.M.; Pembroke, J.T.; Chowdhry, B.S.; Lewis, E. Measurement of Ultralow Level Bioethanol Concentration for Production Using Evanescent Wave Based Optical Fiber Sensor. IEEE Trans. Instrum. Meas. 2018, 67, 780–788. [Google Scholar] [CrossRef]
- Chen, L. Construction and Signal Feature Processing of Gold Nanobiosensors Based on the Internet of Things. J. Healthc. Eng. 2022, 2022, 1432266. [Google Scholar] [CrossRef] [PubMed]
- Cai, S.; Pan, H.; González-Vila, Á. Selective detection of cadmium ions using plasmonic optical fiber gratings functionalized with bacteria. Opt. Express 2020, 28, 19740–19749. [Google Scholar] [CrossRef] [PubMed]
- Coelho, L.; De Almeida, J.M.M.M.; Santos, J.L.; Ferreira, R.A.S.; André, P.S.; Viegas, D. Sensing Structure Based on Surface Plasmon Resonance in Chemically Etched Single Mode Optical Fibres. Plasmonics 2015, 10, 319–327. [Google Scholar] [CrossRef]
- Luo, J.; Yao, J.; Lu, Y.; Ma, W.; Zhuang, X. A Silver Nanoparticle-Modified Evanescent Field Optical Fiber Sensor for Methylene Blue Detection. Sensors 2013, 13, 3986–3997. [Google Scholar] [CrossRef]
- Azil, K.; Ferria, K.; Bouzid, S. Cladless Optical Fiber Sensor Based on Evanescent Wave Absorption for Monitoring Methylene Blue Induced Water Pollution. J. Opt. Soc. Am. B 2020, 37, A253. [Google Scholar] [CrossRef]
- Yin, X.; Wang, N.; Yu, X. Theoretical Analysis and Optimization of Extrinsic Fabry-Perot Interferometer Optical-fiber Humidity-sensor Structures. Curr. Opt. Photon. 2021, 5, 652–659. [Google Scholar] [CrossRef]
- Santos, J.S.; Raimundo, I.M.; Cordeiro, C.M.B.; Biazoli, C.R.; Gouveia, C.A.J.; Jorge, P.A.S. Characterisation of a Nafion Film by Optical Fibre Fabry–Perot Interferometry for Humidity Sensing. Sens. Actuators B Chem. 2014, 196, 99–105. [Google Scholar] [CrossRef]
- Jindrich, K. Polymer chemistry: Swell gels. Nature 2002, 417, 15419–15425. [Google Scholar] [CrossRef]
- Mahinroosta, M.; Jomeh Farsangi, Z.; Allahverdi, A.; Shakoori, Z. Hydrogels as Intelligent Materials: A Brief Review of Synthesis, Properties and Applications. Mater. Today Chem. 2018, 8, 42–55. [Google Scholar] [CrossRef]
- Ma, Y.-X.; Li, X.; Shao, W.-J.; Kou, Y.-L.; Yang, H.-P.; Zhang, D.-J. Fabrication of 3D Porous Polyvinyl Alcohol/Sodium Alginate/Graphene Oxide Spherical Composites for the Adsorption of Methylene Blue. J. Nanosci. Nanotechnol. 2020, 20, 2205–2213. [Google Scholar] [CrossRef] [PubMed]
- Wang, C.; Feng, X.; Shang, S. Lignin/sodium alginate hydrogel for efficient removal of methylene blue. Int. J. Biol. Macromol. 2023, 237, 124200. [Google Scholar] [CrossRef] [PubMed]
- Yu, J.; Wang, Y.; He, Y.; Gao, Y.; Hou, R.; Ma, J.; Zhang, L.; Guo, X.; Chen, L. Calcium Ion-Sodium Alginate Double Cross-Linked Graphene Oxide Nanofiltration Membrane with Enhanced Stability for Efficient Separation of Dyes. Sep. Purif. Technol. 2021, 276, 119348. [Google Scholar] [CrossRef]
- Zhang, C.Y. Preparation and Applications of pH-Sensitive Calcium Alginate Porous Hydrogel Microsphere; Dalian University of Technology: Dalian, China, 2010. [Google Scholar]
- Okazaki, T.; Yoshioka, M.; Orii, T.; Taguchi, A.; Kuramitz, H.; Watanabe, T. Electrochemical Lossy Mode Resonance-based Fiber Optic Sensing for Electroactive Species. Electroanalysis 2023, 35, e202200089. [Google Scholar] [CrossRef]
- Al-Gethami, W.; Al-Qasmi, N.; Ismail, S.H.; Sadek, A.H. QCM-Based MgFe2O4@CaAlg Nanocomposite as a Fast Response Nanosensor for Real-Time Detection of Methylene Blue Dye. Nanomaterials 2022, 13, 97. [Google Scholar] [CrossRef] [PubMed]
- Hu, Y.; Xing, H.; Li, G.; Wu, M. Magnetic Imprinted Polymer-Based Quartz Crystal Microbalance Sensor for Sensitive Label-Free Detection of Methylene Blue in Groundwater. Sensors 2020, 20, 5506. [Google Scholar] [CrossRef]
- Vyas, T.; Gogoi, M.; Joshi, A. Fluorescent-fiber optic device sensor based on Carbon Quantum dots (CQD) thin films for dye detection in water resources. Analyst 2023, 148, 5178–5189. [Google Scholar] [CrossRef]
- Wu, Y.; Deng, X.; Li, F.; Zhuang, X. Less-Mode Optic Fiber Evanescent Wave Absorbing Sensor: Parameter Design for High Sensitivity Liquid Detection. Sens. Actuators B Chem. 2007, 122, 127–133. [Google Scholar] [CrossRef]
- Gravina, R.; Testa, G.; Bernini, R. Perfluorinated Plastic Optical Fiber Tapers for Evanescent Wave Sensing. Sensors 2009, 9, 10423–10433. [Google Scholar] [CrossRef]
- Prabhakar, A.; Mukherji, S. Microfabricated Polymer Chip with Integrated U-Bend Waveguides for Evanescent Field Absorption Based Detection. Lab. Chip 2010, 10, 748. [Google Scholar] [CrossRef] [PubMed]
- Sadrolhosseini, A.R.; Ghasemi, E.; Pirkarimi, A.; Hamidi, S.M.; Taheri Ghahrizjani, R. Highly Sensitive Surface Plasmon Resonance Sensor for Detection of Methylene Blue and Methylene Orange Dyes Using NiCo-Layered Double Hydroxide. Opt. Commun. 2023, 529, 129057. [Google Scholar] [CrossRef]


| Test Number | 1 | 2 | 3 | 4 | 5 | 6 | 7 | 8 | 9 | 10 | 11 |
|---|---|---|---|---|---|---|---|---|---|---|---|
| Methylene blue concentration/(mg/L) | 0 | 1.25 | 2.48 | 3.7 | 4.91 | 6.09 | 7.27 | 8.43 | 9.57 | 10.7 | 11.82 |
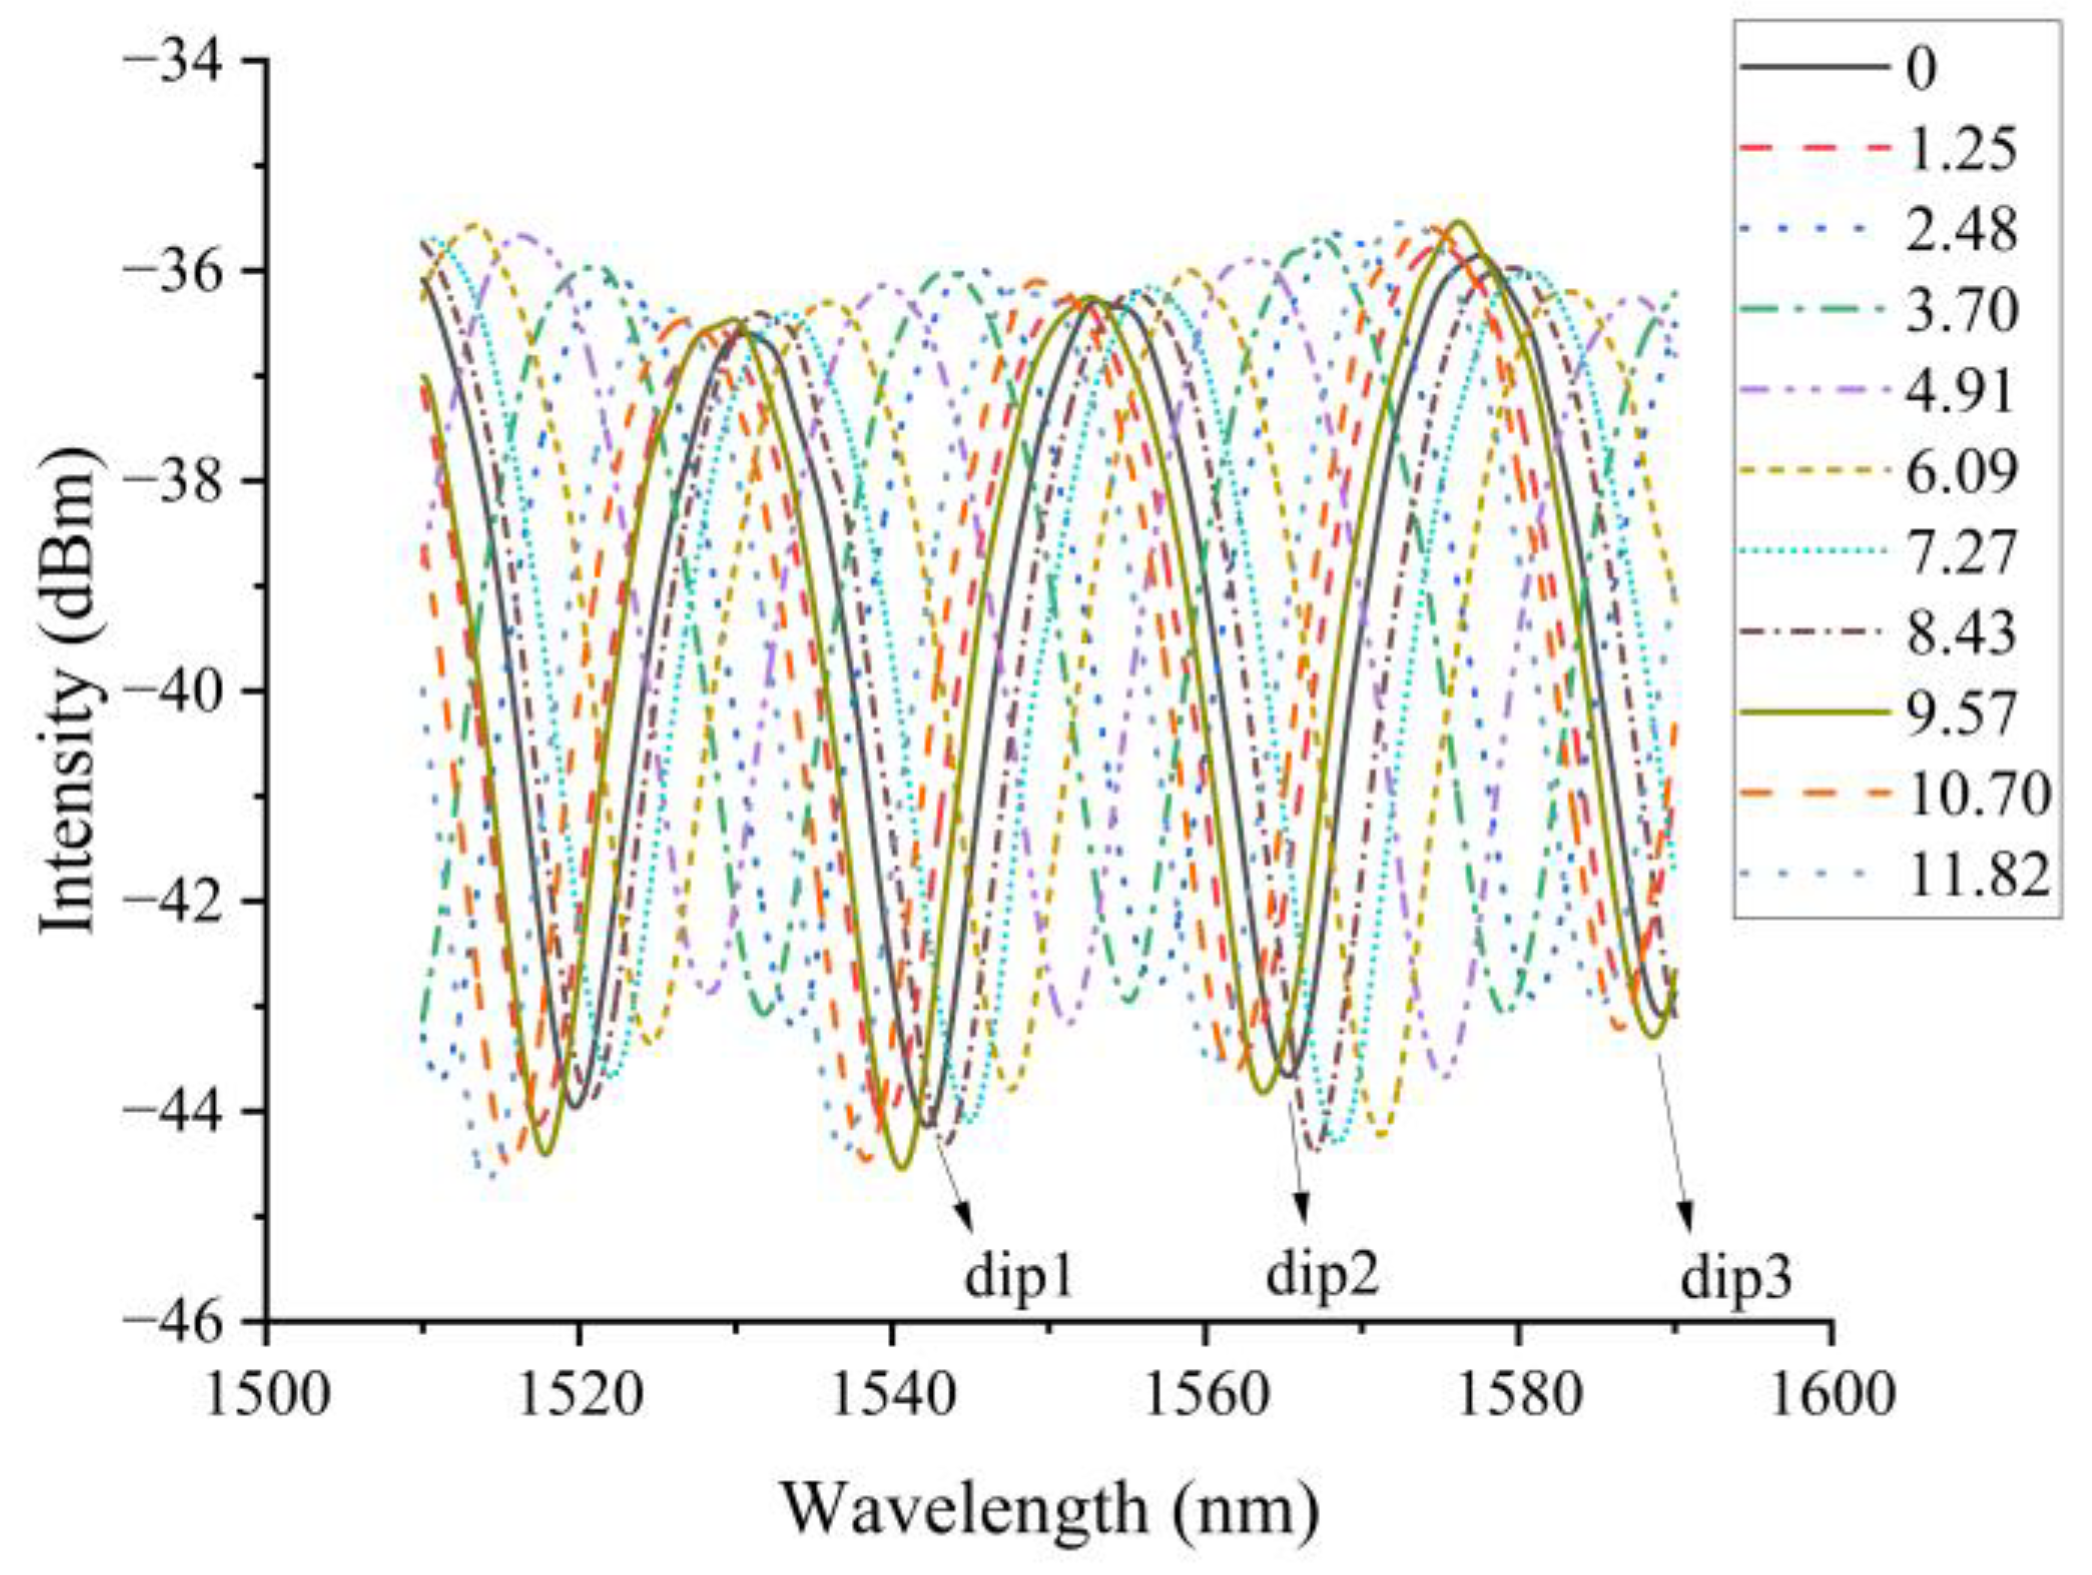
| Methylene Blue Concentration/(mg/L) | dip1/nm | dip2/nm | dip3/nm | dip1-Shift/nm | dip2-Shift/nm | dip3-Shift/nm | Average Wavelength Drift/nm |
|---|---|---|---|---|---|---|---|
| 0 | 1589.09 | 1565.26 | 1542.15 | 0 | 0 | 0 | 0 |
| 1.25 | 1586.81 | 1562.84 | 1539.51 | 2.28 | 2.42 | 2.64 | 2.45 |
| 2.48 | 1580.98 | 1556.83 | 1533.73 | 8.11 | 8.43 | 8.42 | 8.32 |
| 3.7 | 1579.13 | 1555.08 | 1531.81 | 9.96 | 10.18 | 10.34 | 10.16 |
| 4.91 | 1575.27 | 1551.15 | 1528.24 | 13.82 | 14.11 | 13.91 | 13.95 |
| 6.09 | 1571.26 | 1547.61 | 1524.54 | 17.83 | 17.65 | 17.61 | 17.70 |
| 7.27 | 1568.43 | 1544.84 | 1522.03 | 20.66 | 20.42 | 20.12 | 20.40 |
| 8.43 | 1566.97 | 1543.39 | 1520.71 | 22.12 | 21.87 | 21.44 | 21.81 |
| 9.57 | 1563.74 | 1540.61 | 1517.81 | 25.35 | 24.65 | 24.34 | 24.78 |
| 10.7 | 1561.79 | 1538.33 | 1515.52 | 27.3 | 26.93 | 26.63 | 26.95 |
| 11.82 | 1560.44 | 1536.86 | 1514.08 | 28.65 | 28.4 | 28.07 | 28.37 |
| Reference | Type | Fabrication | Sensitive Materials | Concentration Range (mg/L) | Sensitivity | Linearity | Response Time (s) |
|---|---|---|---|---|---|---|---|
| [19] | Electrochemical | Long Period Fiber Grating | Indium Tin Oxide | 0.32–319.85 | \ | Not good (linear/logarithmic processing) | 60 |
| [27] | Evanescent Field | MEMS | Silver Nanoparticle | 0–127.94 | 0.0126 dB/(mg/L) | 0.9496 | \ |
| [28] | Evanescent Field | Cladless optical fiber | \ | 6–10 | 8.75 a.u/(mg/L) | \ | \ |
| [37] | Electrochemical | Lossy mode Resonance (LMR) Fiber | Indium Tin Oxide | 8.08–31.99 | 2.66 (nm/V)/(mg/L) | 0.9714 (slope processing) | \ |
| [38] | Electrochemical | Quartz crystal microbalance | MgFe2 O4 NPs/MgFe2 O4@CaAlg NCs | 100–800 | \ | \ | 300 |
| [39] | Electrochemical | Quartz crystal microbalance with dissipation monitoring | Molecularly Imprinted Polymers | 0.025–0.15 | 1880.9 (ng/cm2)/(μg/L) | 0.9907 | 4000 |
| [40] | Fluorescence spectrum | \ | Carbon Quantum Dots (CQDs) | 3.20–31.99 | 0.0594/(mg/L) | 0.994 | 60 |
| [41] | Evanescent Field | HF etching /Less-mode optic fiber | \ | 0.11–0.79 | \ | \ | \ |
| [42] | Evanescent Field | Optical Fiber Tapers | \ | 0.0016–0.31 | \ | Not good | \ |
| [43] | Evanescent Field | Microfabricated polymer chip with integrated U-bend waveguides | \ | 3.20–6397 | \ | Not good | \ |
| [44] | Surface plasmon resonance | \ | NiCo-Layered Double Hydroxide | 0.005–10 | \ | Not good | 268 |
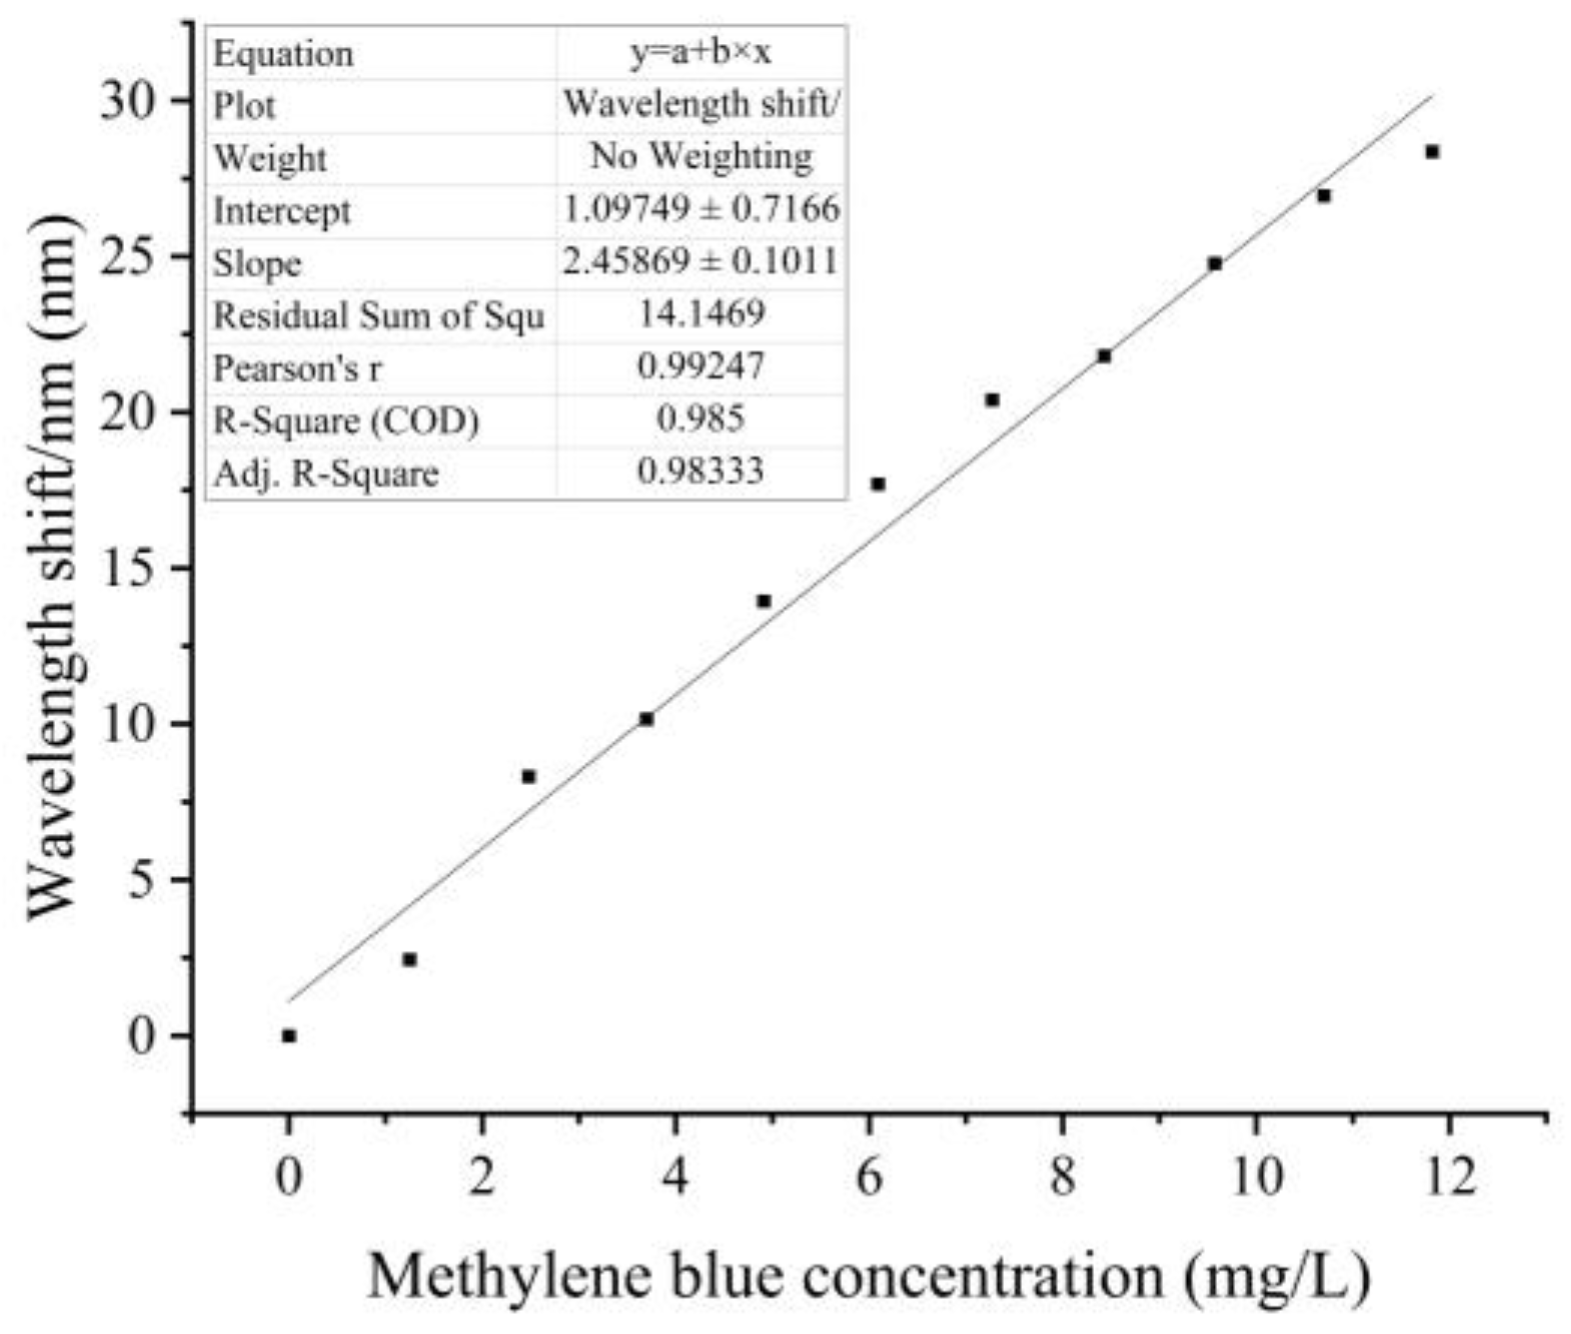
| Our work | Common Fiber | Calcium Alginate Hydrogel | 1.25–11.82 | 2.46 nm/(mg/L) | 0.9824 | 25 |
Disclaimer/Publisher’s Note: The statements, opinions and data contained in all publications are solely those of the individual author(s) and contributor(s) and not of MDPI and/or the editor(s). MDPI and/or the editor(s) disclaim responsibility for any injury to people or property resulting from any ideas, methods, instructions or products referred to in the content. |
© 2023 by the authors. Licensee MDPI, Basel, Switzerland. This article is an open access article distributed under the terms and conditions of the Creative Commons Attribution (CC BY) license (https://creativecommons.org/licenses/by/4.0/).
Share and Cite
Wang, N.; Liu, W.; Liu, S.; Xu, L.; Wang, L.; He, M.; Fang, D. Methylene Blue Optical Fiber Sensor Filled with Calcium Alginate Hydrogel. Photonics 2023, 10, 1251. https://doi.org/10.3390/photonics10111251
Wang N, Liu W, Liu S, Xu L, Wang L, He M, Fang D. Methylene Blue Optical Fiber Sensor Filled with Calcium Alginate Hydrogel. Photonics. 2023; 10(11):1251. https://doi.org/10.3390/photonics10111251
Chicago/Turabian StyleWang, Ning, Wenting Liu, Shiqi Liu, Liang Xu, Longjiao Wang, Ming He, and Dong Fang. 2023. "Methylene Blue Optical Fiber Sensor Filled with Calcium Alginate Hydrogel" Photonics 10, no. 11: 1251. https://doi.org/10.3390/photonics10111251
APA StyleWang, N., Liu, W., Liu, S., Xu, L., Wang, L., He, M., & Fang, D. (2023). Methylene Blue Optical Fiber Sensor Filled with Calcium Alginate Hydrogel. Photonics, 10(11), 1251. https://doi.org/10.3390/photonics10111251