Article

Research on the Detection Method of Projection Stellar Target Simulator

School of Optoelectronic Engineering, Changchun University of Science and Technology, Changchun 130022, China
*
Author to whom correspondence should be addressed.
Photonics 2023, 10(10), 1101; https://doi.org/10.3390/photonics10101101
Submission received: 13 August 2023 / Revised: 23 September 2023 / Accepted: 26 September 2023 / Published: 29 September 2023
(This article belongs to the Special Issue Optical Measurement Systems)

Abstract

:
The projection stellar target simulator is a stellar target simulator in which star points are projected to be imaged on a fixed plane at a fixed distance. Compared with conventional stellar target simulators, the projection stellar target simulator makes star points visible and provides the necessary condition for a semi-physical simulation test of the star camera. In this paper, the projection stellar target simulator optical system with high-quality imaging is designed by combining the projection technology, which breaks the collimated imaging of the conventional stellar target simulator optical system, and offers a new thought to solve the problem of decreasing the calibration accuracy caused by the influence of the coaxiality and other factors in the stellar target simulator calibrating the star camera. Based on the imaging behavior of the star map, this paper proposes a method to realize the automatic detection of a projection stellar target simulator by using CCD and introduces the composition and working principle of the detection system in detail. According to the imaging characteristics of star points, denoising and threshold segmentation of the star map are carried out, and an improved centroid algorithm is proposed to achieve high-precision positioning of the centroid coordinates of the star points. The measurement model and measuring formulas for the angular distance between stars are established. The error sources of the detection system are analyzed and obtain the theoretical error of 9.22″ for this detection system. The result of an actual test experiment shows that the position error of single star is less than 11″, in line with the theoretical analysis of the error, indicating the detection system has high detection precision and meets the requirement for the detection accuracy of the projection stellar target simulator.

1. Introduction

As one of the crucial sectors of modern science and technology, aerospace has a considerable influence on human existence and social development, as well as on enhancing national security and defense capabilities [1,2]. The spacecraft, which is the carrier of space equipment, is required to perform challenging and complicated space missions, such as space rendezvous and docking, deep space exploration, formation flying, and on-orbit assembly [3]. Therefore, achieving precise attitude measurement of the spacecraft is essential to ensuring accurate spacecraft operation and a successful mission.
With the characteristics of high precision and high stability, the star camera is the most advanced and widely used attitude measurement device at present. Calibration is required before the star camera is put into use [4,5]. It is expensive to calibrate directly in space, and outdoor calibration is easily affected by external uncertainties, such as weather, which makes it difficult to obtain the required experimental data. The semi-physical simulation test method can simulate a variety of star backgrounds in the laboratory to provide controlled experimental conditions for star camera calibration. It is an important method for calibrating star cameras.
The stellar target simulator is the core device of the semi-physical simulation test, which is used to simulate the position information of stars in real space. In 2014, Zhou Wei et al. from Northwestern Polytechnical University designed a stellar target simulator optical system with a field of view of 10.6° and an exit pupil distance of 100 mm [6]. In 2018, Zhao Zizhao et al., Jilin Academy of Metrology, designed a high-precision stellar target simulator optical system with a field of view of 16° and distortion less than 0.01% [7]. In 2020, Dai Yu et al. of the Institute of Optoelectronic Technology, Chinese Academy of Sciences, designed a stellar target simulator optical system with an exit pupil distance of 60 mm and a field of view of 28.6° using secondary imaging [8]. In 2021, Zhang Qi et al. of Changchun University of Science and Technology designed a stellar target simulator optical system with an exit pupil distance of 1250 mm and distortion of less than 1%, which was tested for accuracy by using a theodolite [9]. The stellar target simulator optical systems mentioned above are all quasi-direct imaging optical systems; in order to calibrate the star camera, the stellar target simulator and the star camera must be coaxially docked, which places strict requirements on their field of view, energy use, and coaxiality. Therefore, this paper combines projection technology to design a stellar target simulator optical system in which star points are imaged on a fixed plane at a fixed distance, which changes the behavior of collimated imaging of the conventional stellar target simulator optical system. The star camera can complete the calibration by taking the star map, which provides a new idea for the transmission of the star map from the stellar target simulator to the star camera. For the projection, the stellar target simulator projects the star map to a certain distance of the imaging way; using the traditional theodolite detection method to detect the accuracy will make the human eye aiming error increase, resulting in the increased positional error of the star point, thus affecting the detection accuracy. As a result, this paper proposes the accuracy detection of the projection stellar target simulator by the CCD detection method. The accuracy of the detection system is theoretically tested and experimentally confirmed.

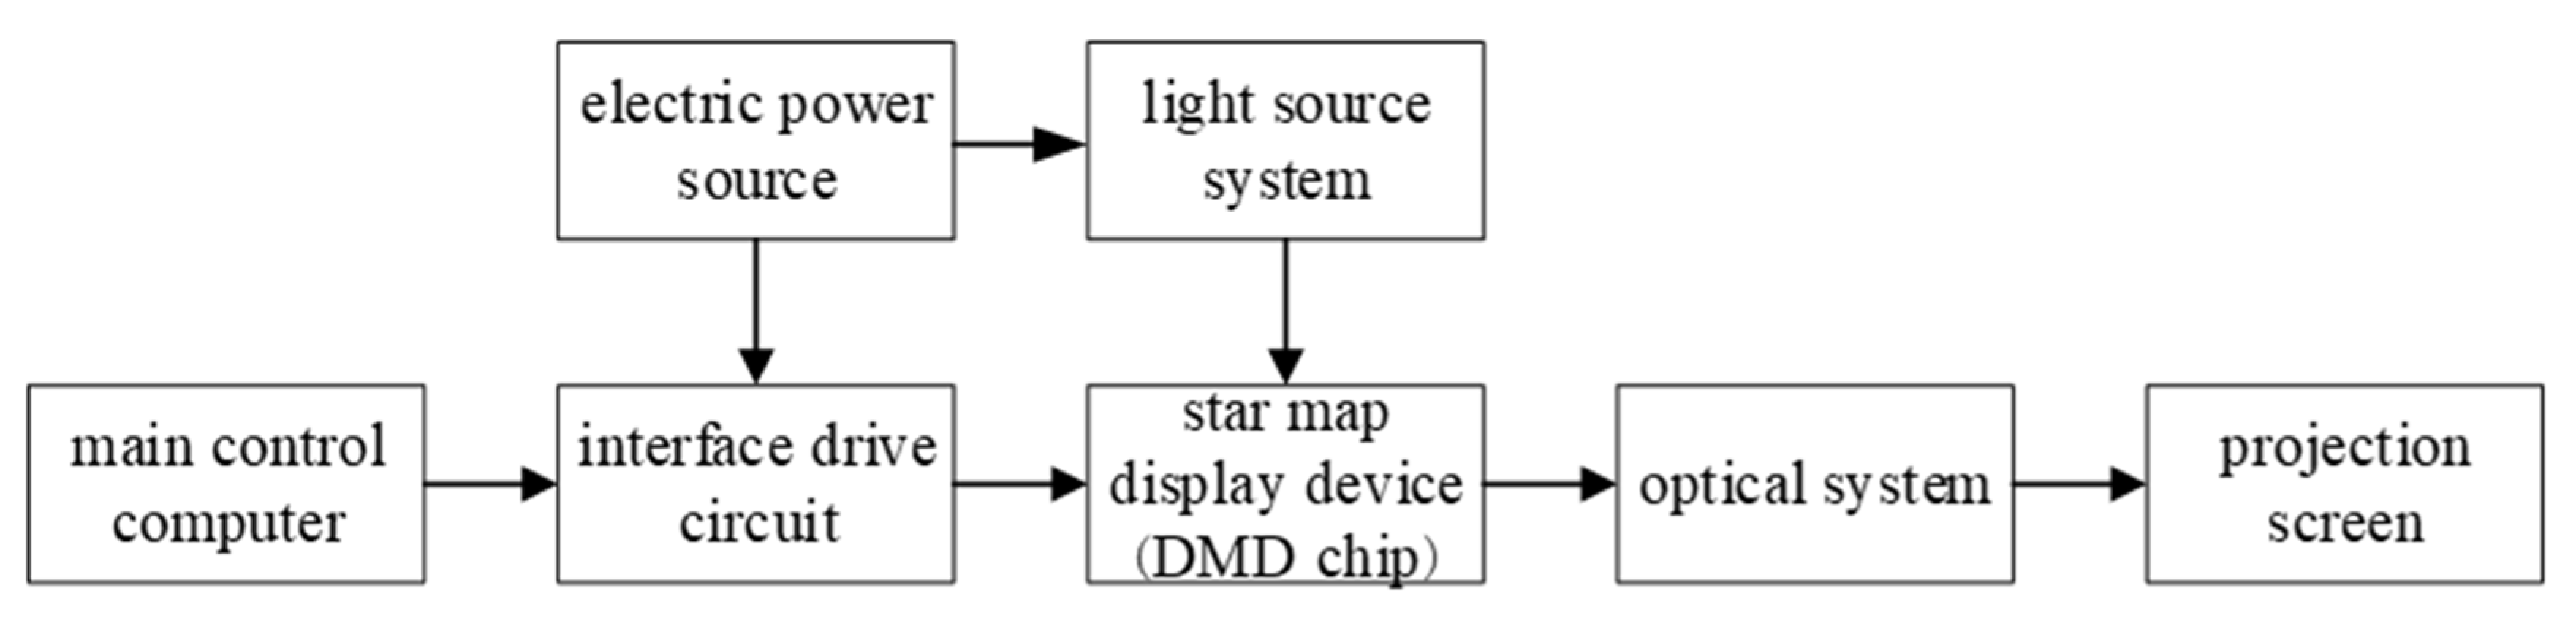
2. Projection Stellar Target Simulator Composition and Working Principle

The projection stellar target simulator is mainly composed of the light source system, star map display device, optical system, and other components. Its working principle is shown in Figure 1. The main control computer is used to search the navigation stars and transforms the coordinates to obtain the corresponding star map data. The interface driver circuit receives the image data signal from the main control computer and passes it to the DMD chip. The light source system provides uniform illumination for the DMD chip, then the optical system receives the light beam modulated by the DMD chip and projects it onto the projection screen to complete the simulation of the star point. The physical image of the projection stellar target simulator is shown in Figure 2.

3. Optical System Design

3.1. Design Indexes of the Optical System
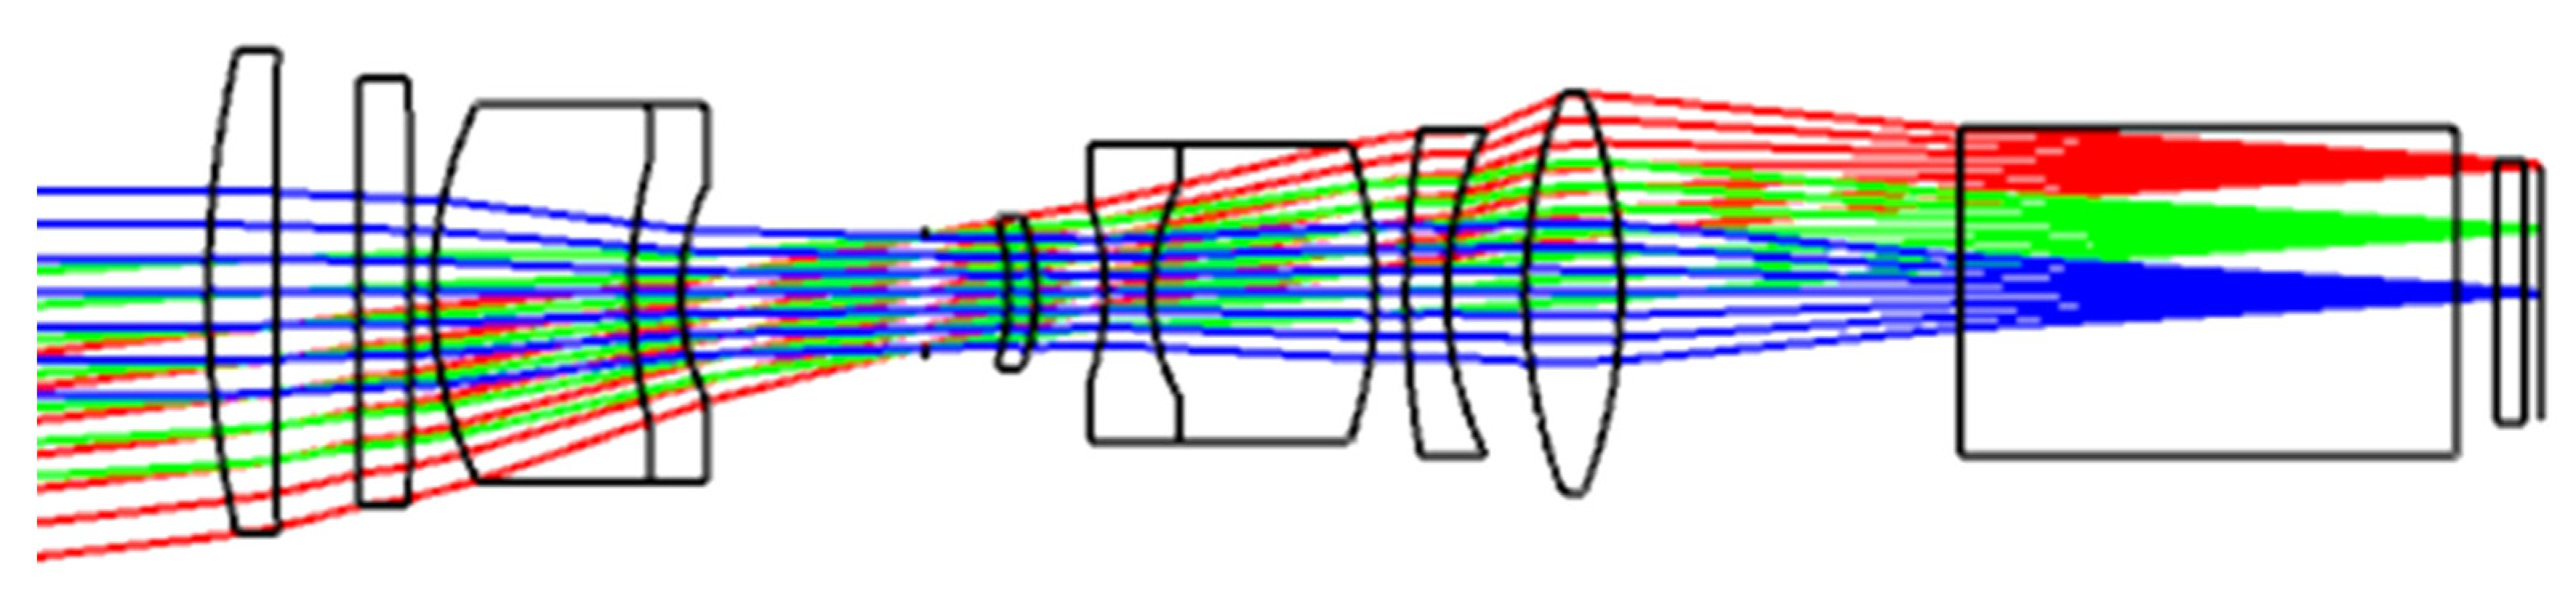
The star map display device selected for the projection stellar target simulator is the DLP6500 DMD chip, with a size of 14.5 mm × 8.2 mm, a resolution of 1920 × 1080, and a pixel size of 7.6 µm. Since the projection stellar target simulator needs to project the star map onto a projection screen of size 1 m × 1 m at 2 m for imaging, the focal length of the optical system can be obtained according to Equation (1).
s z = h l
In Equation (1), s is the size of the display device, z is the focal length of the optical system, h is the screen size, and l is the projection distance. After obtaining the focal length of the optical system, the pupil diameter of the optical system can be obtained by using Equation (2).
D = 2.44 λ z n
In Equation (2), D is the diameter of the pupil, λ is the wavelength, and n is the DMD pixel size. When the optical system is designed with ZEMAX software, in order to simplify the calculation, optimize the design, and make the design result easier to realize and produce, the pupil diameter is usually calculated using the center wavelength of the spectral range of the optical system, so that the pupil diameter is a constant. According to the requirement that the spectral range of the optical system of the projection stellar target simulator is 400–780 nm, this paper chooses to use λ=588 nm as the center wavelength in Equation (2) to calculate the pupil diameter of the optical system. This is because the spectral range of the optical system of the projection stellar target simulator is in the visible spectral range, where the green light with a wavelength of 588 nm has higher energy and better visual perception in the visible spectral range. In addition, choosing 588 nm as the center wavelength for calculating the pupil diameter ensures that the difference in refractive indices of different wavelengths of light is taken into account during the design of the optical system, so as to more accurately estimate the propagation and focusing effects of the light in the optical system to ensure the accuracy and feasibility of the design of the optical system. The focal length and pupil diameter of the optical system can be obtained by substituting the remaining parameters into Equations (1) and (2), respectively. So, the determined optical system design indexes are shown in Table 1.

3.2. Design Result

The optical system is used to image star points on the projection screen. All types of aberrations should be properly controlled throughout the design phase to create an optical system with good image quality in order to guarantee the simulation accuracy of star points. According to the working principle of DMD, it is necessary to use a total reflection prism to realize the transition of the illumination beam and the projection beam, which requires the system to have a long working distance [10,11,12]. The total length of the optimized optical system is 68.5516 mm, the focal length is 32.4994 mm, and the working distance is 27.03 mm. The result of the optimized design for the optical system is shown in Figure 3.

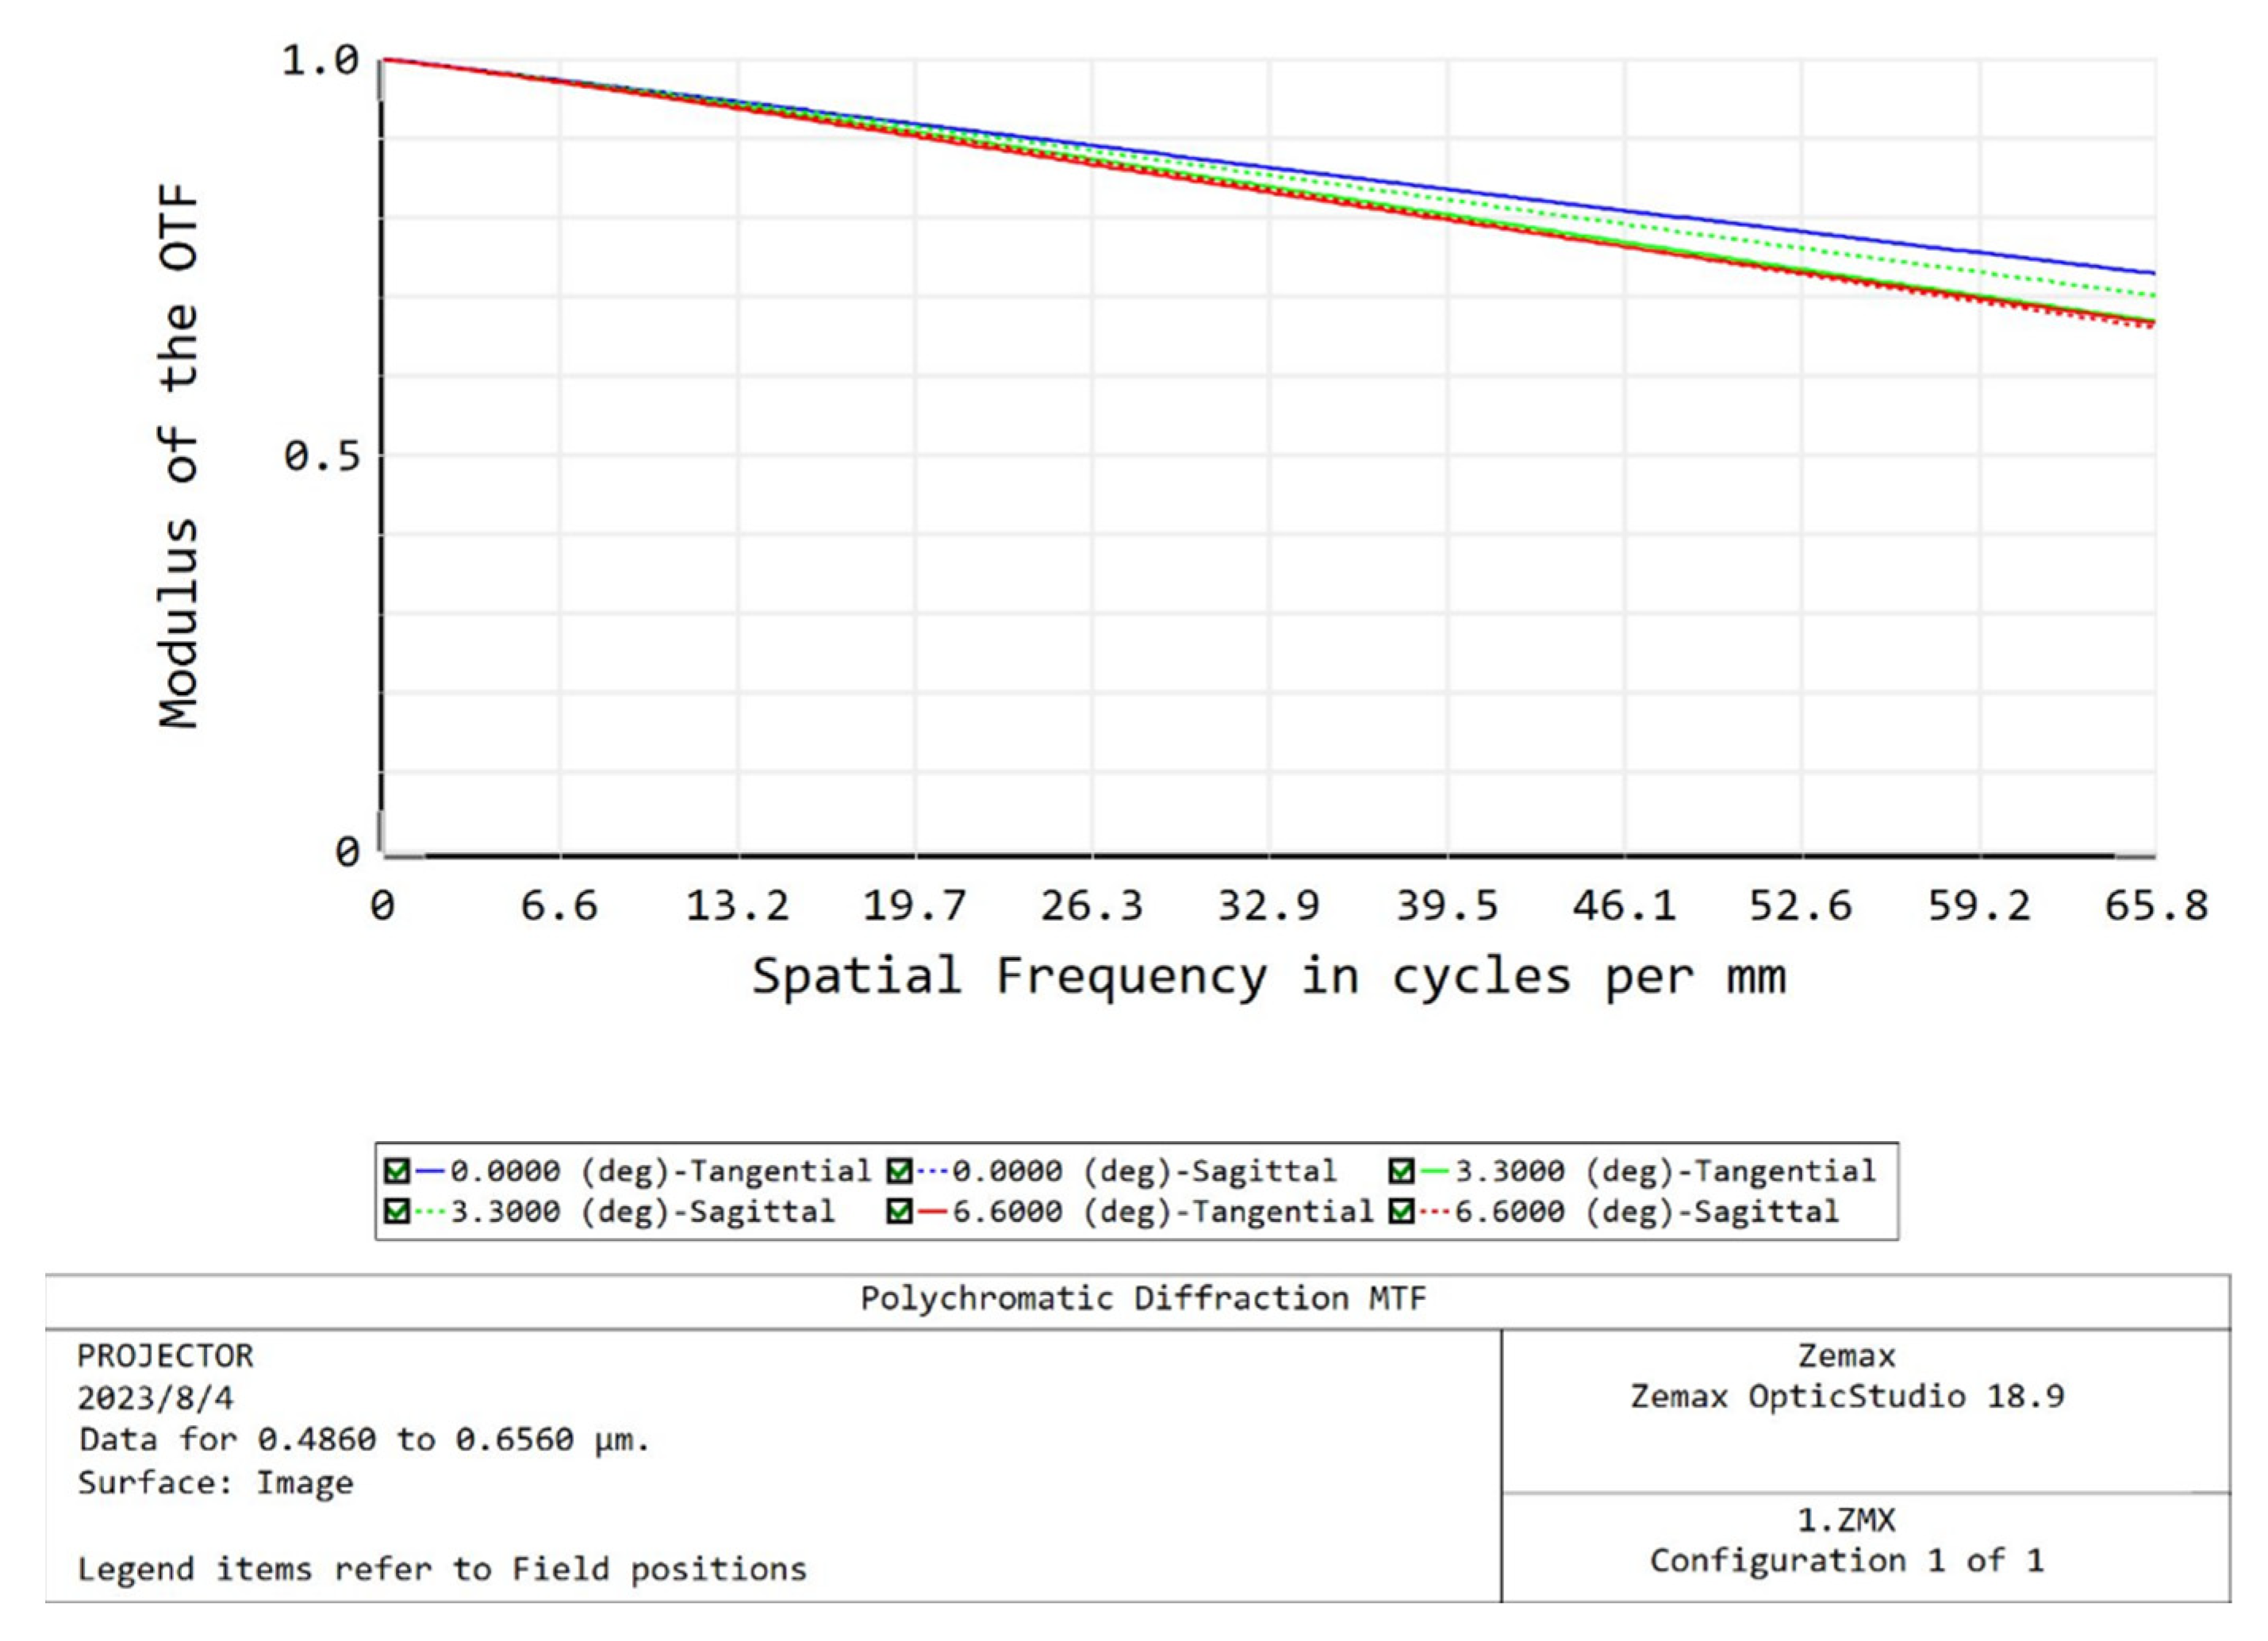
3.3. Image Quality Evaluation of the Optical System

The point sequence diagram shows the image of the object on the image plane after passing through the optical system. The RMS radius of the dispersion spot in the diagram is usually used to judge the image quality of the optical system. It can be seen from Figure 4 that the dispersion spots in each field of view are compact in shape, and the maximum RMS radius is 3.257 μm, which is smaller than the Airy spot radius of 3.79 μm, and it can satisfy the imaging quality requirement of the optical system.
MTF (Optical Modulation Transfer Function) reflects the ability of the optical system to transfer various frequencies of the sinusoidal physical modulation system through the spatial frequency function, which is the most comprehensive evaluation index in the evaluation of image quality. The size of a DMD pixel is 7.6 um, and the Nyquist frequency of the optical system can be calculated by Equation (3).
g = 1 2 n
In the equation, g is the Nyquist frequency, and n is the size of a single DMD pixel. Figure 5 shows that the MTF value of the optical system at the Nyquist frequency of 65.8 lp/mm is around 0.7, and the imaging quality is good.
The distortion of the optical system will change the shape of the star point and distort the image point. At the same time, the field curvature will make the image plane bend and affect the image quality of the optical system. As can be seen in Figure 6, the field curvature is less than 0.1 in the full field of view, and the maximum distortion of the optical system is 0.0316%. These indicate that the optical system has good imaging characteristics with low field curvature and small distortion.
The energy concentration represents the energy distribution within a certain distance from the centroid of dispersion spots. It can be seen from Figure 7 that the energy concentration curves of each field of view are consistent, and the energy concentration is close to 80% within the half-pixel size of DMD. These show that the optical system has a high energy concentration, which makes the image contrast high and meets the characteristic of a high-quality imaging optical system.

4. Star Point Position Detection Method

The angular distance between stars is an important index to evaluate the accuracy of the star position. The level of detection technology used to detect it directly affects the accuracy of the simulated star points of a stellar target simulator. Since the projection stellar target simulator projects the star point to a distance of 2 m for imaging, it will be more difficult for the human eye to aim at the centroid of the star point when using the theodolite for accuracy detection, which will lead to an increase in the aiming error, thus affecting the detection accuracy. As a result, the CCD detection method is proposed to detect the accuracy of the projection stellar target simulator.

4.1. Composition and Working Principle of the Detection System

The CCD detection system consists of an optical lens, a CCD sensor, and a data processing system. The optical lens receives the star map displayed on the projection screen into the detection system, so that star points are imaged on the CCD photoelectric sensor located at the focal plane. The CCD photoelectric sensor converts optical signals with star information into electrical signals, A/D transformation, and export of the digital image. Finally, the data processing system handles the image to obtain the position information of the star points, in turn determining the angular distance between the stars.

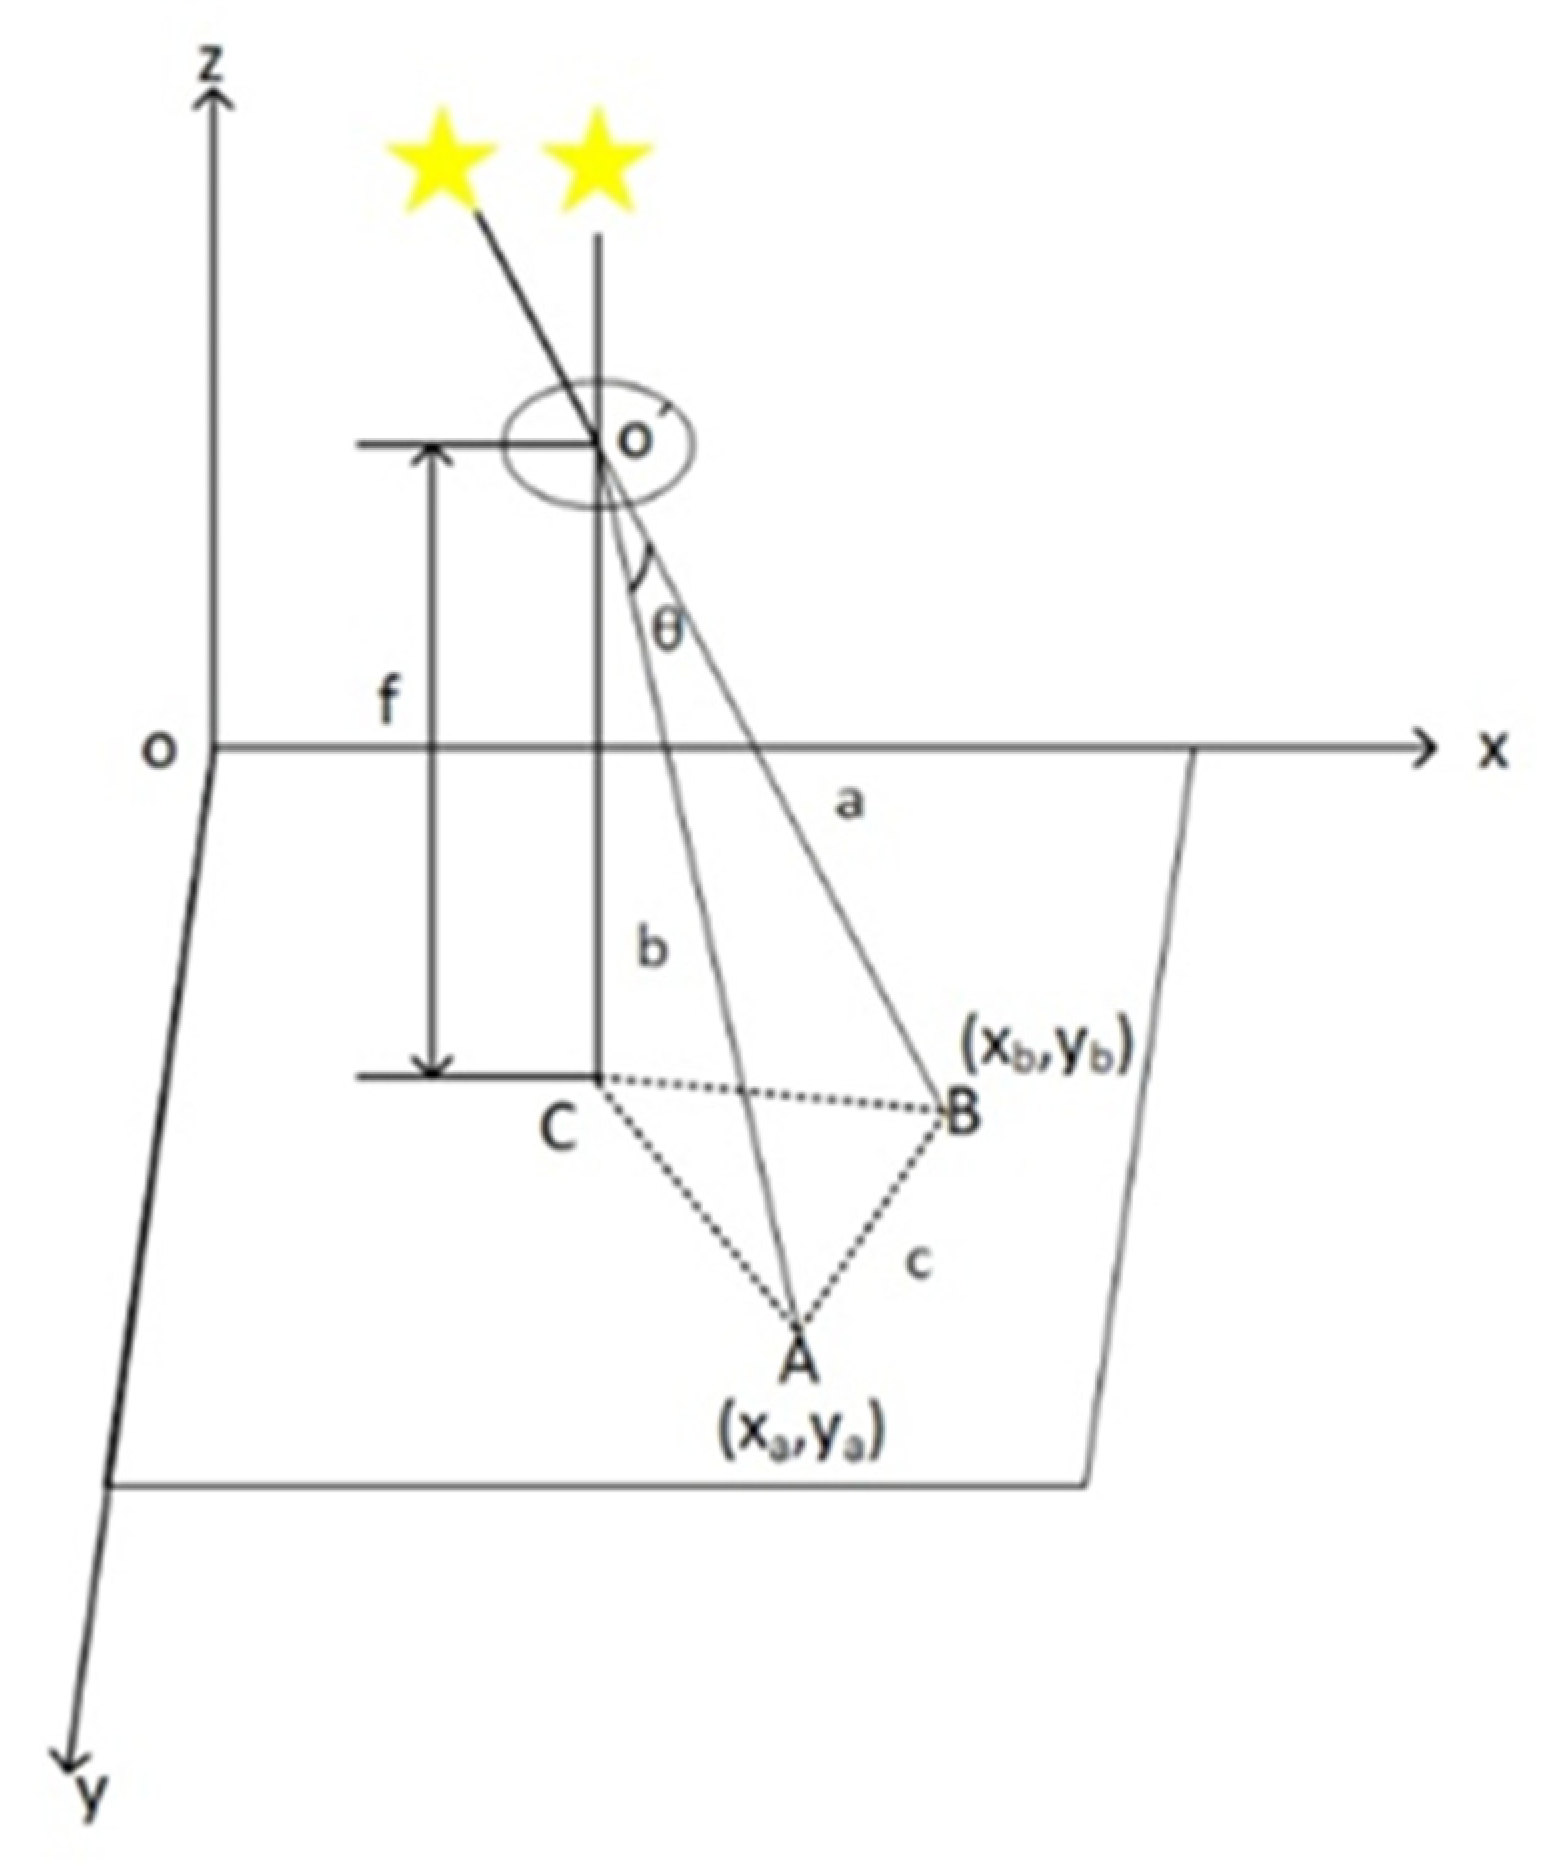
4.2. Measurement Model of Angular Distance between Stars

Figure 8 shows the measurement model of the angular distance between stars. The lens center point O’ is projected onto the CCD plane center point C (xc, yc), in which the distance between it and the CCD plane is the focal length f of the optical lens. The angular distance θ between any two star points A (xa, ya) and B (xb, yb) can be obtained by the cosine theorem, using the CCD pixel size d and focal length f. The specific equations are shown in Equations (4)–(7). It can be seen from the equations that the accuracy of the centroid coordinates for star points is directly related to the accuracy of the angular distance between stars.
a = d x b x c 2 + y b y c 2 2 + f 2
b = d ( x a x c ) 2 + ( y a y c ) 2 2 + f 2
c = d x a x b 2 + y a y b 2
θ = a r c c o s a 2 + b 2 c 2 2 a b

4.3. Accuracy Testing Experiment

According to the requirements of the technical index of the projection stellar target simulator, a CCD sensor of model Sony ICX814 and an optical lens of model HN-P502-425M-C1.2/1 are selected to form a CCD camera. An accuracy detection platform consisting of a master computer, a projection stellar target simulator, and a CCD camera is built, as shown in Figure 9. Where the stellar target simulator is made to display a static star map, with star points having gray values of different sizes, the CCD camera and the projection stellar target simulator are both placed at a working distance of 2 m from the projection screen. The star map simulated by the projection stellar star target simulator is captured using the CCD camera, and the star map obtained by the CCD camera is shown in Figure 10.
As can be seen in Figure 10, for the faint star points simulated by the projection stellar target simulator, the images have low gray levels and few pixels, which are easily annihilated by the background and noise of the star map. According to Equations (4)–(7), it is known that the centroid coordinates of the star points are the basis for measuring the distance between the stars, and the accuracy of coordinates will be directly related to the accuracy of the angular distance between the stars. If the accuracy of centroid coordinates of star points is low, then the calculated angular distance between stars will have a large error. Higher precision of centroid coordinates of star points can improve the accuracy of the angular distance between stars. Therefore, the star map has to be processed to improve the signal-to-noise ratio of the image in order to recognize the star point target from the star map and obtain the centroid coordinate of the star point.
Due to the influence of the sensor material properties, working environment, electronic components, and circuit structure in the process of image acquisition by CCD, various noises will be introduced to pollute the image [13,14]. In this paper, a wavelet thresholding denoising method has been used to process the star map. Sym4 wavelet has good time and frequency localization characteristics, so Sym4 wavelet is selected for two-layer wavelet decomposition of the star map to obtain wavelet coefficients in various scales and directions. The soft threshold is used for threshold processing of wavelet coefficients. Finally, the processed wavelet coefficients are inverted to obtain the denoised image. The multi-scale analysis ability of the wavelet transform is used to separate the image noise from the signal, and the threshold processing is used to suppress the noise to better retain the detailed information of the star map and effectively reduce the influence of noise [15,16,17]. The star map after noise removal is shown in Figure 11.
The denoised star map needs threshold segmentation to distinguish the star region from the background region, to facilitate the location of the star centroid [18,19]. The determination of a threshold value is very important for image segmentation. If the threshold is too low, the background interference cannot be eliminated, and the accuracy of the star location will be affected. If the threshold is too large, it is easy to remove the darker star as the background. This paper uses a weighted iterative threshold algorithm to calculate the threshold, which not only effectively segments the background of the star map, but also has a short processing time [20]. The star map after threshold segmentation is shown in Figure 12.
According to the imaging characteristics of star points, the pixel interpolation subdivision algorithm can be used to extract the centroid coordinates for star points to achieve sub-pixel accuracy. The pixel interpolation subdivision algorithms mainly include the centroid algorithm and the surface fitting algorithm [21,22]. The centroid algorithm uses the gray value of the star point to obtain the coordinate of the centroid for the star point, which has the advantage of being simple and flexible, so it is often used to locate the centroid for the star point [23]. According to the analysis, the star map is composed of three parts: star point target, star map background, and noise signal, so the gray distribution of the star map can be expressed by Equation (8).
f i , j = a i , j + b i , j + c i , j
In Equation (8), f(i, j) is the gray value at the pixel point (i, j), a(i, j) is the gray value of the brightness of the star point at the pixel point (i, j), b(i, j) is the background gray value at the pixel point (i, j), and c(i, j) is the background signal at the pixel point (i, j). Therefore, to accurately obtain the gray value of the star point, we should remove the influence of the background and noise on the star point; this paper proposes an improved centroid algorithm for the extraction of the centroid coordinate for the star point. Since the specific distribution of the noise is unknown, a wavelet threshold related to the noise distribution is used to replace the noise distribution, and the threshold obtained by the weighted iterative threshold is used for background segmentation. The original image is subtracted from the noise threshold and the background threshold; then, the gray value of the star point is squared; and, finally, the centroid coordinates for star points are carried out, and the specific expression is shown in Equation (9). The method reduces the interference of noise and the background on the gray value of the star point and weights the gray value of the star point to strengthen the influence of pixels with the large gray value that is close to the centroid for the star point on the central position, which not only improves the centroid positioning accuracy of the star point, but also has a stronger anti-interference ability.
x m = x = p 1 p 2 y = q 1 q 2 [ f ( x , y ) - T 1 - T 2 ] 2 x x = p 1 p 2 y = q 1 q 2 [ f ( x , y ) - T 1 - T 2 ] 2 y m = x = p 1 p 2 y = q 1 q 2 [ f ( x , y ) - T 1 - T 2 ] 2 y x = p 1 p 2 y = q 1 q 2 [ f ( x , y ) - T 1 - T 2 ] 2
In Equation (9), (xm, ym) is the centroid coordinate of the star point, the star point is distributed in a rectangular window, the coordinate of the upper-left corner of the window is (p1, q1), the coordinate of the lower-right corner of the window is (p2, q2), the gray value of each pixel point is f(i, j), the noise threshold is T1, and the background threshold is T2.

4.4. Accuracy Analysis of Detection System

During the assembly process of the detection system, an optical lens focal length deviation and CCD plane deviation will occur during the assembly of the system components, resulting in assembly errors [24,25]. These errors will cause the centroid position of the actual star image point not to coincide with the centroid position of the ideal star image point, thus introducing the angular error to affect the detection accuracy. In this paper, the transformation process of the ideal star centroid A to the measured star centroid A2 is analyzed after the focal length deviation of the optical lens and the plane deviation of CCD.
In the actual assembly of the system, it is not guaranteed that the CCD sensor is precisely installed at the focal plane of the optical lens, and the change of the sensor plane position will directly lead to the change of the focal length. According to Figure 13a, due to the effect of the lens focal length deviation, the plane position of the sensor is defocused, and the defocus amount is Δf. The defocus sensor plane position is parallel to the ideal plane position, with the focal length f + Δf. The ideal star point centroid coordinate A(x, y) is imaged on A1(x1, y1) at plane II. The A1 coordinate expression obtained from the geometric relationship in the figure is shown in Equation (10).
x 1 = x x c 2 + y c 2 + ( 1 + Δ f f ) 2 x - x c 2 + y - y c 2 x 2 + y 2 y 1 = y x c 2 + y c 2 + ( 1 + Δ f f ) 2 x - x c 2 + y - y c 2 x 2 + y 2
In addition, the actual mounting of the sensor device will have an angle of rotation from the ideal mounting method, causing the CCD plane to deviate, as shown in Figure 13b. If the CCD defocusing plane II is rotated around the y-axis by an angle of α to obtain the new defocusing plane III, the star point A1 is also rotated by an angle of α with respect to the coordinate system, and finally, the star point is imaged as the coordinate point A2(x2, y2) on the plane III, with the coordinate expression shown in Equation (11).
x 2 = c o s α x x c 2 + y c 2 + ( 1 + Δ f f ) 2 x - x c 2 + y - y c 2 x 2 + y 2 sin α y x c 2 + y c 2 + ( 1 + Δ f f ) 2 x - x c 2 + y - y c 2 x 2 + y 2 y 2 = sin α x x c 2 + y c 2 + ( 1 + Δ f f ) 2 x - x c 2 + y - y c 2 x 2 + y 2 + c o s α y x c 2 + y c 2 + ( 1 + Δ f f ) 2 x - x c 2 + y - y c 2 x 2 + y 2
The theoretical estimated coordinate (x, y) of the star point can be obtained from the actual coordinate (x2, y2) of the centroid at the star point using Equation (10). According to the selected CCD camera, the system accuracy error δ1 generated by its assembly is less than 9″. After the denoising, threshold segmentation, and pixel interpolation subdivision algorithm for star coordinates extraction, the position accuracy of the star image point can reach 1/10 pixel when the star map has a high signal-to-noise ratio and the size of the star extraction window is reasonable. The corresponding single-star position error δ2 is shown in Equation (12).
δ 2 < 2 × 0.1 × d f
In the equation, d is the CCD pixel size, and f is the focal length of the optical lens. In this experiment, f is 50 mm, and d is 3.69 um, which can be obtained as δ2 < 0.053″. In addition to the above two types of errors, the detection system cannot avoid the environmental error caused by the inconsistency between the measurement condition and the ideal condition during the measurement process. The environmental error δ3 is about 2″ after strict control. By fitting the above error to Equation (13), it is calculated that the theoretical total error of the detection system is 9.22″, which has a high detection accuracy.
δ = δ 1 2 + δ 2 2 + δ 3 2

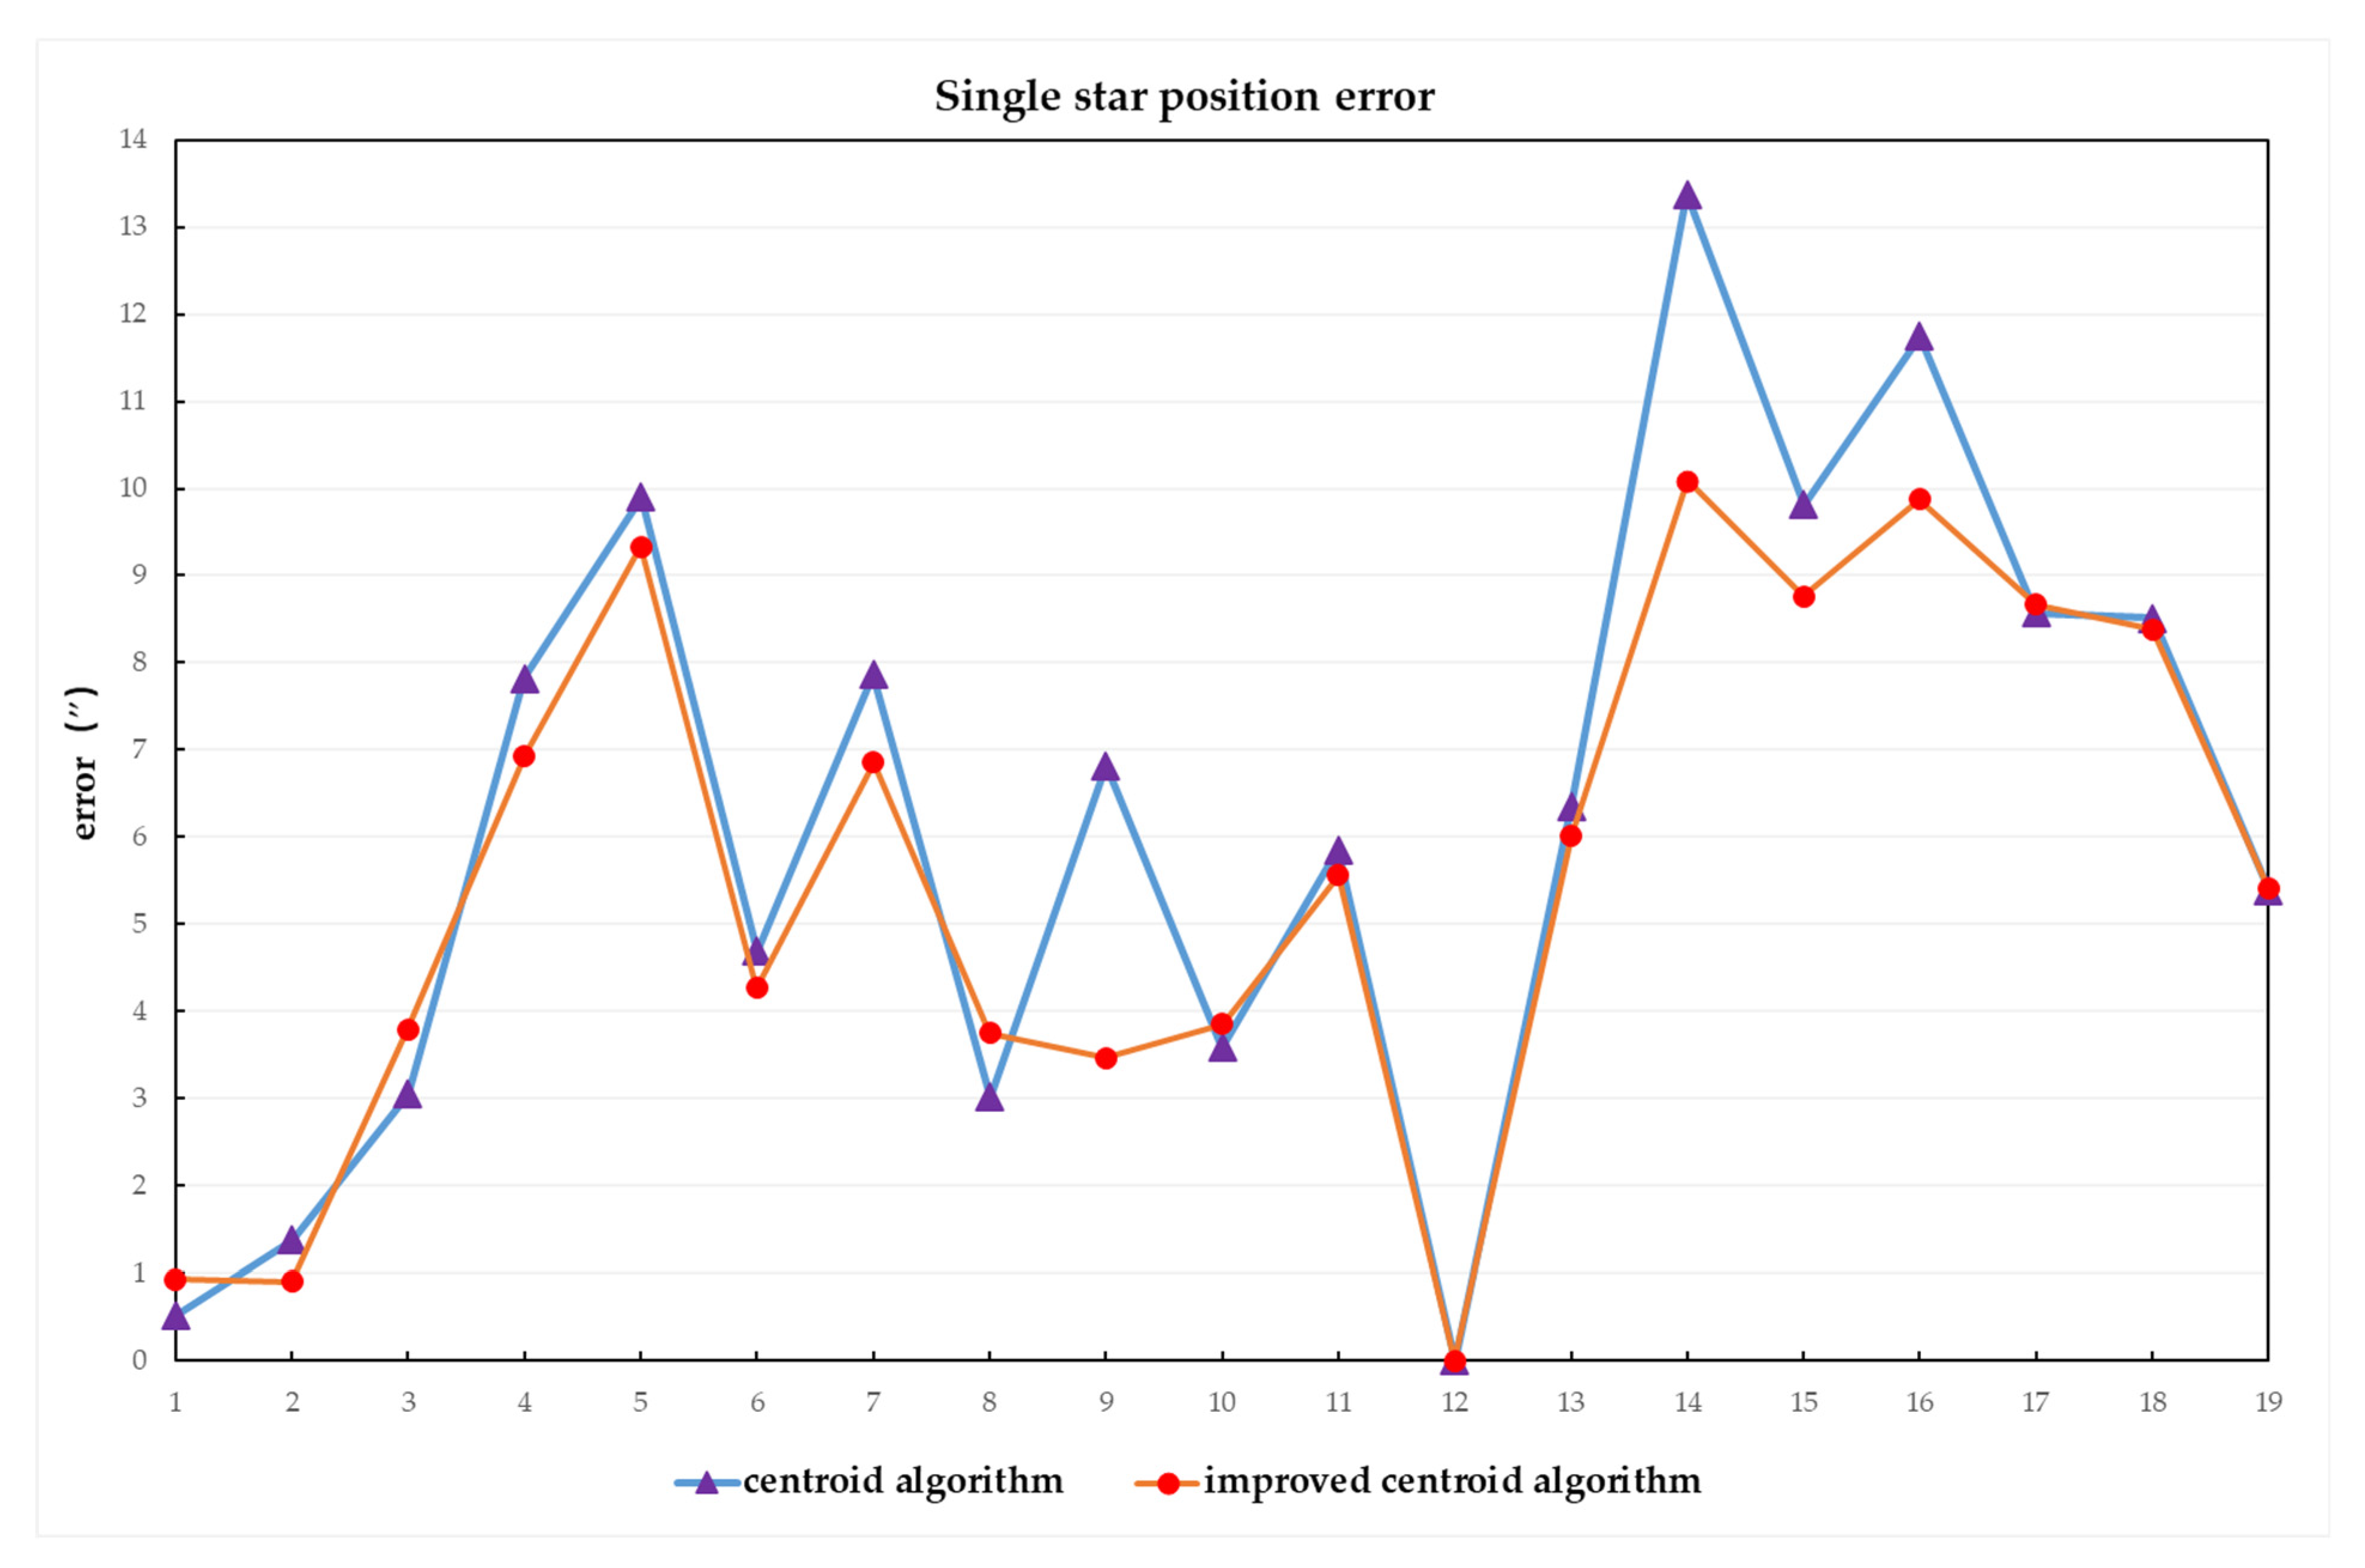
4.5. Experimental Accuracy Testing Result and Analysis

The coordinates of the star points in the threshold segmented star map have been localized using the centroid algorithm and the improved centroid algorithm. The obtained coordinates of the star points are shown in Table 2. The inter-star angular distance between each star point and star point No. 12 is calculated by Equation (7), as shown in Table 3, and the position error of a single star is shown in Figure 14.
From the above tables and picture, it can be seen that the absolute value of the maximum single-star position error of the centroid algorithm is 13.37650732″, and the absolute value of the maximum single-star position error of the improved centroid algorithm is 10.08777133″. The single-star position error is less than 18″, which is required by the projection stellar target simulator. It also demonstrates that the experimental accuracy is compatible with the theoretical accuracy analysis of the system. The centroid algorithm and improved centroid algorithm have achieved sub-pixel precision positioning of star coordinates. Compared with the centroid algorithm, the improved centroid algorithm has higher precision for the centroid coordinate positioning of the star point, so that the system can measure the single-star position with less error and improve detection accuracy.

5. Discussion

This paper combines projection technology to design an optical system that projects the star map onto a fixed plane imaging at a fixed distance, which breaks the conventional collimated imaging method of stellar target simulators and provides a new way of thinking about the star map transmission from the stellar target simulator to the star camera. According to the imaging method of the projection stellar target simulator, the accuracy detection by the CCD detection method is proposed. The detection system can realize the automatic positioning of star points, eliminate the aiming error caused by theodolite in the location of star centroid points, and has the advantage of fast detection speed. The theoretical analysis of the accuracy of the detection system shows that the theoretical error of the detection system is 9.22″, in line with the single-star position error of 10.08777133″ obtained through real experiments, indicating that the detection method has a high detection accuracy.

6. Conclusions

In this paper, a projection stellar target simulator optical system is designed, which is different from the imaging method of the conventional stellar target simulator optical system. The projection stellar target simulator realizes the visual imaging of star points, and the star camera can complete the calibration by taking a star map, which improves the characteristics of the conventional calibration method that requires very high coaxiality of them. The CCD detection method is proposed to detect the accuracy of the projection stellar target simulator, and the detection system and principle are described. The measurement model of the angular distance between stars is established, and the measurement formulas are derived. Through theoretical analysis and experimental verification, the accuracy of the detection system is less than 11″, which meets the index requirement of the projection stellar target simulator.

Author Contributions

Conceptualization, J.K. and R.Z.; methodology, J.K.; software, J.K.; validation, J.K. and R.Z.; formal analysis, G.L. and R.Z.; investigation, J.K.; resources, R.Z.; data curation, J.K. and C.P.; writing—original draft preparation, J.K.; writing—review and editing, L.W. and R.Z.; visualization, J.K.; supervision, R.Z.; project administration, J.K. and R.Z.; funding acquisition, R.Z. All authors have read and agreed to the published version of the manuscript.

Funding

This research was funded by The Project of Jilin Provincial Science and Technology Department, grant number 20210201033GX.

Institutional Review Board Statement

Not applicable.

Informed Consent Statement

Not applicable.

Data Availability Statement

The data in this study can be obtained from the corresponding author.

Conflicts of Interest

The authors declare no conflict of interest.

References

  1. Shuangbo, L.; Xuemei, M.; Liangyuan, H.; Chunxi, Z. Research on the development of space industry capacity of major spacefaring countries. China Aerosp. 2021, 2, 53–57. [Google Scholar]
  2. Hongjun, S.; Jing, M.; Yiweng, L. Analysis of the development of space strategy policy and management in the major spacefaring nations of the world. Aerosp. Ind. Manag. 2019, 8, 37–40. [Google Scholar]
  3. Ionescu, L.; McInnes, C.R.; Ceriotti, M. A multiple-vehicle strategy for near-Earth asteroid capture. Acta Astronaut. 2022, 199, 71–85. [Google Scholar] [CrossRef]
  4. Xia, Q.; Qi, N.; Ye, D.; Guo, Y.; Wang, T. Real-time calibration of space zoom cameras based on fixed stars. IET Comput. Vis. 2017, 11, 342–349. [Google Scholar] [CrossRef]
  5. Ting, S.; Fei, X.; Xiaochu, W.; Zheng, Y.; Daping, C. An accuracy measurement method for star trackers based on direct astronomic observation. Sci. Rep. 2016, 6, 22593. [Google Scholar]
  6. Wei, C.; Zhiyi, L.; Yang, Z.; Yuan, Y. Design of a visible light target simulator system based on a digital micromirror. Electron. Des. Eng. 2014, 22, 50–53. [Google Scholar]
  7. Zichao, Z.; Qimeng, C.; Zibo, T.; Zhe, W. Optical system design of high precision dynamic star simulator. J. Metrol. 2018, 39, 641–644. [Google Scholar]
  8. Yu, D.; Xin, C.; Wenming, Z.; Jie, L.; Shenlin, L. Design of optical system for large field of view long pupil distance star simulator based on DMD. Appl. Opt. 2020, 41, 891–897. [Google Scholar] [CrossRef]
  9. Qi, Z.; Xiping, X.; Yue, P.; Motong, H. Design of projection optical system of dynamic star simulator with long pupil distance. J. Chang. Univ. Sci. Technol. 2021, 44, 13–18. [Google Scholar]
  10. Yungchih, H.; Juiwen, P. High contrast ratio and compact-sized prism for DLP projection system. Opt. Express 2014, 22, 17016–17029. [Google Scholar]
  11. Yang, Q.; Xiping, X.; Tao, L.; Yue, P. Design of a high-numerical-aperture digital micromirror device camera with high dynamic range. Appl. Opt. 2015, 54, 60–70. [Google Scholar]
  12. Zhuo, L.; Da, M.; Shilong, L.; Qiang, Z. Design of long wave infrared zoom projection system based on DMD. Infrared Laser Eng. 2016, 45, 348–353. [Google Scholar]
  13. Irie, K.; Mckinnon, E.A.; Unsworth, K.; Woodhead, I.M. Measurement of digital camera image noise for imaging applications. Sens. Transducers 2008, 90, 185–194. [Google Scholar]
  14. Changcai, H.; Guzhou, S.; Jiming, M.; Xiaoping, O.Y. Noise calibration and characterization of scientific grade CCD camera. Mod. Appl. Phys. 2014, 5, 233–238. [Google Scholar]
  15. Jain, P.; Tyagi, V. A survey of edge-preserving image denoising methods. Inf. Syst. Front. 2016, 18, 159–170. [Google Scholar] [CrossRef]
  16. Silva, R.D.; Minetto, R.; Schwartz, W.R.; Pedrini, H. Adaptive edge-preserving image denoising using wavelet transforms. Pattern Anal. Appl. 2013, 16, 567–580. [Google Scholar] [CrossRef]
  17. Jaiswal, A.; Upadhyay, J.; Somkuwar, A. Image denoising and quality measurements by using filtering and wavelet based techniques. AEUE-Int. J. Electron. Commun. 2014, 68, 699–705. [Google Scholar] [CrossRef]
  18. Vali, M.A.; Mohammad, S.M.; Sadegh, S.; Farshad, S. Improving night sky star image processing algorithm for star sensors. J. Opt. Soc. Am. 2014, 31, 794. [Google Scholar]
  19. Yulei, Y.; Yong, Z. A threshold algorithm for star point extraction of large field of view star maps. Oceanogr. Surv. Mapp. 2011, 31, 41–43. [Google Scholar]
  20. Xu, W.; Li, Q.; Feng, H.; Xu, Z.; Chen, Y. A novel star image thresholding method for effective segmentation and centroid statistics. Opt.-Int. J. Light Electron Opt. 2013, 124, 4673–4677. [Google Scholar] [CrossRef]
  21. Jiangsheng, Z.; Liheng, F.; Lili, G. Research on subpixel localization method of star image. Electron. Des. Eng. 2012, 20, 186–189. [Google Scholar]
  22. Sun, J.; Li, G.R.; Wen, D.S.; Xue, B.; Yang, S.D. A sub-pixel centroid algorithm for star image based on gaussian distribution. Transations Jpn. Soc. Aeronaut. Space Sci. 2011, 53, 307–310. [Google Scholar] [CrossRef]
  23. Ruiming, J.; Xiaolei, M.; Yuncai, H. Research on star point subdivision localization method based on skewed normal distribution. Adv. Lasers Optoelectron. 2016, 53, 140–147. [Google Scholar]
  24. Ming, Y.; Fei, X.; Ting, S.; Hong, W. Research on calibration method of high precision star sensor. J. Instrum. 2017, 38, 2154–2160. [Google Scholar]
  25. Tianjiao, L.; Suning, L.; Sai, L.; Yuan, Y.; Heping, T. Correction model for microlens array assembly error in light field camera. Opt. Express 2016, 24, 24524–24543. [Google Scholar]
Figure 1. Working principle of the projection stellar target simulator.
Photonics 10 01101 g001
Figure 2. The projection stellar target simulator.
Photonics 10 01101 g002
Figure 3. Optical system structure.
Photonics 10 01101 g003
Figure 4. Point sequence diagram.
Photonics 10 01101 g004
Figure 5. MTF curve diagram.
Photonics 10 01101 g005
Figure 6. Field curvature distortion diagram.
Photonics 10 01101 g006
Figure 7. Energy concentration diagram.
Photonics 10 01101 g007
Figure 8. Measurement model of angular distance between stars.
Photonics 10 01101 g008
Figure 9. Accuracy detection platform.
Photonics 10 01101 g009
Figure 10. Star map captured by CCD. (a) Overall map; (b) Detail map.
Photonics 10 01101 g010
Figure 11. Star map after denoising. (a) Overall map; (b) Detail map.
Photonics 10 01101 g011
Figure 12. Star map after threshold segmentation. (a) Overall map; (b) Detail map.
Photonics 10 01101 g012
Figure 13. Actual measurement model of angular distance between stars. (a) Optical lens focal length deviation and star point centroid position; (b) CCD plane deviation and star point centroid position.
Photonics 10 01101 g013
Figure 14. Single-star position error curve.
Photonics 10 01101 g014
Table 1. Optical system design indexes.
DesignationIndex
Field of view13.2°
Focal length32.5 mm
Pupil diameter6.135 mm
Spectral range400–780 nm
Single star position error18″
Table 2. Star point centroid coordinates.
Star Point Serial NumberActual Coordinates of Star PointsCentroid AlgorithmImproved Centroid Algorithm
xyxyxy
1133628261336.19222826.18461336.17292826.2447
2137221351372.10482135.29681372.13692135.3103
3139214961392.13521496.57451392.20851496.6201
414087911408.2231791.466311408.2022791.47477
514691271469.6654127.492111469.6605127.51102
6164024971640.49572497.5091640.46332497.5129
7164817351648.52341734.91271648.60431735.1214
8168411211684.12691121.15551684.05041121.3195
917094471709.252447.435251709.1133447.28922
10187628331876.70752833.81761876.72612833.8483
11189421371894.58322137.43731894.54452137.4647
12190715001907.93851500.03651907.96311500.0846
1319388191938.6922819.487781938.6844819.51332
1419671621967.0791161.929511967.0465161.75751
15241428292414.49332829.52592414.492829.5101
16242615152426.21861515.57982426.23971515.6004
17242721372427.90212137.98272427.9452138.0245
1824438552443.6447855.893042443.677855.9584
1924681702468.2177170.76592468.2244170.80526
Table 3. Angular distance between stars.
Central Star Point Serial NumberOther Star Points
Serial Number
Theoretical Angular Distance (°)Centroid Algorithm (°)Improved Centroid Algorithm (°)
1216.079954856.080098156.080214998
1223.5091262743.5095102933.509378025
1232.1815291912.1806808372.180475046
1243.6664013843.6642273713.664475141
1256.0801999486.0774508146.077606893
1264.3540477664.3553520614.355233855
1271.4814707431.4792862281.479565122
1281.8613212921.8604830771.860278771
1294.5254991164.5236044774.524536413
12105.6172177345.6162201215.616145572
12112.6902305782.6918579912.69177591
1212000
12132.8806962742.8789334322.879022693
12145.6532175245.6495018285.650415366
12155.9795941045.9823207765.982027314
12162.1461125082.1493746522.148856121
12173.4682846573.4706649543.470691687
12183.5346075143.5369716983.536936584
12196.0764267616.0779252356.077931192
Disclaimer/Publisher’s Note: The statements, opinions and data contained in all publications are solely those of the individual author(s) and contributor(s) and not of MDPI and/or the editor(s). MDPI and/or the editor(s) disclaim responsibility for any injury to people or property resulting from any ideas, methods, instructions or products referred to in the content.

