Abstract
Slightly off-axis digital holography is proposed using transmission grating to obtain quantitative phase distribution. The experimental device is based on an improved 4f optical system in which a two-window input plane is used to form the object beam and reference beam. Then, the two beams are diffracted into multiple orders by the transmission grating placed at the Fourier plane. By applying a modified Michelson configuration, the interference patterns can be generated by the object and reference beams from different diffraction orders. After translating the grating, a random phase shift can be introduced to the hologram. To demonstrate the feasibility of our method, both thick and thin phase specimens are retrieved using two carrier phase-shifting holograms. Furthermore, we use the phase reconstruction algorithm based on the NVIDIA CUDA programming model to reduce the retrieval time. Meanwhile, we optimize the discrete cosine transform (DCT)-based least-squares unwrapping algorithm to unwrap the phase. By porting the entire phase reconstruction process to the graphics processing unit (GPU), the phase retrieval acceleration and execution efficiency significantly improve. To demonstrate the feasibility of our method, it is found that our method can measure the surface profiles of standard elements, such as a plano-convex cylinder lens and a microlens array, with a relative error of about 0.5%. For holograms with a different phase shift, the root-mean-square (RMS) value of the phase difference for the main imaging region is about 0.2 rad. By accelerating the phase reconstruction with GPU implementation, a speedup ratio of about 20× for the thick phase specimen and a speedup ratio of about 15× for the thin-phase specimen can be obtained for holograms with a pixel size of 1024 × 1024.
1. Introduction
Digital holography (DH) has become a rapidly developing technique for 3D shape measurement in recent years and is increasingly used in the fields of microscopic imaging [1,2], microstructure surface measurement [3], and living cell analysis [4,5]. Slightly off-axis digital holography (SODH) has gained increased attention because it is faster than on-axis DH in reconstructing images and achieves better resolution of reconstructed images than off-axis DH. In SODH, due to the elimination of the direct current (DC) term, there are only two cross-correlation terms in the spectrum, which are separated from each other, and they play a key role in extracting effective information [6]. SODH can be achieved by integrating off-axis configurations and phase shift techniques. For example, researchers have applied polarization phase shift techniques to implement SODH [7,8,9,10,11]. Specifically, when the object beam and the reference beam involved in the interference have different polarization states, a phase shift can be introduced in the interferogram by adjusting the polarization state of incident light using a polarizing element. However, achieving the desired phase shift often requires the use of multiple waveplates or a combination of polarizers and waveplates. The use of multiple optical elements complicates the alignment of the imaging system, thereby limiting the flexibility of the experimental setup. Additionally, special prisms and cubic beam splitters have been employed to achieve phase shifting [12,13,14]. Typically, the phase shift between the two carrier holograms of the methods mentioned above rely on polarization techniques or special prisms set to π/2 or π rad due to the limitations of the optical elements. Consequently, this limitation restricts the wider application of SODH. As another common element to obtain phase shift, grating has also been applied to SODH in recent years. For instance, Ma et al. proposed SODH blind two-step phase shift white light diffraction phase microscopy [15]. This method involves placing Ronchi grating at the image plane of a transmission microscope to produce multiple diffraction orders containing the complete spatial information of the sample. To meet the experimental requirements, a pinhole filter is used to filter the 0th order of the grating to generate a reference beam while the first diffraction order retains the sample information to form an object beam. However, the pinhole filter which is used must meet the strict system parameters. The first author proposed a SODH method based on flipping interference [6]. This device uses a modified flip module with a reflection grating and a retro-reflector consisting of two reflector structures. Using the flip module, an interferogram can be obtained by flipping the images of the object and the reference beam, and then, by transforming the +1 diffraction order of the reflection grating, two carrier holograms with a random phase shift can be obtained in two exposures. Although the method avoids the use of a pinhole to simplify the system installation and adjustment, it should also be noted that the reflection grating and retro-reflector used in this system require special fabrication.
In addition to the experimental setup, another advantage of the SODH technique is the efficient reconstruction algorithm and the simplicity of the phase recovery process. Phase recovery was performed using specimen-free holograms in previous studies of SODH [16]. This method can quickly and accurately eliminate carrier and background phases and recover specimen phases without complex operational procedures and high computational costs. Furthermore, this method can enhance the speed of program operations by combining techniques, such as spectrum cropping [16], multiplexing techniques [17], and complex domain coding [18]. To further improve the execution efficiency of the DH phase reconstruction algorithm, researchers have proposed that it can be ported to the GPU for parallel acceleration to meet real-time requirements [19]. In ref. [20], the Goldstein unwrapping algorithm, specifically for off-axis holographic processing, is proposed. Meanwhile, the unwrapping phase map is extracted on the GPU. However, the algorithm contains a number of sequential operations in the branch cut placement phase. Specifically, for noisy images, the branch placement computation time increases significantly when the number of residuals increases. So, it is not suitable for parallel computing. Inspired by the results in refs. [21,22], the DCT-based least-squares unwrapping algorithm is highly parallel and is very suitable for execution on a GPU. Recently, researchers have introduced the concept of off-chip shared memory, which improves the efficiency of communication between processes [23]. Shared memory enables multiple processes to access the same memory space, optimizing thread communication and reducing the data processing time. In addition, they have proposed a framework based on symbolic execution to systematically identify shared memory library conflicts [24] while effectively preventing inter-process data access conflicts.
In this paper, we propose and experimentally demonstrate a SODH system with a transmission grating and modified Michelson configuration to quantify the phase distribution. Carrier interference patterns can be generated by the object and reference beams from different diffraction orders of the grating. After translating the grating, a random phase shift can be introduced in the hologram. Then, the specimen phase can be retrieved with a simple phase retrieval method with the acceleration of GPU processing. One of the advantages of this proposed system is its simplicity and flexibility in terms of optical equipment and alignment. Compared with the previous work on SODH with a grating to introduce phase shift [6,15], the proposed method does not require special optical elements, such as a pinhole, reflective grating, or retro-reflector of two mirrors, or the strict limitations of the system parameters. In addition, our method makes installation and adjustment easier without requiring specialized skills. Another contribution of this study is the proposal of a SODH reconstruction algorithm based on the NVIDIA CUDA programming model to improve the reconstructed efficiency. Compared with the fast phase reconstruction methods which depend on reducing computational complexity with spectrum cropping, spatial multiplexing, or complex encoding [16,17,18], our method avoids the possible reduction in reconstructed quality due to the loss of spectral information. Compared with previous work using a GPU [20,21,22], a DCT-based least-squares unwrapping algorithm based on shared memory is proposed to improve the threaded data reading efficiency and reduce the algorithm execution time. This method can achieve a high stability measurement, simplicity in terms of procedure and setup, and high retrieval efficiency.
2. Methodology
2.1. Proposition and Design of the Experimental Device
Figure 1 depicts the experimental setup proposed in this study. In the input plane, the beam from a He–Ne laser source of wavelength λ is expanded and collimated by a beam expander (BE). The beam is then divided into two paths by a rectangle aperture AP adjustment. The specimen (S) is placed in the input plane, and one of the beams contains all the information of the specimen when it passes through the specimen and is called the object beam (O). The other route of the beam does not contain specimen information and is called the reference beam (R). The two beams are then executed to Fourier transform (FT) through the lens L1 to reach the transmission grating TG. It is possible to introduce different phase shifts in multiple orders by shifting TG. Moreover, it is simple and flexible for easy operation. The beam diffracted from TG passes through the lens L2 (L1 and L2 have the same focal length of f) and reaches the beam splitter BS. A part of the beam is reflected to the reflector M2, which is positioned on one side of the BS and is tilted at an angle. This tilt introduces an angular shift between the beam irradiated on M2 and the beam reflected by M2. The other part of the beam transmitted through the BS reaches reflector M1, which is placed parallel to the side of the BS. It is then reflected back by M1. Finally, the beams reflected by M1 and M2 converge again through the BS. At this point, the object and the reference beams intersect and interfere. Then, a CCD camera which can convert optical signals into digital images is put at the output plane to record the intensities of the holograms. Only one of the holograms is needed and captured by the CCD camera. Therefore, the other beams are blocked before the output plane using baffle BA. When the TG is shifted, another carrier hologram with an additional phase shift can be obtained in the second exposure. The specimen phase is recovered with the two holograms using the SODH reconstruction method.

Figure 1.
Experimental device: BE, beam expander; Ap, aperture; S, specimen; L1 and L2, lenses with the same focal length; BS, beam splitter; TG, transmission grating; M1 and M2, same reflective mirrors; BA, baffle.
2.2. Principle of the Holograms Generated by the Grating and Modified Michelson Configuration
In this paper, grating TG is used to obtain a random phase shift to meet the requirement of SODH. By using TG, the incident light is divided into multiple diffracted beams due to the grating’s periodic transmission structure. Figure 2 shows the principle of one case where the middle three diffracted beams pass through the modified Michelson configuration.
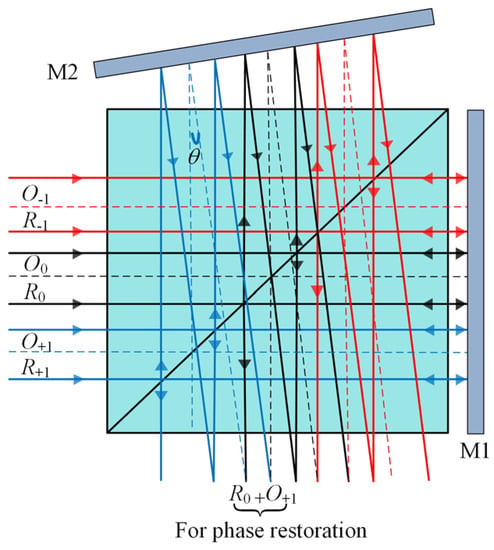
Figure 2.
Schematic diagram of acquisition hologram.
At the output plane, the object beam On and the reference beam Rn can be expressed as:
where n is the grating diffraction order, EO and ER are the amplitudes of the object beam and the reference beam in the input plane, φo(x, y) is the specimen phase distribution, and Cn is the n-Fourier complex coefficient modulated by a sin(·) function due to the use of TG. Along the x-axis, a phase shift of 2πnu0/dg is introduced by the initial transverse displacement u0 of TG with a grating period of dg [25,26]. It should be noted that an additional phase shift is obtained by translating TG; the object beam and reference beam should derive from different diffraction orders. Due to the tilt of M2, the object beam On1 from the copies of n1 order reflected by M2 is shifted to interfere with the reference beam Rn2 from the copies of the n2 order reflected by M1. Then, the intensity of the hologram can be expressed as:
where α0 = 2πu0/dg, φbg represents the background phase distribution caused by system aberrations and noise, and fx is the carrier frequency which can be adjusted by the tilt angle of M2. In this paper, we use the reference beam R0 to interfere with the object beam O+1, as shown in Figure 2. According to Equation (3), the intensity expression of the formed hologram is:
If TG is moved with an arbitrary translation of Δu, another hologram can be obtained as:
where ∆α = 2π∆u/dg. From Equations (4) and (5), two phase-shifting holograms with the same DC term and carrier frequency are obtained, which agree well with the principle of SODH. Thus, a suitable phase retrieval method of SODH can be further utilized to obtain the specimen phase distribution using the two holograms. It should also be noted that due to the amplitude modulation of the transmission grating, two exposures are needed to obtain these phase-shifting holograms. When a grating with equally distributed optical power [27] or intensity adjustment algorithms of the interferogram [28,29] are used, it is expected that two holograms in one shot will be achieved with the help of discarded diffraction orders, and real-time measurement will be realized, as it was by many others [8,9,10,11,12,13,14].
2.3. Phase Recovery Algorithm
Based on the proposed setup, quantitative phase imaging can be performed using the SODH reconstruction algorithm. For SODH, the central problem is to eliminate the DC term. By subtracting Equation (4) from Equation (5), the DC term can be eliminated, and the resulting expression is obtained as shown in Equation (6):
For ease of understanding and illustration, Equation (6) can be rewritten according to Euler’s formula, expressed as follows:
where b(x, y) = C+1C0EOER. To completely separate the real image and conjugate image, FT can be applied to Equation (7). Then, the bandpass filter (BPF) can be used to select the target region for the spectrum at this point and then perform the inverse Fourier transform (IFT). The result of this process can be described by Equation (8):
To efficiently and accurately eliminate the carrier and background phases, algorithms utilizing specimen-free holograms have been proposed [16]. Compared with fitting techniques and some phase compensation methods [30,31,32,33], this algorithm can remove the background phase without complicated processes or high computational costs. Assuming that specimen-free holograms with intensity distributions and are captured at the same phase shift ∆α and processed through steps A to D, as illustrated in Figure 3, the result obtained is as shown in Equation (9):
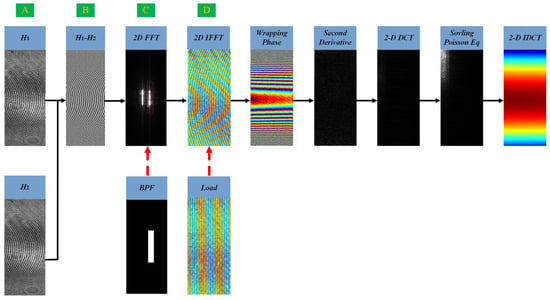
Figure 3.
The flow chart of phase recovery algorithm.
Then, the specimen hologram divided by the pre-loaded specimen-free hologram can quickly eliminate the background phase and carrier frequency to obtain the phase information of the specimen. The final result can be obtained by the arctangent function, as shown in Equation (10):
At this point, the retrieved phase of the thin phase object can be obtained. However, for thick phase specimens, the true value of the part of the phase beyond [−π, π] rad cannot be obtained due to the limitation of the nature of the arctangent function. Thus, it still needs to be unwrapped after the phase recovery of thick phase specimens by this method. In general, there are two major types of methods for two-dimensional phase unwrapping: the path-tracing method and the minimum-norm method. However, the path-tracing method often lacks parallelism, so the minimum-norm method is generally chosen. Specifically, the global-oriented minimum-norm method is more advantageous in terms of time than the path-tracing method. The least-squares unwrapping algorithm based on DCT is one of the minimum-norm methods [21] which is easy to implement and has a higher energy aggregation. The mathematical model of the least-squares phase unwrapping algorithm is:
The idea of the least-squares unwrapping algorithm is to make the gradient of the unwrapped phase converge infinitely in the least-squares sense with the wrapped phase gradient. The expected unwrapping phase approximates the true phase distribution. ϕi,j represents the unwrapped phase, Δ is the difference operator, and represent the wrapped phase gradients of adjacent points in the x and y directions, respectively, and M and N represent the number of pixels.
By deriving and solving Equation (11), the model can be simplified to the discrete Poisson equation in the following form:
where ρi,j = ( − ) + ( − ) can be obtained by taking the difference in the unwrapped phase ϕi,j in the x and y directions, respectively. However, it is important to note that the phase differential is invalid at the edge of the wrapped phase. Therefore, the discrete Poisson equation must also satisfy the following conditions:
The DCT of Equation (13) is carried out, and the following equation is obtained:
It is important to note that in the equation, DCT [ϕ0,0] = DCT [ρ0,0]. After performing a two-dimensional inverse discrete cosine transform (IDCT) on Equation (14), we obtain a continuous unwrapped phase ϕi,j, as shown in Equation (15):
According to the derivation of the above equation, the implementation process of the phase recovery algorithm is as summarized in Figure 3.
2.4. GPU Parallel Acceleration
In this paper, the entire phase reconstruction process is ported to run on a GPU in order to enhance the execution efficiency of the algorithm [34]. The phase extraction process involves several steps, including hologram subtraction operations, fast Fourier transform (FFT), the construction of rectangular filters, complex amplitude phase division operations, and phase solving operations. For the FFT, this paper uses the CUFFT library developed by NVIDIA, which offers efficient computation of 1D, 2D, and 3D FT in CUDA C [35]. Filtering of the frequency domain is implemented using point-by-point matrix multiplication in the GPU, where each pixel of the image is processed independently by a separate thread, allowing for easy parallel implementation without data dependencies. To eliminate carrier frequency information and background phase, it is necessary to perform the division operation between the inverse fast Fourier transform (IFFT) of the specimen complex amplitude and specimen-free complex amplitude. The wrapped phase of each pixel is then computed using the arctangent function, with each thread performing the computation independently and storing the results in an array. All these series of steps are computationally intensive. Therefore, they are well suited for efficient implementation using GPU.
However, for thick phase specimens, when the input data are too large and the kernel function becomes complex, it can lead to the “serial” phenomenon in the phase unwrapping process. This means that parts of the program are executed sequentially instead of in parallel, which increases the operation time of the algorithm and reduces the overall execution efficiency. Because shared memory enables multiple processes to access the same memory space, it optimizes the communication between threads and reduces the time of data access. Therefore, the application of shared memory technology in more complex computations such as calculating second derivatives, 2D DCT, the Poisson equation, and 2D IDCT is a good solution to the problem of thread congestion when processing larger data and improves the efficiency of threads accessing data and optimizes the unwrapping algorithm while reducing the algorithm execution time. The overall GPU implementation process is illustrated in Figure 4, where the CPU is primarily responsible for data transfer, such as loading holograms and filters into memory, and exchanging data with the GPU. It should also be noted that the proposed GPU implementation process is not only suitable for the proposed imaging system but is also effective for other SODH systems.
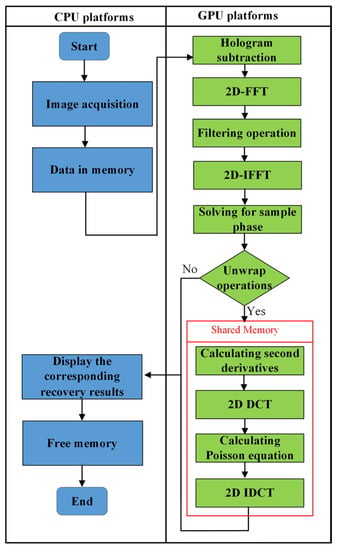
Figure 4.
The flow chart of phase reconstruction on GPU.
3. Holographic Imaging and Phase Reconstruction
3.1. Holographic Imaging of USAF Resolution Plate
To demonstrate the efficiency of the method, experiments were conducted using the setup shown in Figure 1. In our experiments, the light source is a He–Ne laser with a wavelength λ = 632.8 nm; L1 and L2 are two lenses with a focal length of 250 mm; TG has a period of 50 µm; M1 and M2 are two mirrors of equal size, and the size of both mirrors is 25.4 mm × 25.4 mm; and the pixel size in the CCD camera is 4.8 µm × 4.8 µm, and the resolution is 1280 × 1024 pixels.
To understand the imaging properties well, the method of acquiring holograms was demonstrated by using an amplitude-only USAF resolution plate as the specimen. The light source from the He–Ne laser passes through the aperture AP, the USAF resolution plate, and the lens L1 and reaches TG. Consistent with the case shown in Figure 2, the multiple orders diffracted by TG are reflected by the reflectors M1 and M2. To illustrate how the interferograms form at the output plane, BA was not placed at first. Thus, the beams R0, O+1, and R+1 with red font were obtained by the reflection of M1, as shown in Figure 5a, while the beams O+1 and R+1 with green font were reflected by M2, as shown in Figure 5b. When the beams shown in Figure 5a met those beams in Figure 5b, some holograms could be captured by the CCD camera put at the output of the system, as shown in Figure 5c. It was found that the holograms could be formed by O+1 and R0 diffraction orders, as well as R+1 and O+1 diffraction orders. However, it should also be noted that if only the object beam or reference beam is available, no interference can occur to form an interferogram. Considering a following phase shift to the hologram, we selected the interference of the object beam O+1 and the reference beam R0 while all other beams were ignored.
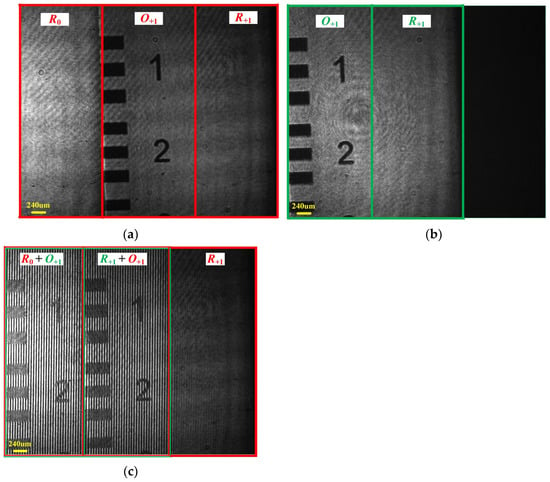
Figure 5.
Holograms of the USAF resolution plate. (a) Beams obtained by reflection through M1; (c) beams obtained by reflection through M2 (b); (c) holograms formed by the interference of (a,b).
In order to test the spatial resolution of the system, two phase-shifted holograms were obtained by capturing the region of element three to six in Group 2 of the resolution plate, as shown in Figure 6a,b. After acquiring the subtracted hologram shown in Figure 6c, the intensity distribution could be reconstructed according to the angular spectrum algorithm [36]. It can be seen in Figure 6d that the feature of the sixth element could be clearly imaged. According to the line pair numbers of the USAF resolution plate, the lateral resolution of the system could reach at least 70.15 µm. It is worth mentioning that the imaging resolution of the system depends on the laser wavelength, the pixel size of the CCD camera, carrier frequency, and the size of the sample [37,38,39].
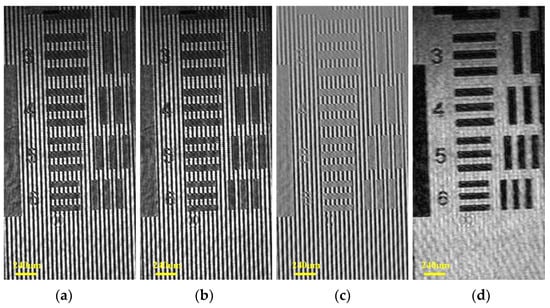
Figure 6.
Reconstructed intensity results of the USAF resolution plate. (a,b) Specimen holograms captured with a phase shift; (c) subtraction of (a,b); (d) reconstructed intensity distribution.
3.2. Phase Reconstruction of Thick Phase Specimen
In the second experiment, a plano-convex cylinder lens (CYX0011, Union Optical, China) with a focal length of 250 mm was firstly used as the specimen to evaluate the ability to acquire thick phase specimens. The plano-convex cylinder lens had a standard refractive index of 1.515 mm and a radius of curvature of 128.67 mm. As shown in Figure 7a, the first hologram was obtained in the first shot. Then, moving TG, another hologram with a phase shift of 4π/5 rad could be obtained in the second shot, as shown in Figure 7b. In order to eliminate the DC term, a subtraction operation was performed on the two holograms, and the result is shown in Figure 7c. As shown in Figure 7d, the DC term wes eliminated due to the subtraction of two holograms. Moreover, the real image and the twin image were completely separated from each other. We used the BPF enclosed by the red dashed line in Figure 7d and reconstructed the complex amplitude of Figure 7c by Equation (10). To acquire the phase of the specimen under test, two specimen-free carrier holograms with a phase shift of 4π/5 rad were also acquired, as shown in Figure 7e,f. As shown in Figure 7g, due to the large range of the measured specimen phase values, only a wrapped phase could be obtained by Equation (10). After phase unwrapping, the measured specimen phase distribution was as shown in Figure 7h. In order to further evaluate the effectiveness of the proposed method, we performed quantitative calculations of the unwrapped phase. The 1D optical path difference (OPD) profile [6] is mapped along the blue dashed line in Figure 7h, as indicated by the blue line in Figure 8. A polynomial fit to the measured profile was performed to obtain the red dashed fitting line in Figure 8. Based on the contour geometry relationship shown in Figure 8 [40], the radius of curvature and focal length of the specimen were calculated to be 129.12 mm and 251.27 mm, respectively. The relative error of the focal length could be calculated as 0.508%, which demonstrates the quantitative measuring ability of the system.
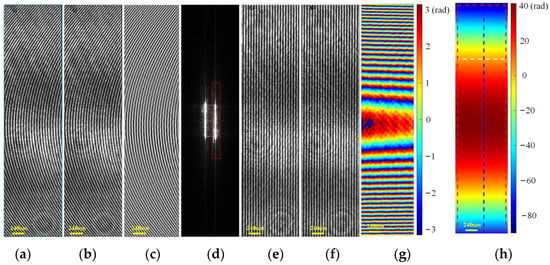
Figure 7.
Experimental results of a plano-convex cylinder lens using SODH method. (a,b) Specimen holograms captured with a phase shift of 4π/5 rad between them; (c) subtraction of (a,b); (d) spectrum of (c); (e,f) specimen-free holograms captured with a phase shift of 4π/5 rad between them; (g) retrieved wrapped phase (unit: rad); (h) retrieved final unwrapped phase (unit: rad).
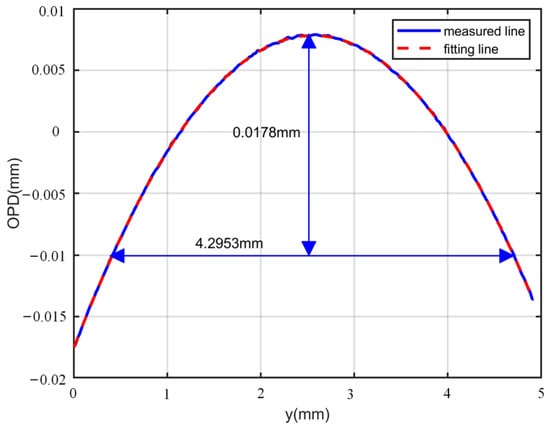
Figure 8.
One-dimensional OPD profile used to calculate the curvature radius of the plano-convex cylinder.
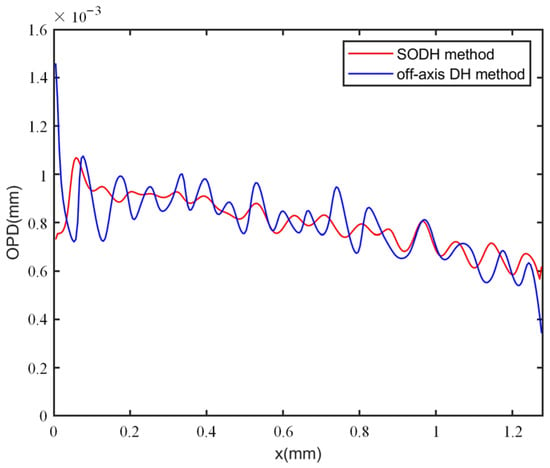
To compare the reconstruction performance of our method with conventional off-axis DH, the specimen phases were also reconstructed using Figure 7a,e. The spectrum of Figure 7a is shown in Figure 9a, and the DC term was still retained in the spectrum. We used the same reconstructed phase procedure as well as the same filter to obtain the reconstructed wrapped and unwrapped phases via the off-axis DH method, as shown in Figure 9b,c. To quantitatively evaluate the reconstruction performance of the SODH method and the off-axis DH method, we calculated the 1D phase profiles along the white dashed line direction marked in Figure 7h and Figure 9c, as shown in Figure 10. The standard deviations of the phase fluctuations indicated by the red and blue lines in Figure 10 were 0.538 rad and 0.876 rad, respectively. A smaller fluctuation appeared in the reconstructed results of the SODH method, which implies that the proposed method can achieve a higher reconstruction quality compared to the off-axis DH method.
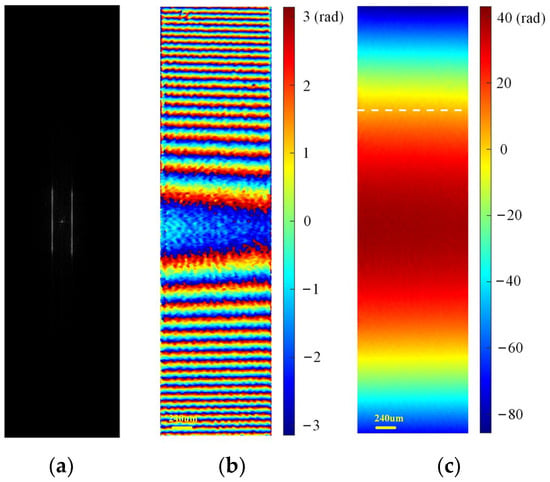
Figure 9.
Experimental results of a plano-convex cylinder lens using off-axis DH method. (a) Spectrum of Figure 7a; (b) retrieved wrapped phase (unit: rad); (c) retrieved final unwrapped phase (unit: rad).
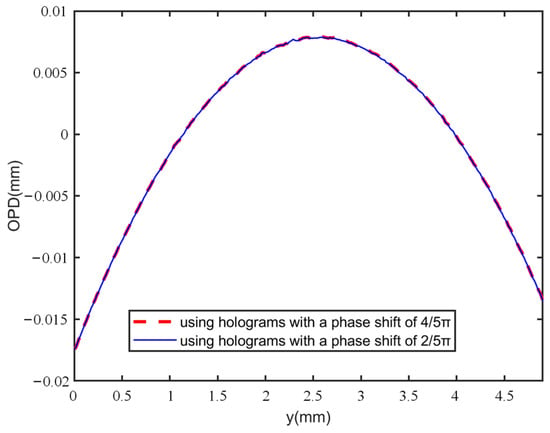
One of the advantages of our method is the introduction of random phase shift by the grating. To demonstrate the test performance using carrier holograms with different phase shifts, two specimen holograms of the plano-convex cylinder lens, shown in Figure 11a,b, were captured with a phase shift of 2π/5 rad between them. Figure 11c,d displays the corresponding specimen-free holograms. The unwrapped phases recovered by the proposed method are presented in Figure 11e. Then, we calculated the phase difference between the regions enclosed with red dashed lines in Figure 7h and Figure 11e, and the results are shown in Figure 11f. The RMS of Figure 11f was calculated as 0.1320 rad. Additionally, the 1D phase profiles along the blue dashed line in Figure 7h and Figure 11e were also compared, and the similar profile distributions that were close to each other are shown in Figure 12. The results indicate that different phase shifts utilized in the system did not obviously affect the measurement results. Therefore, the method can achieve low noise and high-precision measurements with a random phase shift.
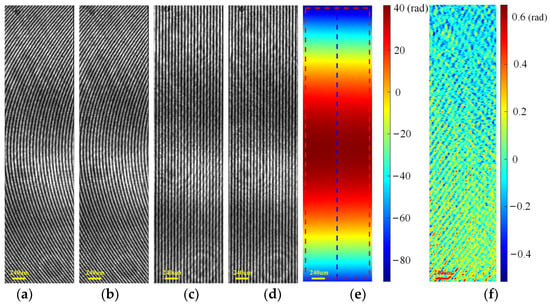
Figure 11.
Experimental results of a plano-convex cylinder lens using a different shift introduced by TG. (a,b) Specimen holograms captured with a phase shift of 2π/5 rad between them; (c,d) specimen-free holograms captured with a phase shift of 2π/5 rad between them; (e) retrieved final phase (unit: rad); (f) phase difference in the area fenced with the red dashed lines in Figure 7h and Figure 11e (unit: rad).
To evaluate the capability of the samples with different spatial structures, some similar experiments were carried out using a microlens array made of fused silica (MLA300-14AR, Thorlabs) as the specimen. The quantitative reconstructed results are shown in Figure 13. It can be seen from Figure 13a–c that the microlens array has a more complex structure than the plano-convex cylinder lens, which resulted in a wider spatial bandwidth distribution in the Fourier domain, as shown in Figure 13d. Using the unwrapped phase shown in Figure 13h, the curvature radius could be calculated according to the geometrical relationships described in Figure 13i. The curvature radius was obtained as 6.4714 mm, which has a relative error of 0.435% compared with the standard parameter (6.5 mm). Furthermore, we also tested the microlens array using the two carrier holograms shown in Figure 14a,b with a different phase shift (2π/5 rad) between them. It can be seen from Figure 14e–g that a similar retrieved result could be obtained when the phase shift between the two holograms was different. Furthermore, the phase difference in the region enclosed by the black dashed lines in Figure 13h and Figure 14e was compared, as shown in Figure 14f, and the RMS value of the phase difference was calculated as 0.1886 rad. The results show that the method can also obtain the accurate retrieval quality of specimens with different spatial structures.
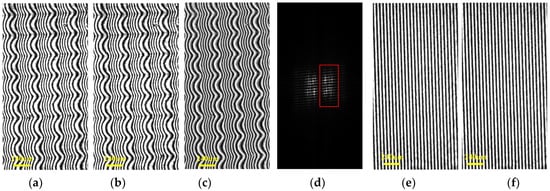
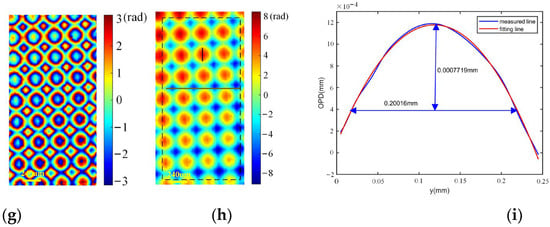
Figure 13.
Experimental results of a microlens array using SODH method. (a,b) Specimen holograms captured with a phase shift of 4π/5 rad between them; (c) subtraction of (a,b); (d) spectrum of (c); (e,f) specimen-free holograms captured with a phase shift of 4π/5 rad between them; (g) retrieved wrapped phase (unit: rad); (h) retrieved final unwrapped phase (unit: rad). (i) One-dimensional OPD profile used to calculate the curvature radius of the microlens array.
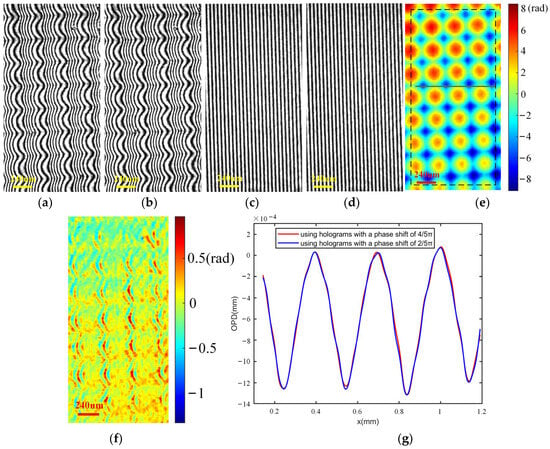
Figure 14.
Experimental results of a microlens array using a different shift introduced by TG. (a,b) Specimen holograms captured with a phase shift of 2π/5 rad between them; (c,d) specimen-free holograms captured with a phase shift of 2π/5 rad between them; (e) retrieved final phase (unit: rad). (f) Phase difference in the area fenced with the black dashed lines in Figure 13h and Figure 14e (unit: rad). (g) One-dimensional phase profiles along the brown dashed lines marked in Figure 13h and Figure 14e.
3.3. Phase Reconstruction of Thin Phase Specimen
The third measurement experiment was performed to illustrate the reconstruction capability of a thin phase specimen. In the measurements, an oil drop was used as the specimen. Figure 15a,b shows two specimen holograms with a phase shift of 2π/5 rad between them. Figure 15c,d shows the corresponding specimen-free holograms. As shown in Figure 15e, due to the small measured phase range (lower than 2π rad) of the oil drop, the phase could be recovered directly using Equation (10), but without phase unwrapping. Only using Figure 15a,c, the phase distribution could be retrieved via the off-axis DH method. Although a similar background could be obtained, the main information regions of the oil drop were quite different. To clearly show the difference in them, we plotted the 1D phase profiles along the red line in Figure 15e and the blue line Figure 15f, as shown in Figure 16. It can be seen that a fold appeared in the results of the off-axis DH method, which means a failed phase construction. Furthermore, the standard deviations of the phase fluctuations indicated by the red and blue lines in Figure 16 were 0.995 rad and 1.667 rad, respectively. The results indicate that the proposed method can obtain a higher-quality result compared to the off-axis DH method for a thin phase specimen. To explore the influence of holograms with different phase shifts for thin phase specimens, specimen holograms with a phase shift value of 4π/5 rad and corresponding specimen-free holograms were also collected, as depicted in Figure 15g–j. Figure 15k shows the phase recovered by the proposed method, which agrees well with the result shown in Figure 15e. To achieve a quantitative analysis, we calculated the phase difference between the regions enclosed with red dashed lines in Figure 15e,k, resulting in Figure 15l. The RMS of Figure 15l was calculated to be 0.2306 rad. Additionally, the 1D phase profiles along the red lines in Figure 15e,k shown in Figure 17 presented similar retrieving results when using holograms with different phase shifts. Combining the results presented in Section 3.2, it is demonstrated that the proposed method can obtain higher-quality results compared to the off-axis DH method for both thick and thin phase specimens using holograms with random phase shifts.
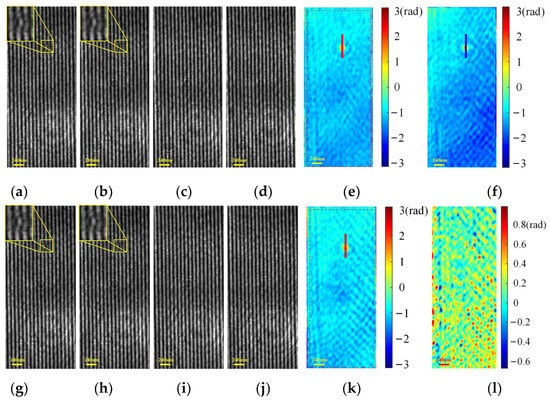
Figure 15.
Experimental results of an oil drop. (a,b) Specimen holograms captured with a phase shift of 2π/5 rad between them; (c,d) specimen-free holograms captured with a phase shift of 2π/5 rad between them; (e) retrieved phase using (a–d) by SODH method (unit: rad); (f) retrieved phase by off-axis DH method (unit: rad); (g,h) specimen holograms captured with a phase shift of 4π/5 rad between them; (i,j) specimen-free holograms captured with a phase shift of 4π/5 rad between them; (k) retrieved phase using (g–j) by SODH method (unit: rad); (l) phase difference in the area fenced with red dash lines in Figure 15e,k (unit: rad).
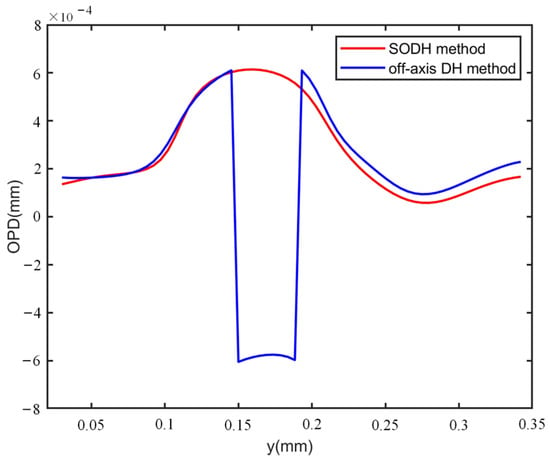
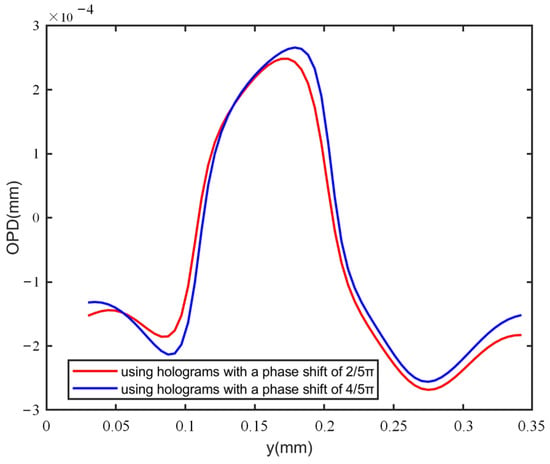
Figure 17.
One-dimensional phase profiles along the red line marked in Figure 15e,k.
4. CUDA Implementation
To verify the feasibility and effectiveness of the GPU-accelerated phase recovery algorithm, the phase reconstruction and the acceleration of the algorithm implemented on the GPU are presented. We tested the programs on a computer with an Intel® Core i7 processor clocked at 3.2 GHz and 16 GB of RAM, supporting CUDA programming with NVIDIA® GeForce® RTX 3070.
4.1. Phase Reconstruction of GPU Implementation
Phase reconstructed comparisons of the GPU implementation and CPU implementation were carried out. The experiments on thick phase specimens were first researched. Using Figure 7a–f, the wrapped and unwrapped phase of the plano-convex cylinder lens could be obtained by GPU-based processing with the flow chart described in Figure 4, and the results are shown in Figure 18a,b. Applying CPU processing, a similar unwrapped phase distribution was achieved, as shown in Figure 18c. Furthermore, the plot of the 1D phase profiles along the green dashed line in Figure 18b,c are drawn in Figure 19. It can be observed from Figure 19 that the two curves exhibit a similar trend of variation, indicating that recovering the phase with the GPU yielded similar results to the CPU. Likewise, the evaluation measurement was implemented on the microlens array. The wrapped phase and the unwrapped phase for GPU processing was obtained using Figure 13a–f, as shown in Figure 20a,b, while the unwrapped phase for CPU processing is shown in Figure 20c. Similar 1D phase profiles along the black line marked in Figure 20b,c were also obtained, as shown in Figure 21. Secondly, the recovery effect of the GPU for thin phase specimens was researched. The holograms shown in Figure 15a–d were selected. The retrieved phase implemented on the GPU is shown in Figure 22a, and the corresponding CPU-implemented result is shown in Figure 22b. To further compare the results of CPU and GPU recovery for thin phases, we drew the 1D phase profiles along the red line in Figure 22a,b, as shown in Figure 23. Figure 23 shows that similar recovery results could be obtained. Through the results presented by the experiments for both thick and thin phase specimens, it was found that a similar reconstructed phase can be obtained by GPU implementation and CPU implementation. Thus, the acceleration of GPU-based parallel phase reconstruction will become the focus of attention in the following work.
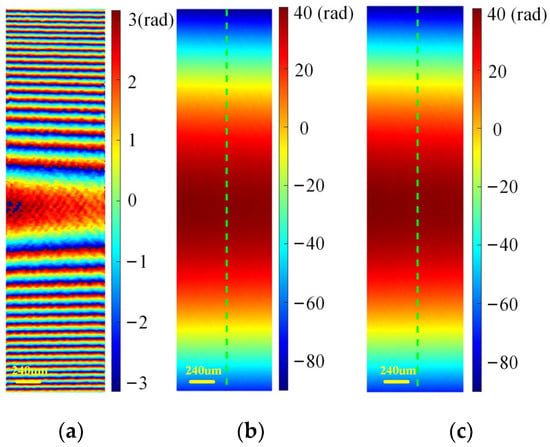
Figure 18.
GPU phase recovery results of a plano-convex cylinder lens. (a) Wrapped phase for GPU processing (unit: rad); (b) unwrapped phase for GPU processing (unit: rad); (c) unwrapped phase for CPU processing (unit: rad).
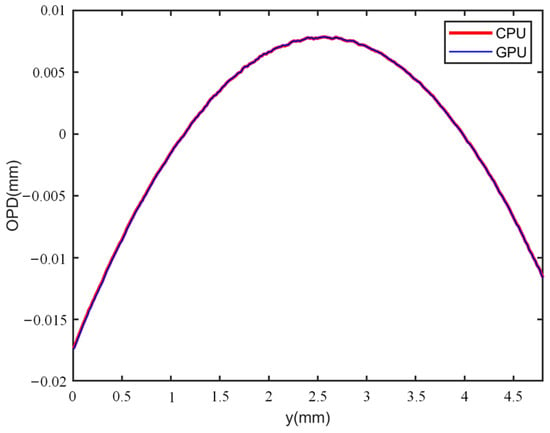
Figure 19.
One-dimensional phase profiles along the green dashed line marked in Figure 18b,c.
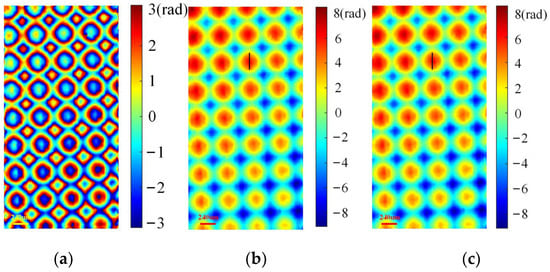
Figure 20.
GPU phase recovery results of a microlens array. (a) Wrapped phase for GPU processing (unit: rad); (b) unwrapped phase for GPU processing (unit: rad); (c) unwrapped phase for CPU processing (unit: rad).
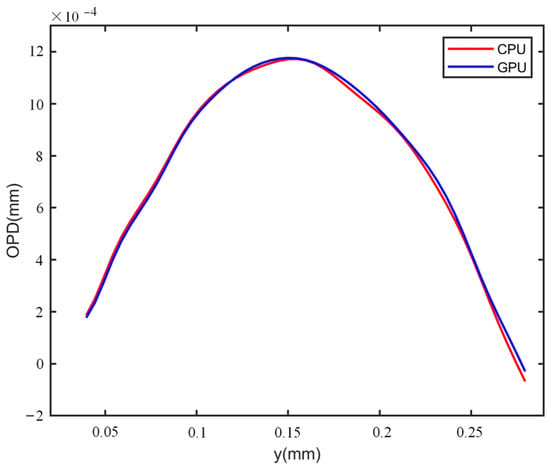
Figure 21.
One-dimensional phase profiles along the black line marked in Figure 20b,c.
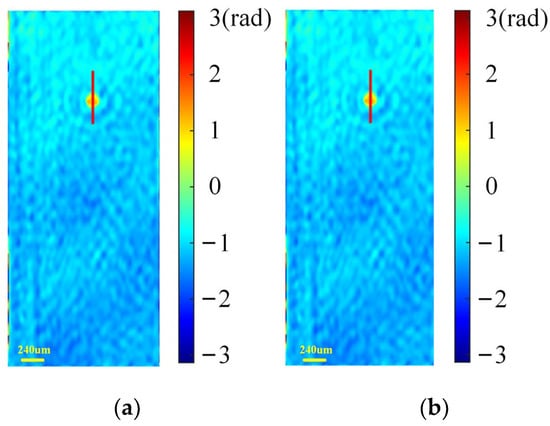
Figure 22.
GPU phase recovery results of an oil drop. (a) Retrieved phase for GPU processing (unit: rad); (b) retrieved phase for CPU processing (unit: rad).
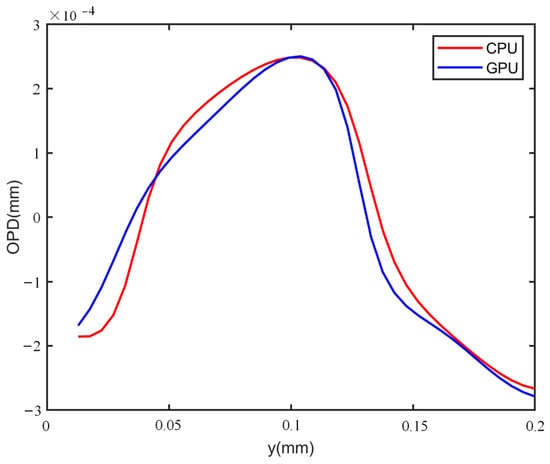
Figure 23.
One-dimensional phase profiles along the red line marked in Figure 22a,b.
4.2. Acceleration Experiment of GPU Implementation
In order to further evaluate the acceleration effect of the algorithm, a comparison between CPU and GPU processing was conducted. The phase extraction part utilized the FFTW library for FFT on the CPU, while the implementation of the GPU was conducted using CUDA C and compiled with the Microsoft Visual Studio 2019 compiler. Due to the limitation of the CCD camera bandwidth, capturing larger-sized images was not feasible. Therefore, zero padding was utilized during image processing to obtain larger holograms.
Table 1 provides a comparison of the running times for the four image sets with different pixel sizes of thick phase specimens (the plano-convex cylinder lens and the microlens array) with CPU and GPU implementations. For both CPU and GPU, the total runtime includes the phase extraction time and phase unwrapping time. In particular, for the GPU, the total runtime is equal to the GPU runtime plus the CPU to GPU data transmission time. In addition, the speedup ratio is equal to the CPU runtime divided by the GPU runtime, and the total speedup ratio is equal to the total CPU runtime divided by the total GPU runtime. As can be observed in Table 1, by porting the entire phase reconstruction algorithm to the GPU, a higher speedup ratio was achieved as the image size increased for both specimens. In addition, to further accelerate the program runtime, the unwrapping algorithm was optimized using shared memory, and the results are shown in Table 2.

Table 1.
Thick phase specimens implemented on GPU and CPU.

Table 2.
Shared memory optimized thick phase specimens implemented on GPU and CPU.
The data in Table 2 show that the introduction of shared memory has a significant impact on the optimization on the GPU algorithm. In comparison to the results in Table 1, the DCT least-squares unwrapping algorithm based on shared memory optimization had a considerable speedup effect on the GPU as the image size increased. It is obvious that the speedup ratio of the unwrapping algorithm is on the small side compared to the phase extraction algorithm, which is due to the fact that the data transmission time increases with the amount of transmission data. Fortunately, the increase in the total speedup ratio indicates that the GPU utilization increased with the increase in the computation, so the application of the shared memory technique in the DCT-based least-squares phase unwrapping algorithm can effectively reduce the program running time and improve the execution efficiency of the algorithm. Overall, the phase recovery and unwrapping algorithm for thick phase specimens showed significant acceleration on the GPU, and the use of the GPU for phase reconstruction had a strong time advantage. Moreover, the running time and speedup ratios shown in Table 1 and Table 2 were similar for the plano-convex cylinder lens and the microlens array. Therefore, the accelerated performance of our method is effective for the samples with different spatial structures.
Moving on to thin phase specimens, Table 3 compares the running time of the CPU and GPU implementations. Since the unwrapping operation was not required for the thin phase specimens, the total runtime was equal to the phase extraction time for both CPU and GPU. In particular, as with the thick phase specimens, the total GPU runtime was also equal to the GPU runtime plus the data transfer time for the thin phase specimens. As can be seen from the data in Table 3, the phase extraction algorithm on the CPU for thin phase specimens of different sizes had a significant speedup ratio in comparison to the execution efficiency on the GPU. Although the data transmission time increased as the number of transmission increases, the data transmission time still took up most of the GPU runtime. However, as the total speedup ratio increased, it shows that the operation speed of the phase reconstruction of thin phase specimens has a huge speedup effect compared with that of the CPU.

Table 3.
Thin phase specimens implemented on GPU and CPU.
It can be seen from the experimental results that for the thick phase specimens, the total speedup ratios were about 4.5×, 10.8×, 13.0×, and 19.3× for the plano-convex cylinder lens and about 4.1×, 11.7×, 14.6×, and 20.4× for the microlens array with increasing image size on the GPU, respectively. This shows a significant acceleration effect of the GPU on the overall algorithm. Similarly, for the thin phase specimens, the total speedup ratios were about 4.2×, 7.5×, 11.7×, and 15.0× with increasing image size, respectively. This also had a huge speedup effect. In summary, the GPU implementation demonstrates significant acceleration compared to the CPU implementation, and the introduction of shared memory optimization further enhances the execution efficiency of the algorithm. These results suggest that utilizing the GPU for phase recovery and reconstruction provides a time advantage, especially for thick phase specimens.
5. Conclusions
In this paper, we proposed a method to achieve quantitative phase imaging using TG and accelerate the implementation of the algorithm using the GPU. The introduction of TG allows the object and reference beam to be diffracted into multiple orders of light where both the object and reference beam of different diffraction orders can interfere and a random phase shift can be reintroduced in the hologram by translating the grating. The adjustment of TG is intuitive and does not require specialized optical skills or complex calibration, which greatly enhances the flexibility of the system. The effectiveness and efficiency of the proposed method was demonstrated by measurements on thick and thin phase specimens. In addition, we investigated the acceleration performance of GPU in the phase recovery algorithm, we used a shared memory approach to improve the highly parallel least-squares unwrapping algorithm based on DCT, and ported all algorithms to GPU parallel acceleration to reduce the retrieval time. Experiments demonstrated that the acceleration and execution efficiency of phase retrieval for both the thick phase and the thin phase specimens were significantly improved. Overall, the proposed method combines a simplified SODH system using a TG with GPU acceleration to achieve efficient and accurate phase retrieval. The experimental results demonstrated the feasibility and effectiveness of the proposed approach. We hope that the proposed method can extend the application of SODH in the future. This study is conducive to promoting SODH imaging technology and GPU-based parallel phase reconstruction for accurate evaluation of the surface profiles of transparent specimen at high speed. Of course, as it is a novel approach, there is still much further work which needs to be carried out, such as introducing a microscope objective to the system to investigate much smaller specimens, exploring the utilization of discarded diffraction orders to realize spatial multiplexing measurement, and testing the phase reconstruction ability of the GPU-accelerated parallel algorithm for dynamic processes. However, we still hope that our new approach will prove to be practical in SODH applications.
Author Contributions
Conceptualization, H.B., J.C. and L.S.; methodology, H.B.; software, H.B.; validation, H.B.; formal analysis, H.B. and J.C.; investigation, H.B.; resources, H.B. and L.S.; data curation, H.B.; writing—original draft preparation, H.B.; writing—review and editing, J.C. and L.L.; visualization, H.B. and J.Z.; supervision, H.B.; project administration, H.B.; funding acquisition, H.B. and L.S. All authors have read and agreed to the published version of the manuscript.
Funding
This work is supported by the Natural Science Foundation of Heilongjiang Province (SS2021C005), the Program for Training Young Innovative Talents in General Undergraduate Higher Education Institutions in Heilongjiang Province (UNPYSCT-2018012), the Fundamental Research Project of Basic Scientific Research Business Expenses of Heilongjiang Provincial Higher Education Institutions (2022-KYYWF-1048), and the Heilongjiang Province Key Research and Development Project (GZ20220121, 2022ZX03A06).
Institutional Review Board Statement
Not applicable.
Informed Consent Statement
Not applicable.
Data Availability Statement
Not applicable.
Conflicts of Interest
The authors declare no conflict of interest.
References
- Yaghoubi, S.H.S.; Ebrahimi, S.; Dashtdar, M. Structured illumination in Fresnel biprism-based digital holographic microscopy. Opt. Lasers Eng. 2022, 159, 107215. [Google Scholar] [CrossRef]
- Tajbakhsh, K.; Ebrahimi, S.; Dashtdar, M. Low-coherence quantitative differential phase-contrast microscopy using Talbot interferometry. Appl. Opt. 2022, 61, 398–402. [Google Scholar] [CrossRef]
- Zhang, X.; Wu, C.; Chen, L.; Chen, G.; Zheng, G. A Novel Approach for Measurement of Free-Form Optical Elements with Digital Holographic Microscopy. Micromachines 2022, 13, 1719. [Google Scholar] [CrossRef]
- Zhang, Z.; Zheng, Y.; Xu, T.; Upadhya, A.; Lim, Y.J.; Mathews, A.; Xie, L.; Lee, W.M. Holo-UNet: Hologram-to-hologram neural network restoration for high fidelity low light quantitative phase imaging of live cells. Biomed. Opt. Express 2020, 11, 5478–5487. [Google Scholar] [CrossRef]
- Kumar, M.; Matoba, O.; Quan, X.Y.; Rajput, S.K.; Morita, M.; Awatsuji, Y. Quantitative dynamic evolution of physiological parameters of RBC by highly stable digital holographic microscopy. Opt. Lasers Eng. 2022, 151, 106887. [Google Scholar] [CrossRef]
- Bai, H.; Min, R.; Yang, Z.; Zhu, F. Slightly off-axis flipping digital holography using a reflective grating. J. Opt. 2020, 22, 035602. [Google Scholar] [CrossRef]
- Yang, Y.; Cheng, Z.; Zhao, H.; Yue, Q.; Guo, C. Quantitative phase imaging system with slightly-off-axis configuration and suitable for objects both larger and smaller than the size of the image sensor. Opt. Express 2018, 26, 17199–17208. [Google Scholar] [CrossRef]
- Gao, P.; Yao, B.; Harder, I.; Min, J.; Guo, R.; Zheng, J.; Ye, T. Parallel two-step phase-shifting digital holograph microscopy based on a grating pair. J. Opt. Soc. Am. 2011, 28, 434–440. [Google Scholar] [CrossRef]
- Hao, B.; Shan, M.; Zhong, Z.; Diao, M.; Wang, Y.; Zhang, Y. Parallel two-step spatial carrier phase-shifting interferometric phase microscopy with fast phase retrieval. J. Opt. 2015, 17, 3. [Google Scholar] [CrossRef]
- Bai, H.; Zhong, Z.; Shan, M.; Liu, L.; Guo, L.; Zhang, Y. Interferometric phase microscopy using slightly-off-axis reflective point diffraction interferometer. Opt. Lasers Eng. 2017, 90, 155–160. [Google Scholar] [CrossRef]
- Shan, M.; Deng, P.; Zhong, Z.; Liu, L. Simplified dual-channel two-wavelength interferometer using a polarized cube beam splitter. Appl. Opt. 2021, 60, 11156–11160. [Google Scholar] [CrossRef]
- Shaked, N.T.; Rinehar, M.T.; Wax, A. Dual-interference-channel quantitative-phase microscopy of live cell dynamics. Opt. Lett. 2009, 34, 767–769. [Google Scholar] [CrossRef]
- Leon-Rodriguez, M.; Rayas, J.A.; Cordero, R.R.; Martinez-Garcia, A.; Martinez-Gonzalez, A.; Tellez-Quinones, A.; Yanez-Contreras, P.; Medina-Cazares, O. Dual-plane slightly off-axis digital holography based on a single cube beam splitter. Appl. Opt. 2018, 57, 2727–2735. [Google Scholar] [CrossRef]
- Picazo-Bueno, J.A.; Trusiak, M.; Mico, V. Single-shot slightly off-axis digital holographic microscopy with add-on module based on beamsplitter cube. Opt. Express 2019, 27, 5655–5669. [Google Scholar] [CrossRef]
- Ma, L.; Zhang, J.; Yang, X.; Li, Y.; Jin, W. White light diffraction phase microscopy with slightly off-axis blind two-step phase-shifting. Opt. Commun. 2019, 455, 124563. [Google Scholar] [CrossRef]
- Zhong, Z.; Bai, H.; Shan, M.; Zhang, Y.; Guo, L. Fast phase retrieval in slightly off-axis digital holography. Opt. Lasers Eng. 2017, 97, 9–18. [Google Scholar] [CrossRef]
- Shaked, N.T.; Mico, V.; Trusiak, M.; Kus, A.; Mirsky, S.K. Off-axis digital holographic multiplexing for rapid wavefront acquisition and processing. Adv. Opt. Photon. 2020, 12, 556–611. [Google Scholar] [CrossRef]
- Girshovitz, P.; Shaked, N.T. Fast phase processing in off-axis holography using multiplexing with complex encoding and live-cell fluctuation map calculation in real-time. Opt. Express 2015, 23, 8773–8787. [Google Scholar] [CrossRef]
- Subochev, P.; Spadin, F.; Perekatova, V.; Khilov, A.; Kovalchuk, A.; Pavlova, K.; Kurnikov, A.; Frenz, M.; Jaeger, M. Toward Real-Time Giga-Voxel Optoacoustic/Photoacoustic Microscopy: GPU-Accelerated Fourier Reconstruction with Quasi-3D Implementation. Photonics 2022, 9, 15. [Google Scholar] [CrossRef]
- Pham, H.; Ding, H.; Sohb, N.; Minh, D.; Sanjay, P.; Gabriel, P. Off-axis quantitative phase imaging processing using CUDA: Toward real-time applications. Biomed. Opt. Express 2011, 2, 1781–1793. [Google Scholar] [CrossRef]
- Backoach, O.; Kariv, S.; Girshovitz, P.; Shaked, N.T. Fast phase processing in off-axis holography by CUDA including parallel phase unwrapping. Opt. Express 2016, 24, 3177–3188. [Google Scholar] [CrossRef] [PubMed]
- Popov, S.E. Improved phase unwrapping algorithm based on NVIDIA CUDA. Program. Comput. Softw. 2017, 43, 24–36. [Google Scholar] [CrossRef]
- Darabi, S.; Yousefzadeh-Asl-Miandoab, E.; Akbarzadeh, N.; Falahati, H.; Lotfi-Kamran, P.; Sadrosadati, M.; Sarbazi-Azad, H. OSM: Off-Chip Shared Memory for GPUs. IEEE Trans. Parallel Distrib. Syst. 2022, 33, 3415–3429. [Google Scholar] [CrossRef]
- Horga, A.; Rezine, A. Symbolic identification of shared memory based bank conflicts for GPUs. J. Syst. Archit. 2022, 127, 102518. [Google Scholar] [CrossRef]
- Serrano-Garcia, D.I.; Martinez-Garcia, A.; Toto-Arellano, N.I.; Otani, Y. Dynamic temperature field measurements using a polarization phase-shifting technique. Opt. Eng. 2014, 53, 112202. [Google Scholar] [CrossRef][Green Version]
- Barojas-Gutierrez, E.; Flores-Meneses, C.A.; Meneses-Fabian, C. Carrier frequency by axial displacements of lens and grating in a double-aperture common-path interferometer. Opt. Lasers Technol. 2023, 157, 108691. [Google Scholar] [CrossRef]
- Yang, T.D.; Kim, H.J.; Lee, K.J.; Kim, B.M.; Choi, Y. Single-shot and phase-shifting digital holographic microscopy using a 2-D grating. Opt. Express 2016, 24, 9480–9488. [Google Scholar] [CrossRef]
- Yaghoubi, S.H.S.; Ebrahimi, S.; Dashtdar, M.; Doblas, A.; Javidi, B. Common-path, single-shot phase-shifting digital holographic microscopy using a Ronchi ruling. Appl. Phys. Lett. 2019, 114, 183701. [Google Scholar] [CrossRef]
- Li, J.; Wu, B.; Liu, T.; Zhang, Q. Slightly off-axis interferometry based on spatial-carrier phase-shifting differential method. Opt. Lasers Technol. 2023, 163, 109403. [Google Scholar] [CrossRef]
- Liu, S.; Lian, Q.; Xu, Z. Phase aberration compensation for digital holographic microscopy based on double fitting and background segmentation. Opt. Lasers Eng. 2019, 115, 238–242. [Google Scholar] [CrossRef]
- Du, Y.; Feng, G.; Li, H.; Zhou, S. Accurate carrier-removal technique based on zero padding in Fourier transform method for carrier interferogram analysis. Optik 2014, 125, 1056–1061. [Google Scholar] [CrossRef]
- Singh, M.; Khare, K. Accurate efficient carrier estimation for single-shot digital holographic imaging. Opt. Lett. 2016, 41, 4871–4874. [Google Scholar] [CrossRef] [PubMed]
- Liu, S.; Zhu, W.; Xu, Z.; Gao, M. Automatic and robust phase aberration compensation for digital holographic microscopy based on minimizing total standard deviation. Opt. Lasers Eng. 2020, 134, 106276. [Google Scholar] [CrossRef]
- Tatsuki, T.; Gotohda, T.; Akamatsu, T.; Arai, Y.; Shimobaba, T.; Ito, T.; Kakue, T. High-speed image-reconstruction algorithm for a spatially multiplexed image and application to digital holography. Opt. Lett. 2018, 43, 2937–2940. [Google Scholar]
- Shin, J.G.; Kim, J.W.; Eom, T.J.; Lee, B.H. Frequency domain zero padding for accurate autofocusing based on digital holography. J. Korean Phys. Soc. 2018, 72, 57–65. [Google Scholar] [CrossRef]
- Li, j.; Dang, C.; Chen, Y.; Luo, Q.; Zhao, P.; Zhao, J.; Wang, C. Adaptive spatial filtering based on fuzzy C-means and phase in off-axis digital holographic microscopy. Opt. Eng. 2019, 60, 051207. [Google Scholar] [CrossRef]
- Di, J.; Rajendran, A.; Kariwala, V.; Asundi, A.; Zhao, J. Imaging mechanisms analysis of compact digital holographic microscope for microparticles measurement. Phys. Procedia 2011, 19, 200–206. [Google Scholar] [CrossRef]
- Wu, X.; Gao, W. A general model for resolution of digital holographic microscopy. J. Microsc. 2015, 260, 152–162. [Google Scholar] [CrossRef]
- Doblas, A.; Sanchez-Ortiga, E.; Martinez-Corral, M.; Garcia-Sucerquia, J. Study of spatial lateral resolution in off-axis digital holographic microscopy. Opt. Commun. 2015, 352, 63–69. [Google Scholar] [CrossRef]
- Yang, Z.; Gao, Z.; Yuan, Q.; Ye, J.; Li, M. Radius of curvature measurement based on wavefront difference method by the point diffraction interferometer. Opt. Lasers Eng. 2013, 56, 35–40. [Google Scholar] [CrossRef]
Disclaimer/Publisher’s Note: The statements, opinions and data contained in all publications are solely those of the individual author(s) and contributor(s) and not of MDPI and/or the editor(s). MDPI and/or the editor(s) disclaim responsibility for any injury to people or property resulting from any ideas, methods, instructions or products referred to in the content. |
© 2023 by the authors. Licensee MDPI, Basel, Switzerland. This article is an open access article distributed under the terms and conditions of the Creative Commons Attribution (CC BY) license (https://creativecommons.org/licenses/by/4.0/).