Article

Integrated Seasonal Drought Risk Assessment Under Climate and Land Use Changes for Agricultural Areas Upstream of Pasak Reservoir, Thailand


by
Thanasit Promping
and
Tawatchai Tingsanchali
*
Department of Civil Engineering, Faculty of Engineering at Sriracha, Kasetsart University Sriracha Campus, Chonburi 20230, Thailand
*
Author to whom correspondence should be addressed.
Limnol. Rev. 2026, 26(2), 25; https://doi.org/10.3390/limnolrev26020025
Submission received: 23 April 2026 / Revised: 21 May 2026 / Accepted: 3 June 2026 / Published: 11 June 2026

Abstract

Most previous drought risk assessments have been done on monthly or annual time-scales, which do not directly correspond to crop conditions during wet and dry seasons. To address this limitation, this study introduces a novel framework for seasonal drought risk assessments. The analysis is conducted across multiple temporal periods, including the past (2020s: 2001–2020), near future (2030s: 2021–2040) and far future periods (2050s–2090s: 2041–2100) while considering the combined impacts of land use and climate change scenarios RCP4.5 and RCP8.5. Multi-drought hazard indices were developed to characterize drought conditions and evaluated for dry seasons (November to April) and wet seasons (May to October). Groundwater storage outflow was incorporated into the analysis to reflect its critical role as an alternative water source. Under RCP8.5 in dry seasons, the results show a decrease in drought risks from very high to high from the 2030s to the 2070s followed by an increase toward the 2090s. Meanwhile, in wet seasons under RCP8.5, the results exhibit an increase from very low to low for the 2030s–2090s. Adoption of drought-resistant crop varieties and improvement of irrigation systems in irrigated areas, as well as adaptive irrigation management in non-irrigated areas, were found to reduce drought damage in the future.

1. Introduction

1.1. Conception of Drought and Its Impacts

Drought is a major natural hazard affecting many regions of the world [1,2]. It is typically characterized by prolonged water resource shortages caused by reduced precipitation, soil moisture deficits, declining surface and groundwater availability, crop stress, and disruptions to aquatic ecosystems [3]. These conditions vary in frequency, severity, and impacts and are commonly classified into four main types: meteorological, hydrological, agricultural, and socioeconomic droughts [4].
Beyond environmental impacts, drought also causes significant social and economic consequences [5,6]. Historical records indicate that drought events between 1970 and 2019 caused approximately 650,000 fatalities worldwide and affected around 1.4 billion people between 2000 and 2019 [7]. In addition, droughts triggered global economic losses of approximately USD 124 billion between 1998 and 2017, while the number and duration of drought events have increased by about 29% since 2000 [7]. In Southeast Asia, droughts have affected approximately 115 million hectares of agricultural land, particularly rice, maize, and coconut farming systems, thereby threatening the livelihoods of nearly 45% of the population who depend on these climate-sensitive crops [8].
In Thailand, drought accounts for approximately 48.45% of total natural disasters, followed by floods (24.22%), storms (9.94%), and other hazards such as landslides and earthquakes (7.45%) [9]. One of the most severe drought events occurred during the 2015–2016 monsoon season in the northeastern part of Thailand, which was considered the worst drought in the previous two decades. This event affected 22 provinces and damaged approximately 7.45 million hectares of paddy fields, resulting in agricultural losses of about USD 1.70 billion, with rice production losses alone exceeding USD 2.50 million [10]. More recently, the 2019–2020 drought was reported as the most severe event in the past 40 years. This drought affected 25 provinces and caused agricultural losses of approximately USD 312 million [11]. These events showed that Thailand has a high level of drought risk, vulnerability, and exposure, particularly within the agricultural sector.

1.2. Previous Research and Research Gaps

Numerous studies have investigated drought using meteorological, hydrological, soil moisture, and satellite-derived data to analyze and characterize drought indices [12]. To incorporate temperature and available water content into drought assessment, the Palmer Drought Severity Index (PDSI) was developed to provide a more comprehensive evaluation of drought conditions [13]. Mc Kee at al. [14] introduced the Standardized Precipitation Index (SPI) which is one of the most widely used in global drought monitoring, relying solely on rainfall data to characterize meteorological drought conditions. An advancement of the SPI is the Standardized Precipitation Evapotranspiration Index (SPEI), which incorporates both rainfall and temperature data to better capture the influence of climate variability and evapotranspiration on drought dynamics [15]. For hydrological drought assessment, the Standardized Reservoir Supply Index (SRSI) has been applied in areas that rely heavily on reservoir water resources [16]. In addition, the Standardized Runoff Index (SRI) was developed to represent hydrological drought conditions based on streamflow availability [17].
Reports from the World Meteorological Organization (WMO) and the Global Water Partnership (GWP) recommend the use of composite or hybrid approaches that integrate multiple drought indices to improve drought monitoring and assessment [18]. Such approaches have been increasingly applied in previous studies, particularly in Thailand. For example, the Composite Drought Hazard Index (CDHI) developed for the Wang River Basin integrates the SPEI and SRI to capture both meteorological and hydrological drought conditions in hilly regions [19]. More recently, the Multiple Drought Hazard Index (MDHI) was developed for large flat areas in Sukhothai Province, northern Thailand. This index integrates the SPI, the SRI, the Standardized Groundwater Index (SGI), and the Normalized Difference Moisture Index (NDMI) to provide a comprehensive representation of drought conditions [6]. However, previous studies have primarily focused on either hilly or flat terrain separately. In this study, the upstream sub-watersheds of the Pasak Reservoir consist of a complex landscape combining narrow mountainous areas and small flat plains. Therefore, an integrated drought hazard assessment is required to capture the spatial heterogeneity of drought conditions in such mixed-terrain watersheds. This study proposes an integrated drought hazard assessment using the SPI, SPEI, and groundwater storage outflow (GWSO) to evaluate both past and future drought conditions.
Moreover, extensive research on climate change, socio-economic development, and environmental dynamics has significantly advanced our understanding of changes in drought hazard, exposure, vulnerability, and risk under both historical and future climate conditions [20,21]. These studies have also highlighted key drought characteristics, including severity, frequency, duration, and spatial extent, under projected climate change scenarios [22,23,24]. For example, projections for Thailand indicate that northern and northeastern regions are expected to experience the highest drought intensities, posing substantial threats to agricultural areas and increasing the vulnerability of these regions as climate change hotspots [25]. Given that the upstream sub-watersheds of the Pasak Reservoir are located between the northern and northeastern regions of Thailand, the area is expected to be highly vulnerable to future drought conditions under climate change. In addition to climate change, land use change is also a significant driver influencing drought dynamics and therefore needs to be considered alongside climatic factors [26]. Consequently, investigating the combined impacts of climate change and land use change on drought dynamics in this region is essential for improving drought risk management and developing effective adaptation strategies.

1.3. Objectives and Scope of the Study

The objectives of this study are as follows:
  • To assess future patterns of climate change and land use change in the study area.
  • To develop and determine a seasonal Multi-Drought Hazard Index (M-DHI) by integrating meteorological and hydrological drought indicators.
  • To analyze and quantify the Drought Risk Index (DRI) for the agricultural economic sector based on hazard, vulnerability, and exposure.
  • To evaluate potential drought adaptation measures, with particular emphasis on dry seasons.
The scope of this study focuses on assessing past, present, and future drought risks and their associated economic damage in agricultural areas located within the upstream sub-watersheds of the Pasak Reservoir. The analysis considers the combined impacts of climate change and land use change on drought dynamics and agricultural vulnerability. However, due to limited data, social vulnerability is not explicitly included in this study.

2. Material and Methodology

2.1. Study Area

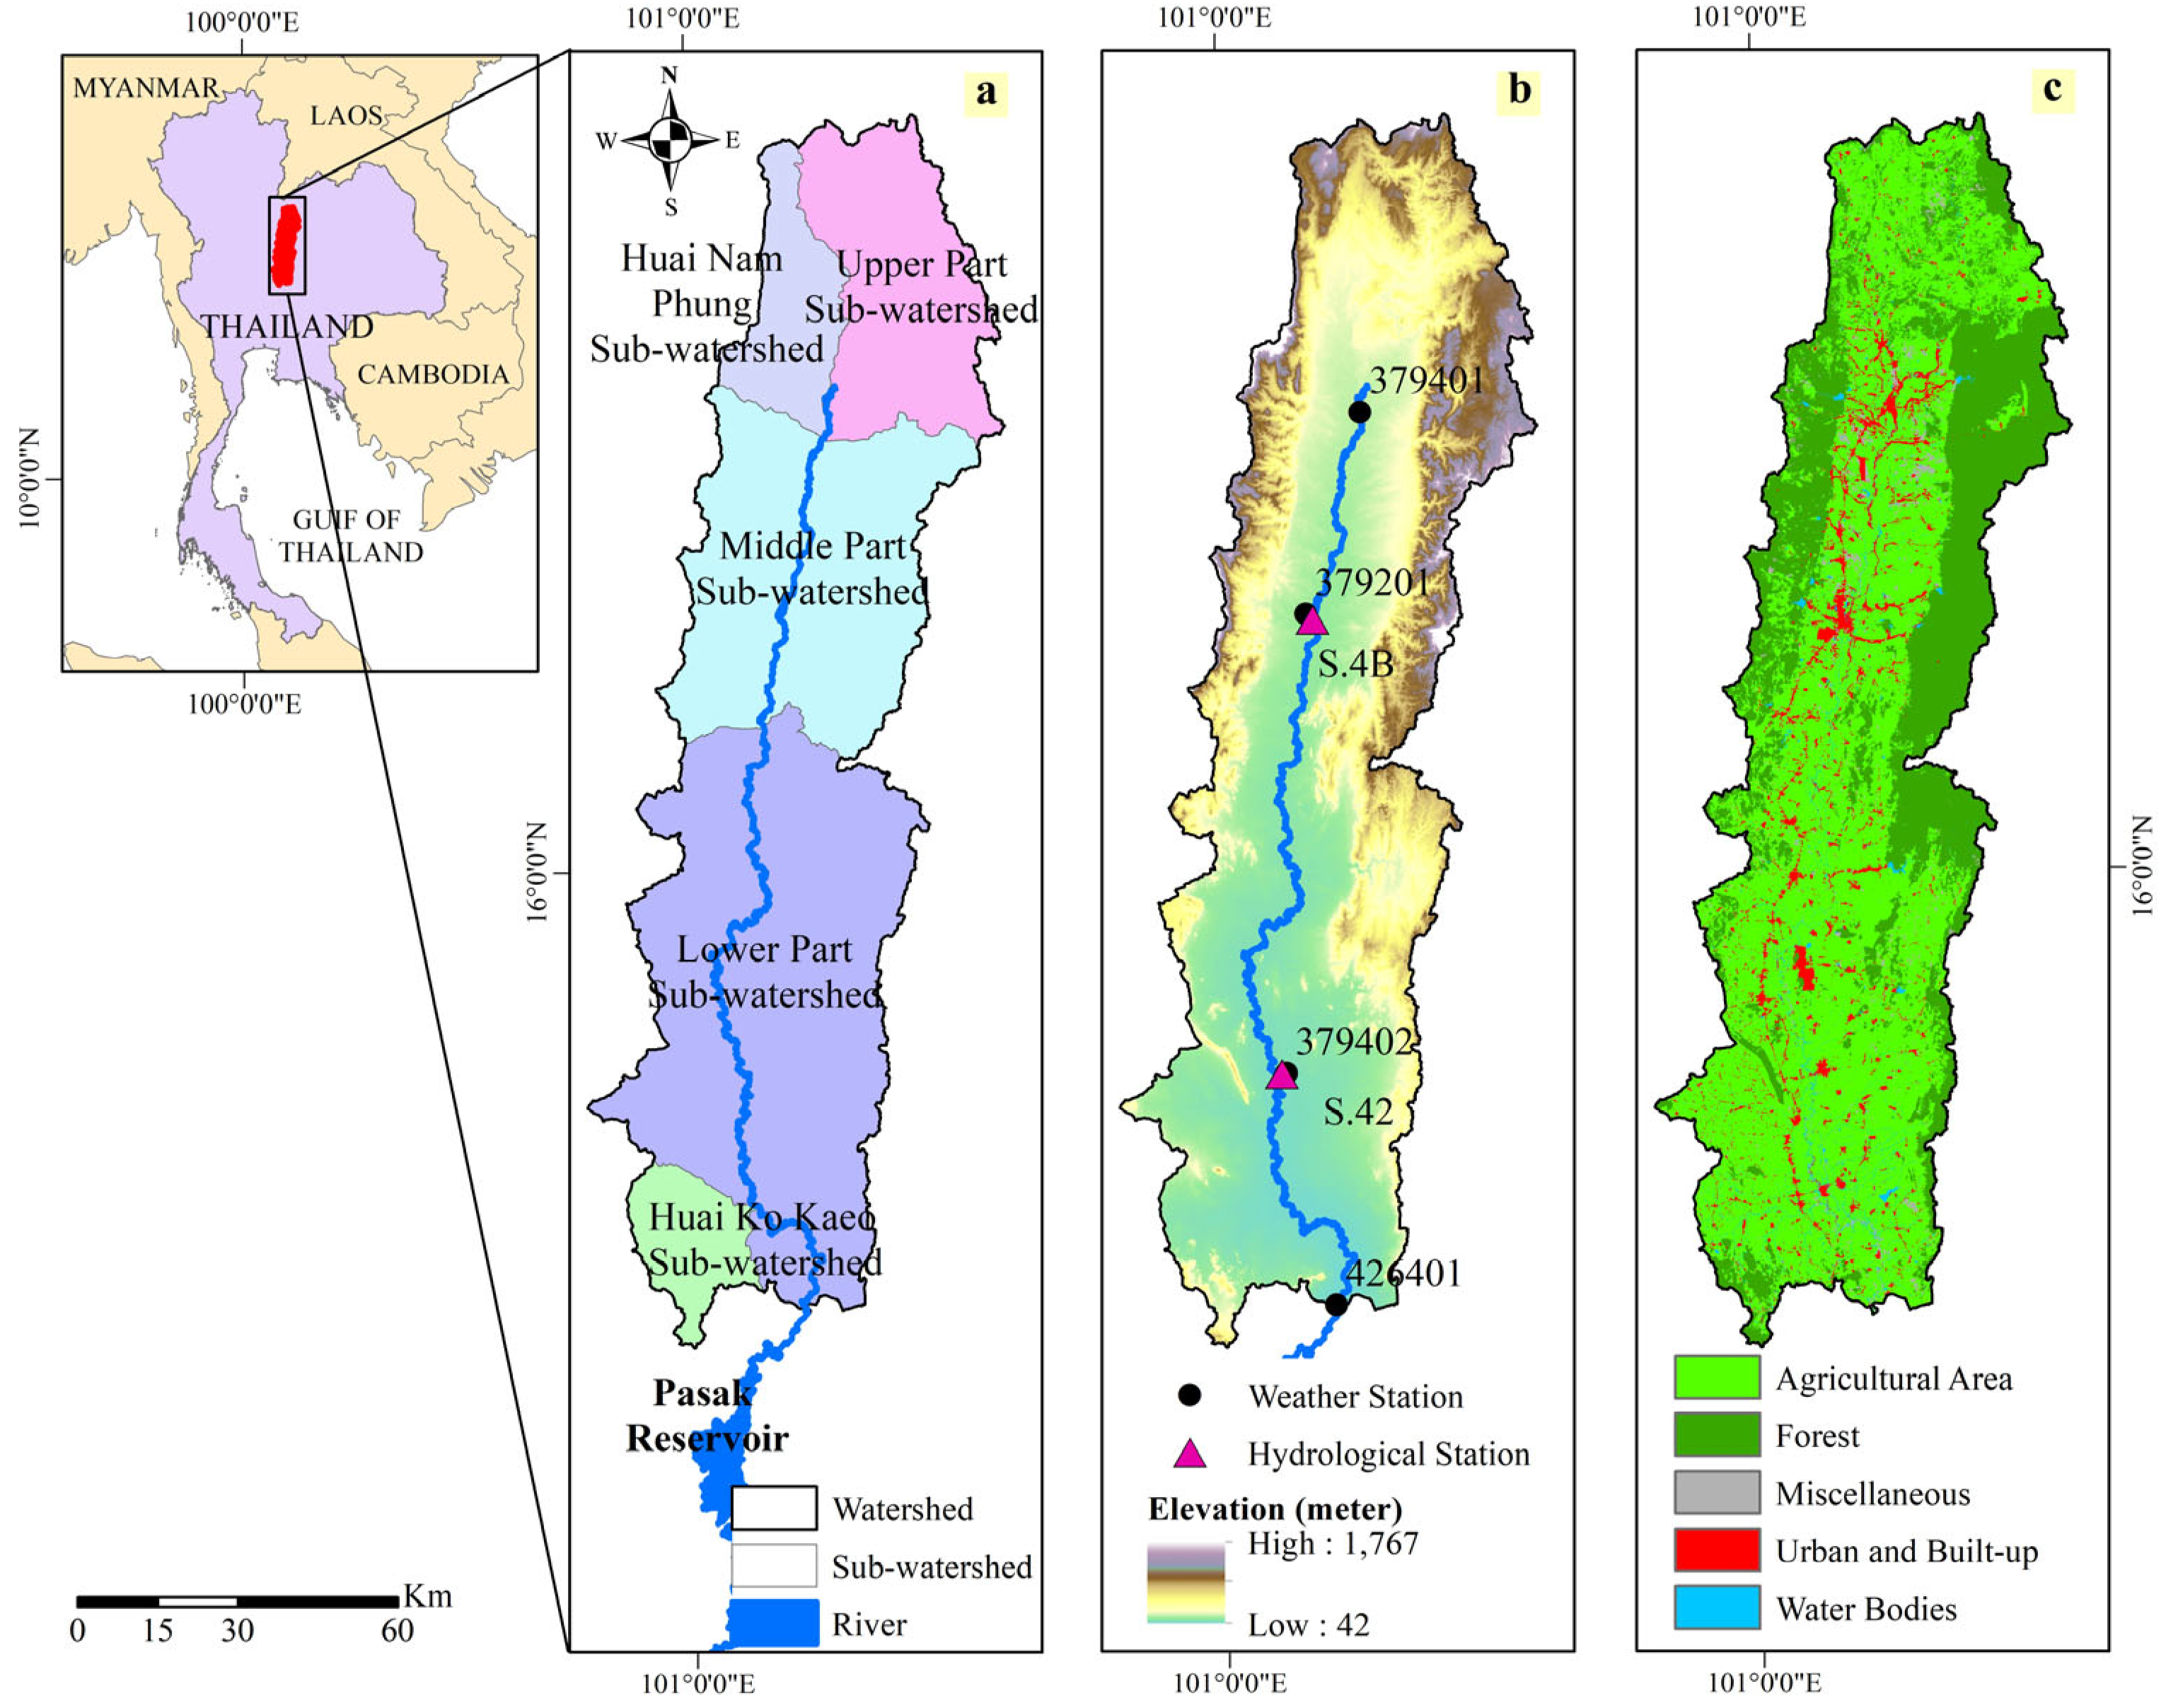
The study area covers the five upstream sub-watersheds of the Pasak Reservoir, located between the northern and central regions of Thailand. The sub-watersheds extend across four provinces: Loei, Phetchabun, Chaiyaphum, and Lopburi [27]. However, the majority of the study area is situated in Phetchabun Province, covering approximately 8493.38 km2 (5,308,364 rai). The Pasak River originates from the Loei–Phetchabun mountain ranges and flows southward through Loei, Phetchabun, and Lopburi provinces. These five sub-watersheds are (a) the “Upper Part” sub-watershed, (b) the “Huai Nam Phung” sub-watershed, (c) the “Middle Part” sub-watershed, (d) the “Lower Part” sub-watershed, and (e) the “Huai Ko Kaeo” sub-watershed, as illustrated in Figure 1a. It is noted that the following conversion rates are used throughout this article: an area of 1 rai = 0.0016 km2 and in monetary terms 1 Baht = 0.028 USD.
Topographically, the Upper Part and Huai Nam Phung sub-watersheds have mainly hilly and sloping terrain with elevations ranging from approximately 110 to 115 m above mean sea level (MSL). The Middle Part sub-watershed, the Lower Part sub-watershed, and the Huai Ko Kaeo sub-watershed are characterized by extensive flat plains with elevations ranging from 45 to 60 m MSL (Figure 1b) [27]. Regarding land use patterns, agricultural and forest areas dominate all upstream sub-watersheds, covering approximately 5671 km2 (59.90%) and 2999 km2 (31.69%) of the total area, respectively. Urban and built-up areas occupy about 484 km2 (5.11%), while miscellaneous land and water bodies account for approximately 164 km2 (1.73%) and 149 km2 (1.57%), respectively (Figure 1c). Within the agricultural sector, field crops represent the dominant land use. Paddy fields, maize, sugarcane, and cassava cover approximately 1621.24 km2 (28.58% of agricultural land), 1214.62 km2 (21.42%), 1369.72 km2 (24.15%), and 425.65 km2 (7.51%), respectively. Tamarind plantations represent the primary orchard crop in the area, covering approximately 333.94 km2 (5.89%), and constitute an important agricultural export product of the region.
Climatically, the sub-watersheds receive an average annual rainfall of approximately 1129.4 mm, with a mean annual temperature of about 27.0 °C. Drought events in Thailand are generally associated with two seasonal periods: the wet seasons (May to October) and the dry season (November to April). April is typically the hottest month of the year, which has increased the probability of drought occurrences in recent decades. In contrast, December generally experiences low rainfall and reduced river discharge.

2.2. Material

2.2.1. Climate and Hydrological Time Series Data

The climate data used in this study consist of daily and monthly observed time series of rainfall, maximum temperature, and minimum temperature obtained from six meteorological stations operated by the Thai Meteorological Department (TMD), Thailand. These stations include Phetchabun (379201) or S.4B, Lom Sak (379401), Wichian Buri (379402), Lopburi (426201), Bua Chum (426401), and Pak Chong Agrometeorological Station (431301), covering the period 1970–2024 [28].
Future climate projections were obtained from three Regional Climate Models (RCMs): ACCESS-CSIRO-CCAM, CNRM-CM5-CSIRO-CCAM, and MPI-ESM-LR-CSIRO-CCAM. These models were developed through collaborations involving the Collaboration for Australian Weather and Climate Research (Australia), the National Centre for Meteorological Research (France), and the European Network for Earth System Modeling, respectively [29]. Climate projections were analyzed under two Representative Concentration Pathways (RCPs), namely RCP4.5 and RCP8.5, for the period 1970–2100.
Hydrological data used in this study include observed streamflow discharge records from 2003 to 2024, obtained from the Royal Irrigation Department (RID), Thailand. The data were collected at two hydrological stations, Mueang Phetchabun (S.4B) and Wichian Buri (S.42), which are located in the middle and lower parts of the study area, respectively.

2.2.2. Spatial Data

Land use data were obtained from the Land Development Department (LDD), Thailand, for the years 2012, 2016, 2018, and 2021. These datasets were used to analyze historical land use patterns and to support land use change projections.
Additional spatial variables were incorporated to improve land use change modeling, including population density, a digital elevation model (DEM), distance to city centers, distance to roads, distance to rivers, slope, aspect, and soil type. The DEM data were derived from the ASTER Global Digital Elevation Model (ASTER GDEM) with a spatial resolution of 30 m × 30 m.
Groundwater data were obtained from the Department of Groundwater Resources (DGR), Thailand. Groundwater storage outflow or yield is defined as the allowable outflow rate of groundwater that can be extracted from a well without causing long-term adverse impacts for the groundwater system. The GWSO was classified into four categories including less than 2 m3/h, 2–10 m3/h, and 10–20 m3/h, based on the dataset collected in 2017.

2.3. Methodology

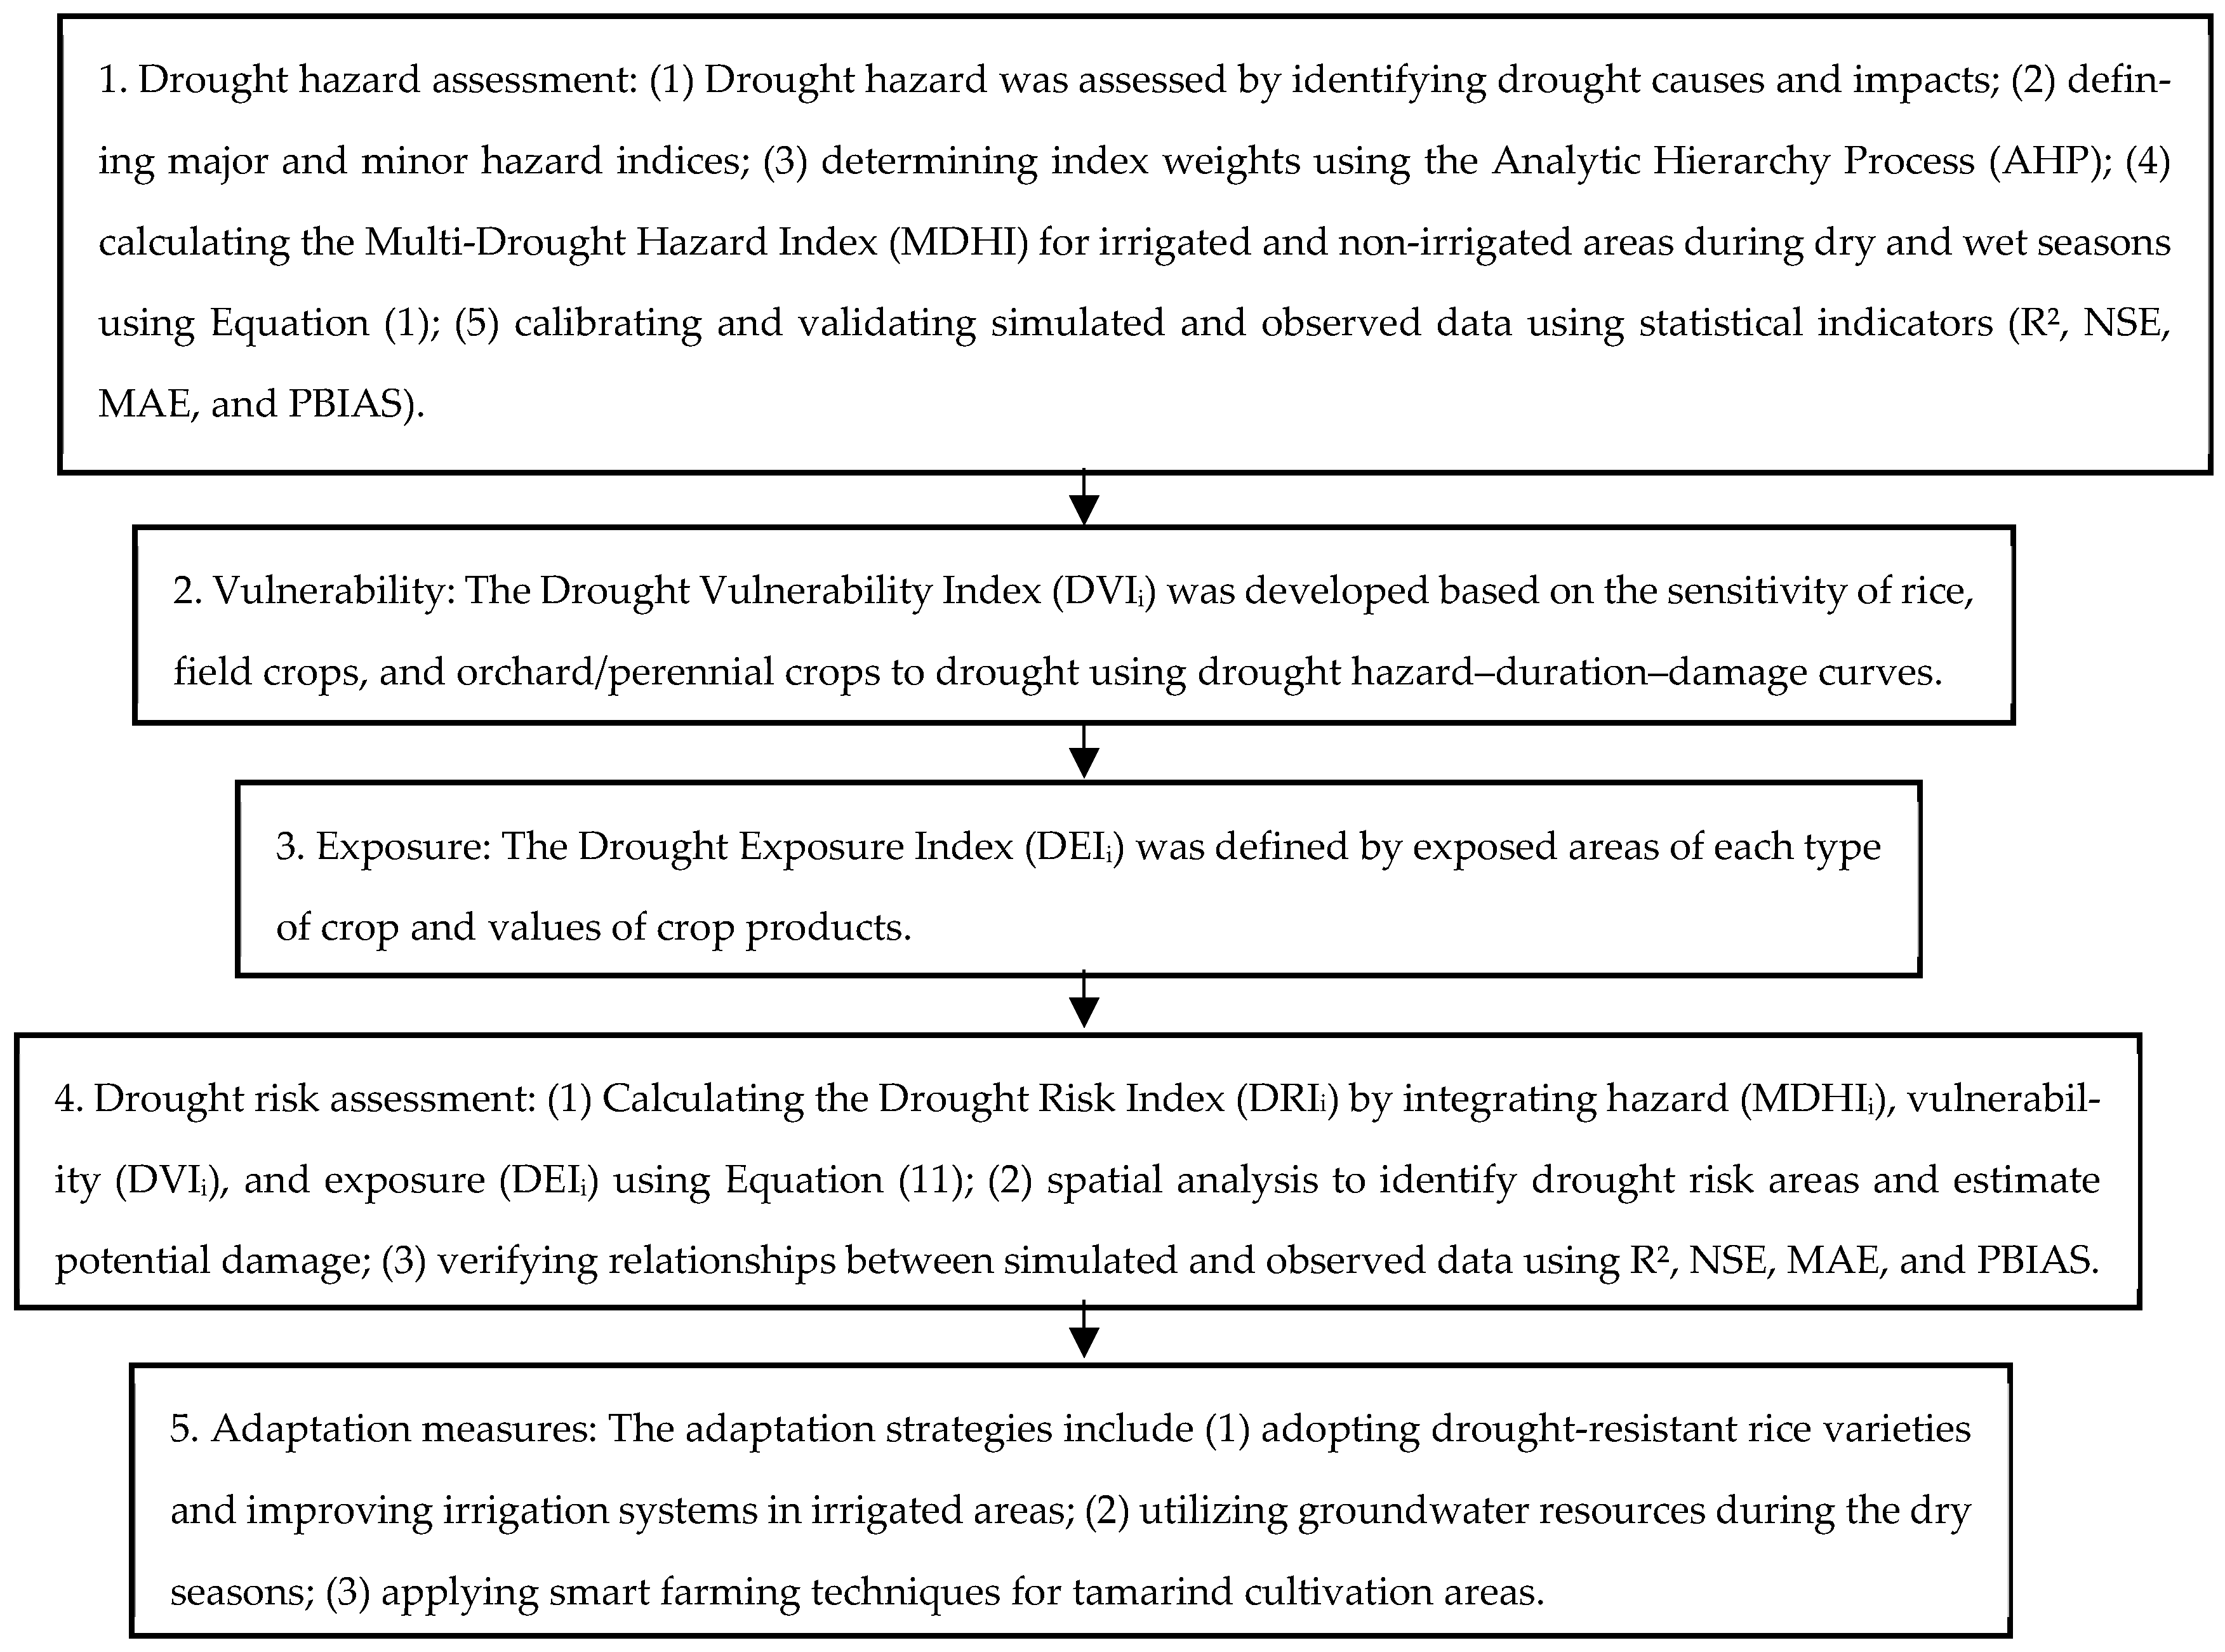
The seasonal drought risk assessment for agricultural areas in this study follows the risk concept integrating hazard, vulnerability, and exposure [5] as shown in Figure 2. However, the potential drought damage varies depending on location, crop type, and crop growing season [30]. In this study, a novel Multi-Drought Hazard Index (MDHI) was developed for both the dry and wet seasons to represent multiple drought types and to better explain the complex drought conditions in the study area.

2.3.1. Computation of Drought Hazard Assessment

The drought hazard assessment was based on a composite drought index integrating meteorological and hydrological drought conditions, which represent the major drought types affecting agricultural areas [19]. In this study, the Standardized Precipitation Evapotranspiration Index (SPEI), Groundwater Storage Outflow (GWSO), and the Standardized Runoff Index (SRI) were combined using different seasonal weighting factors to reflect variations in drought characteristics [30]. Soil moisture-based indices were excluded from this analysis because crop water use in the study area primarily depends on surface and subsurface water resources during the dry season and on rainfall during the wet season. In the dry season, soil moisture has relatively limited importance, as rainfed paddy fields are absent in non-irrigated areas, and field crops and orchards can access shallow groundwater through their root systems. During the wet season, rainfed paddy fields, field crops, and orchards rely mainly on rainfall, thereby reducing the relative influence of soil moisture conditions. Furthermore, the lack of consistent, high-resolution soil moisture data constrains its applicability in this study.
A Multi-Drought Hazard Index (M-DHI) was developed by integrating these individual hazard indices, as expressed in Equation (1).
NM−DHI = ∑Wi × NDHIi
where M-DHI is the Multi-Drought Hazard Index; Wᵢ is the weighting factor of each drought indicator, e.g., WSRI, WGWSO, and WSPEI; NDHIᵢ is the Normalized Drought Hazard Index; and i is the SRI, GWSO, and SPEI.
The SRI and SPEI values were classified into five drought severity categories: non-drought (NDHI = 0.20), mild drought (NDHI = 0.40), moderate drought (NDHI = 0.60), severe drought (NDHI = 0.80), and extreme drought (NDHI = 1.00). The GWSO factor was classified based on potential groundwater flow at four levels: very high (NDHI = 1.00), high (NDHI = 0.75), medium (NDHI = 0.50), and low (NDHI = 0.25) [31].
The resulting M-DHI values were further classified into five drought hazard levels: very low hazard (0 < MDHI ≤ 0.20), low hazard (0.20 < MDHI ≤ 0.40), medium hazard (0.40 < MDHI ≤ 0.60), high hazard (0.60 < MDHI ≤ 0.80), and very high hazard (0.80 < MDHI ≤ 1.00). All weighting factors presented in Table 1 were derived using the Analytic Hierarchy Process (AHP). The hazard maps were calibrated and validated for the periods 2011–2020 and 2021–2024 using the coefficient of determination (R2), Nash–Sutcliffe Efficiency (NSE), mean absolute error (MAE), and Percentage Bias (PBIAS) [6].

2.3.2. Bias Correction for Climate Change Projection

The linear scaling technique is a simple and efficient method [32] used to correct and adjust projected climate data [33,34]. This technique is divided into two steps: (i) the computation of monthly scaling rainfall factors (Xm), calculated from the average monthly ratio of observed daily rainfall to simulated daily rainfall, as shown in Equation (2), and monthly scaling temperature factors (Ym), calculated from the average monthly difference between observed and simulated daily temperature, as shown in Equation (4); (ii) the application of Ym and Xm to correct rainfall and maximum/minimum temperatures by adjusting simulated data to obtain bias-corrected rainfall and temperature, as shown in Equations (3) and (5). Equations (2) and (4) are derived using observed and simulated daily data during the historical period, while Equations (3) and (5) are applied to correct simulated data for both historical and future periods. The corrected simulated daily rainfall and temperature data were then compared with observed data during the historical period for validation [35].
For this study, observed climate data were collected from TMD, while simulated data were obtained from three regional climate models (RCMs)—ACCESS-CSRO-CCAM [36], CNRM-CM5-CSIRO-CCAM [37], and MPI-ESM-CSIRO-CCAM [38]—under two RCP scenarios (RCP4.5 and RCP8.5), representing medium and high greenhouse gas emissions [33]. The historical and future periods cover 1970–2005 and 2006–2100, respectively.
X m = a v e r a g e ( R o b s ,   d R s i m , d ) m
R s i m , d = R s i m ,   d × X m
For temperature bias correction;
Y m = a v e r a g e ( T o b s , d T s i m , d ) m
T s i m , d = T s i m ,   d + Y m
where R is rainfall, T is temperature, X m and Y m are monthly scaling factors for rainfall and temperature, o b s and s i m are observed and simulated data, and d and m denote daily and monthly units.
For model performance, both corrected simulated and observed data during the historical period were compared and analyzed using R2, mean, standard deviation (SD), and root mean square error (RMSE) to assess the central tendency and dispersion of the bias-corrected data [12,39]. After this process, the corrected climate data were used for future analysis for the period 2006–2100.

2.3.3. Land Use Change Projection

The Future Land Use Simulation (FLUS) model was used to simulate and analyze land use projection scenarios under the combined influence of human and natural factors [40]. This model is implemented in a graphical user interface (GUI)-based software called GeoSOS-FLUS version 2.4, as described by Liu et al. [40] and Liang et al. [41]. It integrates a multi-cellular automata (CA) allocation framework with an artificial neural network (ANN) to simulate land use change and analyze various scenarios [19]. This model is widely used for predicting urban expansion, land use planning, and land use changes under climate change impacts. However, model performance evaluation commonly uses Cohen’s Kappa coefficient (K), as shown in Equation (6). A value of K = 1 indicates perfect agreement between observed and simulated data, while K = 0 indicates no agreement.
For this study, past land use data from 2012 to 2021 were used to determine land use change trends. The land use was classified into five categories: agricultural land, urban and built-up land, forest land, water bodies, and miscellaneous land. This pattern was then used to project future land use at a spatial resolution of 30 × 30 m for the period 2022–2100.
K = Pr ( a ) P r ( e ) 1 Pr ( e )
where Pr ( a ) is the observed relative agreement and Pr ( e ) is the probability of agreement occurring by chance [42].

2.3.4. Hydrological Model

The HEC-HMS is a program used to simulate the complete rainfall–runoff process, including flow forecasting, erosion and sediment transport, and water quality within watershed areas [43]. The model applies traditional hydrologic analysis procedures, such as event-based infiltration, unit hydrographs, and hydrologic routing. In this study, HEC-HMS version 4.11 was used to simulate streamflow from sub-watersheds based on rainfall inputs under different projected climate and land use scenarios. The model requires detailed input data, including weather variables (rainfall and temperature), soil characteristics, topography, and land use data from 2003 to 2023 for model setup. Prior to model application, the model was calibrated and validated using performance indicators such as R2, NSE, MAE, and PBIAS, through comparison between observed and simulated data [39,44].

2.3.5. Computation of Standardized Precipitation Evapotranspiration Index (SPEI)

The SPEI is an extension of the Standardized Precipitation Index (SPI) that incorporates temperature data to estimate potential evapotranspiration (PET), as developed by Vicente-Serrano et al. [15]. This index accounts for the effect of temperature on drought conditions through a climatic water balance approach [18]. The SPEI ranges from +3 to −3, representing wet and dry conditions, respectively. The index is calculated using the standardized form shown in Equation (7):
S P E I =   D i D ¯ S D
where D i represents the monthly difference between precipitation and potential evapotranspiration, D ¯ is the long-term average of D i , and S D is the standard deviation.
The value of D i is calculated from monthly precipitation and potential evapotranspiration ( P E T i ) using the Thornthwaite method [45], as shown in Equation (8):
D i = P i P E T i
For this study, monthly rainfall and temperature data from 1970 to 2100 were used to compute the SPEI at 1-, 3-, and 6-month timescales, using the SPEI and SRI packages implemented in the RStudio version 2024.12.1 [46].

2.3.6. Computation of Standardized Runoff Index (SRI)

The SRI is a hydrological drought indicator [17] that is based on the conceptual framework of the SPI introduced by McKee et al. [14]. In contrast to the SPI, the SRI uses runoff (river discharge) data for its calculation. It is computed by subtracting the mean runoff from the observed runoff and dividing by the standard deviation, as shown in Equation (9) [47].
S R I = x i x ¯ S D
where   x i is the monthly runoff in month i , x ¯ is the long-term average monthly runoff, and S D is the long-term standard deviation. In this study, monthly runoff data from 2001 to 2100, obtained from the HEC-HMS model, were used for SRI calculation.

2.3.7. Computation of Weighting Factors Using Analytic Hierarchy Process (AHP)

The Analytic Hierarchy Process is a multi-criteria decision-making method used to determine the relative weights of elements and parameters in complex decision-making problems, as developed by Saaty [48,49]. In this study, the AHP technique was employed to assign weights to three drought hazard indices such as the SRI, GWSO, and SPEI for both irrigated and non-irrigated areas under dry and wet seasonal conditions. This approach is consistent with previous applications of AHP in drought hazard assessment. The AHP procedure follows the following methodology [50]: (i) defining the parameters or indices related to drought hazard; (ii) conducting pairwise comparisons using a fundamental scale (typically 1 to 9) to evaluate the relative importance of each element [49]; (iii) calculating the priority weights for each parameter or index; and (iv) checking the consistency of the judgments to ensure the reliability of the method and the derived weights.

2.4. Determination of Vulnerability

Drought vulnerability refers to the degree to which elements are susceptible to adversely potential damage when facing drought events [51,52]. It is analyzed using single or composite indicators derived from social, economic, and environmental data. In this study, vulnerability is assessed for the economic sector, based on expected agricultural losses across various crop types, including rice, field crops, orchards, and perennial trees. The Normalized Drought Vulnerability Index (NDVI) for the economic sector was calculated based on damage percentage, derived from the drought hazard–duration–damage curve [6]. The vulnerability levels were classified into six categories: non-vulnerable, very low, low, medium, high, and very high vulnerability.

2.5. Determination of Exposure

Exposure refers to the number of elements and assets subject to drought hazards [51]. It is analyzed based on the quantity and spatial distribution of human populations, infrastructure, economic activities, and ecosystems. In this study, the focus is on the agricultural economic sector, where crop income (Baht/rai) for each crop type is used as a proxy to represent the number of exposed elements that may lead to reductions in crop yield and result in significant economic losses. All exposure values were classified into six levels of exposure—none, very low, low, medium, high, and very high—corresponding to normalized values of 0.00, 0.20, 0.40, 0.60, 0.80, and 1.00, respectively. The classification was applied to paddy fields, field crops, and orchard/perennial land, as shown in Table 2.

2.6. Computation of Drought Risk Assessment

Drought risk refers to the potential damage and losses caused by drought, expressed as a function of hazard, exposure, and vulnerability, following the concept of the Sendai Framework for Disaster Risk Reduction and the World Bank [5,51,53], as shown in Equation (10).
Risk = f(Hazard, Vulnerability, Exposure)
This study assessed drought risk with a focus on impacts on the agricultural economic sector, using three indices: the Normalized Multi-Drought Hazard Index (NM-DHIi), the Normalized Drought Vulnerability Index (NDVIi), and the Normalized Drought Exposure Index (NDEIi). These components were integrated to calculate the Normalized Drought Risk Index (NDRIi), as shown in Equation (11).
NDRI i = NM DHI i × NDVI i × NDEI i
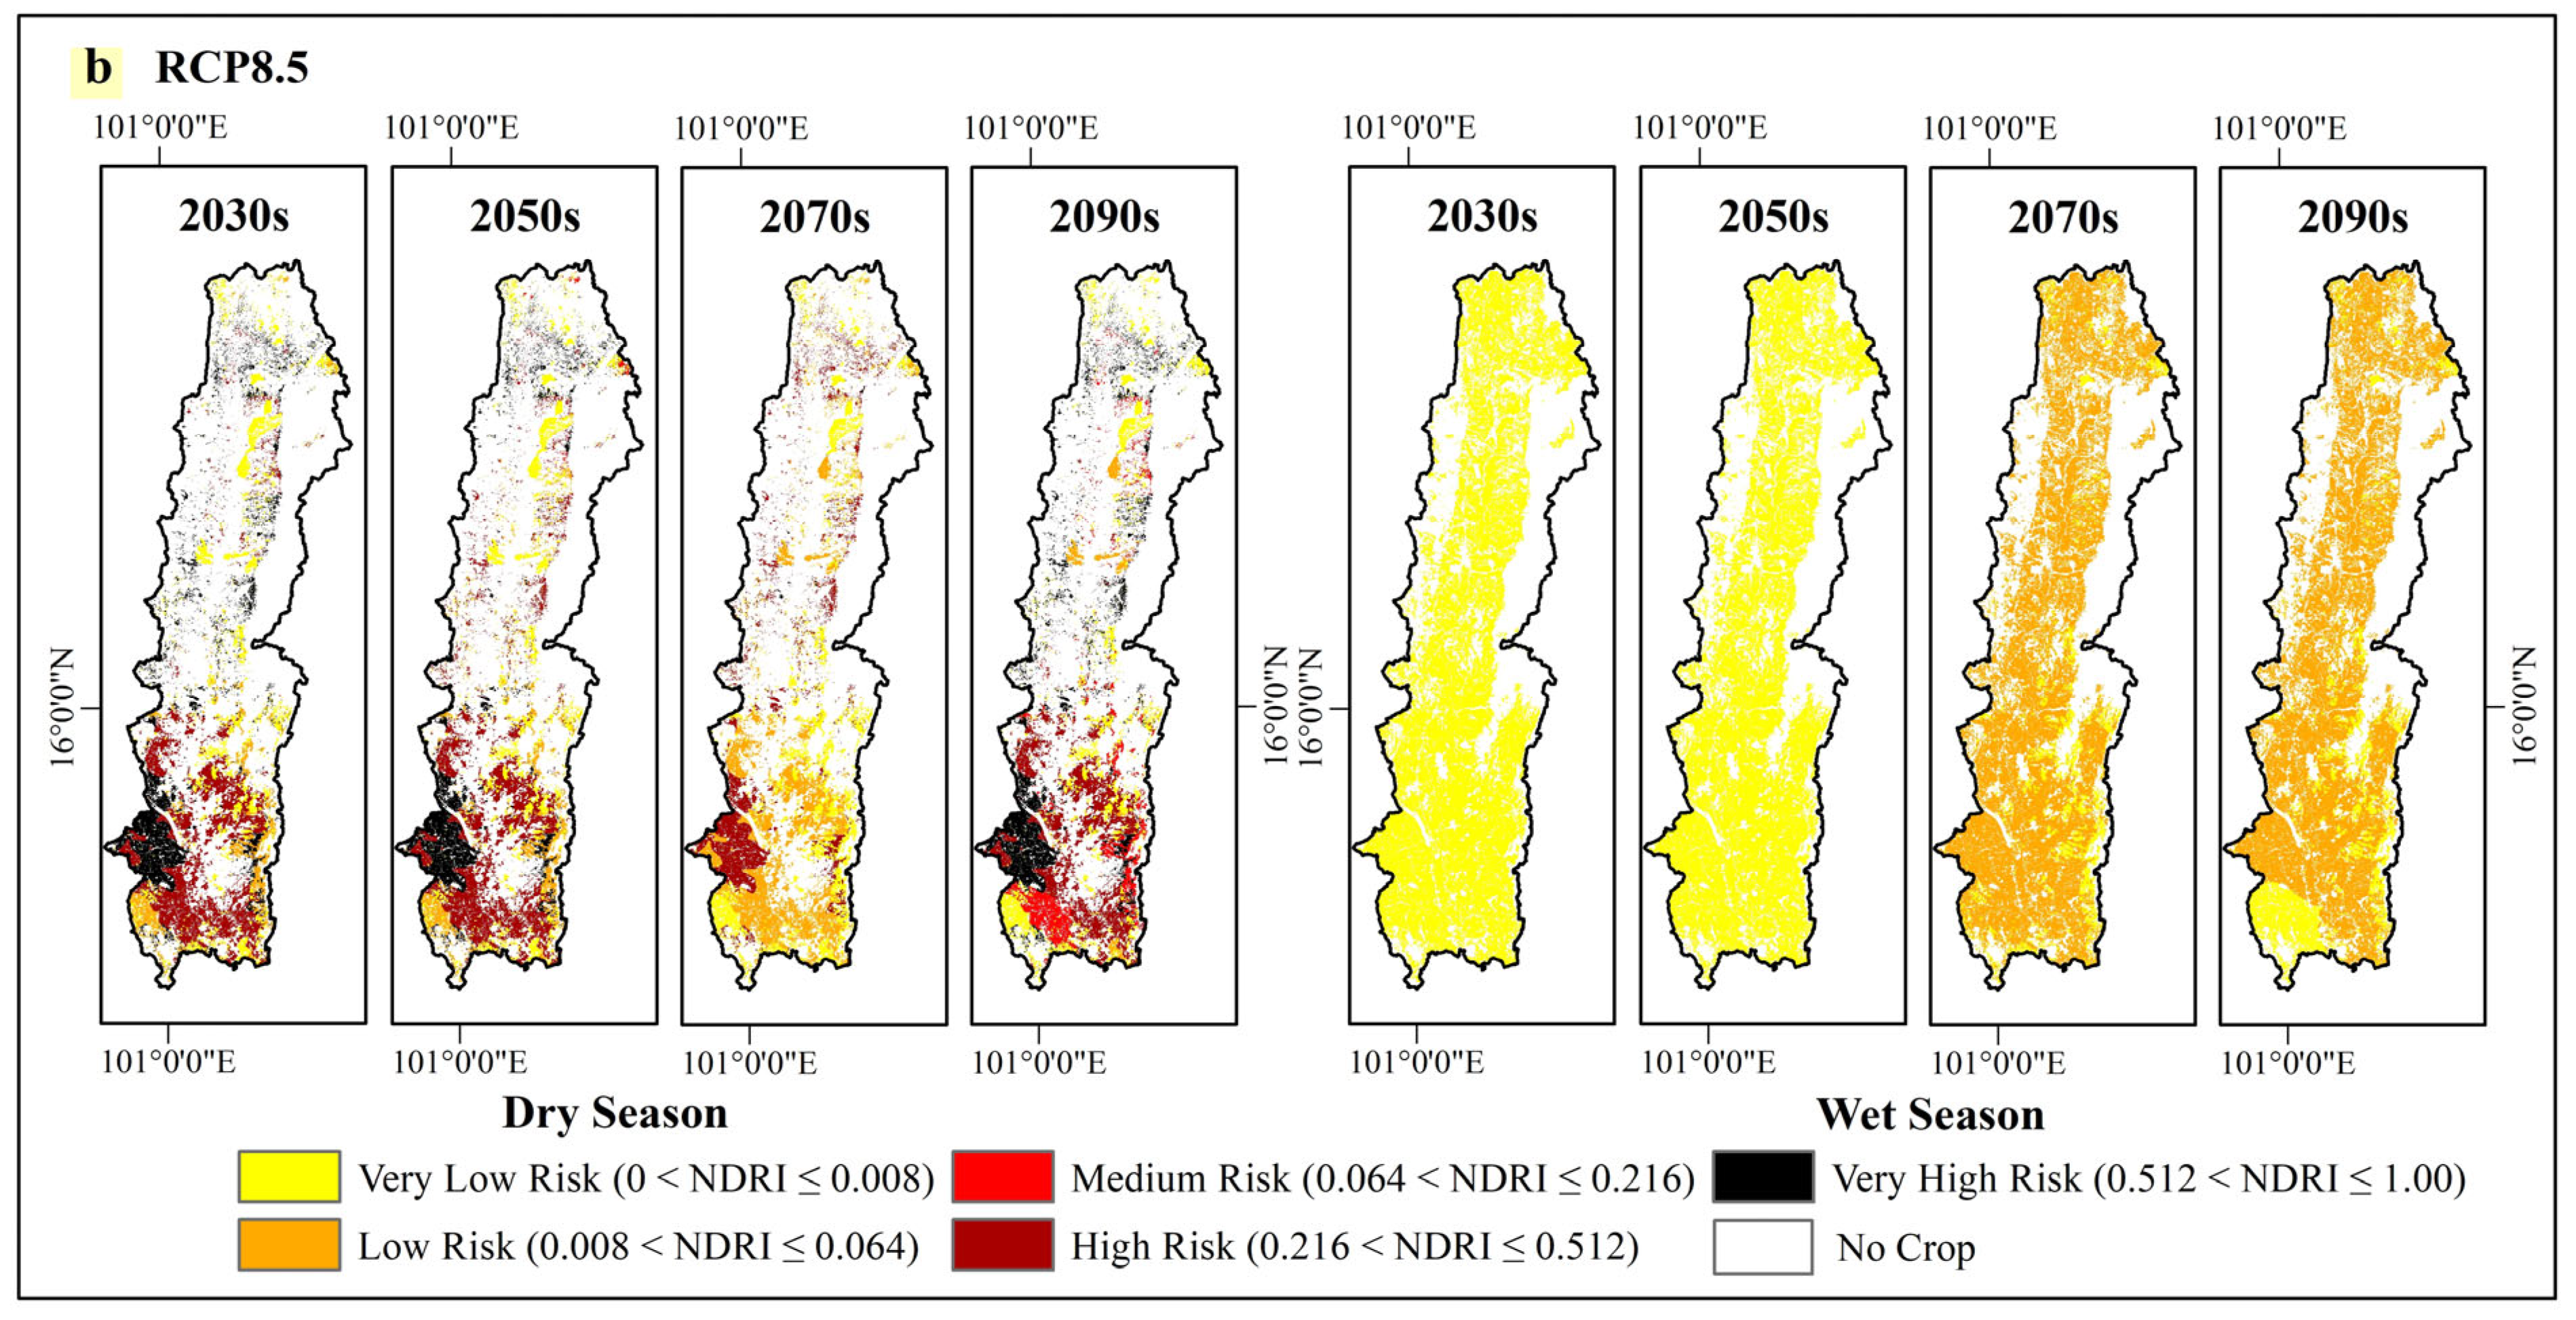
The NDRI was classified into six risk levels: no risk (NDRI ≤ 0), very low risk (0 < NDRI ≤ 0.008), low risk (0.008 < NDRI ≤ 0.064), medium risk (0.064 < NDRI ≤ 0.216), high risk (0.216 < NDRI ≤ 0.512), and very high risk (0.512 < NDRI ≤ 1.00). The model performance was evaluated using statistical indicators, including R2, NSE, MAE, and PBIAS [6].

2.7. Determination of Drought Adaptation Measures

Drought adaptation refers to adjustments in ecological, social, and economic systems to reduce the impacts of drought through modifications in practices, processes, and management strategies specific to a given region [54]. In this study, three adaptation scenarios were selected to mitigate drought risk: (Scenario 1) Adoption of drought-resistant rice varieties and improvement of irrigation systems in irrigated areas—this scenario promotes the use of drought-resistant rice varieties as a key adaptation measure for paddy fields. Previous studies have shown that improved rice varieties can reduce yield losses by up to 50% under drought conditions [55]. In addition, improving irrigation systems and constructing small reservoirs can enhance water availability and reduce potential agricultural losses [6]. (Scenario 2) Utilization of groundwater resources—groundwater is considered an alternative water source for domestic and agricultural use [56]. However, only areas in close proximity to existing groundwater wells are considered suitable for effective agricultural support, based on established guidelines [6,57]. (Scenario 3) Adaptive irrigation management using smart farming technologies for tamarind cultivation—this scenario focuses on improving irrigation efficiency in non-irrigated areas, particularly for tamarind cultivation, through the application of information and communication technologies (ICTs) and smart farming technologies. The use of drip irrigation systems is recommended to optimize water use and improve irrigation performance [58,59,60]. These adaptation measures are evaluated based on their effectiveness in reducing drought-affected areas and economic losses in both irrigated and non-irrigated agricultural systems.

3. Results

3.1. Climate Change Projection

Climate projections from three regional climate models (RCMs)—ACCESS, CNRM, and MPI—under two emission scenarios (RCP4.5 and RCP8.5) were analyzed using daily rainfall, maximum temperature, and minimum temperature. The data were divided into historical (1970–2005) and future (2006–2100) periods. For the historical period, observed and simulated daily climate data from six meteorological stations (379201, 379401, 379402, 426201, 426401, and 431301) were bias-corrected using the linear scaling method, applying Equations (2) and (3) for rainfall and Equations (4) and (5) for temperature. Model performance was evaluated using R2, mean, SD, and RMSE. The results showed that the three RCMs reproduced observed climate patterns reasonably well, with R2 and mean values close to the observed data. Rainfall variability (SD) was slightly underestimated, whereas temperature variability was slightly overestimated. RMSE values were moderately higher than the observed data but remained within acceptable ranges, indicating satisfactory model performance for future climate projections.
Future climate projections from the three RCMs were averaged into four time slices: 2030s, 2050s, 2070s, and 2090s (Table 3). The projected annual rainfall under RCP4.5 and RCP8.5 was approximately 1045.01 and 1086.69 mm in the 2030s, 1091.34 and 1085.14 mm in the 2050s, 1072.71 and 1055.74 mm in the 2070s, and 1076.57 and 1053.94 mm in the 2090s, respectively. These values are generally lower than the observed annual rainfall (1174.83 mm) in the 2010s, indicating a decreasing rainfall tendency in the future. Temperature projections show a consistent increasing trend. Under RCP4.5, the average maximum and minimum temperatures increase from 34.62 and 22.99 °C in the 2030s to 35.59 and 23.95 °C in the 2090s. Under RCP8.5, the increase is more pronounced, rising from 34.66 and 23.17 °C in the 2030s to 37.59 and 25.90 °C in the 2090s, which is significantly higher than the observed values of 33.86 and 22.63 °C in the 2010s.
Seasonal analysis indicates that rainfall will decrease in both seasons. During the dry seasons, rainfall will decrease from 177.86 mm in the 2010s to 157.25 mm (RCP4.5) and 165.35 mm (RCP8.5) by the 2090s. During the wet seasons, rainfall will decline from 996.97 mm to 919.32 mm (RCP4.5) and 888.58 mm (RCP8.5) by the 2090s. Temperature will increase in both seasons, with RCP8.5 showing stronger warming than RCP4.5. In addition, maximum temperatures are generally higher during the dry seasons, while minimum temperatures are higher during the wet seasons.
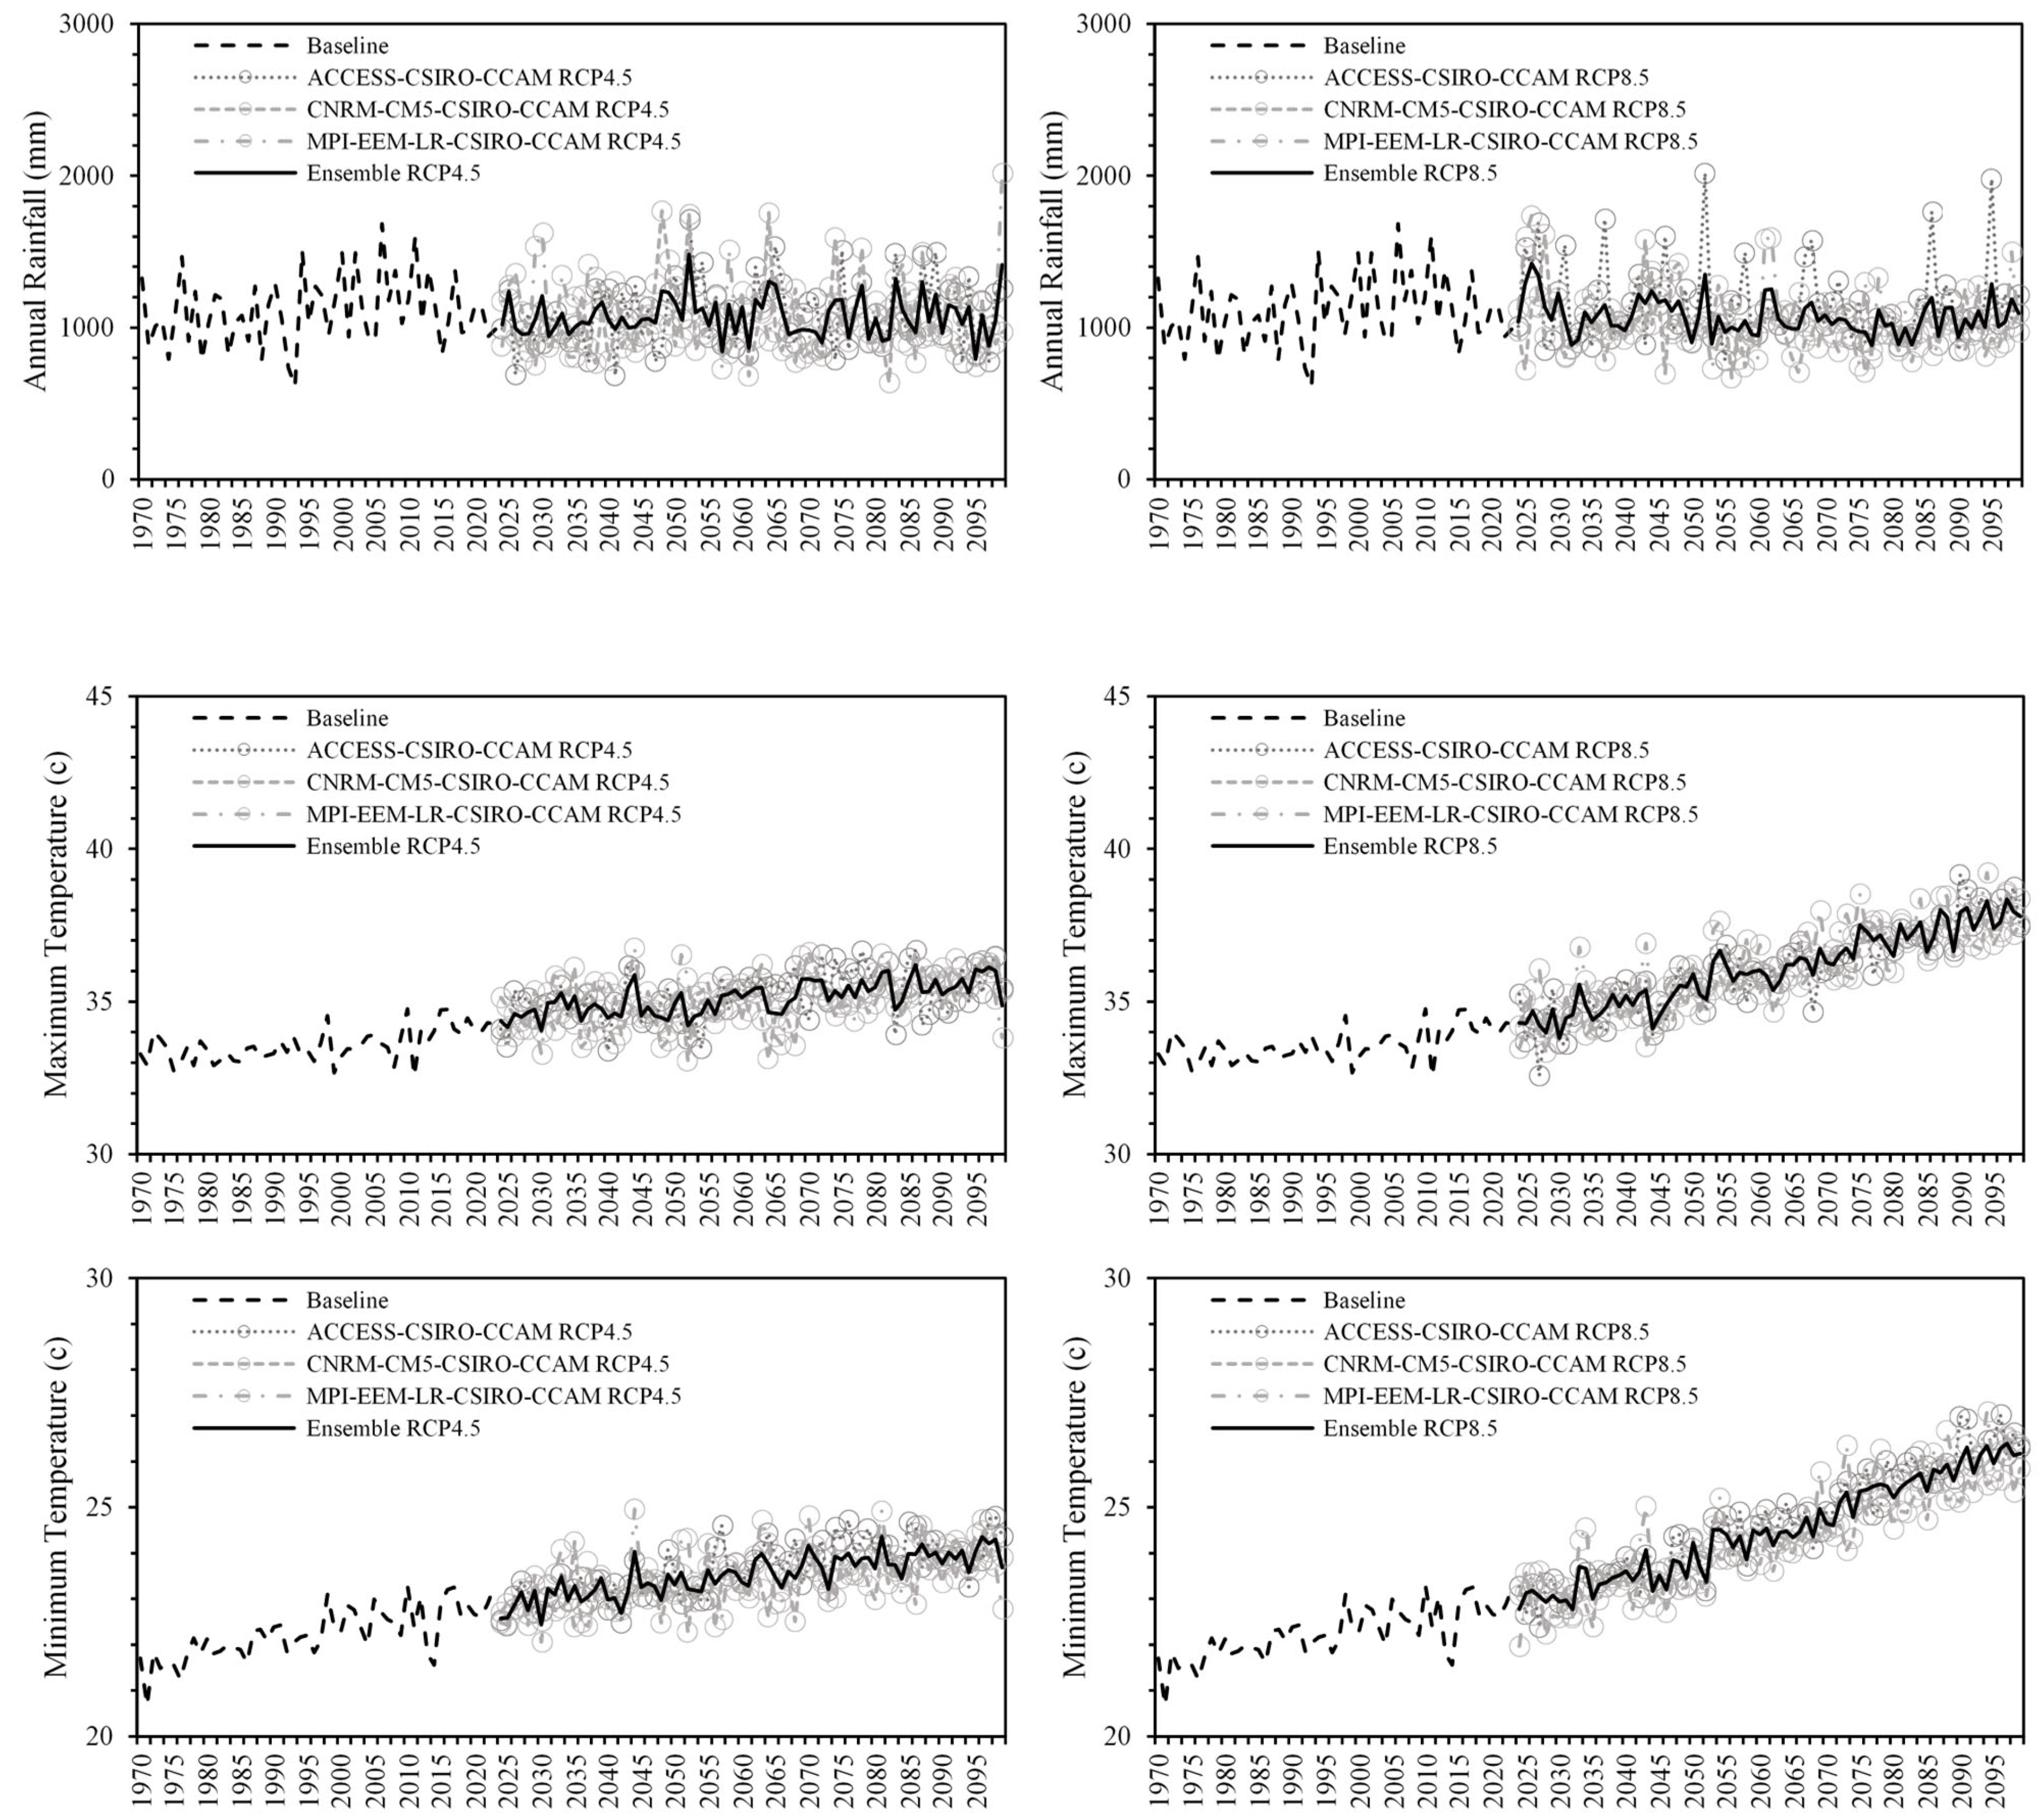
Figure 3 presents the trends of annual rainfall and average maximum and minimum temperatures at the Phetchabun meteorological station, which is located in the Middle Part sub-watershed, in the past (1970–2024) and in the future projection period (2024–2100). The projected rainfall under both RCP4.5 and RCP8.5 shows fluctuating patterns but generally decreases after 2024. Rainfall under RCP8.5 tends to decline slightly more than under RCP4.5. The projected changes in mean rainfall during the 2030s–2090s, relative to the 2010s baseline, range from −4.64% to −14.19% (ACCESS), −5.24% to −16.50% (CNRM), and −2.45% to −10.72% (MPI) under RCP4.5, and from −0.55% to −4.80% (ACCESS), −10.00% to −17.85% (CNRM), and −7.40 to −14.15% (MPI) when comparing the 2010s under RCP8.5 to the 2030s–2090s. The corresponding SD values indicate substantial variability, ranging from −36.06% to 2.87% and −29.71% to 22.51% (ACCESS), −24.93% to 17.47% and −48.87% to −2.75% (CNRM), and −34.13% to 24.16% and −35.22% to 0.80% (MPI) for RCP4.5 and RCP8.5, respectively.
In contrast, both maximum and minimum temperatures exhibit increasing trends in the future, with RCP8.5 showing a stronger increase than RCP4.5. The projected mean increases in maximum temperature range from 2.45% to 4.83% (ACCESS), 2.21% to 5.09% (CNRM), and 1.94% to 5.35% (MPI) under RCP4.5, and from 2.44% to 11.33% (ACCESS), 1.82% to 9.99% (CNRM), and 2.97% to 11.70% (MPI) under RCP8.5, with the largest increases generally occurring in the 2090s. Similarly, minimum temperature increases range from 1.81% to 6.54% (ACCESS), 1.36% to 5.22% (CNRM), and 1.67% to 5.89% (MPI) under RCP4.5, and from 2.97% to 15.66% (ACCESS), 1.47% to 12.42% (CNRM), and 3.11% to 15.36% (MPI) under RCP8.5. The SD values for both maximum and minimum temperatures indicate notable variability, particularly under RCP8.5. Among the models, MPI generally exhibits the highest dispersion compared to ACCESS and CNRM. Overall, the results indicate decreasing rainfall and increasing temperature trends, with greater magnitude and variability under RCP8.5, highlighting increased climate uncertainty toward the end of the century.

3.2. Land Use Change

Future land use change was simulated using the FLUS model [40,41] based on historical land use trends from 2010 to 2021. The historical analysis indicates that agricultural land, urban and built-up areas, and water bodies increased by approximately +0.14%, +0.04%, and +0.10%, respectively, as presented in Table 4. In contrast, forest and miscellaneous areas decreased by about −0.20% and −0.08%, respectively. Model performance was evaluated by comparing the simulated land use map with the observed land use map for 2021, yielding a Kappa coefficient (K) of 0.97, which indicates a very strong level of agreement and high model reliability. Based on this validated model and the observed historical trends, future land use patterns were projected for the period 2025–2100.

3.3. Hydrological Modeling

The simulated runoff data were generated using the HEC-HMS hydrological model, incorporating projected rainfall and temperature from the climate projection analysis and land use data from the land use change projection model. The model delineated the study area into five sub-watersheds as shown in Figure 1a, namely the Upper Part, Huai Nam Phung, Middle Part, Lower Part, and Huai Ko Kaeo sub-watersheds, and identified the stream network within the upstream watersheds. Prior to simulating future runoff for the period 2024–2100, the model was calibrated and validated using observed monthly runoff data at two hydrological stations located in the Middle Part and Lower Part sub-watersheds: S.4B and S.42. For Station S.4B, the calibration period (2003–2012) produced R2 and NSE values of 0.86, with MAE of 16.70 m3/s and PBIAS of 4.05%. During the validation period (2013–2023), the results showed R2 = 0.87, NSE = 0.85, MAE = 18.02 m3/s, and PBIAS = 8.90%. For Station S.42, the calibration period (2005–2013) yielded R2 = 0.85, NSE = 0.85, MAE = 53.84 m3/s, and PBIAS = 7.47%, while the validation period (2014–2023) produced R2 = 0.84, NSE = 0.82, MAE = 49.32 m3/s, and PBIAS = 6.54%.
These results indicate very good model performance, as R2 and NSE values greater than 0.75 are considered strong according to Moriasi et al. [61], and PBIAS values within ±10% are classified as very good model performance [62]. Therefore, the calibrated model was considered reliable for simulating future runoff conditions under projected climate and land use scenarios.

3.4. Drought Hazard

3.4.1. Standardized Runoff Index (SRI)

The SRI is a hydrological drought indicator used to evaluate runoff conditions in each sub-watershed. For example, the SRI values of the Middle Part sub-watershed in the 2010s (Table 5) indicate slight drought conditions during both seasons. In the dry seasons, SRI values were −0.02, −0.17, and −0.03 for SRI1, SRI3, and SRI6, respectively, while in the wet seasons they were −0.05, −0.05, and −0.04, respectively. For the future projection periods (2030s–2090s), SRI values range from −0.61 to 0.11 under RCP4.5 and −0.17 to 0.26 under RCP8.5 during the dry seasons, and from −0.69 to 0.03 (RCP4.5) and −0.22 to 0.31 (RCP8.5) during the wet seasons. Overall, the SRI values under RCP4.5 show more negative conditions than those under RCP8.5 for both seasons.
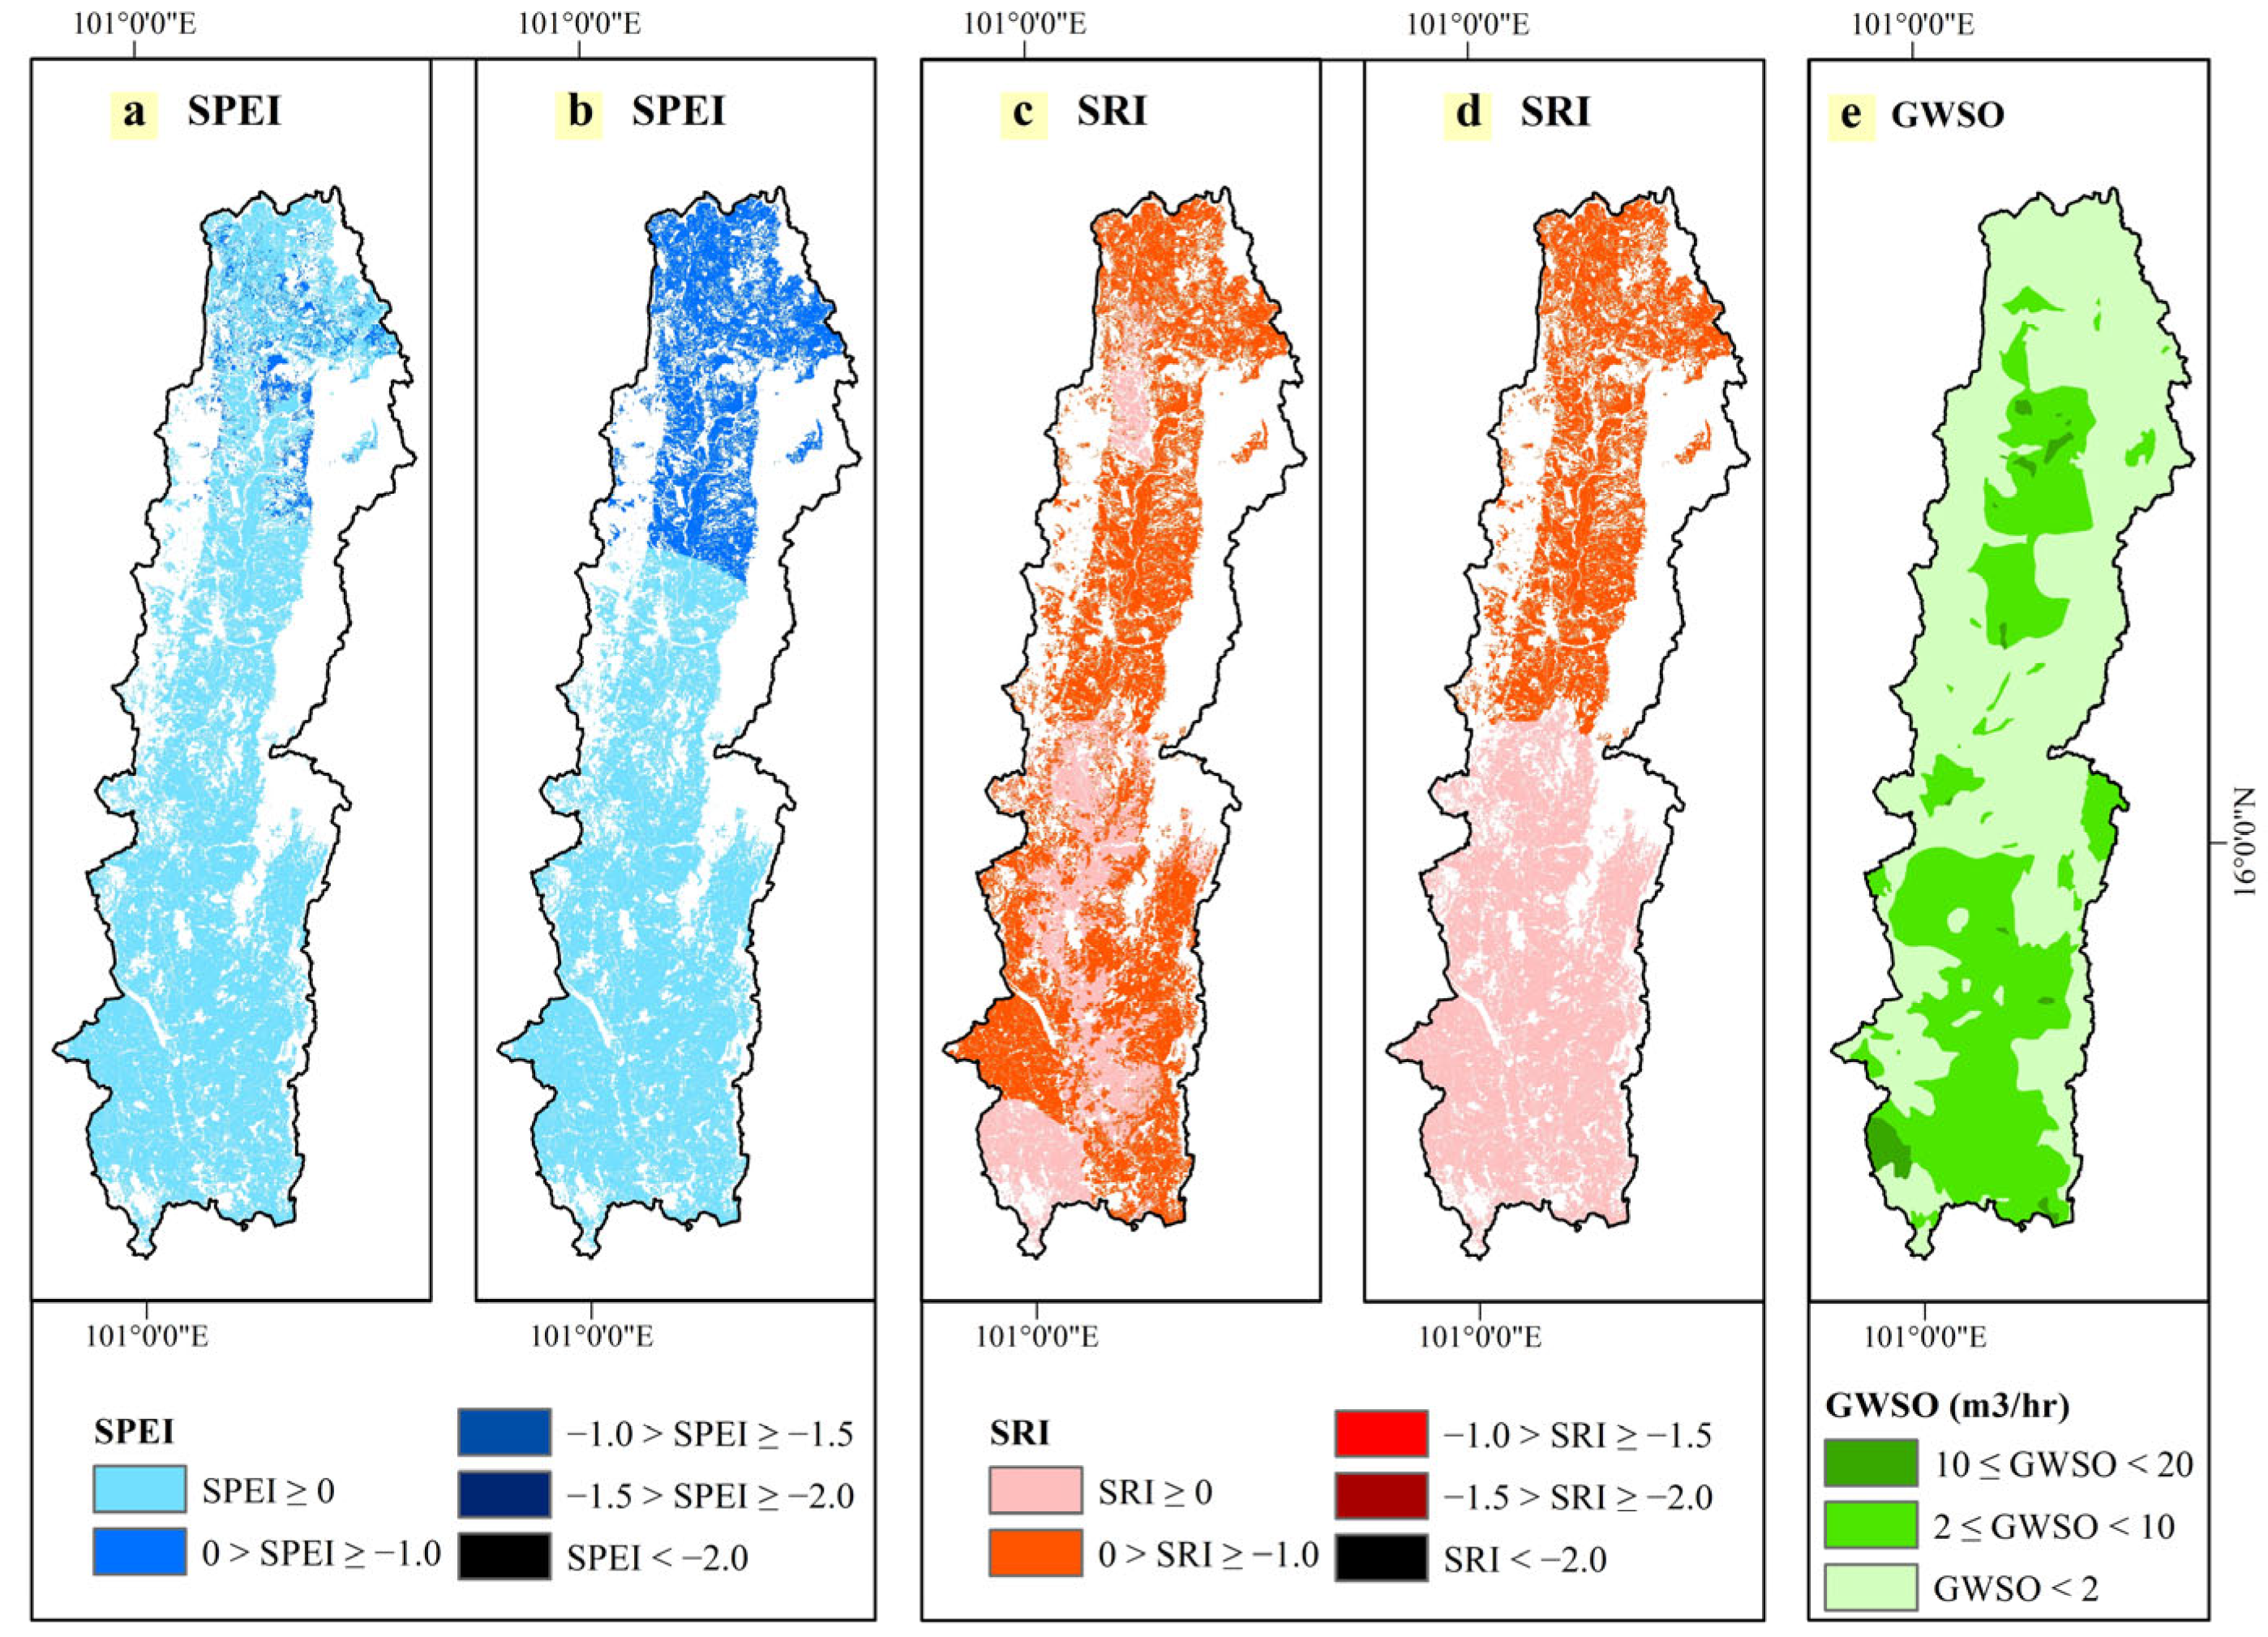
The SRI values were classified into five drought severity levels: non-drought (SRI ≥ 0), mild drought (0 > SRI ≥ −1.0), moderate drought (−1.0 > SRI ≥ −1.5), severe drought (−1.5 > SRI ≥ −2.0), and extreme drought (SRI < −2.0). Spatially, Figure 4c shows that the dry seasons were dominated by mild drought conditions, with limited areas classified as non-drought. In contrast, Figure 4d indicates a clearer spatial pattern during the wet seasons, where mild drought conditions mainly occur in the Upper Part and Hui Nam Phung sub-watersheds, while non-drought conditions dominate the lower areas.

3.4.2. Groundwater Storage Outflow (GWSO)

Groundwater storage outflow was classified into four hazard levels based on yield capacity: GWSO < 2 m3/h (very high hazard), 2 ≤ GWSO < 10 m3/h (high hazard), 10 ≤ GWSO < 20 m3/h (medium hazard), and 20 m3/h ≤ GWSO (low hazard). As shown in Figure 4e, very high hazard levels are mainly located in hilly slope areas, while high hazard levels are generally found in flat slope areas. Medium hazard levels occur only in limited areas of the Lower Part and Huai Ko Kaeo sub-watersheds with relatively flat terrain. Low hazard areas were not found in the study area.

3.4.3. Standardized Precipitation Evapotranspiration Index (SPEI)

The SPEI was calculated at three-time scales (SPEI1, SPEI3, and SPEI6) under the RCP4.5 and RCP8.5 scenarios using observed and projected rainfall and temperature data from six meteorological stations (379201, 379401, 379402, 426201, 426401, and 431301). At the Phetchabun station (379201), SPEI values in the 2010s ranged from 0.16 to 0.22 during the dry seasons and 0.03 to 0.13 during the wet seasons, indicating generally normal conditions. Under future climate projections, SPEI values for both RCP4.5 and RCP8.5 show a shift from positive values in the early periods (2030s–2050s) to negative values in the later periods (2070s–2090s). Overall, SPEI values vary between −0.24 and 0.16 under RCP4.5 and −0.46 and 0.38 under RCP8.5 during the dry seasons, and between −0.30 and 0.28 (RCP4.5) and −0.47 and 0.58 (RCP8.5) during the wet seasons.
The SPEI map was classified into five drought categories: non-drought (SPEI ≥ 0), mild drought (0 > SPEI ≥ −1.0), moderate drought (−1.0 > SPEI ≥ −1.5), severe drought (−1.5 > SPEI ≥ −2.0), and extreme drought (SPEI < −2.0). Figure 4a,b presents the spatial distribution of SPEI during the dry and wet seasons in the 2010s, respectively. The results show that non-drought conditions dominate the Middle Part and Lower Part sub-watersheds, while mild drought conditions occur mainly in the Upper Part sub-watershed and the Huai Nam Phung sub-watershed. In addition, the wet seasons exhibit slightly larger areas of mild drought compared to the dry seasons.

3.4.4. Analytic Hierarchy Process (AHP)

The weighting factors of individual drought hazard indices were determined using the AHP, considering differences between irrigated and non-irrigated areas, as well as dry and wet seasonal conditions. In step (i), the AHP technique was applied to assign weights to three drought hazard indices, the SRI, GWSO, and the SPEI, for both irrigated and non-irrigated areas under different seasonal scenarios. For irrigated areas during the dry seasons, the SRI and SPEI were selected as the primary drought hazard indicators. In contrast, for non-irrigated areas during the dry seasons, groundwater resources serve as a critical alternative water source. Therefore, GWSO was included as an additional drought hazard indicator alongside the SRI and SPEI. During the wet seasons, the SPEI and SRI were used to assess drought hazards in both irrigated and non-irrigated areas.
In step (ii), pairwise comparisons of two or three judgment indices (JIs) were conducted and represented in the form of 2 × 2 matrices (Table 6a,b,d) and a 3 × 3 matrix (Table 6c). The diagonal elements of each matrix are equal to 1, as each indicator is compared with itself. The relative importance of the drought hazard indices was evaluated using the fundamental AHP scale (ranging from 1 to 9) [50], based on expert judgment obtained through field surveys involving farmers and relevant stakeholders in the study area. For Table 6a (irrigated areas in the dry seasons), the first row represents the SRI, where the relative importance between the SRI and SPEI was assigned values of 1 and 3, respectively. According to AHP principles, the elements in the second row (SPEI) are the reciprocals of the first row, resulting in values of 1/3 and 1. For Table 6b (non-irrigated area in the dry seasons), the first row (SRI) was assigned values of 1, 1, and 3 for the SRI, GWSO, and SPEI, respectively. The second row (GWSO) reflects equal importance with the SRI and SPEI (about 1, 1, and 3), with corresponding reciprocal values. The third row (SPEI) consists of reciprocal values of 1/3, 1/3, and 1 for the SRI, GWSO, and SPEI, respectively. For Table 6c,d (irrigated and non-irrigated areas in the wet season), the first row (SPEI) was assigned values of 1 and 3 relative to the SRI, while the second row (SRI) contains the reciprocal values of 1/3 and 1.
The judgment matrices were subsequently normalized. For example, in Table 7a, each element in the first column was divided by the sum of that column (1 + 1/3 = 4/3) from Table 6a. Thus, the normalized values for the first column are 3/4 and 1/4. The same normalization procedure was applied to all remaining columns in Table 7a–d.
In step (iii), the weights were calculated as the average of the normalized values across each row. For instance, in Table 7a, the weight for the SRI was computed as (3/4 + 3/4)/2 = 0.75, while the weight for the SPEI was (1/4 + 1/4)/2 = 0.25. The sum of these weights equals 1.00, satisfying the normalization condition. Similarly, for Table 7b (non-irrigated area in the dry seasons), the weights for the SRI, GWSO, and SPEI were determined as 0.43, 0.43, and 0.14, respectively. This reflects the importance of groundwater as an alternative water source during dry conditions. For both irrigated and non-irrigated areas in the wet seasons (Table 7c,d), the weights for the SPEI and SRI were calculated as 0.75 and 0.25, respectively.
In step (iv), the consistency of the pairwise comparison matrices was evaluated using the Consistency Ratio (CR). The CR values were found to be 0.0%, with principal eigenvalues (λmax) equal to 2 for the 2 × 2 matrices (Table 7a,c,d) and 3 for the 3 × 3 matrix (Table 7b), indicating perfect consistency and confirming the reliability of the derived weights. All calculated weights were subsequently used to compute the M-DHI for both historical and future periods using Equation (1). The weighting scheme was further verified through calibration (2011–2020) and validation (2021–2024) as part of the hazard assessment process.

3.4.5. Drought Hazard Assessment

The M-DHI was developed to represent combined meteorological and hydrological drought hazards, integrating the SRI, GWSO, and SPEI with their respective weights using Equation (1). Different drought durations were applied according to crop sensitivity. Rice crops respond rapidly to short-term water deficits; therefore, SRI1 and SPEI1 were used to represent 1-month drought conditions. Field crops (e.g., maize, sugarcane, cassava, and pineapple) can tolerate longer water deficits and were assessed using SRI3 and SPEI3, representing 3-month drought duration. Orchards (mainly tamarind) and perennial crops were evaluated using SRI6 and SPEI6, corresponding to 6-month drought duration [6].
The drought hazard assessment was evaluated through calibration and validation using statistical comparisons between simulated and observed hazard locations. During the calibration period (2011–2020), a total of 1160 observed hazard points were classified into five hazard levels: very low (399 points; approximately one event per 10 years), low (499 points; two events per 10 years), medium (243 points; three events per 10 years), high (19 points; four to five events per 10 years), and very high (0 point; six to ten events per 10 years). These data were collected through ground survey methods, identifying villages affected and not affected by drought annually, as reported by the Department of Provincial Administration (DOPA) and the Department of Disaster Prevention and Mitigation (DDPM), Thailand [63]. The corresponding matching points between observed and simulated data were 374, 474, 230, 0, and 0, while non-matching points were 25, 25, 13, 19, and 0 for the respective hazard levels.
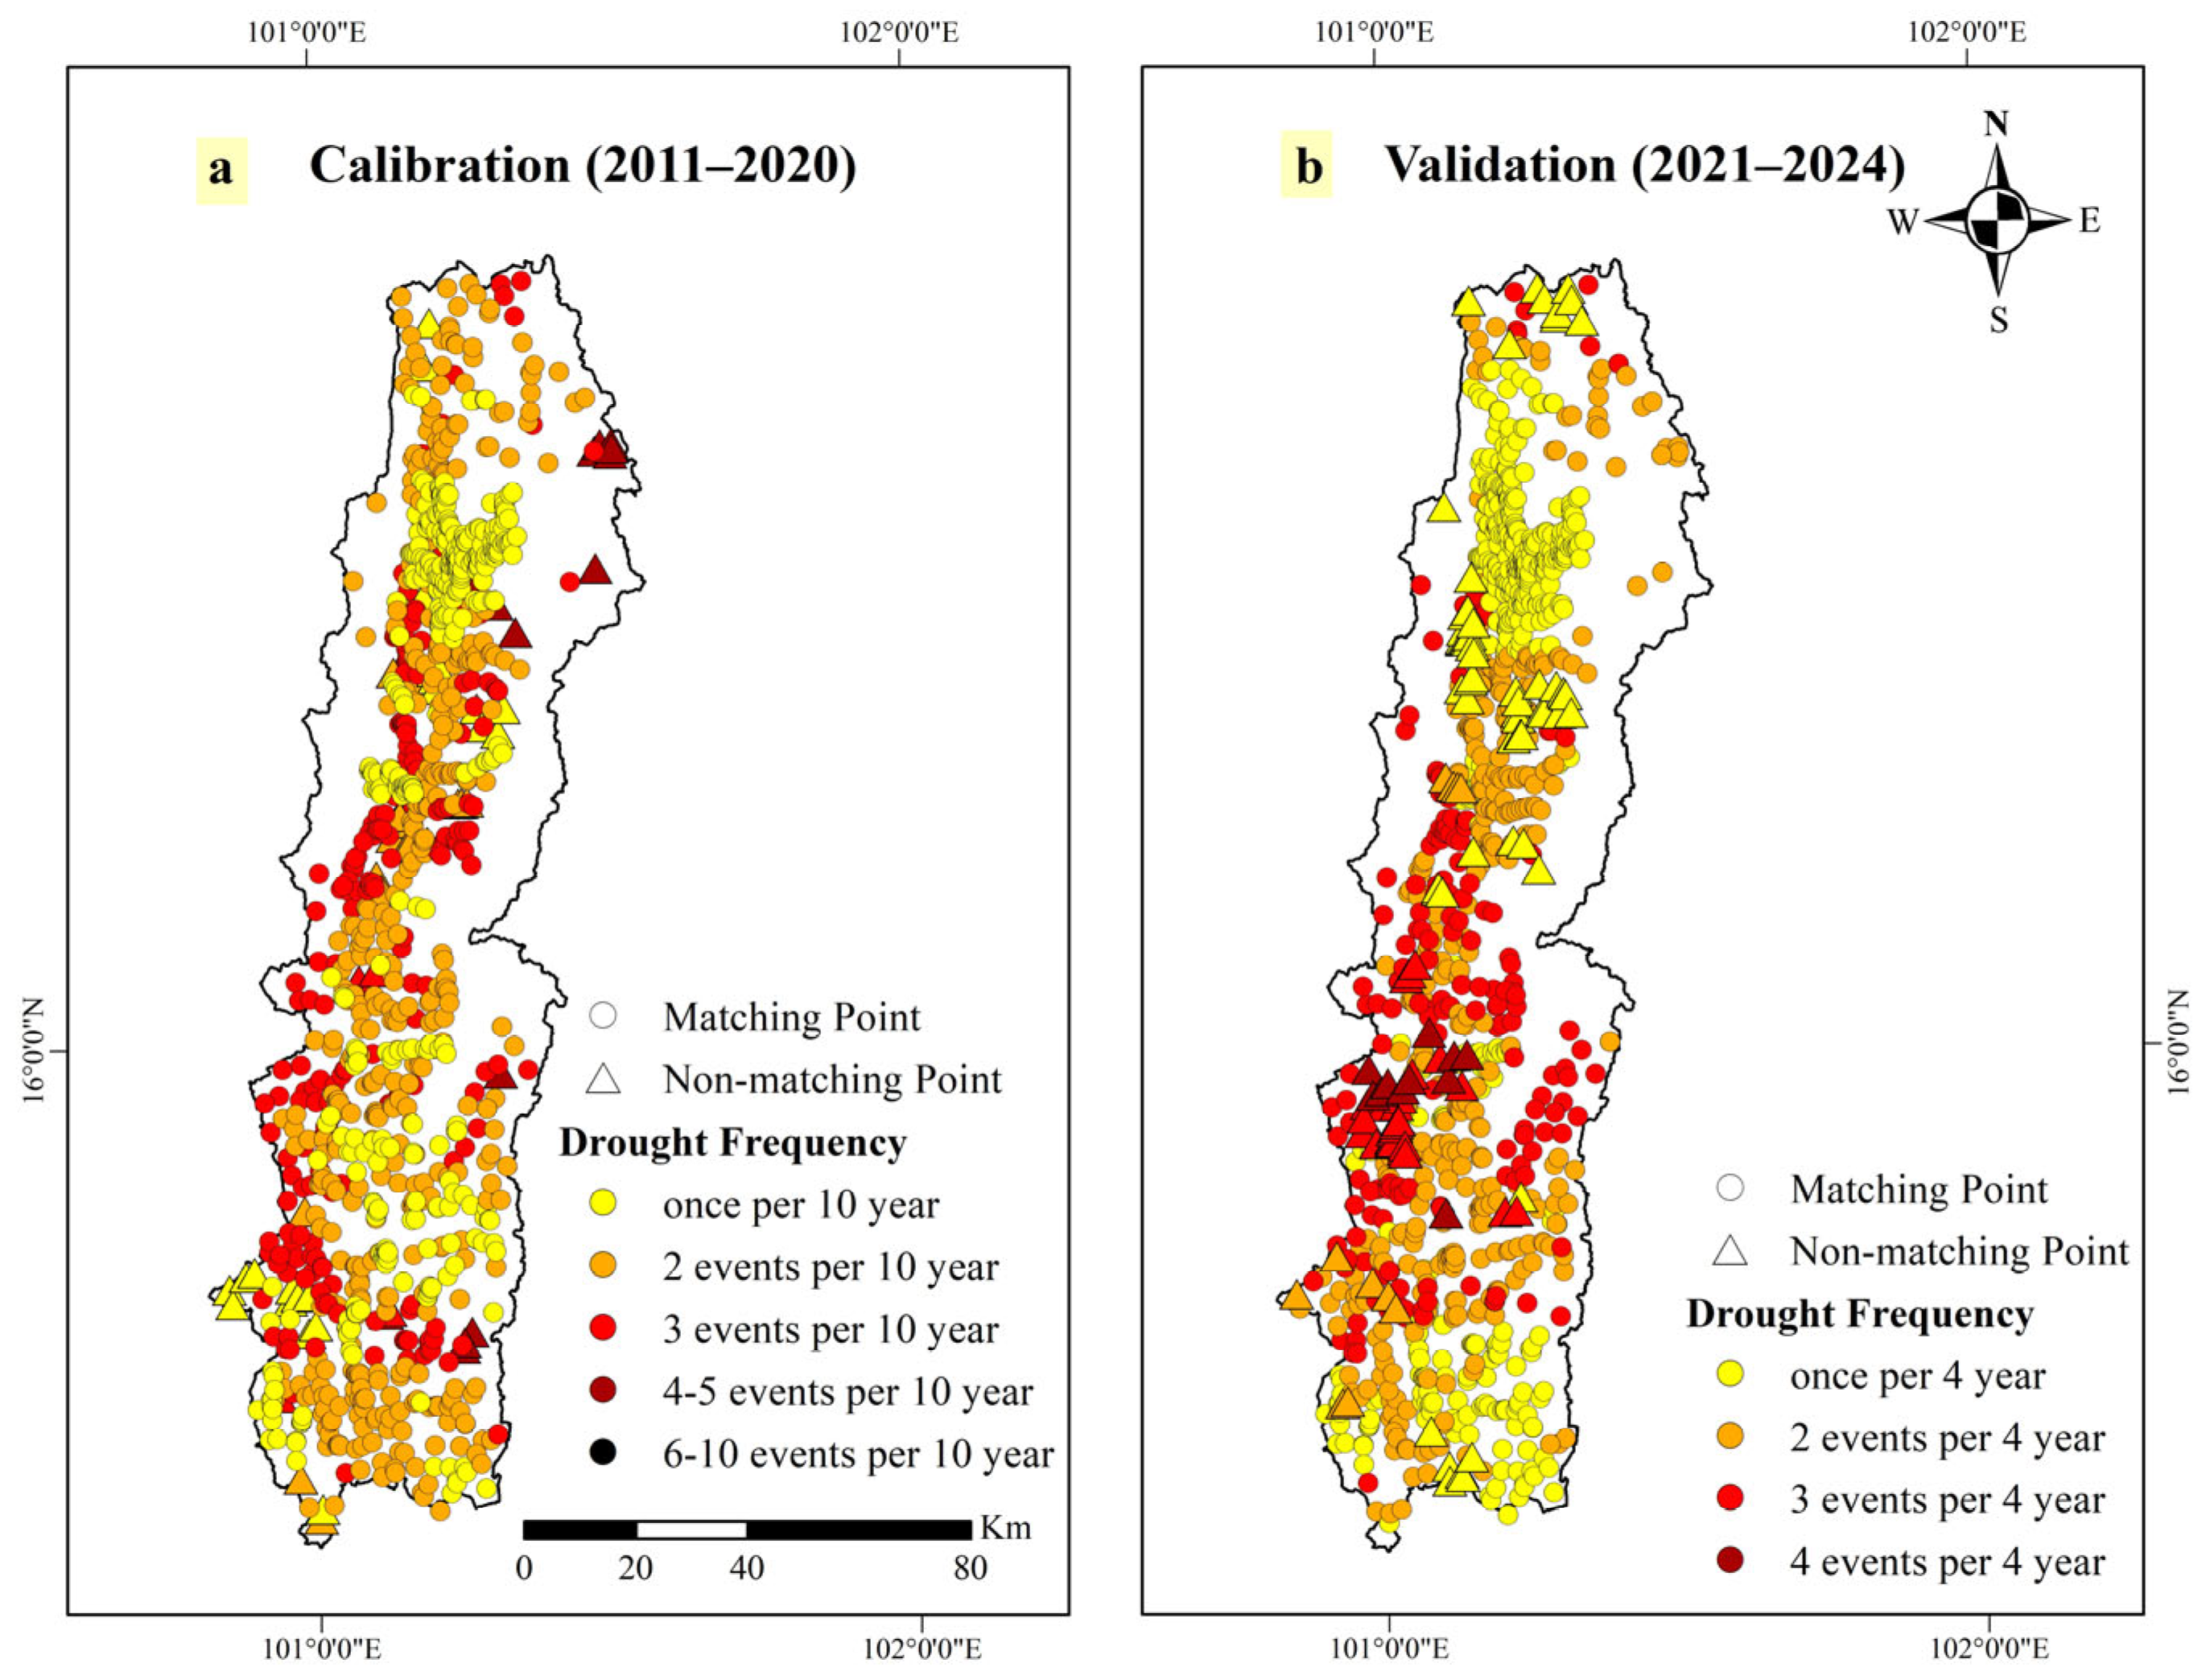
For the validation period (2021–2024), a total of 1180 observed hazard points was identified, including very low (532 points; approximately one event per 4 years), low (424 points; two events per 4 years), medium (213 points; three events per 4 years), high (11 points; four events per 4 years), and very high (0 point). These data were obtained using the same ground survey approach from DOPA and DDPM (Thailand) [64]. The matching points were 474, 413, 185, 0, and 0, while non-matching points were 58, 11, 28, 11, and 0 for the respective hazard classes. The spatial distribution of matching and non-matching points is presented in Figure 5a for calibration and Figure 5b for validation. Overall, the non-matching points account for only 7.07% during calibration and 9.15% during validation, both below the 20% threshold, indicating strong agreement and supporting the reliability of Equation (1) for future projections until 2100 [6].
Furthermore, the statistical performance during calibration yielded R2 = 0.82, NSE = 0.81, MAE = 0.08, and PBIAS = −0.30%. During validation, the results were R2 = 0.76, NSE = 0.75, MAE = 0.11, and PBIAS = 2.5%. These results indicate very good model performance, as the R2, NSE, and PBIAS values demonstrate strong agreement between simulated and observed data [62], while MAE values close to zero further confirm high model accuracy [65].
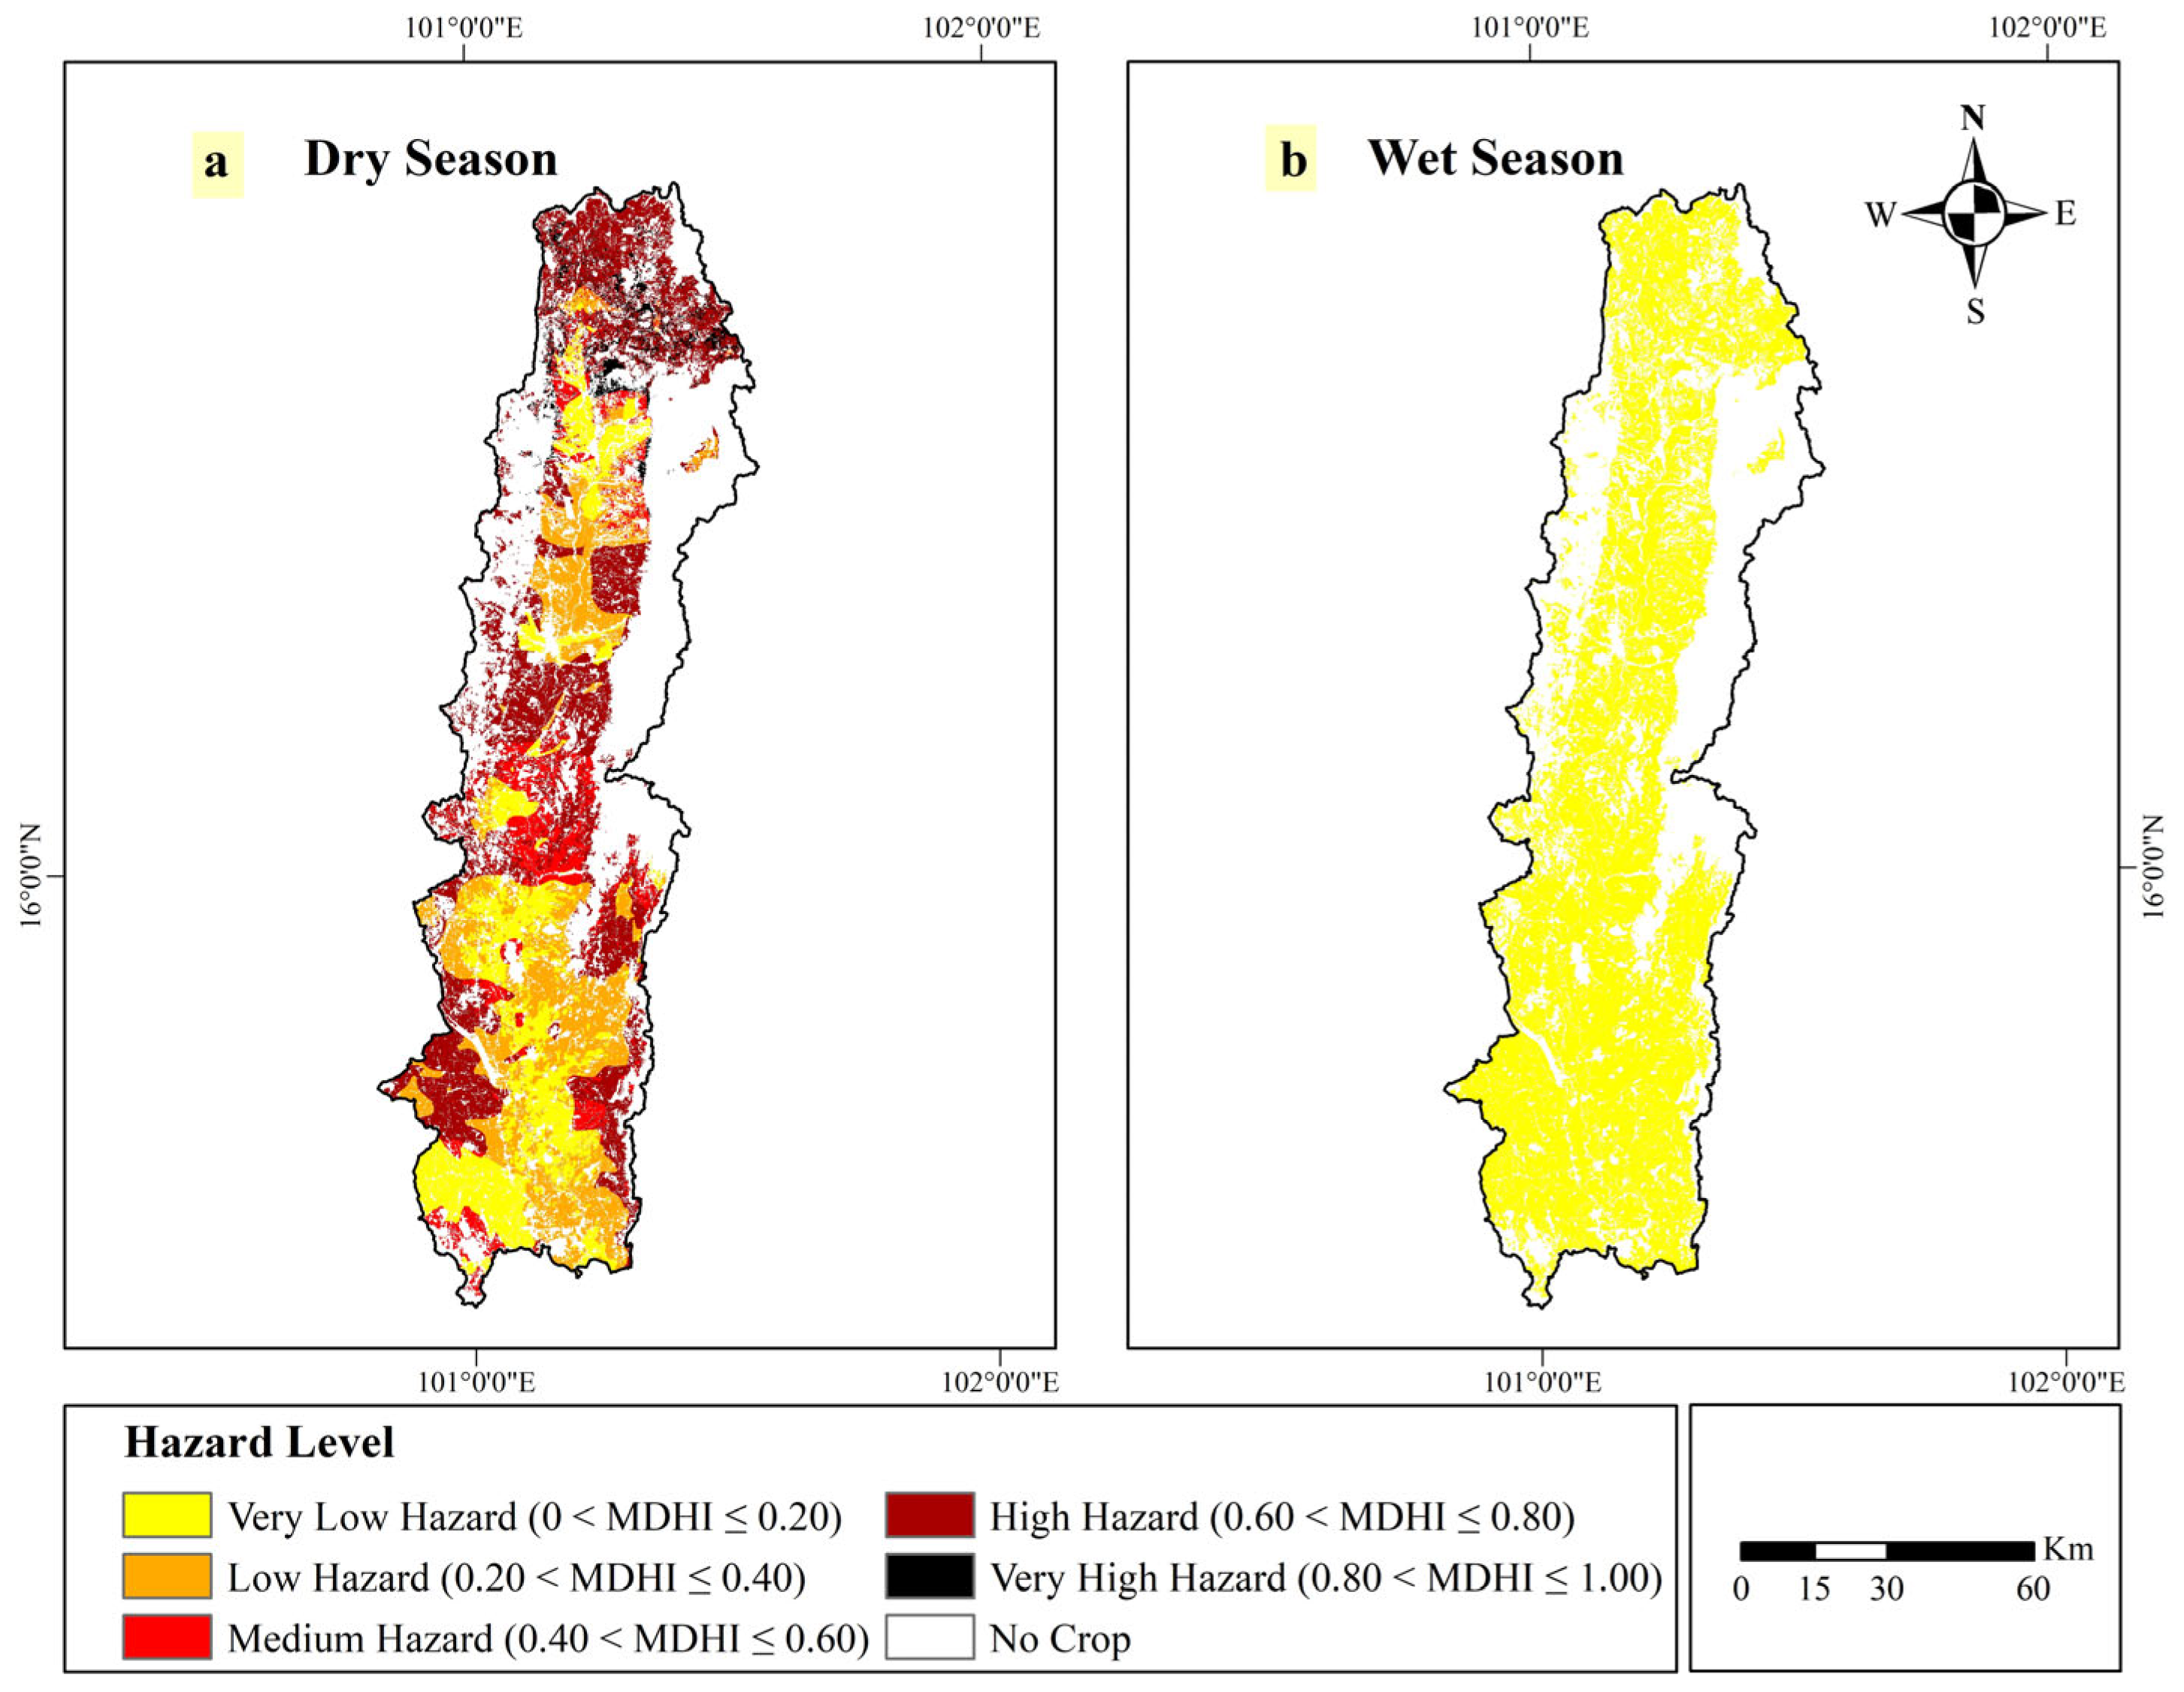
Figure 6a presents the drought hazard map for the dry seasons in the 2010s. The results show that flat areas are mainly classified as very low to low hazard levels, whereas hilly areas exhibit higher hazard levels (high to very high). Spatially, the Lower Part and Huai Ko Kaew sub-watersheds show lower hazard levels compared to the Upper Part and Huai Nam Phung sub-watersheds. In contrast, the drought hazard map for the wet seasons is dominated by very low hazard levels, as shown in Figure 6b.
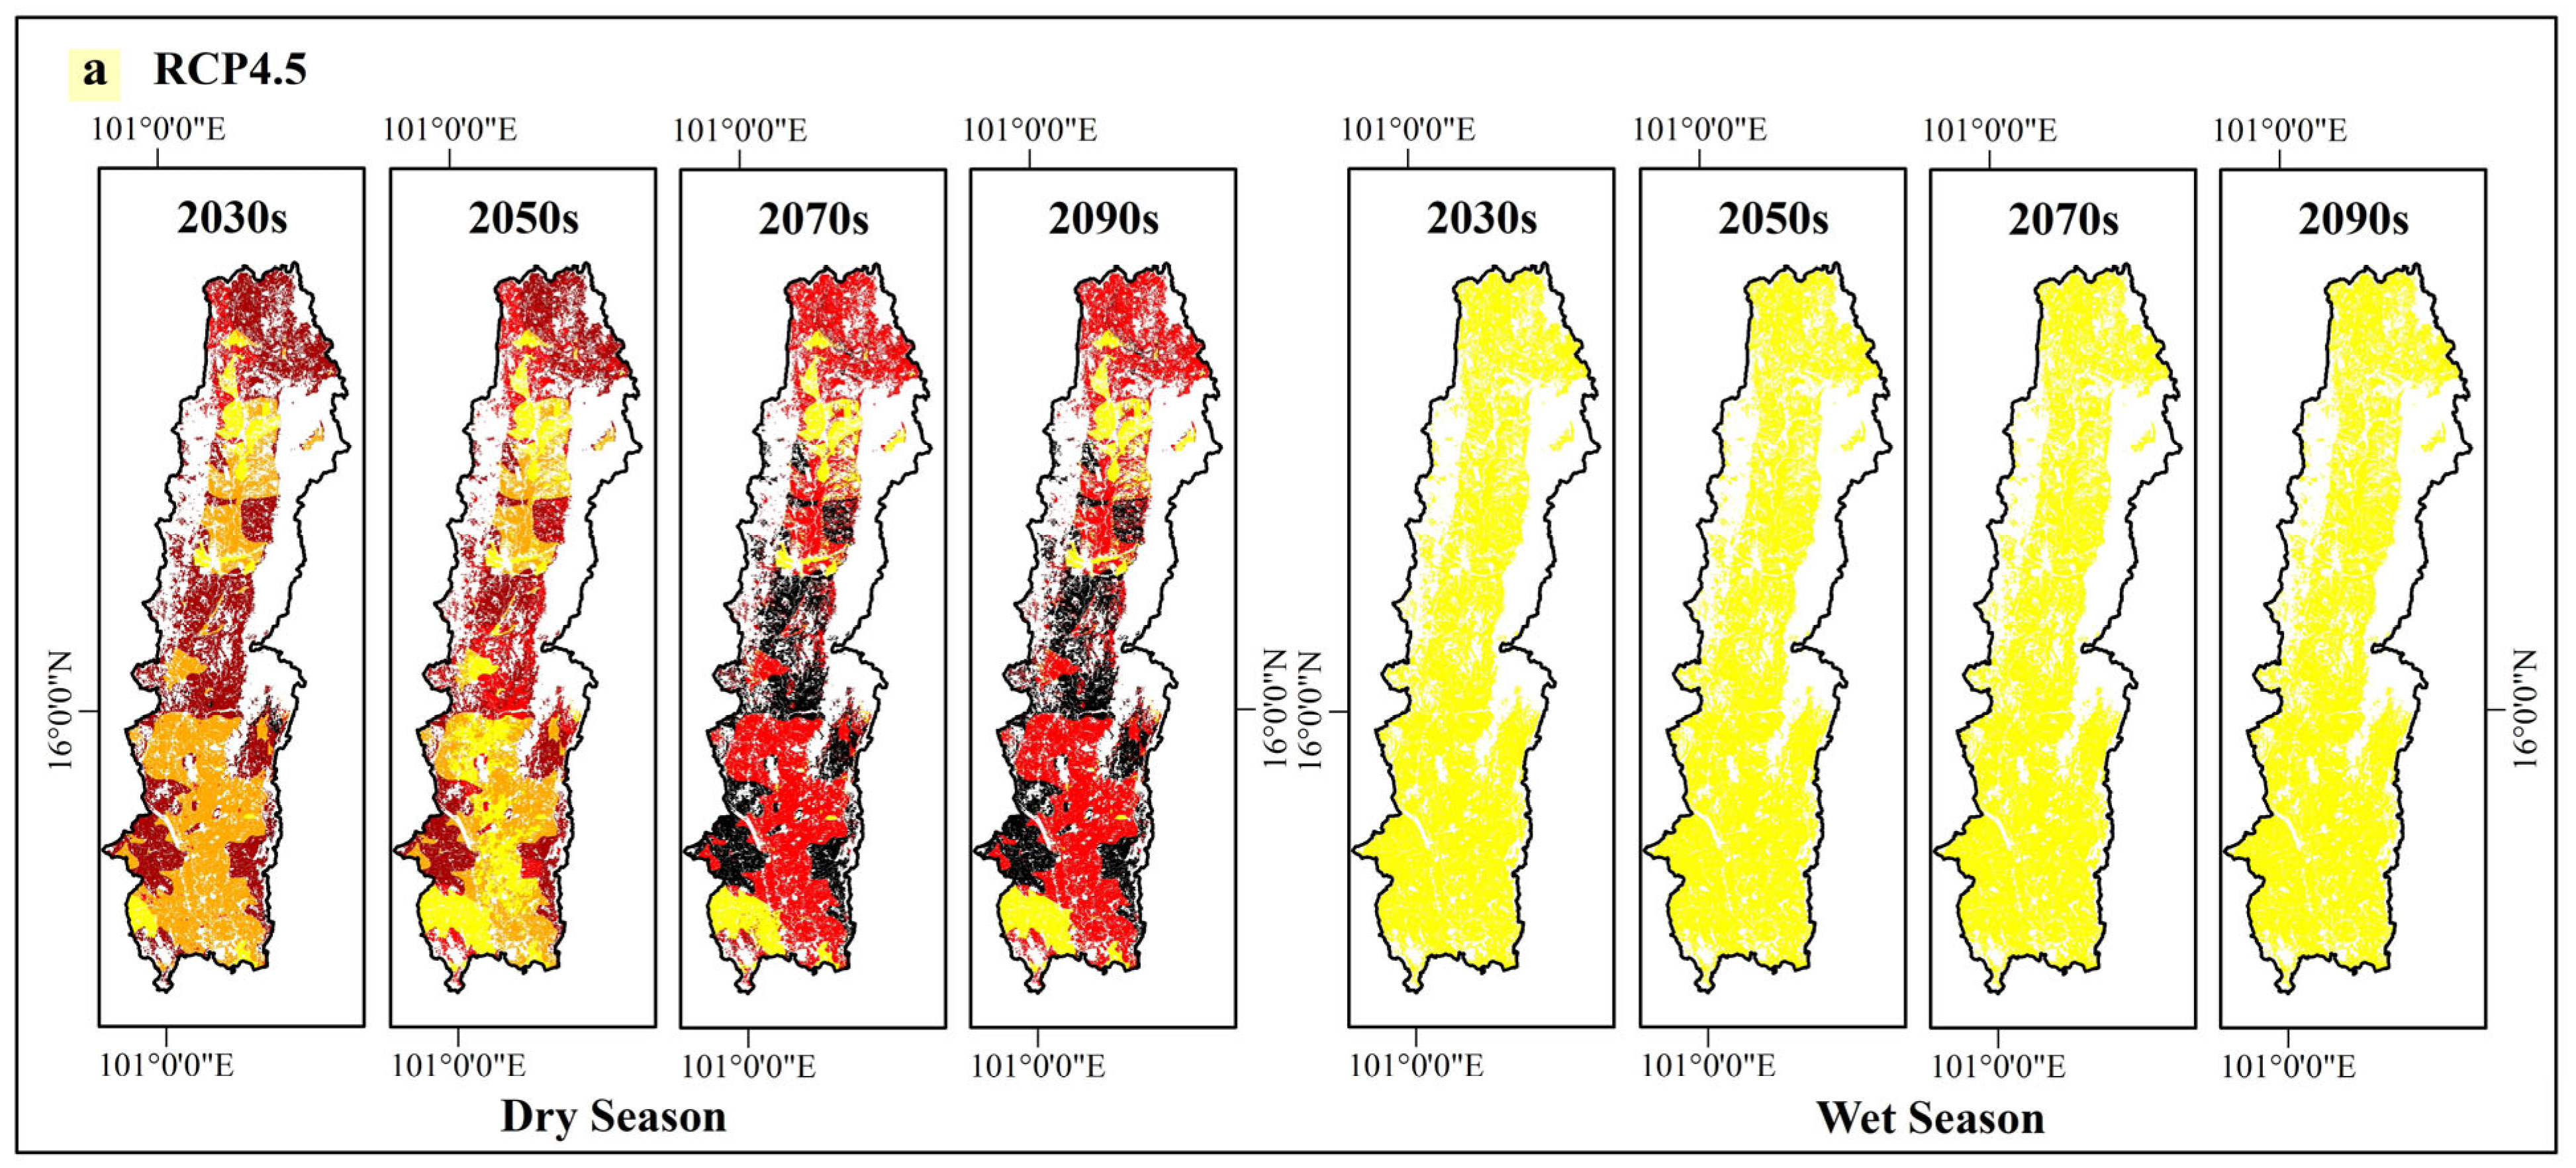
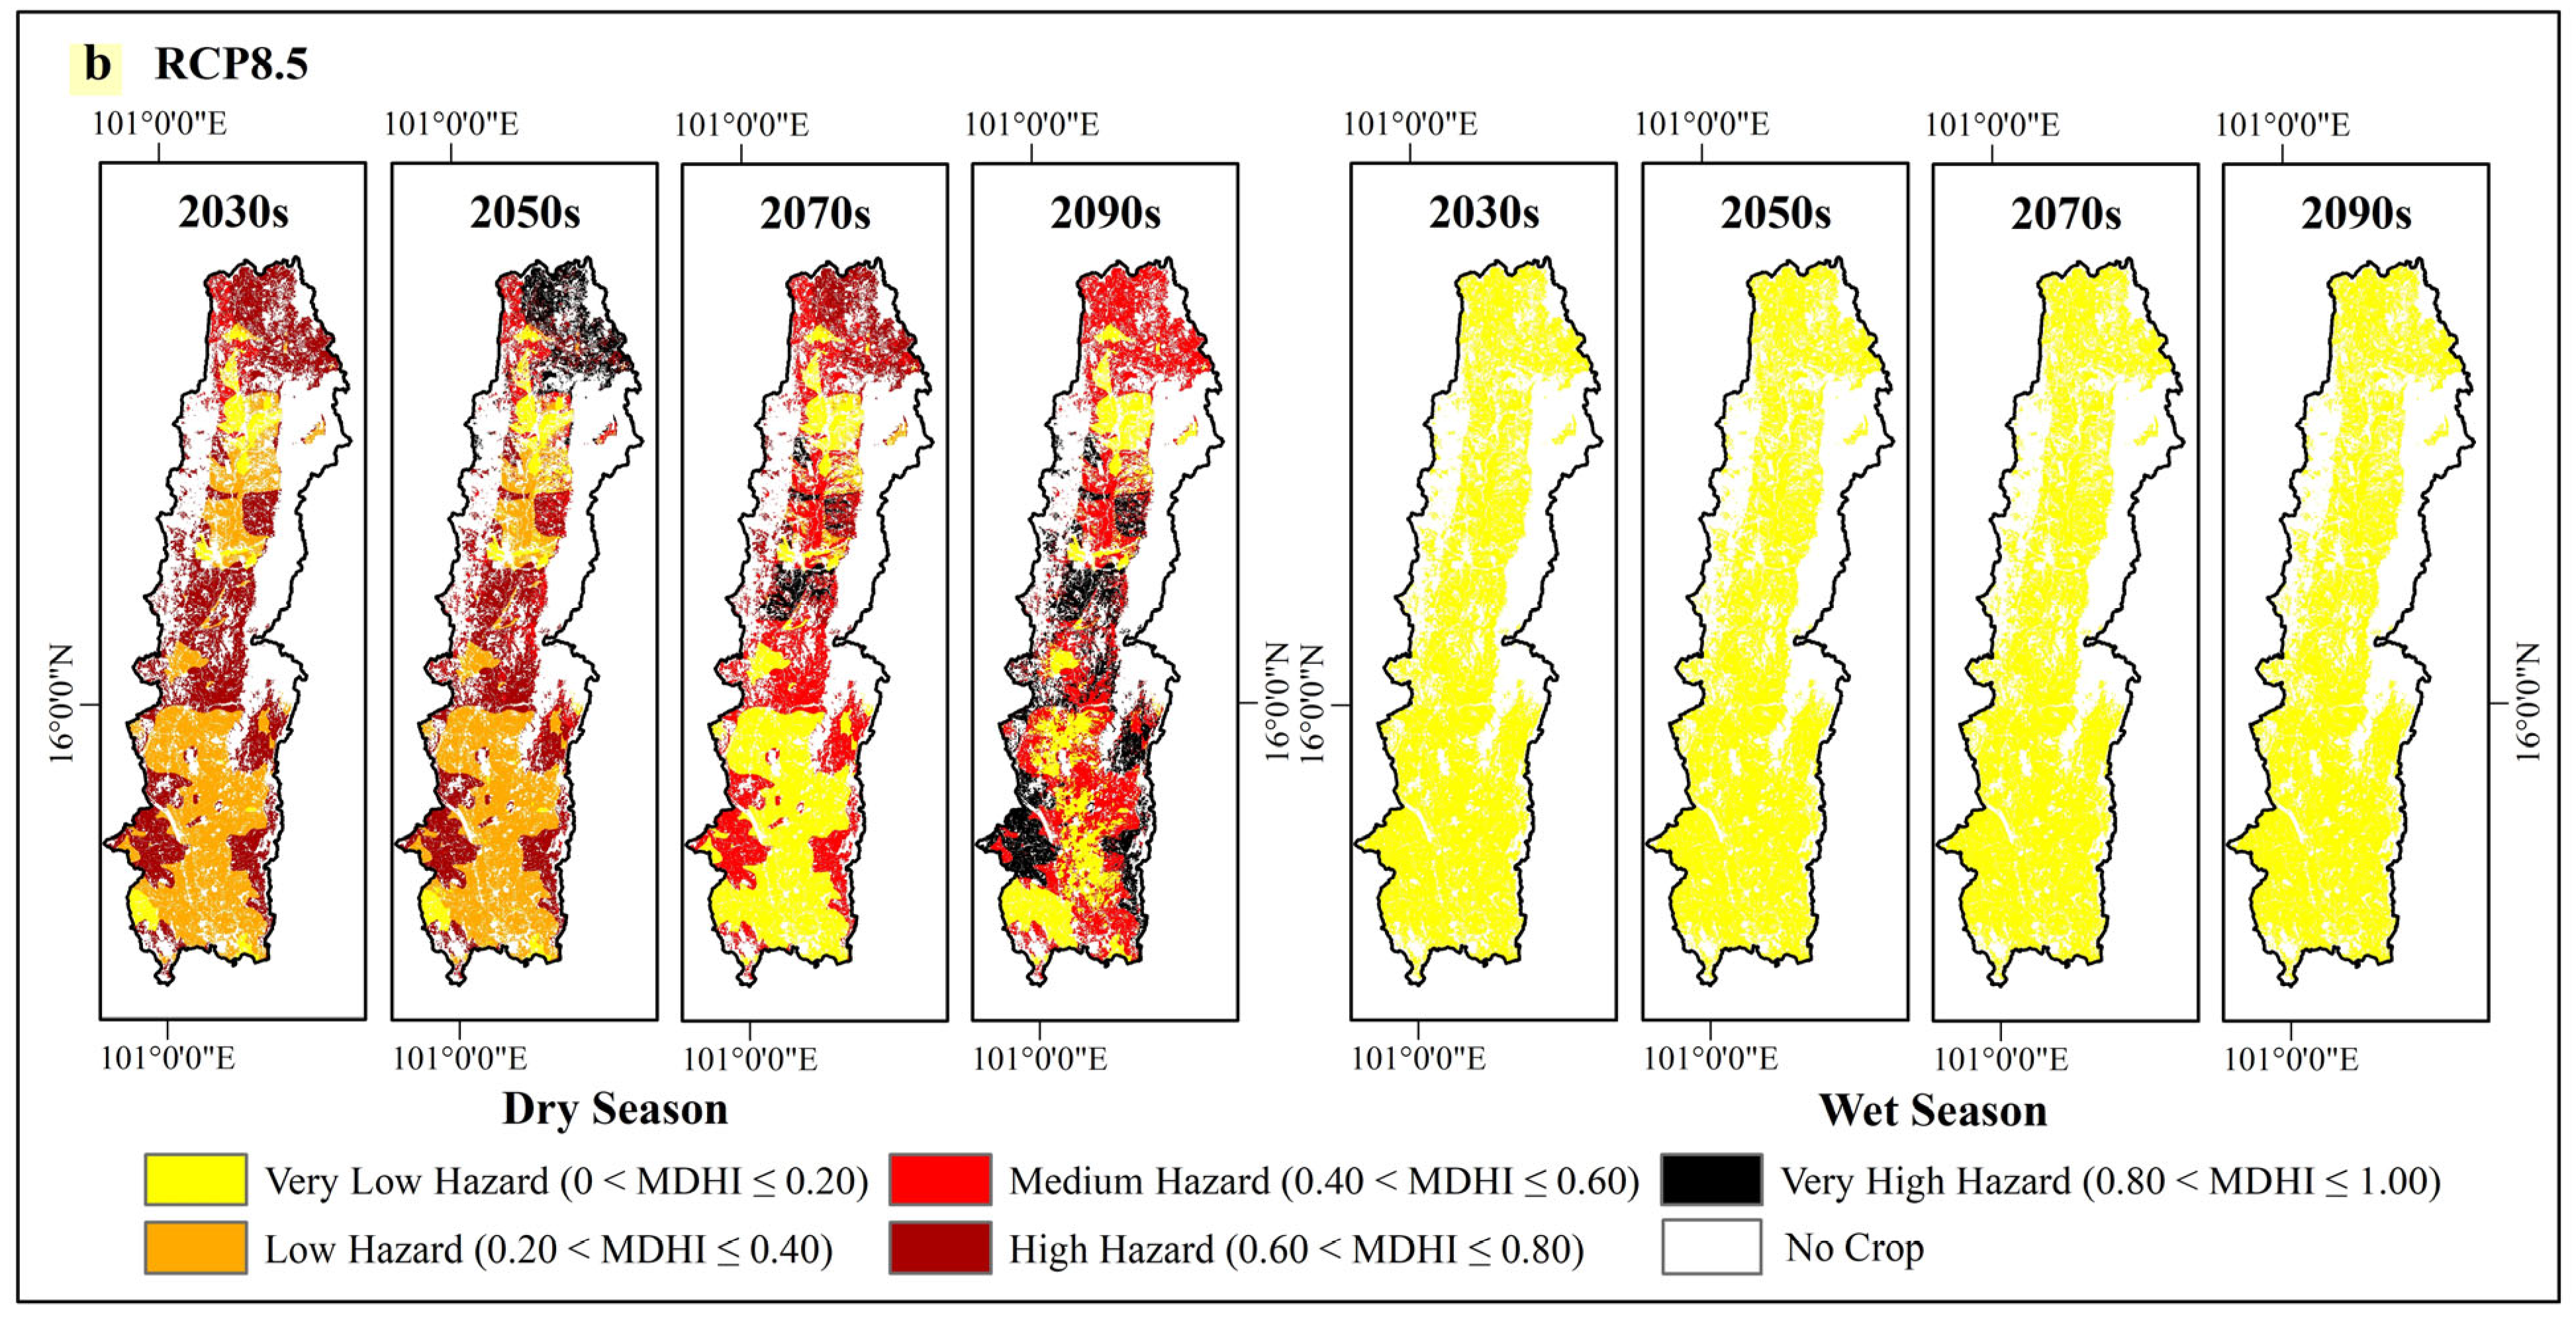
The simulated drought hazard areas illustrate the impacts on irrigated and non-irrigated lands during the historical period (2010s) and future periods (2030s, 2050s, 2070s, and 2090s). For the 2010s, the dry season hazard area for irrigated land was classified as 81,818 rai (very low), 280 rai (low), 14 rai (medium), 113 rai (high), and 0 rai (very high). In contrast, the non-irrigated area covered 191,131 rai (very low), 547,721 rai (low), 141,534 rai (medium), 452,558 rai (high), and 102,088 rai (very high), as detailed in Table 8. Overall, both irrigated and non-irrigated areas are dominated by very low hazard levels during wet seasons, covering approximately 82,012 rai and 3,085,418 rai, respectively. For the future periods under RCP4.5 and RCP8.5, irrigated areas during the dry seasons remain predominantly under very low hazard levels, with only small areas experiencing low-to-very high hazards. In contrast, non-irrigated areas show a gradual increase in hazard severity, shifting from very low to low, low to medium, medium to high, and high to very high hazard levels from the 2030s to the 2090s. The highest drought hazard conditions during the dry seasons are projected in the 2070s under RCP4.5 and the 2090s under RCP8.5. In contrast, the wet season hazard areas remain relatively unchanged from the historical to future periods, being predominantly classified as very low hazard levels.
The projected drought hazard maps shown in Figure 7 illustrate the future hazard conditions under the RCP4.5 and RCP8.5 scenarios for both dry and wet seasons. Under RCP4.5, Figure 7a shows a decreasing hazard trend from the 2030s to the 2050s, followed by an increasing trend from the 2050s to the 2090s during the dry seasons, while the wet seasons remain relatively unchanged. Similarly, under RCP8.5, the drought hazard decreases from the 2030s to the 2070s, and then increases toward the 2090s, whereas the wet seasons show a stable trend throughout the projection period (2030s–2090s). By the end of the century, the dry season hazard under RCP4.5 in the 2090s is projected to be higher than under RCP8.5. In addition, the increasing hazard trend under RCP4.5 begins earlier (around the 2070s) compared with RCP8.5, which shows a noticeable increase mainly in the 2090s.

3.5. Vulnerability

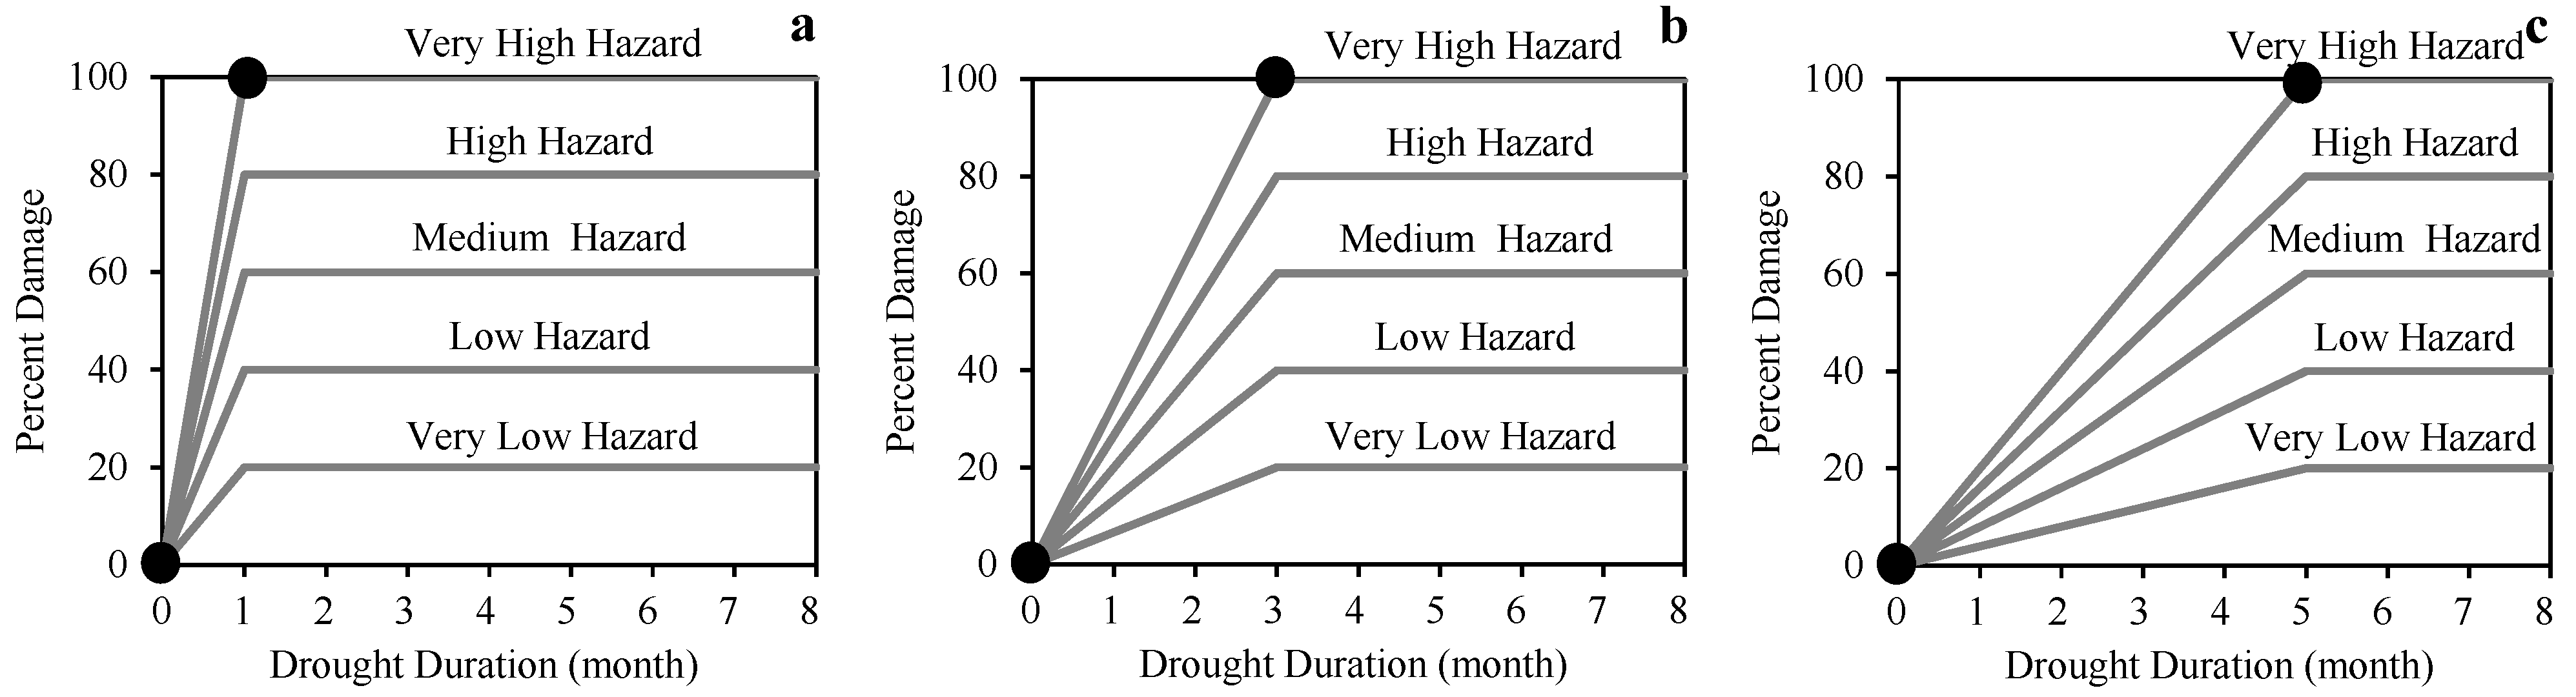
Vulnerability refers to the propensity or predisposition of a system to be adversely affected by drought, resulting in impacts on economic, social, and environmental sectors [53]. This study focuses on the agricultural economic sector, which was categorized into four major crop groups: rice, field crops, orchards, and perennial crops. Different crops have varying levels of drought tolerance. Rice can generally withstand up to one month of drought without significant yield loss [6]. Field crops, such as sugarcane and cassava, can tolerate up to three months of drought [66,67,68]. However, cassava yield may decline by approximately 32% per month under prolonged drought conditions. Rubber trees and other perennial crops are relatively drought-tolerant but experience significant yield losses after three months of drought, with reported damage of 20–30% after four to five months and potential crop failure beyond five months [69,70]. Based on these studies, rice, field crops, and orchard/perennial crops were assumed to tolerate drought durations of approximately 1, 3, and 5 months, respectively [6].
Based on these drought tolerance characteristics, drought vulnerability curves were developed for the four crop groups according to drought duration, hazard level, and associated damage [6]. Figure 8 illustrates the hazard–duration–damage relationships for rice (a), field crops (b), and orchard/perennial crops (c). The damage percentages derived from these curves were used to compute the Normalized Drought Vulnerability Index (NDVI)-based vulnerability indicator. The resulting NDVI values were classified into six vulnerability levels: non-vulnerable (NDVI = 0), very low (NDVI = 0.20, corresponding to 1–20% damage), low (NDVI = 0.40 for 21–40%), medium (NDVI = 0.60 for 41–60%), high (NDVI = 0.80 for 61–80%), and very high (NDVI = 1.00 for 81–100%).

3.6. Exposure

The exposure of the agricultural economic sector was assessed using crop income (Baht per rai) for four crop types—paddy fields (rice), field crops (maize, sugarcane, cassava, and pineapple), orchards (tamarind), and perennial crops (rubber tree and oil palm)—as presented in Table 2. Crop cultivation schedules vary between the dry and wet seasons, resulting in different exposure patterns. During the wet seasons, the dominant crop is in-season rice, covering approximately 1,013,278 rai (28.59% of the total agricultural area), consisting of 86.87% non-glutinous rice and 13.13% glutinous rice [71]. Rice cultivation typically requires 90–120 days, with planting and harvesting occurring between May and October in both irrigated and non-irrigated areas depending on local farming practices. In addition, rainfed maize occupies approximately 759,142 rai (21.42%), and is mainly cultivated during the wet seasons. In contrast, rice and maize are generally not cultivated in non-irrigated areas during the dry seasons. During the dry seasons, rice cultivation mainly occurs as off-season rice, which is grown in irrigated areas only, covering about 71,131 rai (2.01%), with cultivation from November to April. Only a small area of maize (about 3481 rai or 0.10%) is cultivated during this period [72]. For annual crops, sugarcane covers approximately 856,076 rai (24.15%), with a cultivation period of 10–14 months. Cassava and pineapple are cultivated for 9–12 months and 15–18 months, respectively, covering about 266,935 rai (7.53%) [72]. Perennial crops, including rubber and oil palm, occupy approximately 141,330 rai (3.99%) and are harvested throughout the year. Tamarind, the dominant orchard crop in the study area, covers about 208,714 rai (5.89%), with flowering occurring in May and harvesting between December and February [73].
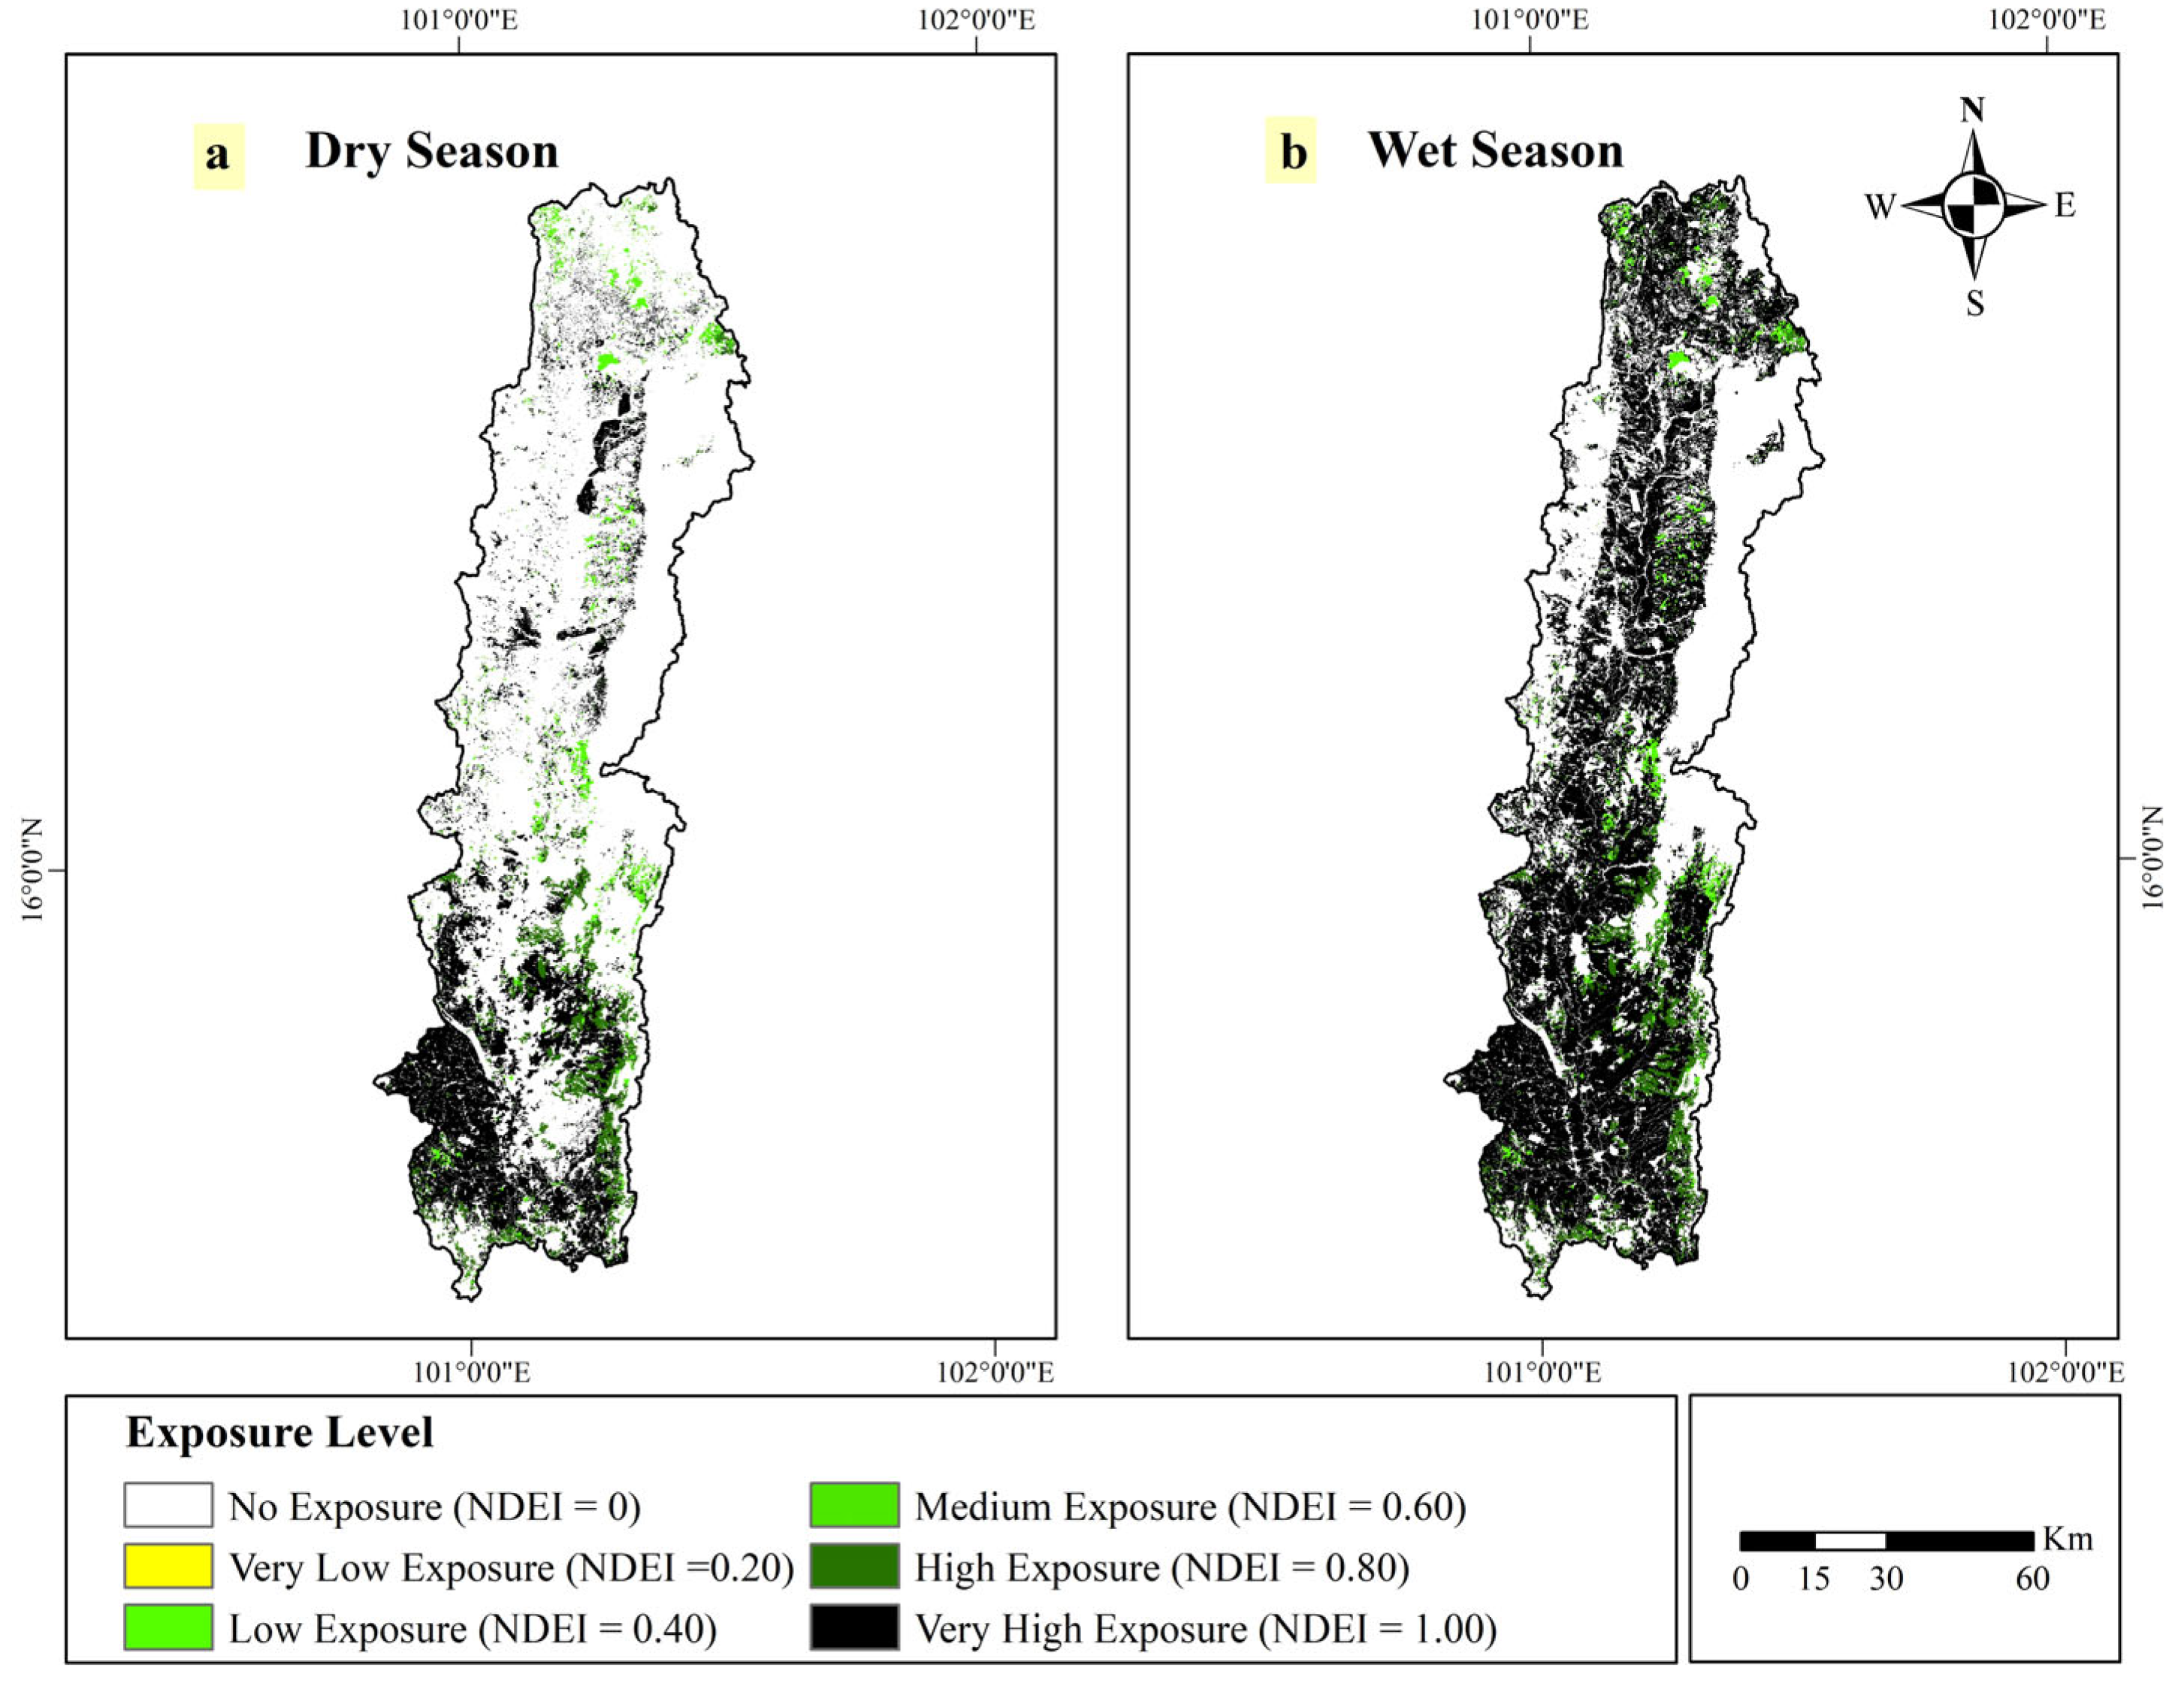
These cropping patterns result in different harvest periods between irrigated and non-irrigated areas across dry and wet seasons, leading to variations in economic exposure. The crop income (Baht/rai) for each crop and season was classified into five exposure levels, as shown in Table 2. The resulting exposure maps range from very low to very high levels, as illustrated for the dry seasons in Figure 9a and the wet seasons in Figure 9b.

3.7. Drought Risk Assessment

Drought risk refers to the probability of damage to people and property resulting from the interaction of hazard, exposure, and vulnerability [21,74]. In this study, the NM-DHI, NDVI, and NDEI were integrated to represent hazard, vulnerability, and exposure, respectively. These indices, together with their weighting factors, were combined to calculate the NDRI, as described in Equation (11).
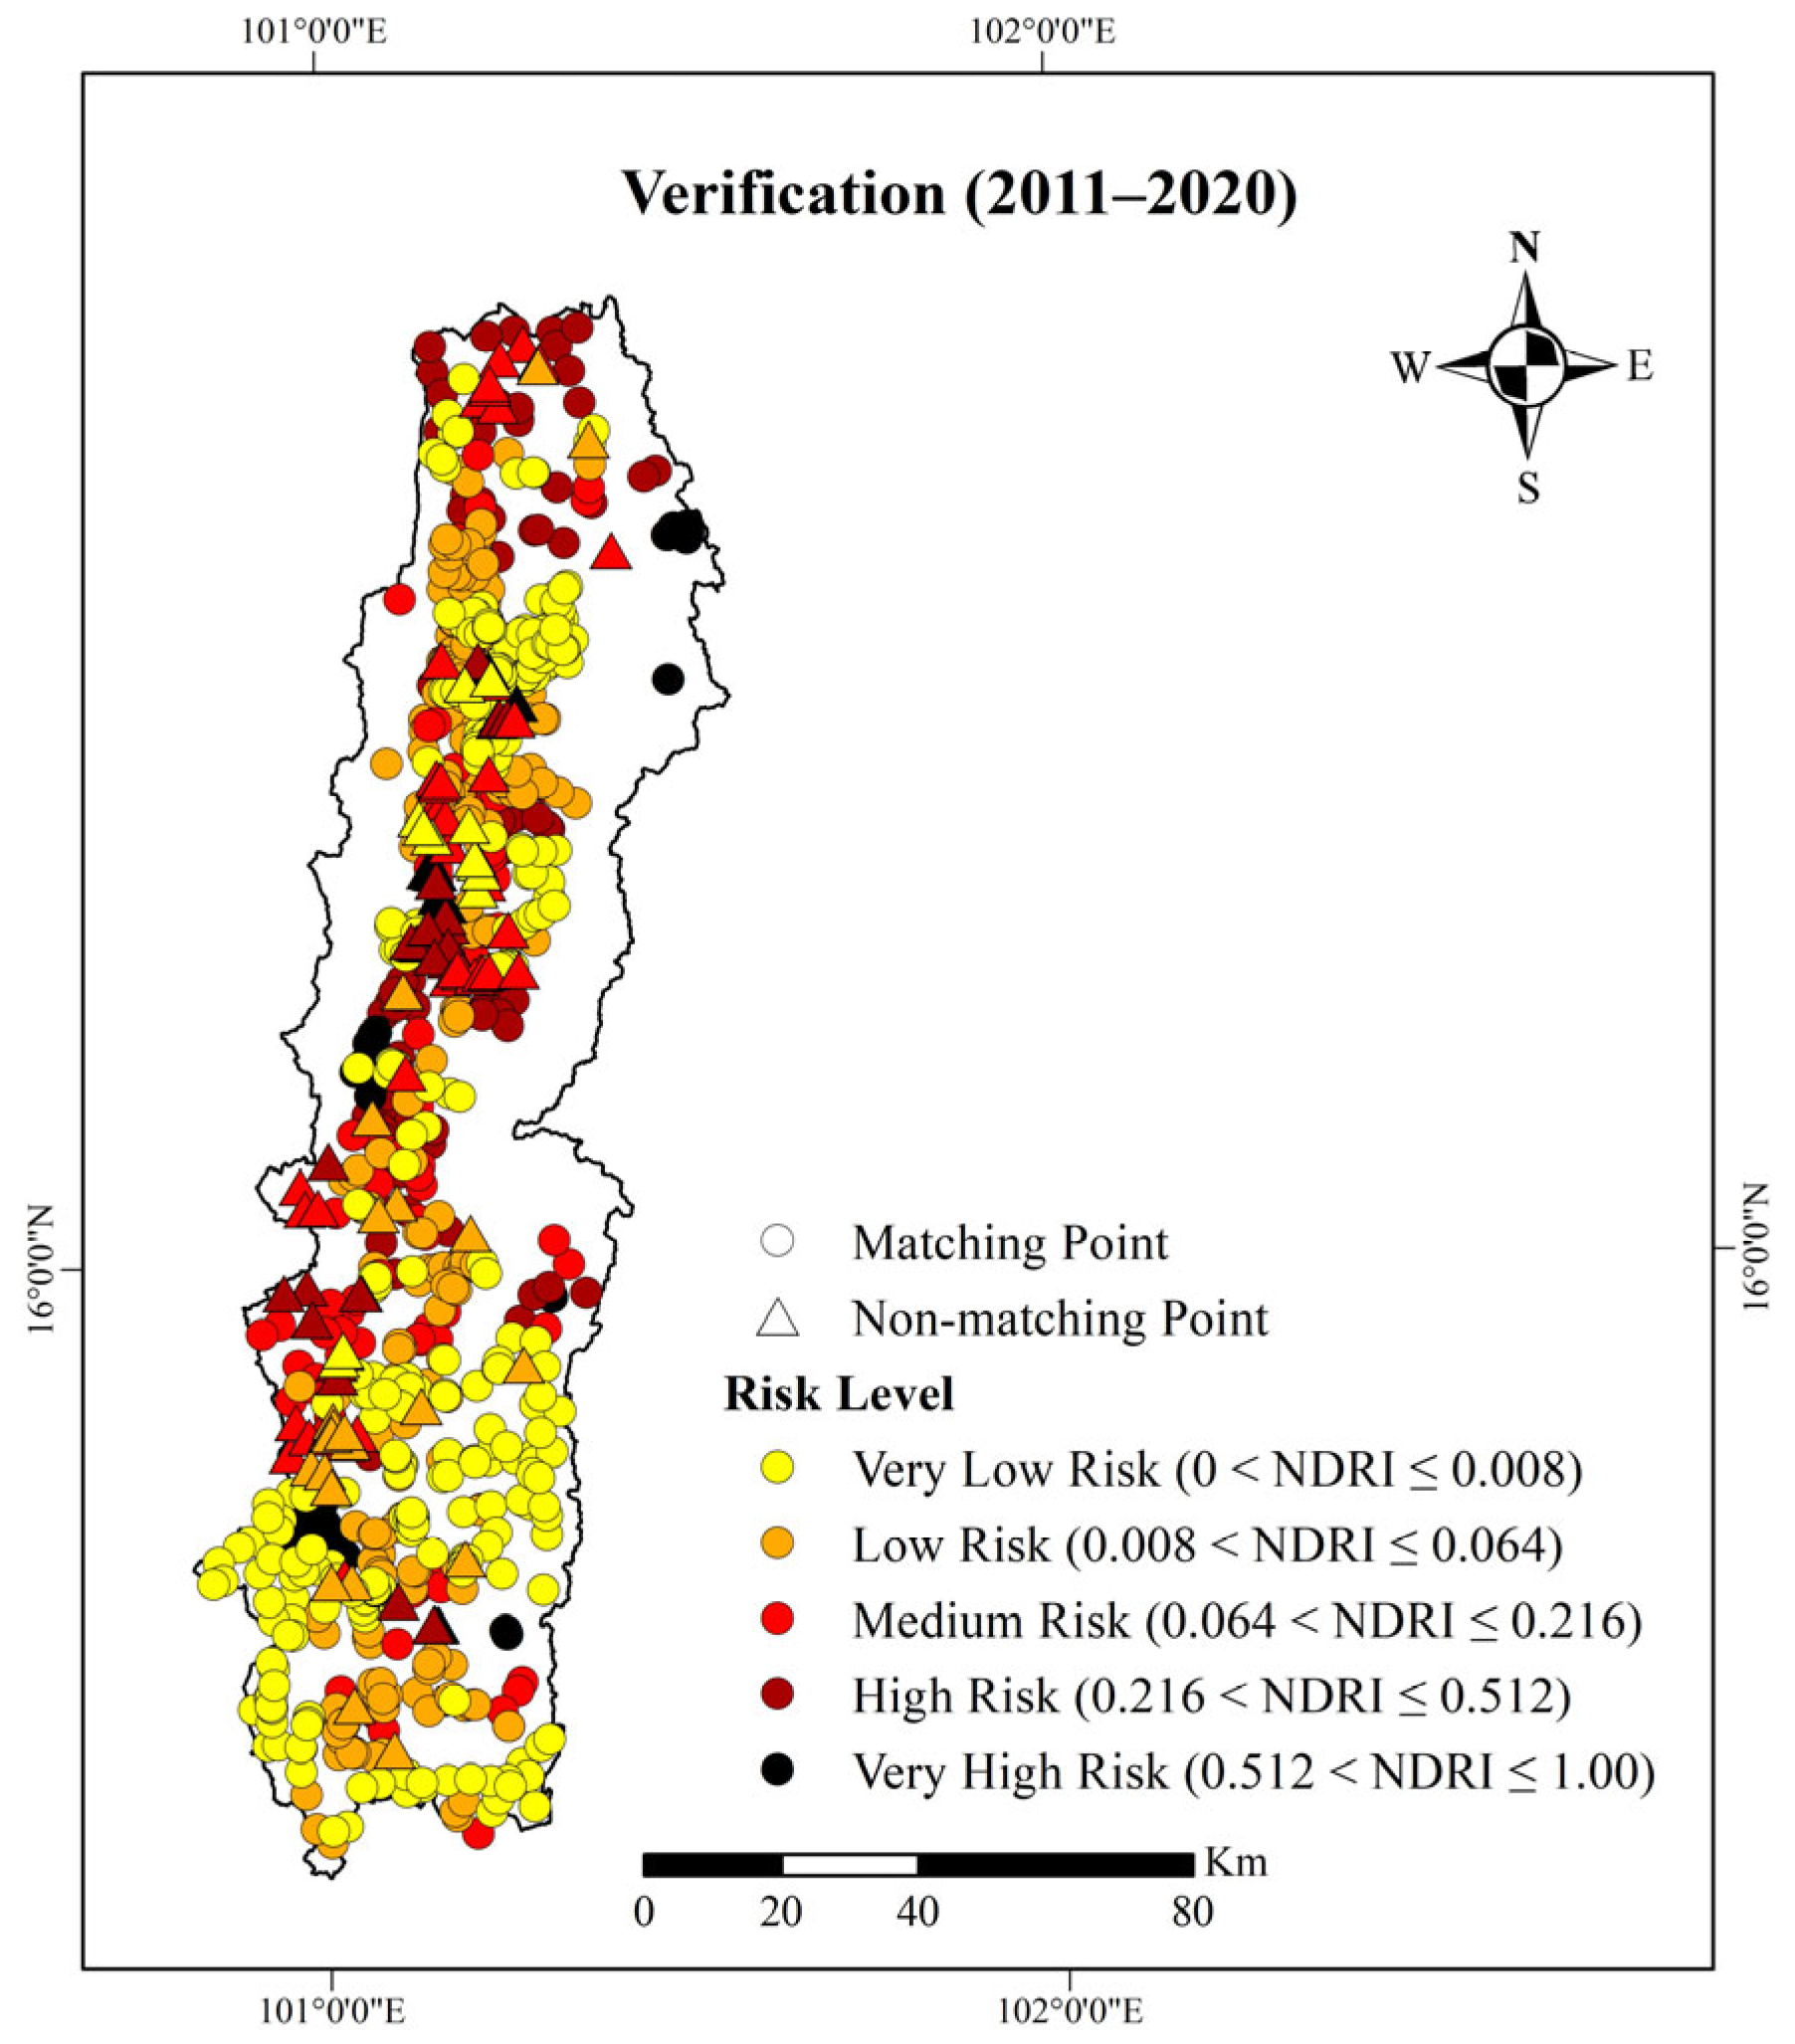
Model performance was evaluated using observed drought risk data collected and analyzed by DDPM [63] for the period 2011–2020. The dataset comprised 960 observation points classified into five categories: very low (382 points), low (289 points), medium (134 points), high (114 points), and very high (41 points). The comparison between observed and simulated results showed matching points of 370 (very low), 264 (low), 90 (medium), 85 (high), and 30 (very high). The non-matching points were 12 (very low), 25 (low), 44 (medium), 29 (high), and 11 (very high), as illustrated in Figure 10. Overall, the proportion of non-matching points was approximately 12.60%, which is below the 20% threshold, indicating acceptable model performance [6]. The statistical evaluation yielded R2 = 0.78 and NSE = 0.77, indicating very good performance [62,75]. The MAE value was 0.18, while PBIAS was +0.9%, which is within the acceptable range of ±10% [65]. These results confirm that the proposed drought risk assessment framework is reliable for projecting and analyzing drought risk up to the 2100s.
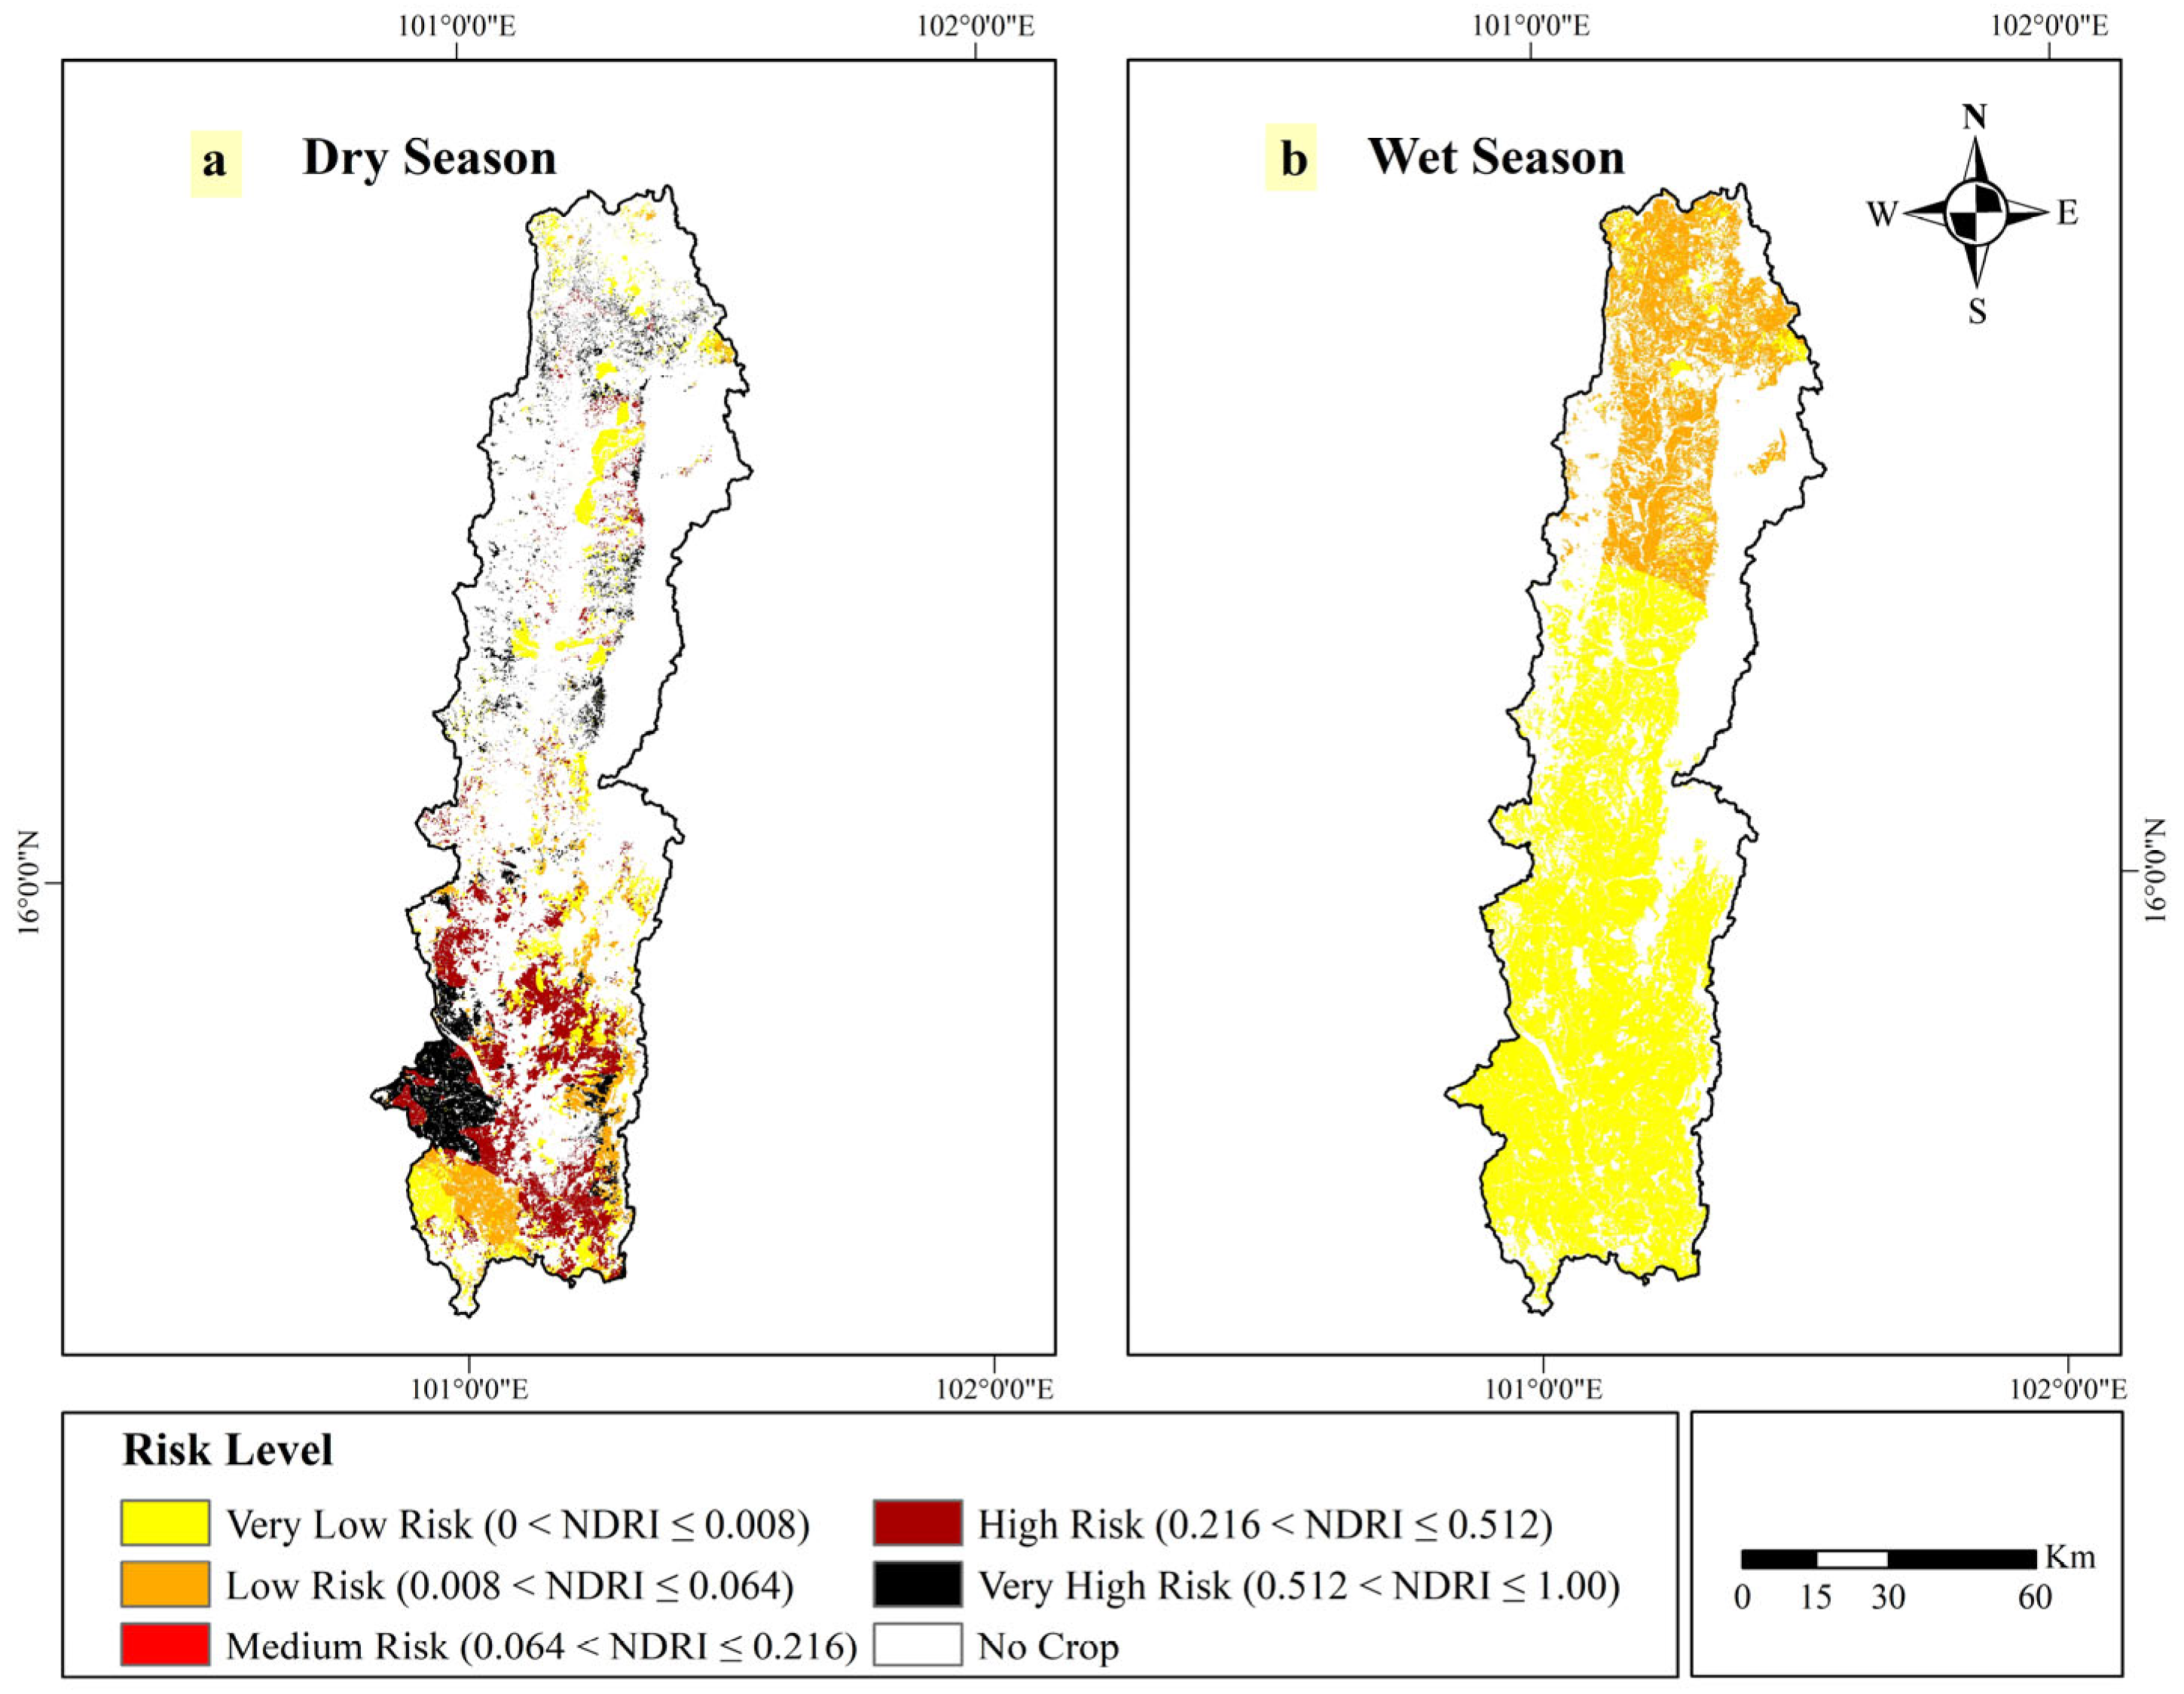
For the 2010s, the historical drought risk was assessed for both dry and wet seasons, showing that the dry seasons generally exhibit higher risk levels than the wet seasons. Figure 11a presents the drought risk map for the dry seasons, where risk levels from very low to very high occur mainly in the Upper Part and Middle Part sub-watersheds. The Lower Part sub-watershed shows predominantly high to very high-risk levels, while very low and low risk levels are concentrated in the Huai Ko Kaeo sub-watershed. During the wet seasons, as shown in Figure 11b, the Upper Part and Huai Nam Phung sub-watersheds are mainly characterized by low risk levels, whereas the Middle Part, Lower-Part and Huai Ko Kaew sub-watersheds are dominated by very low risk levels. Overall, the spatial patterns of drought risk differ clearly between the dry and wet seasons.
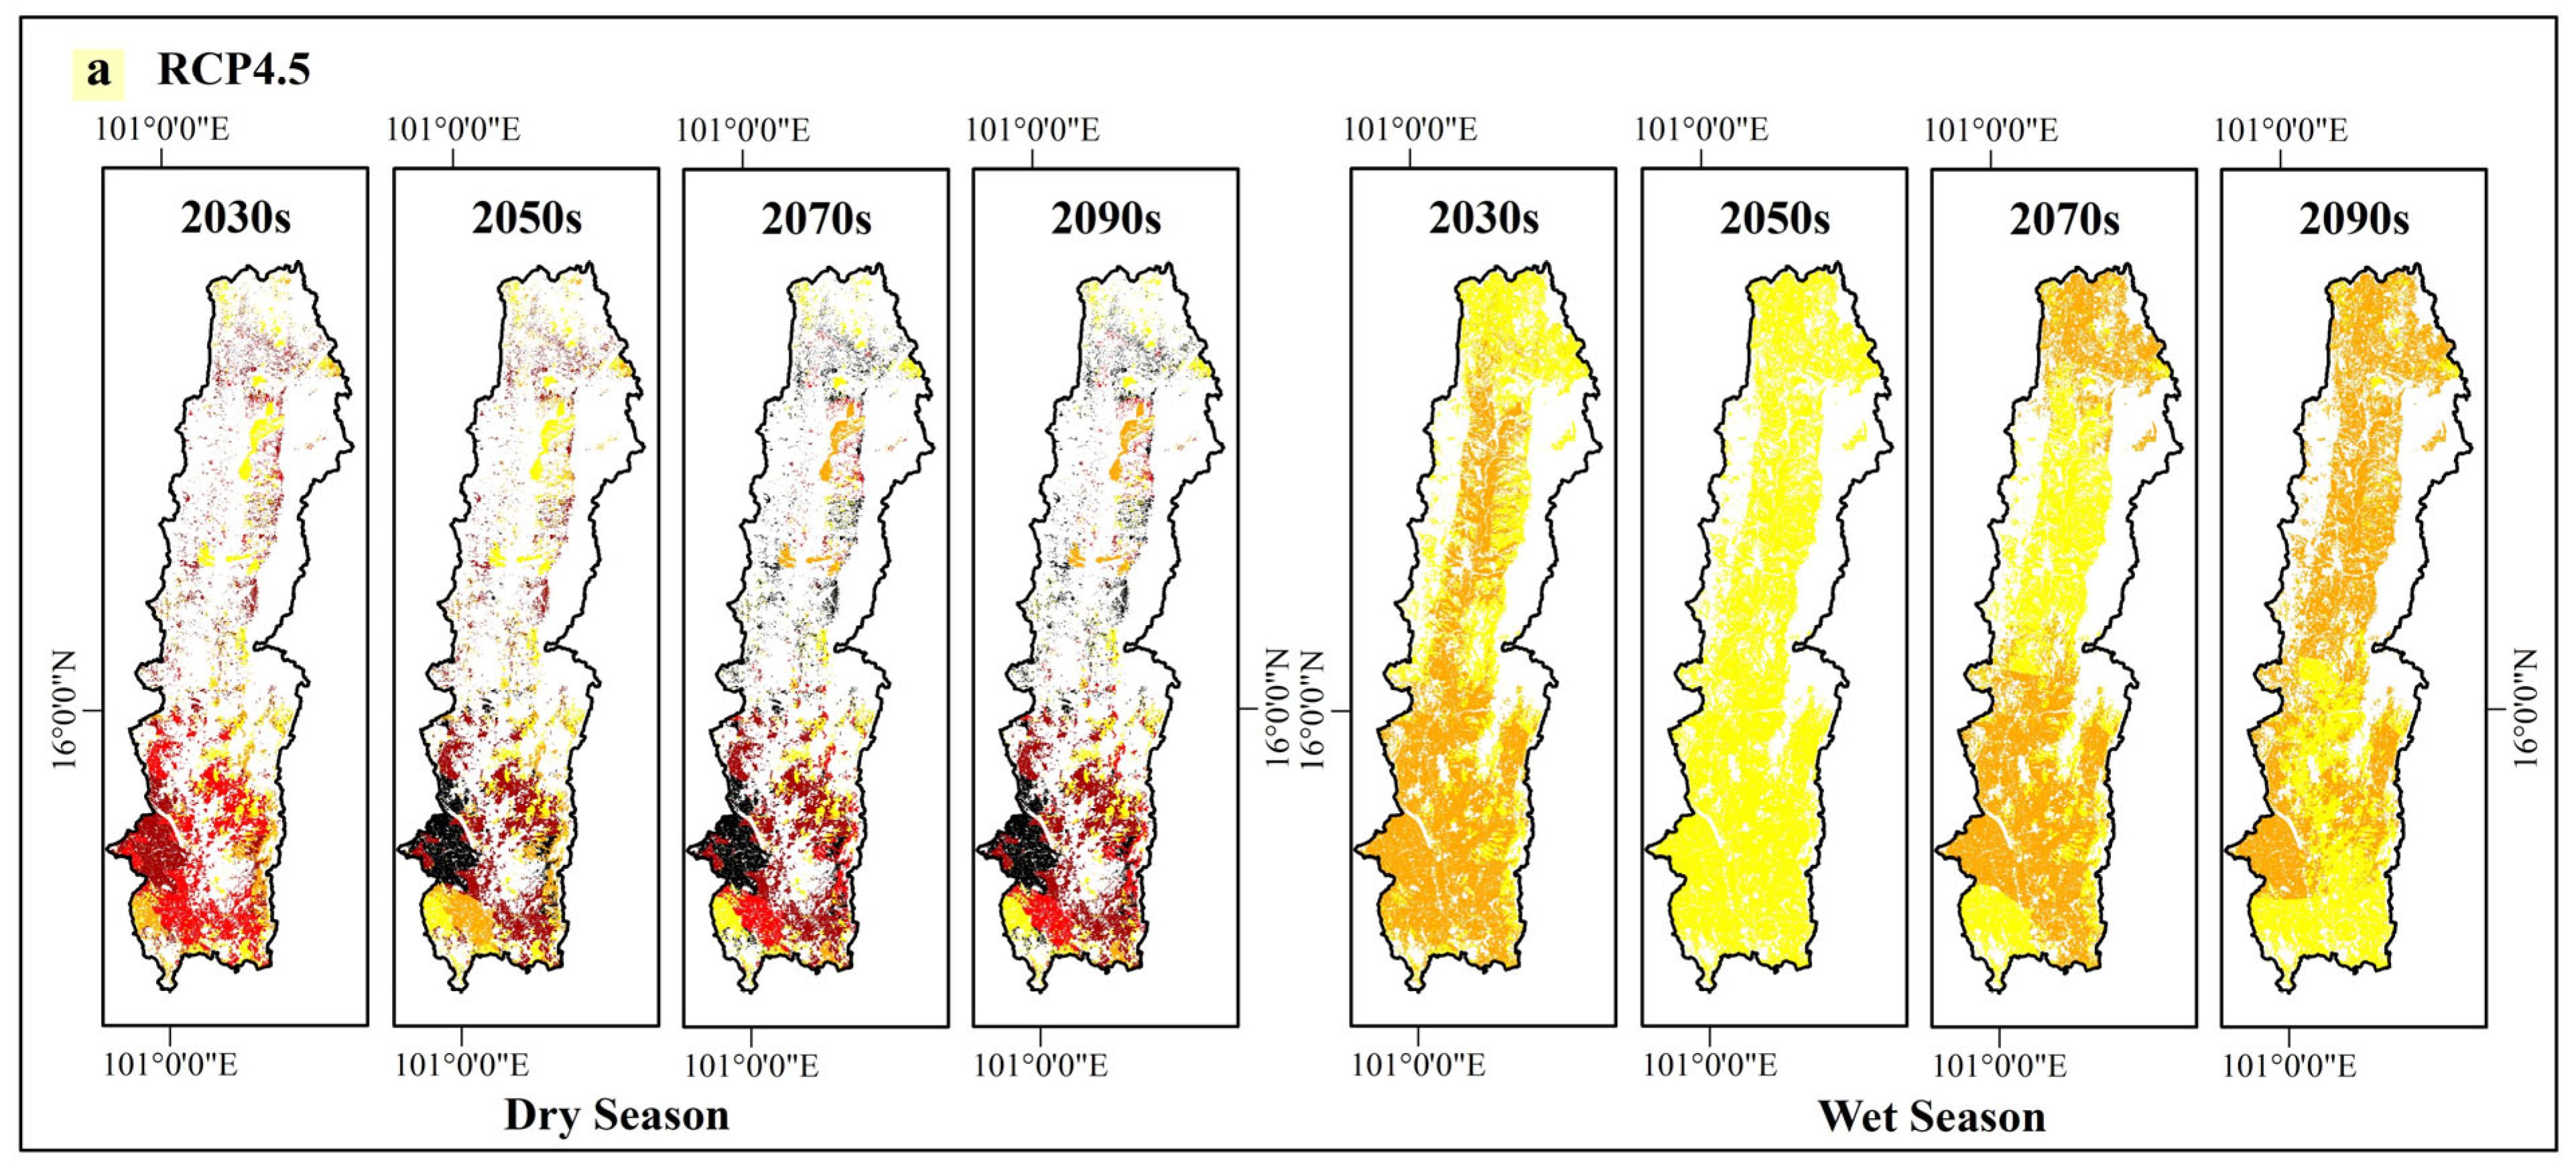
For the projected period, future drought risk maps were analyzed under the RCP4.5 and RCP8.5 scenarios as shown in Figure 12. During the dry seasons, the drought risk under RCP4.5 continually shows an increasing trend from the 2030s to the 2090s with risk levels from very low to very high. A similar pattern is observed under RCP8.5, where the risk decreases from the 2030s to the 2070s and increases again toward the 2090s. In the wet seasons, drought risk levels are generally lower, with most areas classified as very low-to-low risk. Under RCP4.5, the risk trend follows a different pattern to the dry seasons, decreasing from the 2030s to the 2050s and increasing afterward toward the 2090s. In contrast, under RCP8.5, the 2030s and 2050s are dominated by very low risk levels, while the 2070s and 2090s remain largely very low risk, with only small areas of low risk occurring in the Lower Part and Huai Ko Kaew sub-watersheds.
The drought risk-affected areas were estimated at 16,921 rai (irrigated) and 923,575 rai (non-irrigated) during the dry seasons, and 25,229 rai (irrigated) and 762,286 rai (non-irrigated) during the wet seasons, as shown in Table 9. In monetary terms, the crop damage was approximately 148.75 and 17,774.21 Baht in the dry seasons, and 187.72 and 13,494.74 Baht in the wet seasons for irrigated and non-irrigated areas, respectively. These results indicate that irrigated areas experience greater affected area and damage during the wet seasons, whereas non-irrigated areas suffer higher damage during the dry seasons.
For future dry seasons, drought risk in irrigated areas under the RCP4.5 scenario remains nearly unchanged from the 2030s to the 2050s, followed by a remarked increase from the 2050s to the 2070s, and then remains relatively stable from the 2070s to the 2090s. Under the RCP8.5 scenario, drought risk in irrigated areas generally increases from the early period (2030s–2050s) toward the late period (2070s–2090s). In addition, non-irrigated areas under RCP4.5 exhibit a decreasing trend from the 2030s to the 2050s, followed by an increase toward the 2070s, and then remain relatively stable from the 2070s to the 2090s. Under the RCP8.5 scenario, non-irrigated areas show a pronounced decrease from the 2030s to the 2070s, followed by an increase toward the 2090s. For both the RCP4.5 and RCP8.5 scenarios, the highest drought risks occur in the 2090s for irrigated areas and in the 2030s for non-irrigated areas.
During the wet seasons, both irrigated and non-irrigated areas under RCP4.5 show a decreasing trend from the 2030s to the 2050s, followed by an increase from the 2070s to the 2090s. Under RCP8.5, the drought risk generally increases toward the end of the century. The highest wet season risk occurs in the 2030s (RCP4.5) and 2070s–2090s (RCP8.5) for irrigated areas, while non-irrigated areas show the highest risk in the 2090s (RCP4.5) and the 2070s (RCP8.5).

3.8. Drought Adaptation Measures

3.8.1. Scenario 1: Adoption of Drought-Resistant Rice Varieties and Improvement of Irrigation Systems in Irrigated Areas

The adoption of drought-resistant rice varieties is proposed as the primary adaptation measure in this scenario. Paddy fields cultivated with non-glutinous rice varieties RD85 and Khao Dawk Mali 105 (KDML105) cover approximately 71,131 rai (84.66%) of the irrigated area. The average yields of RD85 and KDML105 are about 859 and 363 kg/rai, respectively [76,77]. Introducing drought-resistant varieties such as Hom Siam rice [78,79] to replace the commonly cultivated RD85 may help reduce drought impacts. Compared with RD85 and KDML105, Hom Siam rice provides higher yield and improved drought tolerance. Under optimal conditions, Hom Siam can increase yield by more than 50%, while under drought conditions it develops a 20% larger root system with deeper roots, which enhances water uptake and supports biomass production during water-limited periods.
In addition, this scenario promotes improved irrigation efficiency through the adoption of modern irrigation technologies, such as drip and sprinkler systems, within existing irrigation zones. These measures are applied to approximately 12,889 rai (15.34%) of agricultural land, including field crops (maize, sugarcane, and cassava), perennial crops (rubber and oil palm), and orchards (tamarind). The strategy also encourages the construction of small on-farm ponds to increase local surface water storage. Previous studies indicate that farmers with higher crop productivity are more likely to adopt information and communication technologies, while smart farming technologies are often adopted by younger farmers and those operating larger farms [60]. These strategies are aligned with the objectives of the RID under the 13th National Economic and Social Development Plan (2023–2027), which aims to increase irrigation efficiency in irrigated areas from 43% [80] to 75% [81]. Considering that the agricultural damage was mainly due to low irrigation efficiency, the increase in irrigation efficiency from 43%to 75% would reduce the damage by approximately (75–43) or 32%.
This adaptation measure can be implemented in 13 irrigated projects operated by the RID, including Huai Pa Daeng Reservoir, Khlong Chaliang Lap Reservoir, Huai Pa Lao Reservoir, Wang Pong Weir, Huai Yai Reservoir, Huai Na Reservoir, Huai Khon Kaen Reservoir, Sri Chan Weir, Left Bank Pasak River Weir, Huai Nam Ko Reservoir, Khlong Wua Nao Weir, Huai Leng Weir, and Khlong Lam Kong Reservoir. Under historical conditions (2010s), this scenario could reduce drought-related damage by approximately 5415 and 8073 rai, equivalent to 47.60 and 60.07 million Baht during the dry and wet seasons, respectively, as shown in Table 10. For future scenarios (RCP4.5 and RCP8.5), the affected risk areas and damage during the dry seasons are projected to increase from the 2030s–2050s toward the 2070s–2090s. In contrast, during the wet seasons, RCP4.5 shows a decreasing trend from the 2030s to the 2050s followed by an increase toward the 2090s, whereas RCP8.5 indicates a gradual increase in risk toward the end of the century.

3.8.2. Scenario 2: Utilization of Groundwater Water Sources

The use of groundwater as an alternative water resource is proposed to support field crops, orchards, and perennial crops during drought conditions. According to the DGR, approximately 89 wells have groundwater potential of less than 2 m3/s, 53 wells range between 2 and 10 m3/s, and 4 wells between 10 and 20 m3/s. A study by Koontanakulvong [82] estimated that the average agricultural area benefiting from a single groundwater well is approximately 17.5 rai. Accordingly, this scenario assumes a potential benefit area of 17.5 rai surrounding each well. These areas are therefore considered suitable for groundwater development as a drought mitigation measure. In this study, groundwater availability is assumed to effectively eliminate drought impacts in areas where sufficient groundwater yield is available [83]. However, this measure is primarily applicable during the dry seasons, as groundwater extraction requires pumping systems and incurs operational costs.
The results indicate that in the non-irrigated areas this groundwater adaptation measure could mostly reduce drought-affected areas surrounding the existing groundwater wells by approximately 1107 rai, corresponding to a reduction in economic losses of about 43.36 million Baht during the 2010s. Under future climate scenarios, non-irrigated areas show a decreasing trend in affected areas under RCP4.5 from the 2030s to the 2050s, followed by an increasing trend from the 2050s to the 2070s, and stabilization from the 2070s to the 2090s. Similarly, under RCP8.5, a decreasing trend is observed from the 2030s to the 2070s, followed by an increasing trend toward the 2090s.
Moreover, some irrigated areas still have potential to utilize groundwater resources; however, these areas currently lack sufficient well infrastructure for effective implementation.

3.8.3. Scenario 3: Adaptive Irrigation Management Using Smart Farming Technologies for Tamarind Cultivation

This scenario focuses on improving water distribution systems and irrigation management practices for tamarind cultivation, which generally requires substantial water supply during critical growth periods. The proposed measures include the adoption of information and communication technologies (ICTs) and smart farming technologies (SFTs), together with the implementation of sprinkler and drip irrigation systems. These technologies aim to enhance irrigation efficiency and optimize water use in orchard areas. Empirical studies indicate that farmers achieving higher crop productivity are more likely to adopt ICT-based technologies, while smart farming technologies are more commonly adopted by younger farmers and those managing larger farms [60]. In addition, drip irrigation systems provide greater water-use efficiency than conventional sprinkler systems, as they reduce water consumption while maintaining effective irrigation performance [84]. Overall, this measure is estimated to reduce drought-related damage by approximately 80–95%, depending on the quantity and quality of available water resources [85] and financial investment.
The results indicate that this measure achieves an overall drought reduction efficiency of approximately 80%. This relatively moderate effectiveness is attributed to the limited availability of water infrastructure, including a small number of reservoirs (81 small-scale projects, four medium-scale projects, and no large-scale reservoirs), covering an agricultural benefit area of approximately 264,400 rai (7.46% of the total agricultural area) [27]. During the 2010s, this measure could reduce drought-affected areas by approximately 320 rai in irrigated areas and 137,518 rai in non-irrigated areas, corresponding to economic damage reductions of about 19.29 and 8298.13 million Baht, respectively, during the dry seasons. During the wet seasons, the affected areas decrease by approximately 311 and 49,082 rai, with economic damage reductions of about 18.79 and 2961.68 million Baht, respectively. Under future climate scenarios, during the dry seasons, the affected areas in irrigated zones show a slight increasing trend, while non-irrigated areas exhibit a decreasing trend followed by a subsequent increase under both the RCP4.5 and RCP8.5 scenarios. In contrast, during the wet seasons, both the RCP4.5 and RCP8.5 scenarios demonstrate a clear increasing trend in drought risk from the 2030s–2050s toward the 2070s–2090s.

4. Discussion

Climate change: Future climate projections from the three RCMs were aggregated into four time slices (2030s, 2050s, 2070s, and 2090s). The ensemble mean was used because individual RCM outputs exhibit differing trends and sensitivities, and averaging across models helps to reduce individual model bias and improve the robustness of the projected results [86]. The results indicate that rainfall tends to decrease from the past (2010s) to future periods (2090s) under both the RCP4.5 and RCP8.5 scenarios. In contrast, temperature is projected to increase, with a moderate increase under RCP4.5 and a more substantial increase under RCP8.5 during both the dry and wet seasons. These projected trends are consistent with previous climate change studies conducted in several regions of Thailand, including the Upper Nan River Basin [31], the Wang River Basin [44], the Bang Pakong–Prachin Buri River Basin [86], and the Songkhram River Basin [87]. Moreover, earlier studies conducted in the Pasak Basin confirm the reliability of climate projections used for future assessments in this region [28,88].
Land use change: The projected land use changes indicate slight increases in agricultural land, urban and built-up areas, and water bodies, while forest and miscellaneous land decrease. This pattern is consistent with previous land use studies in northern Thailand, such as the Upper Nan River Basin [39], Chiang Rai Province [89], and the Mae Chang Watershed in Lampang Province [90]. Similar land use change patterns have also been reported in the Pasak River Basin [91], supporting the reliability of the projected land use results in this study.
Drought hazard assessment: The composite drought hazard in this study was developed by integrating meteorological and hydrological drought indicators, including the SPEI, GWSO, and SRI, and using the AHP to determine index weights for each season. The SPEI represents meteorological drought conditions, while the SRI and GWSO reflect hydrological drought in surface and subsurface water systems, respectively. In this framework, GWSO is incorporated as an indicator of subsurface hydrological stress, particularly relevant during periods of limited recharge. This is especially important in non-irrigated areas during the dry seasons, where groundwater availability strongly influences drought severity. The results indicate that during the dry seasons, the weights for the SPEI, GWSO, and SRI are 0.14, 0.43, and 0.43, respectively, in irrigated areas, and 0.25, 0.00, and 0.75 in non-irrigated areas. During the wet seasons, the weights are similar for both irrigated and non-irrigated areas, with SPEI and SRI weights of approximately 0.75 and 0.25, respectively.
The concept of composite drought hazard indices has been widely applied in previous studies. For example, the Combined Drought Hazard Index (CDHI) integrating the SPEI and SRI was developed for the Wang River Basin [19]. Similarly, the Multiple Drought Hazard Index (MDHI) integrating the SPI, SRI, standardized groundwater yield (SGI), and the NDMI was applied in Sukhothai Province [6]. Other studies have also combined drought indicators such as the SPI, groundwater yield, and water resource accessibility in the Songkhram River Basin [12], and the SPEI, SDI, and groundwater yield in the Upper Nan River Basin [31]. Although different indices and weighting methods were used depending on regional drought characteristics, the concept of integrated drought hazard assessment remains consistent, supporting the applicability of this approach in all upstream sub-watersheds of the Pasak Reservoir.
Future drought hazard patterns exhibit clear seasonal differences. During the dry seasons, drought hazard under the RCP4.5 scenario is projected to increase significantly from the 2030s to the 2090s. In contrast, under the RCP8.5 scenario, drought hazard is projected to decrease significantly from the 2030s to the 2070s, followed by an increase from the 2070s to the 2090s. In the wet seasons, drought hazard remains relatively stable, with only minimal changes projected until 2100. Similar increasing trends in projected drought hazards have been reported in the Upper Wang River Basin [44]. Regional studies across northern Thailand also suggest that drought risk may increase in the future, although some studies indicate simultaneous increases in flood risk during the wet seasons [92]. At the global scale, drought assessments based on the SPEI for the period 1951–2016 reveal mixed occurrences of moderate, severe, and extreme drought conditions in sub-watersheds such as the Upper Part and Huai Nam Phung [93]. These findings are consistent with the historical patterns identified in this study, which show a distribution of drought hazard ranging from low to high levels during the 2010s. However, studies specifically addressing drought hazard assessment across all upstream sub-watersheds of the Pasak Reservoir have never been conducted. This highlights the significance of the present study in providing a more comprehensive and spatially explicit understanding of drought hazard in the region.
Drought vulnerability normally refers to the propensity or predisposition of a system to be adversely affected by drought, encompassing economic, social, environmental, and adaptive capacity dimensions. In this study, the vulnerability assessment primarily focuses on the economic dimension, particularly agricultural production, including rice, field crops, orchards, and perennial crops. This focus is driven by the availability of consistent, spatially explicit data on crop damage and agricultural losses across the study area. As mentioned in the scope of this study, due to limited data, the social vulnerability is not considered, such as (e.g., farmer income stability, livelihood diversification), environmental factors, and institutional and adaptive capacity (e.g., irrigation accessibility, governance, and resilience strategies). These social factors are inherently complex and often involve dynamic and location-specific characteristics. For example, farmer income may consist of both direct income from agricultural production and indirect income from secondary occupations (e.g., seasonal labor or migration to other provinces), particularly during the dry seasons when water scarcity limits cultivation, especially in paddy field areas [27]. Due to these data and methodological constraints, this study employs agricultural production losses as a proxy indicator to represent drought-induced economic vulnerability. While this approach effectively captures direct economic impacts, it may not fully reflect the broader vulnerability context.
Seasonal drought risk assessment: The drought risk assessment integrated hazard, exposure, and vulnerability to evaluate risks in the agricultural sector. The results indicate that future drought risk under both RCP4.5 and RCP8.5 is projected to increase during both dry and wet seasons. However, the dry seasons exhibit a wider spatial distribution of risk levels, ranging from very low to very high, whereas the wet seasons is mainly dominated by very low and low risk levels. Previous drought risk studies specifically focusing on the upstream sub-watersheds of Pasak reservoir are still limited. However, a study conducted in nearby regions between 2007 and 2020 reported a similar increasing trend in drought hazard and risk in agricultural areas [6], which supports the findings of this study.
Comparison of Drought Hazard and Risk at the Global Scale: Global-scale assessments of drought hazard and risk in agricultural areas for the period 1980–2016 indicate that Thailand generally exhibits moderate levels of both hazard and risk, particularly within rainfed agricultural systems, which are characterized by intermediate vulnerability [94]. In addition, a global drought risk assessment for the period 2000–2014 reported that Thailand including the Pasak river basin experienced moderate to high drought risk levels [95]. These findings are consistent with the results of this study for the 2010s, which show that drought hazard in non-irrigated areas is predominantly distributed across low-to-high levels, while overall drought risk falls within moderate to high levels.

5. Conclusions

This study analyzed seasonal drought hazard and risk under past and future climate and land use changes in all upstream sub-watersheds of the Pasak Reservoir, where agricultural practices differ significantly between the dry and wet seasons. The dominant crops during the wet seasons are rainfed rice and maize, covering approximately 50.01% of the cultivated area, whereas their cultivation during the dry seasons decrease to less than 2.11%. In contrast, crops such as sugarcane, cassava, pineapple, rubber, oil palm, and tamarind are cultivated across multiple seasons. Seasonal water availability also varies considerably, with water resources during the dry seasons largely depending on stored or supplementary sources. These differences require season-specific drought hazard and risk assessments.

Key Findings

1. Future climate and land use change patterns: Future climate projections indicate a declining rainfall trend, decreasing from 1174.83 mm in the 2010s to 1076.57 mm in the 2090s (−8.36%), and 1053.94 mm (−10.29%) under RCP4.5 and RCP8.5, respectively. In contrast, temperature is projected to increase, with minimum and maximum temperatures rising by 5.83% and 5.11% under RCP4.5, and 14.45% and 11.02% under RCP8.5. Seasonal rainfall is projected to decline during both seasons, with reductions of −11.59% and −7.79% under RCP4.5, and −7.03% and −10.87% under RCP8.5 for dry and wet seasons, respectively. Temperature increases are slightly higher during the wet seasons than the dry seasons. Land use projections indicate slight increases in agricultural land (+0.14%), urban areas (+0.04%), and water bodies (+0.10%), while forest and miscellaneous areas decrease by −0.20% and −0.08%, respectively, until 2100.
2. Drought hazard assessment: The study developed a seasonal M-DHI integrating SRI, GWSO, and SPEI with weighted contributions. In the 2010s, drought hazards during the dry seasons ranged from very low to very high, while the wet seasons were dominated by very low hazard levels. Under RCP4.5 and RCP8.5, drought hazards during the dry seasons show fluctuating trends with periods of decrease followed by periods of increases toward the 2090s, whereas the wet season hazard remains relatively stable at very low levels.
3. Drought risk assessment: The DRI, integrating hazard, vulnerability, and exposure, indicates that irrigated areas experience the highest damage during the wet seasons, while non-irrigated areas are most affected during the dry season in the 2010s. Future projections show an overall increase in drought risk toward the end of the century. During the dry season, risk under RCP4.5 shows a progressive increase from very low to low, low to medium, medium to high, and high to very high levels from the 2030s to the 2090s. In contrast, RCP8.5 shows a decreasing trend from very high to high, high to medium, medium to low, and low to very low risk from the 2030s to the 2070s, followed by a sharp increase toward the 2090s, reaching very high risk levels. During the wet season, RCP4.5 exhibits a decreasing trend in risk from low to very low levels until the 2050s, followed by an increase from very low to low levels toward the 2090s. Meanwhile, RCP8.5 shows a gradual increase in risk from very low to low levels throughout the projection period from the 2030s to the 2090s.
4. Drought adaptation measures: Among the evaluated adaptation strategies, adaptive irrigation management using smart farming technologies for tamarind fruit plant cultivation (Scenario 3) is the most effective measure for the dry seasons, reducing affected areas by approximately 137,838 rai (220.54 km2) and economic losses by about 8317.42 million Baht (USD 232.89 million) in the 2010s. The second and third most effective measures are (1) the adoption of drought-resistant rice varieties combined with improved irrigation systems in irrigated areas (Scenario 1) and (2) the utilization of groundwater resources (Scenario 2). For the wet seasons, Scenario 3 and Scenario 1 remain the most applicable strategies, while Scenario 2 is less suitable due to higher operational costs and lower importance during periods of relatively higher rainfall.

Author Contributions

Conceptualization, TT; methodology; software; validation; formal analysis; investigation; resources; data curation; writing—original draft preparation; writing—review and editing; visualization; supervision, T.P. and T.T.; project administration, T.T. All authors have read and agreed to the published version of the manuscript.

Funding

This research received no external funding.

Data Availability Statement

No new data was created.

Acknowledgments

The authors would like to express their gratitude to the Royal Irrigation Department, the Thai Meteorological Department, the Land Development Department, and the Department of Disaster Prevention and Mitigation of Thailand for their valuable cooperation in providing data for this study. Grateful thanks are also due to the Kasetsart University, at Bangkhen Campus and at Sriracha Campus for their support in this study.

Conflicts of Interest

The authors have no financial and non-financial interests to disclose.

Abbreviations

The following abbreviations are used in this manuscript:
AHPAnalytic Hierarchy Process
DRIDrought Risk Index
GWSOGroundwater Storage Outflow
JIJudgment Index
M-DHIMulti-Drought Hazard Index
SPEIStandardized Precipitation Evapotranspiration Index
SRIStandardized Runoff Index

References

  1. Rajsekhar, D.; Gorelick, S.M. Increasing drought in Jordan: Climate change and cascading Syrian land-use impacts on reducing transboundary flow. Sci. Adv. 2017, 3, e1700581. [Google Scholar] [CrossRef] [Scilit]
  2. AghaKouchak, A.; Mirchi, A.; Madani, K.; Di Baldassarre, G.; Nazemi, A.; Alborzi, A.; Anjileli, H.; Azarderakhsh, M.; Chiang, F.; Hassanzadeh, E.; et al. Anthropogenic drought: Definition, challenges and opportunities. Rev. Geophys. 2021, 59, e2019RG000683. [Google Scholar] [CrossRef] [Scilit]
  3. Vicente-Serrano, S.M.; Quiring, S.M.; Peña-Gallardo, M.; Yuan, S.; Domínguez-Castro, F. A review of environmental droughts: Increased risk under global warming? Earth Sci. Rev. 2020, 201, 102953. [Google Scholar] [CrossRef] [Scilit]
  4. Wilhite, D.A.; Glantz, M.H. Understanding the drought phenomenon: The role of definitions. Water Int. 1985, 10, 111–120. [Google Scholar] [CrossRef] [Scilit]
  5. Rahman, G.; Jung, M.-K.; Kim, T.-W.; Kwon, H.-H. Drought impact, vulnerability, risk assessment, management and mitigation under climate change: A comprehensive review. KSCE J. Civ. Eng. 2025, 29, 100120. [Google Scholar] [CrossRef] [Scilit]
  6. Promping, T.; Tingsanchali, T.; Suttinon, P. A new assessment of drought risks on economic and social sectors in Sukhothai Province, Thailand. Eng. J. 2025, 29, 1–23. [Google Scholar] [CrossRef] [Scilit]
  7. United Nations. World ‘at a Crossroads’ as Droughts Increase Nearly a Third in a Generation. Available online: https://news.un.org/en/story/2022/05/1118142 (accessed on 17 March 2026).
  8. Redfern, S.K.; Azzu, N.; Binamira, J.S. Rice in Southeast Asia: Facing risks and vulnerabilities to respond to climate change. In Building Resilience for Adaptation to Climate Change in the Agriculture Sector: Proceedings of a Joint FAO/OECD Workshop; Meybeck, A., Lankoski, J., Redfern, S., Azzu, N., Gitz, V., Eds.; FAO: Rome, Italy; OECD: Paris, France, 2012; pp. 295–314. [Google Scholar]
  9. Shin, N.; Lee, Y.; Lee, S. Enhancing Thailand’s drought management: Strategies and policy implications. Int. Area Stud. Rev. 2024, 27, 219–237. [Google Scholar] [CrossRef] [Scilit]
  10. Khan, M.; Muhammad, N.; El-Shafie, A. A review of fundamental drought concepts, impacts and analyses of indices in Asian continent. J. Urban Environ. Eng. 2018, 12, 106–119. [Google Scholar] [CrossRef] [Scilit]
  11. United Nations Economic and Social Commission for Asia and the Pacific; Association of Southeast Asian Nations. Ready for the Dry Years: Building Resilience to Drought in South-East Asia, 2nd ed.; UN-ESCAP: Bangkok, Thailand, 2021. [Google Scholar]
  12. Promping, T.; Tingsanchali, T. Meteorological drought hazard assessment under future climate change projection for agricultural area in Songkhram River Basin, Thailand. In Proceedings of the 2020 International Conference and Utility Exhibition on Energy, Environment and Climate Change (ICUE), Pattaya, Thailand, 20–22 October 2020; IEEE: New York, NY, USA, 2020; pp. 1–7. [Google Scholar]
  13. Palmer, W.C. Meteorological Drought; Research Paper No. 45; U.S. Weather Bureau: Washington, DC, USA, 1965.
  14. McKee, T.B.; Doesken, N.J.; Kleist, J. The relationship of drought frequency and duration to time scales. In Proceedings of the 8th Conference on Applied Climatology, Anaheim, CA, USA, 17–22 January 1993; Department of Atmospheric Science Colorado State University: Fort Collins, CO, USA, 1933; pp. 179–184. [Google Scholar]
  15. Vicente-Serrano, S.M.; Beguería, S.; López-Moreno, J.I. A multi-scalar drought index sensitive to global warming: The standardized precipitation evapotranspiration index. J. Clim. 2010, 23, 1696–1718. [Google Scholar] [CrossRef] [Scilit]
  16. Gusyev, M.A.; Hasegawa, A.; Magome, J.; Kuribayashi, D.; Sawano, H.; Lee, S. Drought assessment in the Pampanga River Basin, the Philippines. Part 1: A role of dam infrastructure in historical droughts. In Proceedings of the 21st International Congress on Modelling and Simulation (MODSIM 2015), Broadbeach, Queensland, Australia, 29 November–4 December 2015. [Google Scholar]
  17. Shukla, S.; Wood, A.W. Use of a standardized runoff index for characterizing hydrologic drought. Geophys. Res. Lett. 2008, 35, L02405. [Google Scholar] [CrossRef] [Scilit]
  18. World Meteorological Organization; Global Water Partnership. Handbook of Drought Indicators and Indices; Svoboda, M., Fuchs, B.A., Eds.; Integrated Drought Management Programme (IDMP), Integrated Drought Management Tools and Guidelines Series 2; WMO: Geneva, Switzerland, 2016. [Google Scholar]
  19. Promping, T.; Tingsanchali, T. A method for formulating a new composite drought hazard index for assessment of multiple drought hazards under projected climate and land use changes in agricultural areas: A case of Wang River Basin, Thailand. Nat. Hazards 2025, 121, 3343–3374. [Google Scholar] [CrossRef] [Scilit]
  20. Gudmundsson, L.; Seneviratne, S.I. Anthropogenic climate change affects meteorological drought risk in Europe. Environ. Res. Lett. 2016, 11, 044005. [Google Scholar] [CrossRef] [Scilit]
  21. Wang, T.; Sun, F. Integrated drought vulnerability and risk assessment for future scenarios: An indicator-based analysis. Sci. Total Environ. 2023, 900, 165591. [Google Scholar] [CrossRef] [Scilit]
  22. Chiang, F.; Mazdiyasni, O.; AghaKouchak, A. Evidence of anthropogenic impacts on global drought frequency, duration, and intensity. Nat. Commun. 2021, 12, 2754. [Google Scholar] [CrossRef] [Scilit]
  23. Pokhrel, Y.; Felfelani, F.; Satoh, Y.; Boulange, J.; Burek, P.; Gädeke, A.; Gerten, D.; Gosling, S.N.; Grillakis, M.; Gudmundsson, L.; et al. Global terrestrial water storage and drought severity under climate change. Nat. Clim. Chang. 2021, 11, 226–233. [Google Scholar] [CrossRef] [Scilit]
  24. Khadka, D.; Babel, M.S.; Tingsanchali, T.; Penny, J.; Djordjevic, S.; Abatan, A.A.; Giardino, A. Evaluating the impacts of climate change and land-use change on future droughts in northeast Thailand. Sci. Rep. 2024, 14, 9746. [Google Scholar] [CrossRef] [Scilit] [PubMed]
  25. de Oliveira-Júnior, J.F.; Mendes, D.; Porto, H.D.; Cardoso, K.R.; Neto, J.A.; da Silva, E.B.; de Aquino Pereira, M.; Mendes, M.C.; Baracho, B.B.; Jamjareegulgarn, P. Analysis of drought and extreme precipitation events in Thailand: Trends, climate modeling, and implications for climate change adaptation. Sci. Rep. 2025, 15, 4501. [Google Scholar] [CrossRef] [Scilit]
  26. Sahana, V.; Mondal, A.; Sreekumar, P. Drought vulnerability and risk assessment in India: Sensitivity analysis and comparison of aggregation techniques. J. Environ. Manag. 2021, 299, 113689. [Google Scholar] [CrossRef] [Scilit] [PubMed]
  27. Hydro–Agro Informatics Institute. Data Collection and Analysis for the Development of a Data Warehouse System for 25 River Basins and Flood–Drought Models: Pasak River Basin; HAII: Bangkok, Thailand, 2012. [Google Scholar]
  28. Promping, T.; Tingsanchali, T.; Chuanpongpanich, S. Impacts of future climate change on inflow to Pasak Jolasid Dam in Pasak River Basin, Thailand. In Proceedings of the 25th National Convention on Civil Engineering, Chonburi, Thailand, 15–17 July 2020. [Google Scholar]
  29. Ghimire, U.; Shrestha, S.; Neupane, S.; Mohanasundaram, S.; Lorphensri, O. Climate and land-use change impacts on spatiotemporal variations in groundwater recharge: A case study of the Bangkok area, Thailand. Sci. Total Environ. 2021, 792, 148370. [Google Scholar] [CrossRef] [Scilit]
  30. Alamgir, M.; Mohsenipour, M.; Homsi, R.; Wang, X.; Shahid, S.; Shiru, M.; Alias, N.; Yuzir, A. Parametric assessment of seasonal drought risk to crop production in Bangladesh. Sustainability 2019, 11, 1442. [Google Scholar] [CrossRef] [Scilit]
  31. Foyhirun, C.; Promping, T. Future hydrological drought hazard assessment under climate and land use projections in Upper Nan River Basin, Thailand. Eng. Appl. Sci. Res. 2021, 48, 781–790. [Google Scholar]
  32. Mahmood, R.; Jia, S.; Tripathi, N.K.; Shrestha, S. Precipitation extended linear scaling method for correcting GCM precipitation and its evaluation and implication in the transboundary Jhelum River Basin. Atmosphere 2018, 9, 160. [Google Scholar] [CrossRef] [Scilit]
  33. Shrestha, S.; Shrestha, M.; Babel, M.S. Modelling the potential impacts of climate change on hydrology of Indrawati River Basin in Nepal. Environ. Earth Sci. 2015, 73, 7653–7668. [Google Scholar] [CrossRef] [Scilit]
  34. Shrestha, M. Linear Scaling Bias Correction (V1.0) Microsoft Excel File. Available online: https://www.researchgate.net/publication/289290337_Linear_Scaling_bias_correction_V10_Microsoft_Excel_file (accessed on 17 March 2026).
  35. Andari, R.; Nurhamidah, N.; Daoed, D.; Marzuki. Evaluation of bias correction methods for multi-satellite rainfall estimation products. IOP Conf. Ser. Earth Environ. Sci. 2024, 1317, 012008. [Google Scholar] [CrossRef] [Scilit]
  36. Collier, M.; Uhe, P. CMIP5 Datasets from the ACCESS1.0 and ACCESS1.3 Coupled Climate Models; Centre for Australian Weather and Climate Research: Melbourne, Australia, 2012.
  37. Voldoire, A.; Sanchez-Gomez, E.; Salas y Mélia, D.; Decharme, B.; Cassou, C.; Sénési, S.; Valcke, S.; Beau, I.; Alias, A.; Chevallier, M.; et al. The CNRM-CM5.1 global climate model: Description and basic evaluation. Clim. Dyn. 2013, 40, 2091–2121. [Google Scholar] [CrossRef] [Scilit]
  38. Mauritsen, T.; Bader, J.; Becker, T.; Behrens, J.; Bittner, M.; Brokopf, R.; Brovkin, V.; Claussen, M.; Crueger, T.; Esch, M.; et al. Developments in the MPI-ESM earth system model version 1.2 (MPI-ESM1.2) and its response to increasing CO2. J. Adv. Model. Earth Syst. 2019, 11, 998–1038. [Google Scholar] [CrossRef] [Scilit]
  39. Promping, T.; Tingsanchali, T. Effects of climate change and land-use change on future inflow to a reservoir: A case study of Sirikit Dam, Upper Nan River Basin, Thailand. GMSARN Int. J. 2022, 16, 366–376. [Google Scholar]
  40. Liu, X.; Liang, X.; Li, X.; Chen, Y.; Tian, H.; Yao, Y. A future land use simulation model (FLUS) for simulating multiple land use scenarios by coupling human and natural effects. Landsc. Urban Plan. 2017, 168, 94–116. [Google Scholar] [CrossRef] [Scilit]
  41. Liang, X.; Liu, X.; Li, X.; Chen, Y.; Tian, H.; Yao, Y. Delineating multi-scenario urban growth boundaries with a CA-based FLUS model and morphological method. Landsc. Urban Plan. 2018, 177, 47–63. [Google Scholar] [CrossRef] [Scilit]
  42. Shrestha, S.; Bhatta, B.; Shrestha, M.; Shrestha, P.K. Integrated assessment of the climate and land-use change impact on hydrology and water quality in the Songkhram River Basin, Thailand. Sci. Total Environ. 2018, 643, 1610–1622. [Google Scholar] [CrossRef] [Scilit]
  43. USACE. Hydrologic Modeling System HEC-HMS User’s Manual Version 4.2; U.S. Army Corps of Engineers, Hydrologic Engineering Center: Davis, CA, USA, 2016. [Google Scholar]
  44. Foyhirun, C.; Promping, T. Assessment of climate change and forest conservation impact on ecologically relevant flows: Case study in Wang River Basin, Thailand. Eng. Appl. Sci. Res. 2024, 51, 555–567. [Google Scholar]
  45. Thornthwaite, C.W. An approach toward a rational classification of climate. Geogr. Rev. 1948, 38, 55–94. [Google Scholar] [CrossRef] [Scilit]
  46. Kamruzzaman, M.; Almazroui, M.; Salam, M.A.; Mondol, M.A.H.; Rahman, M.M.; Deb, L.; Kundu, P.K.; Zaman, M.A.U.; Islam, A.R.M.T. Spatiotemporal drought analysis in Bangladesh using the standardized precipitation index (SPI) and standardized precipitation evapotranspiration index (SPEI). Sci. Rep. 2022, 12, 20694. [Google Scholar] [CrossRef] [Scilit] [PubMed]
  47. Zhu, N.; Xu, J.; Li, W.; Li, K.; Zhou, C. A comprehensive approach to assess the hydrological drought of inland river basin in Northwest China. Atmosphere 2018, 9, 370. [Google Scholar] [CrossRef] [Scilit]
  48. Saaty, T.L. A scaling method for priorities in hierarchical structures. J. Math. Psychol. 1977, 15, 234–281. [Google Scholar] [CrossRef] [Scilit]
  49. Saaty, T.L. The Analytic Hierarchy Process: Planning, Priority Setting, Resource Allocation; McGraw-Hill: New York, NY, USA, 1980. [Google Scholar]
  50. Palchaudhuri, M.; Biswas, S. Application of AHP with GIS in drought risk assessment for Puruliya District, India. Nat. Hazards 2016, 84, 1905–1920. [Google Scholar] [CrossRef] [Scilit]
  51. Vogt, J.V.; Naumann, G.; Masante, D.; Spinoni, J.; Cammalleri, C.; Erian, W.; Pischke, F.; Pulwarty, R.; Barbosa, P. Drought Risk Assessment: A Conceptual Framework; EUR 29464 EN; Publications Office of the European Union: Luxembourg, 2018. [Google Scholar]
  52. Intergovernmental Panel on Climate Change. Climate Change 2001: Impacts, Adaptation, and Vulnerability; Cambridge University Press: Cambridge, UK, 2001. [Google Scholar]
  53. Ahmadalipour, A.; Moradkhani, H.; Castelletti, A.; Magliocca, N. Future drought risk in Africa: Integrating vulnerability, climate change, and population growth. Sci. Total Environ. 2019, 662, 672–686. [Google Scholar] [CrossRef] [Scilit]
  54. Bana, R.S.; Rana, K.S.; Choudhary, A.K.; Pooniya, V. Agricultural drought and its mitigation strategies. IFFCO Found. Bull. 2014, 2, 12–26. [Google Scholar]
  55. Jongdee, B.; Pantuwan, G.; Fukai, S.; Fischer, K. Improving drought tolerance in rainfed lowland rice: An example from Thailand. Agric. Water Manag. 2006, 80, 225–240. [Google Scholar] [CrossRef] [Scilit]
  56. Petersen-Perlman, J.D.; Aguilar-Barajas, I.; Megdal, S.B. Drought and groundwater management: Interconnections, challenges, and policy responses. Curr. Opin. Environ. Sci. Health 2022, 28, 100364. [Google Scholar] [CrossRef] [Scilit]
  57. Isarangkul Na Ayutthaya, S. Groundwater Management for Agriculture Under the Decentralized Authority to Local Administrative Organizations for Maximum Benefit; Advanced Certificate Program in Public Administration and Law; King Prajadhipok’s Institute: Bangkok, Thailand, 2005. [Google Scholar]
  58. Tingsanchali, T.; Piriyawong, T. Drought risk assessment of irrigation project areas in a river basin. Eng. J. 2018, 22, 279–287. [Google Scholar] [CrossRef] [Scilit]
  59. Parray, E.A.; Rehman, M.U.; Ud Din, M.; Khanday, D.; Bhat, A. Drought management strategies in fruit crops: An overview. J. Pharmacogn. Phytochem. 2017, 6, 2423–2425. [Google Scholar]
  60. Lilavanichakul, A.; Pathak, T.B. Thai farmers’ perceptions on climate change: Evidence on durian farms in Surat Thani Province. Clim. Serv. 2024, 34, 100475. [Google Scholar] [CrossRef] [Scilit]
  61. Moriasi, D.N.; Arnold, J.G.; Van Liew, M.W.; Bingner, R.L.; Harmel, R.D.; Veith, T.L. Model evaluation guidelines for systematic quantification of accuracy in watershed simulations. Trans. ASABE 2007, 50, 885–900. [Google Scholar] [CrossRef] [Scilit]
  62. Barbosa, J.H.S.; Fernandes, A.L.T.; Lima, A.D.; Assis, L.C. The influence of spatial discretization on HEC-HMS modelling: A case study. Int. J. Hydrol. 2019, 3, 442–449. [Google Scholar] [CrossRef] [Scilit]
  63. Department of Disaster Prevention and Mitigation. Drought Risk Areas Based on Tambon Smart Team Data, Department of Provincial Administration, 2011–2020. Available online: https://datacenter.disaster.go.th/datacenter/cms/8540?id=41488 (accessed on 13 May 2026).
  64. Department of Disaster Prevention and Mitigation. Recurrent Drought and Drought-Prone Areas, 2017–2024. Available online: https://datacenter.disaster.go.th/datacenter/cms/8540?id=128637 (accessed on 13 May 2026).
  65. Chai, T.; Draxler, R.R. Root mean square error (RMSE) or mean absolute error (MAE)? Arguments against avoiding RMSE in the literature. Geosci. Model Dev. 2014, 7, 1247–1250. [Google Scholar] [CrossRef] [Scilit]
  66. Kengkanna, J.; Jakaew, P.; Amawan, S.; Busener, N.; Bucksch, A.; Saengwilai, P. Phenotypic variation of cassava root traits and their responses to drought. Appl. Plant Sci. 2019, 7, e1238. [Google Scholar] [CrossRef] [Scilit]
  67. El-Sharkawy, M.A. Physiological characteristics of cassava tolerance to prolonged drought in the tropics: Implications for breeding cultivars adapted to seasonally dry and semiarid environments. Braz. J. Plant Physiol. 2007, 19, 257–286. [Google Scholar] [CrossRef] [Scilit]
  68. Leanasawat, N.; Kosittrakun, M.; Lontom, W.; Songsri, P. Physiological and agronomic traits of certain sugarcane genotypes grown under field conditions as influenced by early drought stress. Agronomy 2021, 11, 2319. [Google Scholar] [CrossRef] [Scilit]
  69. Rao, P.S.; Saraswathyamma, C.K.; Sethuraj, M.R. Studies on the relationship between yield and meteorological parameters of para rubber tree (Hevea brasiliensis). Agric. For. Meteorol. 1998, 90, 235–245. [Google Scholar] [CrossRef] [Scilit]
  70. Société Internationale de Plantations d’Hévéas. Climate Risk Assessment and Its Impact on Rubber Cultivation; SIPH: Courbevoie, France, 2021. [Google Scholar]
  71. Office of Agricultural Economics. Agricultural Production Data (Rice). Available online: https://oae.go.th/home/article/475 (accessed on 17 March 2026).
  72. Department of Agricultural Extension. Planting Calendar for Field Crops and Cereals; DOAE: Bangkok, Thailand, 2026; Available online: https://esc.doae.go.th/%E0%B8%9B%E0%B8%8F%E0%B8%B4%E0%B8%97%E0%B8%B4%E0%B8%99%E0%B8%81%E0%B8%B2%E0%B8%A3%E0%B8%9B%E0%B8%A5%E0%B8%B9%E0%B8%81%E0%B8%9E%E0%B8%B7%E0%B8%8A%E0%B9%84%E0%B8%A3%E0%B9%88%E0%B9%81%E0%B8%A5%E0%B8%B0/ (accessed on 17 March 2026).
  73. Department of Agricultural Extension. Planting Calendar for Perennial Fruit Trees; DOAE: Bangkok, Thailand, 2026; Available online: https://esc.doae.go.th/%E0%B8%9B%E0%B8%8F%E0%B8%B4%E0%B8%97%E0%B8%B4%E0%B8%99%E0%B8%81%E0%B8%B2%E0%B8%A3%E0%B8%9B%E0%B8%A5%E0%B8%B9%E0%B8%81%E0%B9%84%E0%B8%A1%E0%B9%89%E0%B8%9C%E0%B8%A5%E0%B9%84%E0%B8%A1%E0%B9%89%E0%B8%A2/ (accessed on 17 March 2026).
  74. Kron, W.; Tingsanchali, T.; Loucks, P.; Bogardi, J. Water-related extreme events and their management. In Handbook of Water Resources Management: Discourse, Concepts, Examples; Bogardi, J.J., Gupta, J., Nandalal, K.D.W., Salamé, L., van Nooijen, R.R.P., Kumar, N., Tingsanchali, T., Bhaduri, A., Kolechkina, A.G., Eds.; Springer: Cham, Switzerland, 2021. [Google Scholar]
  75. Odusanya, A.E.; Mehdi, B.; Schürz, C.; Oke, A.O.; Awokola, O.S.; Awomeso, J.A.; Adejuwon, J.O.; Schulz, K. Multi-site calibration and validation of SWAT with satellite-based evapotranspiration in a data-sparse catchment in southwestern Nigeria. Hydrol. Earth Syst. Sci. 2019, 23, 1113–1144. [Google Scholar] [CrossRef] [Scilit]
  76. Deerusamee, C.; Boonchuay, D.; Channoo, C.; Vitoonjit, D.; Suksiri, P.; Boontham, S.; Rodkasem, A.; Yoosingh, W.; Khunbanthao, N.; Phonkhod, B.; et al. RD85, a non-glutinous rice variety. Thai Rice Res. J. 2020, 11, 30–55. [Google Scholar]
  77. Rice Department. Rice Knowledge Bank: Khao Dawk Mali 105. Available online: https://rkb.ricethailand.go.th/web/content_page.php?code=IG2V6DR5CBCR067OJHESNEJGFLSH1 (accessed on 17 March 2026).
  78. Department of Agriculture. Official Announcement on New Rice Varieties. Available online: https://www.doa.go.th/th/wp-content/uploads/2022/02/AnnoDOA_Public258.pdf (accessed on 26 February 2026).
  79. National Science and Technology Development Agency. Hom Siam: A New Fragrant Rice Variety. Available online: https://www.nstda.or.th/en/news/news-years-2022/hom-siam-a-new-fragrant-rice-variety.html (accessed on 26 February 2025).
  80. Vudhivanich, V. Instructional Document on Irrigation Efficiency. Department of Irrigation Engineering, Faculty of Engineering at Kamphaeng Saen, Kasetsart University, Kamphaeng Saen Campus. Available online: https://irre.ku.ac.th/slideshow/pdf/26.pdf (accessed on 14 May 2026).
  81. Royal Irrigation Department. Royal Irrigation Department’s Five-Year Action Plan (2023–2027). Royal Irrigation Department, Ministry of Agriculture and Cooperatives. Available online: https://www.rid.go.th/_data/documents/rid_strategy_plan/operation_plan/rid_plan_66-70.pdf (accessed on 14 May 2026).
  82. Office of the Higher Education Commission. Monitoring Groundwater Data for the Northern Area of the Lower Central Plain and Development of a Groundwater Model Data Integration System (Koontanakulvong S et al.). Available online: https://digital.library.tu.ac.th/tu_dc/frontend/Info/item/dc:82941 (accessed on 14 May 2026).
  83. The Secretariat of The House of Representatives. Water Management in Non-Irrigated Areas (November 2023). Available online: https://old.parliament.go.th/ewtadmin/ewt/parliament_parcy/ewt_dl_link.php?nid=111875&filename=index (accessed on 14 May 2026).
  84. Khunjet, S. A Study on Water Requirement and Optimum Water Application to Durian cv. Monthong; Research Report; Burapha University: Chanthaburi, Thailand, 2018. [Google Scholar]
  85. Ngamsetthasak, S.; Phanphichit, S.; Naenphet, W.; Koyawan, Y. Drip irrigation technology transferring. RMUTP Res. J. 2009, 3, 97–105. [Google Scholar]
  86. Okwala, T.; Shrestha, S.; Ghimire, S.; Mohanasundaram, S.; Datta, A. Assessment of climate change impacts on water balance and hydrological extremes in Bang Pakong–Prachin Buri River Basin, Thailand. Environ. Res. 2020, 186, 109544. [Google Scholar] [CrossRef] [Scilit] [PubMed]
  87. Shrestha, S.; Bhatta, B.; Talchabhadel, R.; Virdis, S.G. Integrated assessment of land use change and climate change impacts on sediment yield in the Songkhram River Basin, Thailand. CATENA 2022, 209, 105859. [Google Scholar] [CrossRef] [Scilit]
  88. Nontikansak, P.; Shrestha, S.; Shanmugam, M.S.; Loc, H.H.; Virdis, S.G. Rainfall extremes under climate change in the Pasak River Basin, Thailand. J. Water Clim. Chang. 2022, 13, 3729–3746. [Google Scholar] [CrossRef] [Scilit]
  89. Akber, M.A.; Shrestha, R.P. Land use change and its effect on biodiversity in Chiang Rai Province of Thailand. J. Land Use Sci. 2013, 10, 108–128. [Google Scholar] [CrossRef] [Scilit]
  90. Vongvassana, S.; Pattanakiat, S.; Tabucanon, A.S.; Chiyanon, T.; Nakmuenwai, P.; Lawawirojwong, S.; Boonriam, W.; Chinsawadphan, P.; Phutthai, T. Scenario-based land cover and land use change modeling in Mae Chang Watershed, Lampang Province, Thailand. Environ. Nat. Resour. J. 2026, 24, 42–57. [Google Scholar] [CrossRef] [Scilit]
  91. Loc, H.H.; Thanavanh, T.; Nguyet, D.A.; Upadhyay, S.; Maung, T.M.; Shrestha, S.; Park, E.; Hamel, P. Understanding the impacts of land use changes on the sustainability of hydrological ecosystem services: The case of Pasak River Basin, Thailand. Environ. Dev. Sustain. 2024. [Google Scholar] [CrossRef] [Scilit]
  92. Lapyai, D.; Chotamonsak, C.; Chantara, S.; Limsakul, A. Projections of hydrological droughts in northern Thailand under RCP scenarios using the composite hydrological drought index (CHDI). Water 2025, 17, 3568. [Google Scholar] [CrossRef] [Scilit]
  93. Spinoni, J.; Barbosa, P.; De Jager, A.; McCormick, N.; Naumann, G.; Vogt, J.V.; Magni, D.; Masante, D.; Mazzeschi, M. A new global database of meteorological drought events from 1951 to 2016. J. Hydrol. Reg. Stud. 2019, 22, 100593. [Google Scholar] [CrossRef] [Scilit]
  94. Meza, I.; Siebert, S.; Döll, P.; Kusche, J.; Herbert, C.; Eyshi Rezaei, E.; Nouri, H.; Gerdener, H.; Popat, E.; Frischen, J.; et al. Global-scale drought risk assessment for agricultural systems. Nat. Hazards Earth Syst. Sci. 2020, 20, 695–712. [Google Scholar] [CrossRef] [Scilit]
  95. Carrão, H.; Naumann, G.; Barbosa, P. Mapping global patterns of drought risk: An empirical framework based on sub-national estimates of hazard, exposure and vulnerability. Glob. Environ. Chang. 2016, 39, 108–124. [Google Scholar] [CrossRef] [Scilit]
Figure 1. Study area of the upstream sub-watersheds of the Pasak Reservoir showing (a) sub-watersheds, (b) topography, and (c) land use in 2021.
Limnolrev 26 00025 g001
Figure 2. Methodology of this study.
Limnolrev 26 00025 g002
Figure 3. Past and projected climate change trends at the Phetchabun weather station (379201) during the period 1970–2100.
Limnolrev 26 00025 g003
Figure 4. Spatial distribution of the SPEI, SRI, and GWSO for drought (a,c) and wet seasons (b,d) during the 2010s (2001–2020).
Limnolrev 26 00025 g004
Figure 5. Matching and non-matching points used for drought hazard map (a) calibration (2011–2020) and (b) validation (2021–2024).
Limnolrev 26 00025 g005
Figure 6. Spatial distribution of seasonal drought hazard in (a) dry and (b) wet seasons during the 2010s (2001–2020).
Limnolrev 26 00025 g006
Figure 7. Projected drought hazard maps with different hazard levels under the RCP4.5 (a) and RCP8.5 (b) scenarios.
Limnolrev 26 00025 g007aLimnolrev 26 00025 g007b
Figure 8. Drought hazard–duration–damage curves for rice (a), field crops (b) and orchard/perennial crops (c). (Source: Modified from Promping et al. [6]).
Limnolrev 26 00025 g008
Figure 9. Drought exposure maps based on crop and product values for the dry and wet seasons during the 2010s.
Limnolrev 26 00025 g009
Figure 10. Verification of drought risk map for agricultural economic sector during 2011–2020.
Limnolrev 26 00025 g010
Figure 11. Drought risk maps of historical 2010s period.
Limnolrev 26 00025 g011
Figure 12. Projected drought risk maps for the dry and wet seasons from the 2030s to the 2090s.
Limnolrev 26 00025 g012aLimnolrev 26 00025 g012b
Table 1. Drought hazard components, classification criteria, normalized drought hazard index (NDHIᵢ), and assigned weights [6].
NoIndex (i)Drought Hazard ClassificationDrought Hazard LevelNDHIiWeights Wi
Dry SeasonsWet Seasons
Irrigated AreaNon-Irrigated AreaIrrigated AreaNon-Irrigated Area
1SRI
[17]
S R I 0 Non-Drought0.200.750.430.250.25
0 > S R I 1.0Mild Drought0.40
1.0 > S R I 1.5 Moderate Drought0.60
1.5 > S R I 2 Severe Drought0.80
S R I < 2Extreme Drought1.00
2GWSO
(m3/h)
[12]
20 G W S O Low0.250.000.430.000.00
10 G W S O < 20 Medium0.50
2 G W S O < 10 High0.75
G W S O < 2Very High1.00
3SPEI
[15]
S P E I 0 Non-Drought0.200.250.140.750.75
0 > S P E I 1.0Mild Drought0.40
1.0 > S P E I 1.5 Moderate Drought0.60
1.5 > S P E I 2 Severe Drought0.80
S P E I < 2Extreme Drought1.00
Table 2. Exposure classification and normalized drought exposure index (NDEIi) based on crop income (Baht per rai) * for the agricultural economic sector [6].
Exposure LevelNDEIiPaddy FieldField CropOrchard/Perennial Land
No Exposure *0000
Very low0.201–13401–19801–4048
Low0.401341–26801981–39604049–8096
Medium0.602681–40203961–59408097–12,144
High0.804021–53605940–792012,145–16,192
Very High1.00Over 5361Over 7921Over 16,193
(Source: Modified from the financial compensation rates for major emergencies or disasters established by the Thailand Government, and agricultural production cost data). * 1 rai = 0.0016 km2 and 1 Baht = 0.028 USD.
Table 3. Past and projected climate data (rainfall and maximum and minimum temperatures) during 2010s (2001–2020), 2030s (2021–2040), 2050s (2041–2060), 2070s (2061–2080), and 2090s (2081–2100) of the dry and wet seasons at the Phetchabun weather station (379201).
RCPsPeriodsRainfall (mm)Maximum Temperature (°C)Minimum Temperature (°C)
DryWetAverageDryWetAverageDryWetAverage
2010s177.86996.971174.8334.2933.4433.8620.8924.3622.63
RCP4.52030s166.60878.411045.0135.0534.2034.6220.9725.0122.99
2050s165.14926.201091.3435.2234.5034.8621.2325.4323.33
2070s160.71912.001072.7135.6734.9035.2921.6325.7923.71
2090s157.25919.321076.5735.9635.2335.5921.8326.0723.95
RCP8.52030s168.41918.281086.6935.0834.2434.6621.1925.1623.17
2050s158.70926.441085.1435.9035.0835.4921.8125.9223.87
2070s168.73887.011055.7436.7936.1536.4722.7226.9724.84
2090s165.35888.581053.9437.8837.3137.5923.7628.0325.90
Table 4. Past land use change trends (km2) * and percentage change during the period 2012–2021.
Land Use Types20122016% Change2018% Change2021% ChangeAverage
% Change
Agriculture549756770.485653−0.1356710.060.14
Forest31913051−0.373025−0.142999−0.09−0.20
Miscellaneous237186−0.13173−0.07164−0.03−0.08
Urban and built-up4584620.014780.094840.020.04
Water body85910.021380.251490.040.10
* Area 1 km2 = 625 rais.
Table 5. The SPEI and SRI values in dry and wet seasons for 2010s, 2030s, 2050s, 2070s, and 2090s at the Phetchabun Station (379201) and the Middle Part sub-watershed upstream of the Pasak Reservoir.
RCPsPeriodsDry SeasonsWet Seasons
SPEI1SPEI3SPEI6SRI1SRI3SRI6SPEI1SPEI3SPEI6SRI1SRI3SRI6
2010s0.190.220.16−0.02−0.17−0.030.030.080.13−0.05−0.05−0.04
4.52030s0.160.110.05−0.61−0.29−0.20−0.040.020.04−0.64−0.29−0.06
2050s0.130.160.11−0.56−0.070.110.130.190.28−0.69−0.180.02
2070s−0.10−0.11−0.08−0.53−0.050.050.010.00−0.04−0.440.000.03
2090s−0.24−0.19−0.08−0.58−0.130.03−0.03−0.17−0.30−0.51−0.080.02
8.52030s0.380.360.26−0.14−0.13−0.170.180.380.580.210.310.29
2050s0.060.050.170.180.240.260.100.140.150.030.010.00
2070s−0.050.030.010.030.030.06−0.07−0.21−0.24−0.16−0.22−0.19
2090s−0.41−0.46−0.44−0.09−0.15−0.17−0.18−0.29−0.47−0.10−0.12−0.11
Table 6. Judgment matrix for pairwise comparison of AHP.
a .
irrigated area
in dry seasons
b .
non-irrigated area
in dry seasons
c .
irrigated area
in wet seasons
d .
non-irrigated area
in wet season
JISRISPEI JISRISGSOSPEI JISPEISRI JISPEISRI
SRI13 SRI113 SPEI13 SPEI13
SPEI1/31 GWSO113 SRI1/31 SRI1/31
sum4/34 SPEI1/31/31 sum4/34 sum4/34
sum7/37/37
Table 7. Determining normalized weights for the thematic layer.
a .
irrigated area
in dry seasons
b .
non-irrigated area
in dry seasons
c .
irrigated area
in wet seasons
d .
non-irrigated area
in wet season
ssJISRISPEIWi JISRIGWSOSPEIWi JISPEISRIWi JISPEISRIWi
SRI3/43/40.75 SRI3/73/73/70.43 SPEI3/43/40.75 SPEI3/43/40.75
SPEI1/41/40.25 GWSO3/73/73/70.43 SRI1/41/40.25 SRI1/41/40.25
sum1.001.001.00 SPEI1/71/71/70.14 1.001.001.00 1.001.001.00
1.001.001.001.00
Table 8. Historical and future drought hazard areas (rai) * for agricultural and non-agricultural areas during the dry and wet seasons in the 2010s, 2030s, 2050s, 2070s, and 2090s.
RCPsPeriodsIrrigated AreasNon-Irrigated Areas
Very LowLowMediumHighVery HighVery LowLowMediumHighVery High
Dry Season
2010s81,818280141130191,131547,721141,534452,558102,088
4.52030s81,6012981113049,142705,02323,921617,82034,954
2050s81,619281121010236,870536,347290,271367,3730
2070s81,62602860101235,3120839,2790356,270
2090s81,62602860101235,6140839,2130356,034
8.52030s81,6012980113049,142724,0754870652,7740
2050s81,61227425101098,546658,398173,103459,25541,559
2070s81,716251702081765,0977545635,92321,534763
2090s81,70802030101239,6330837,4920353,735
Wet Season
2010s82,01200003,085,4180000
4.52030s
2050s
2070s
2090s
8.52030s
2050s
2070s
2090s
* 1 rai = 0.0016 km2 and 1 Baht = 0.028 USD.
Table 9. Drought risk-affected areas (rai) * and associated economic losses (million Baht) * in the 2010s, 2030s, 2050s, 2070s, and 2090s for agricultural and non-agricultural areas during the dry and wet seasons.
RCMsPeriodsDry SeasonsWet Seasons
IrrigatedNon-IrrigatedIrrigatedNon-Irrigated
raiMillion BahtraiMillion BahtraiMillion BahtraiMillion Baht
2010s16,921148.75923,57517,774.2125,229187.72762,28613,494.74
4.52030s16,544136.20984,73818,821.0931,704220.331,001,65913,614.32
2050s16,530135.49884,92315,487.2516,402128.49617,0849,791.06
2070s32,171243.41964,55718,077.8918,934159.91978,59515,938.80
2090s32,171243.41964,50818,075.6130,551237.281,003,24017,923.23
8.52030s16,539135.93984,73818,821.0916,402128.49617,0849,791.06
2050s16,917148.25959,10117,172.7616,402128.49617,0849,791.06
2070s23,567177.47645,95113,063.0932,716256.371,154,88219,098.30
2090s25,391203.51965,03218,105.5832,716256.371,121,03518,712.91
* 1 rai = 0.0016 km2 and 1 Baht = 0.028 USD.
Table 10. Impacts of drought risk adaptation measures on drought damage (area in rai and million Baht) * in agricultural and non-agricultural areas during the dry and wet seasons.
Area2010sRCP4.5RCP8.5
2030s2050s2070s2090s2030s2050s2070s2090s
Dry Season
Scenario 1: Adoption of drought-resistant rice varieties and improvement of irrigation systems in irrigated areas
Irrigated Area54155294529010,29510,2955292541375418125
(47.60)(43.58)(43.36)(77.89)(77.89)(43.50)(47.44)(56.79)(65.12)
Scenario 2: Utilization of groundwater water sources
Non-Irrigated Area1107970830970970968962689965
(43.36)(35.53)(27.90)(29.44)(29.44)(35.48)(35.19)(26.34)(29.17)
Scenario 3: Adaptive irrigation management using smart farming technologies for tamarind cultivation
Irrigated Area320255246264264252313254262
(19.29)(15.40)(14.88)(15.94)(15.94)(15.19)(18.87)(15.33)(15.85)
Non-Irrigated Area137,518144,294107,332136,876136,847144,294122,234107,037137,241
(8298.13)(8707.01)(6476.62)(8259.38)(8257.64)(8707.01)(7375.86)(6458.82)(8281.40)
Wet Season
Scenario 1: Adoption of drought-resistant rice varieties and improvement of irrigation systems in irrigated areas
Irrigated Area807310,1455249605997765249524910,46910,469
(60.07)(70.51)(41.12)(51.17)(75.93)(41.12)(41.12)(82.04)(82.04)
Scenario 3: Adaptive irrigation management using smart farming technologies for tamarind cultivation
Irrigated Area311254241307477241241481481
(18.79)(15.33)(14.51)(18.51)(28.76)(14.52)(14.52)(29.01)(29.01)
Non-Irrigated Area49,08233,11531,98244,35363,61831,98231,98263,78263,502
(2961.68)(1998.25)(1929.87)(2676.32)(3838.79)(1929.87)(1929.87)(3848.70)(3831.82)
* 1 rai = 0.0016 km2 and 1 Baht = 0.028 USD.
Disclaimer/Publisher’s Note: The statements, opinions and data contained in all publications are solely those of the individual author(s) and contributor(s) and not of MDPI and/or the editor(s). MDPI and/or the editor(s) disclaim responsibility for any injury to people or property resulting from any ideas, methods, instructions or products referred to in the content.