

Synthesis, Characterization, and Performance Evaluation of Hybrid Waste Sludge Biochar for COD and Color Removal from Agro-Industrial Effluent

 , ,
, ,  , , ,
, , ,  and
and 
Abstract
:
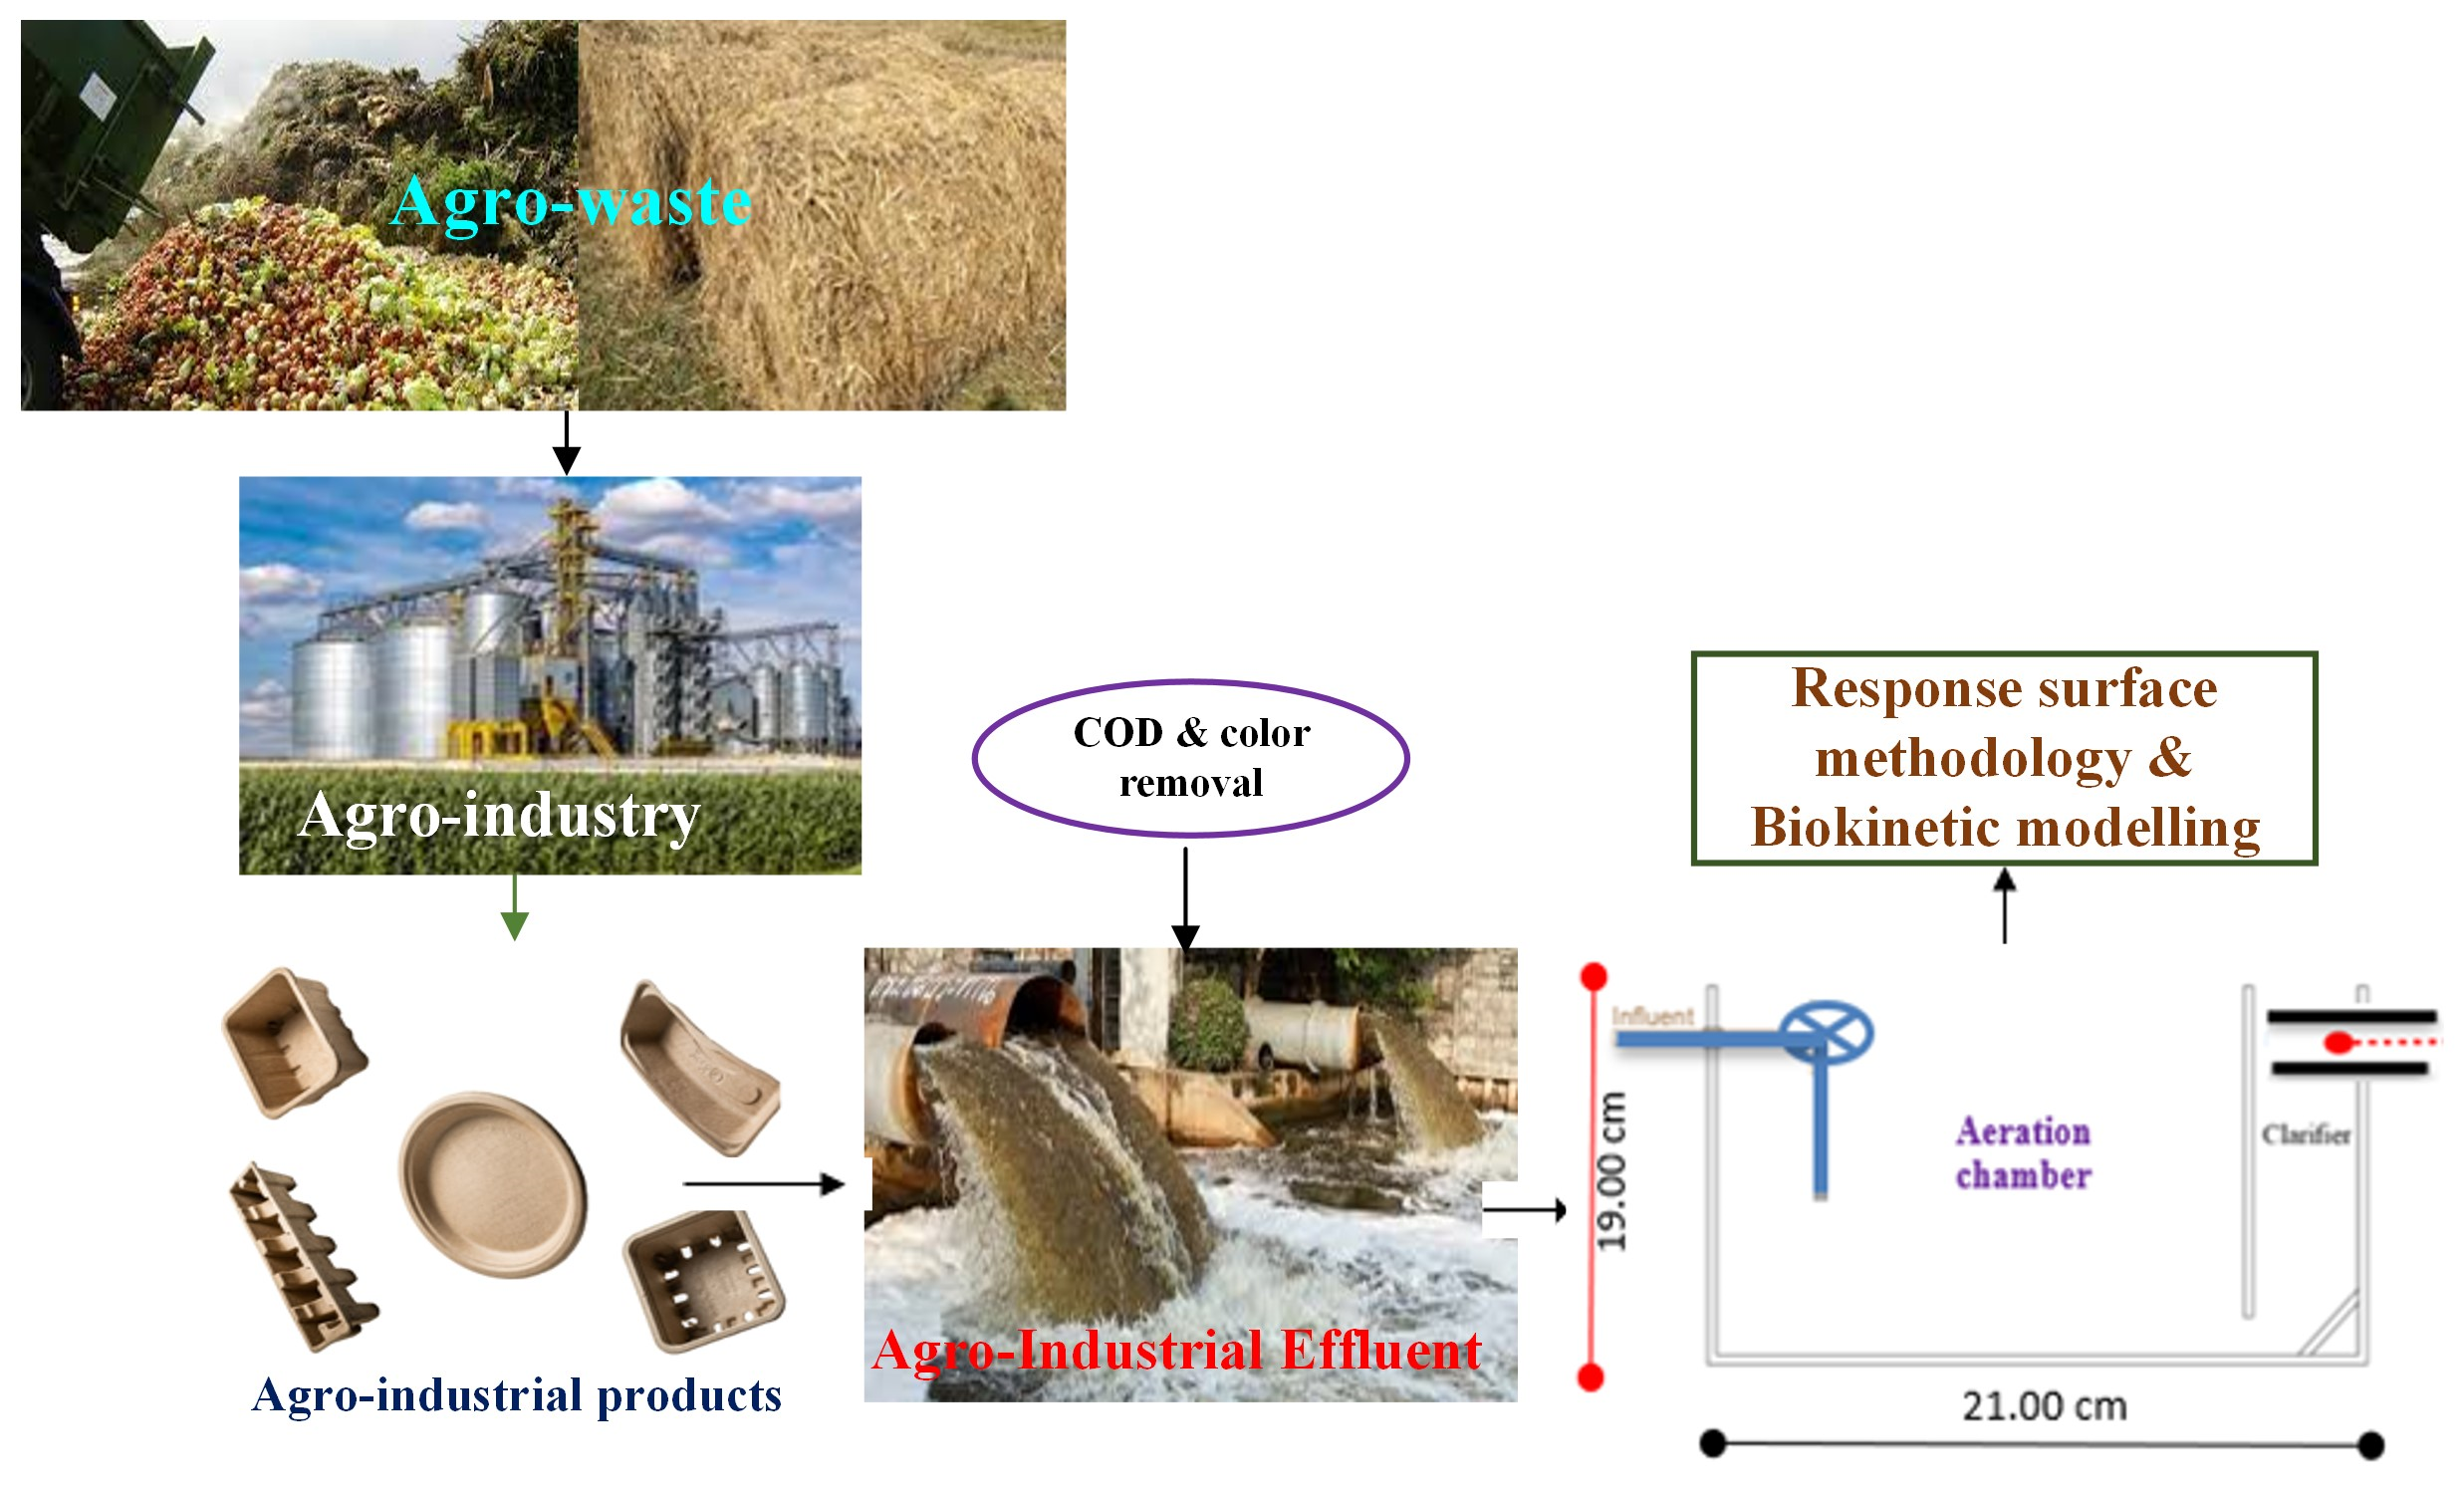
1. Introduction
2. Materials and Methods
2.1. Materials
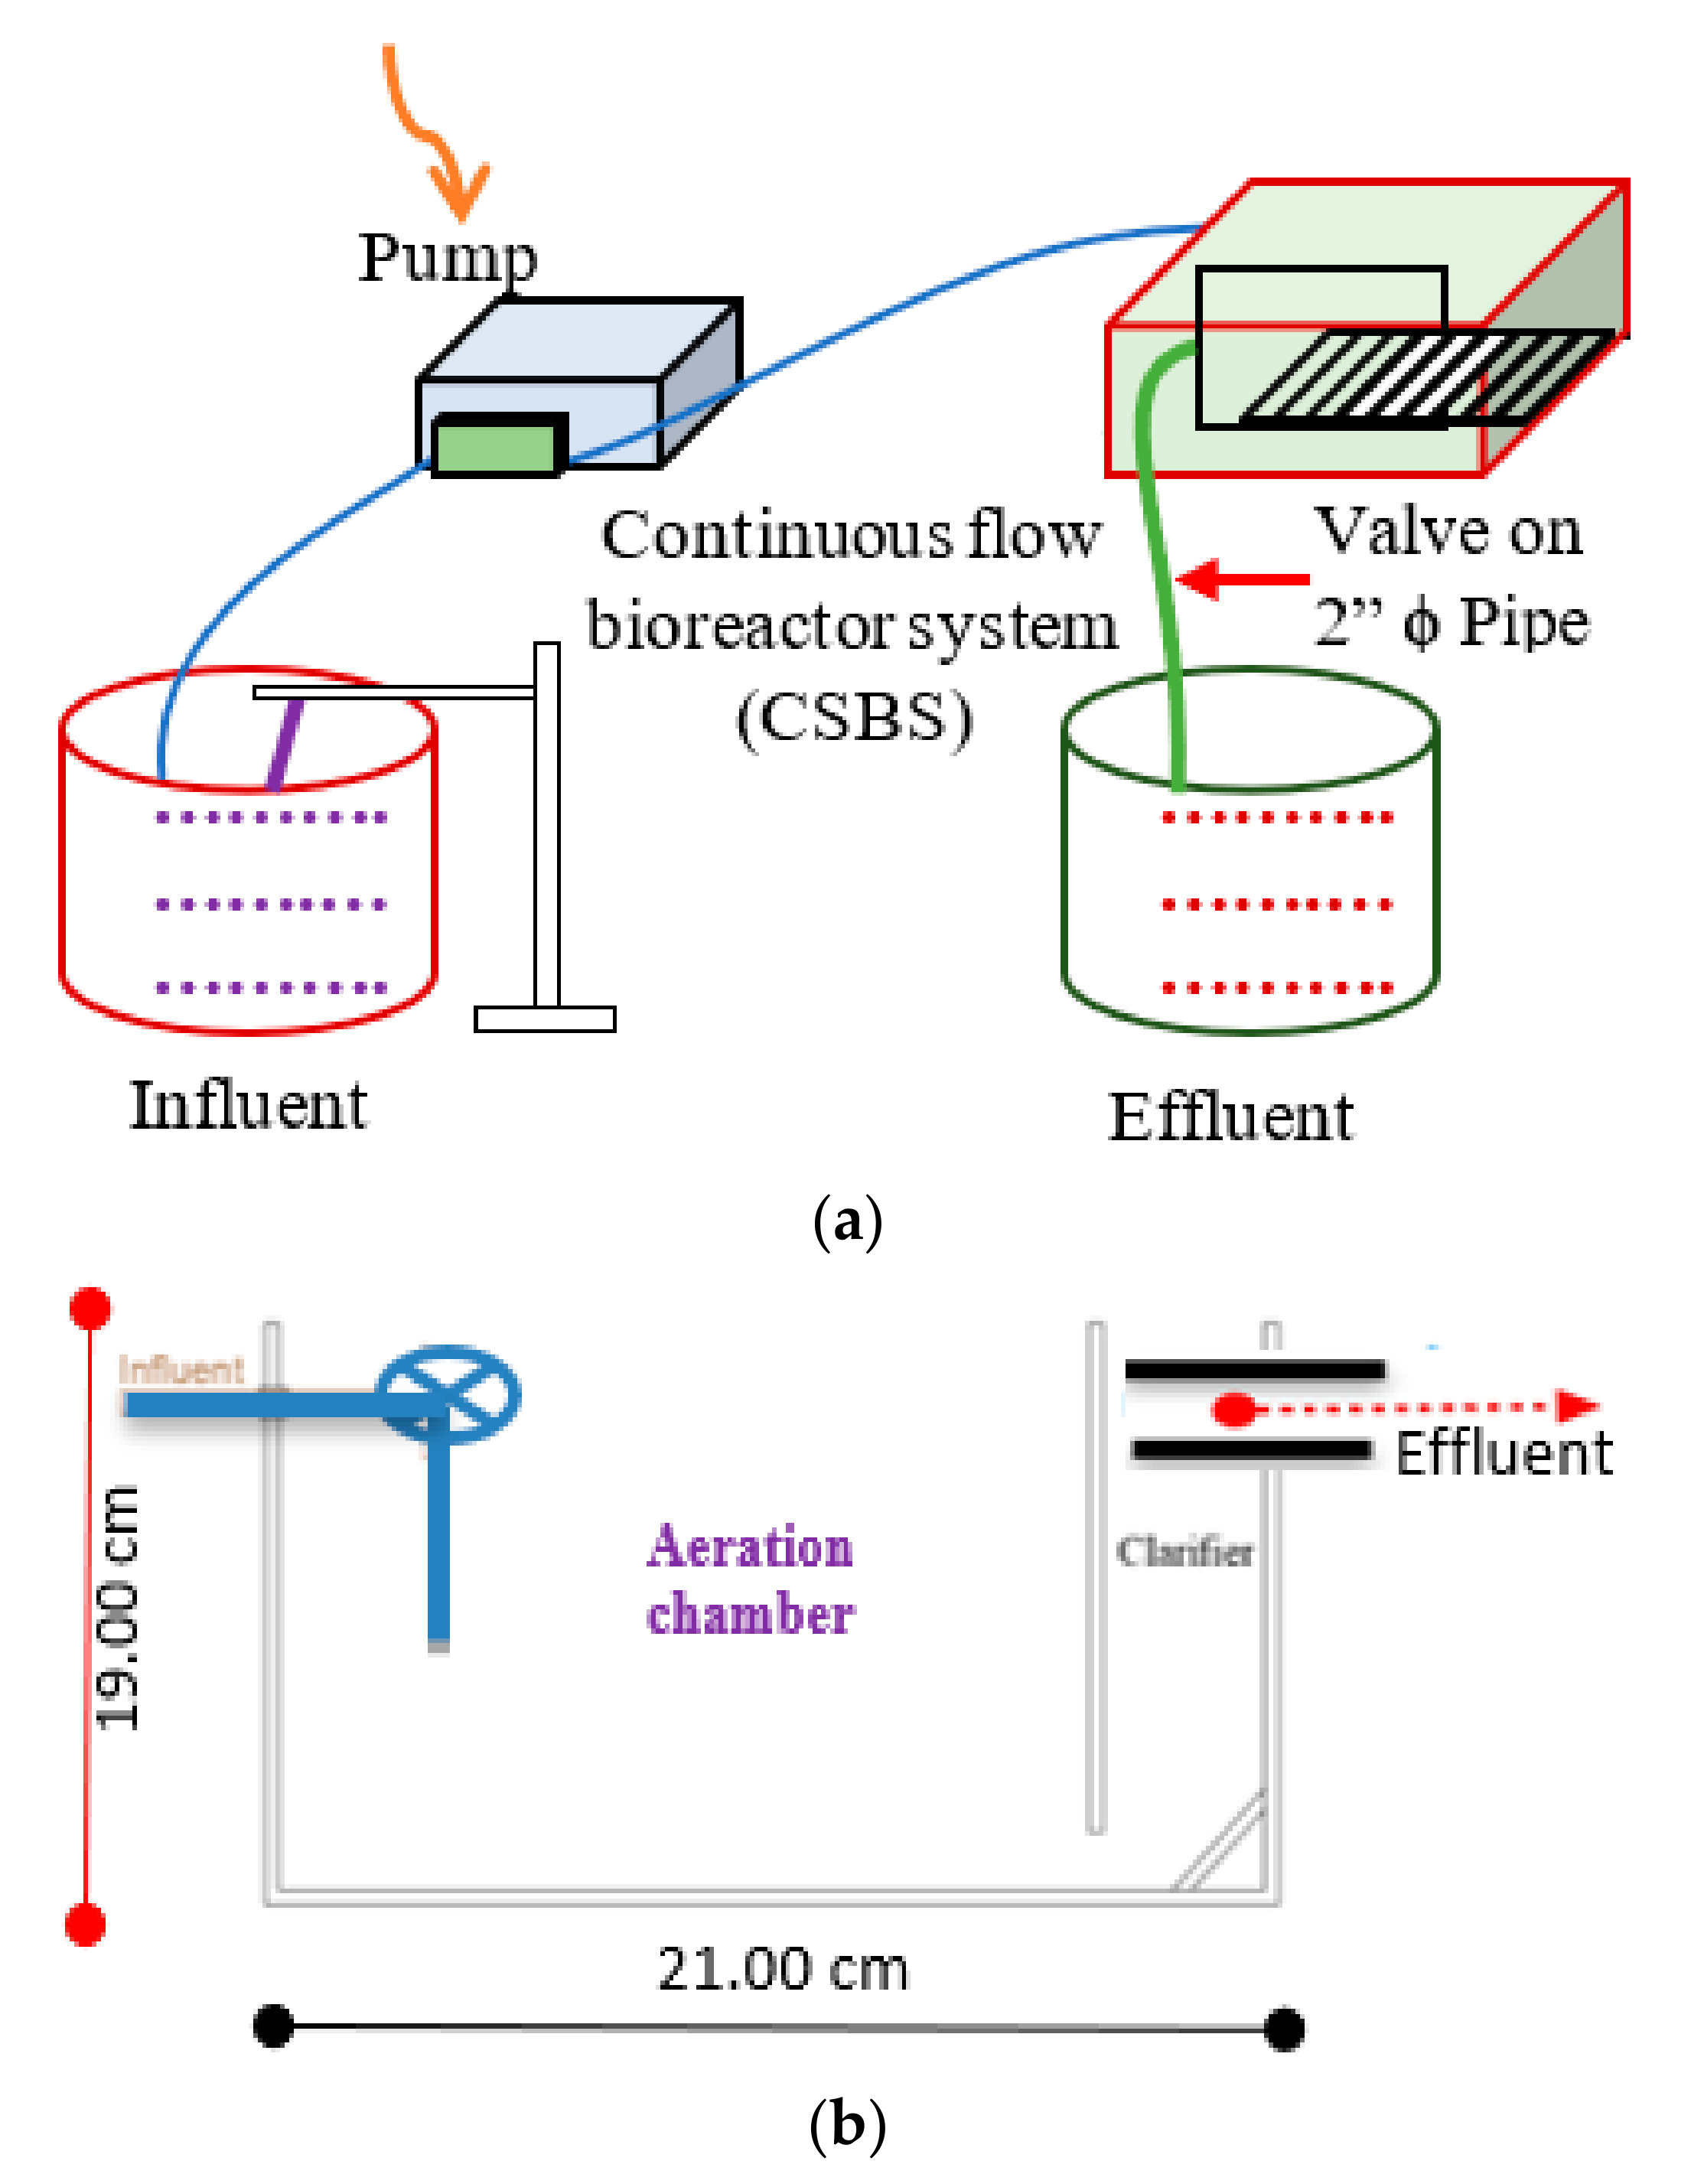
2.2. Bioreactor Experimental Set-Up and Biomass Acclimation
2.3. HWSB Synthesis
2.4. HWSB Characterization
2.5. Analytical Methods
2.6. CFBS Process Optimization by RSM for COD and Color Removal
2.7. Models for Substrate Removal Biokinetic Analysis in CFBS System
2.7.1. First-Order Kinetic Model
2.7.2. Grau Second-Order Kinetic Model
2.7.3. Modified Stover–Kincannon Model
3. Results and Discussion
3.1. AIE Characteristics
3.2. HWSB Analysis Result
3.2.1. Oxide Composition, Elemental Analysis, and Physical Properties of HWSB
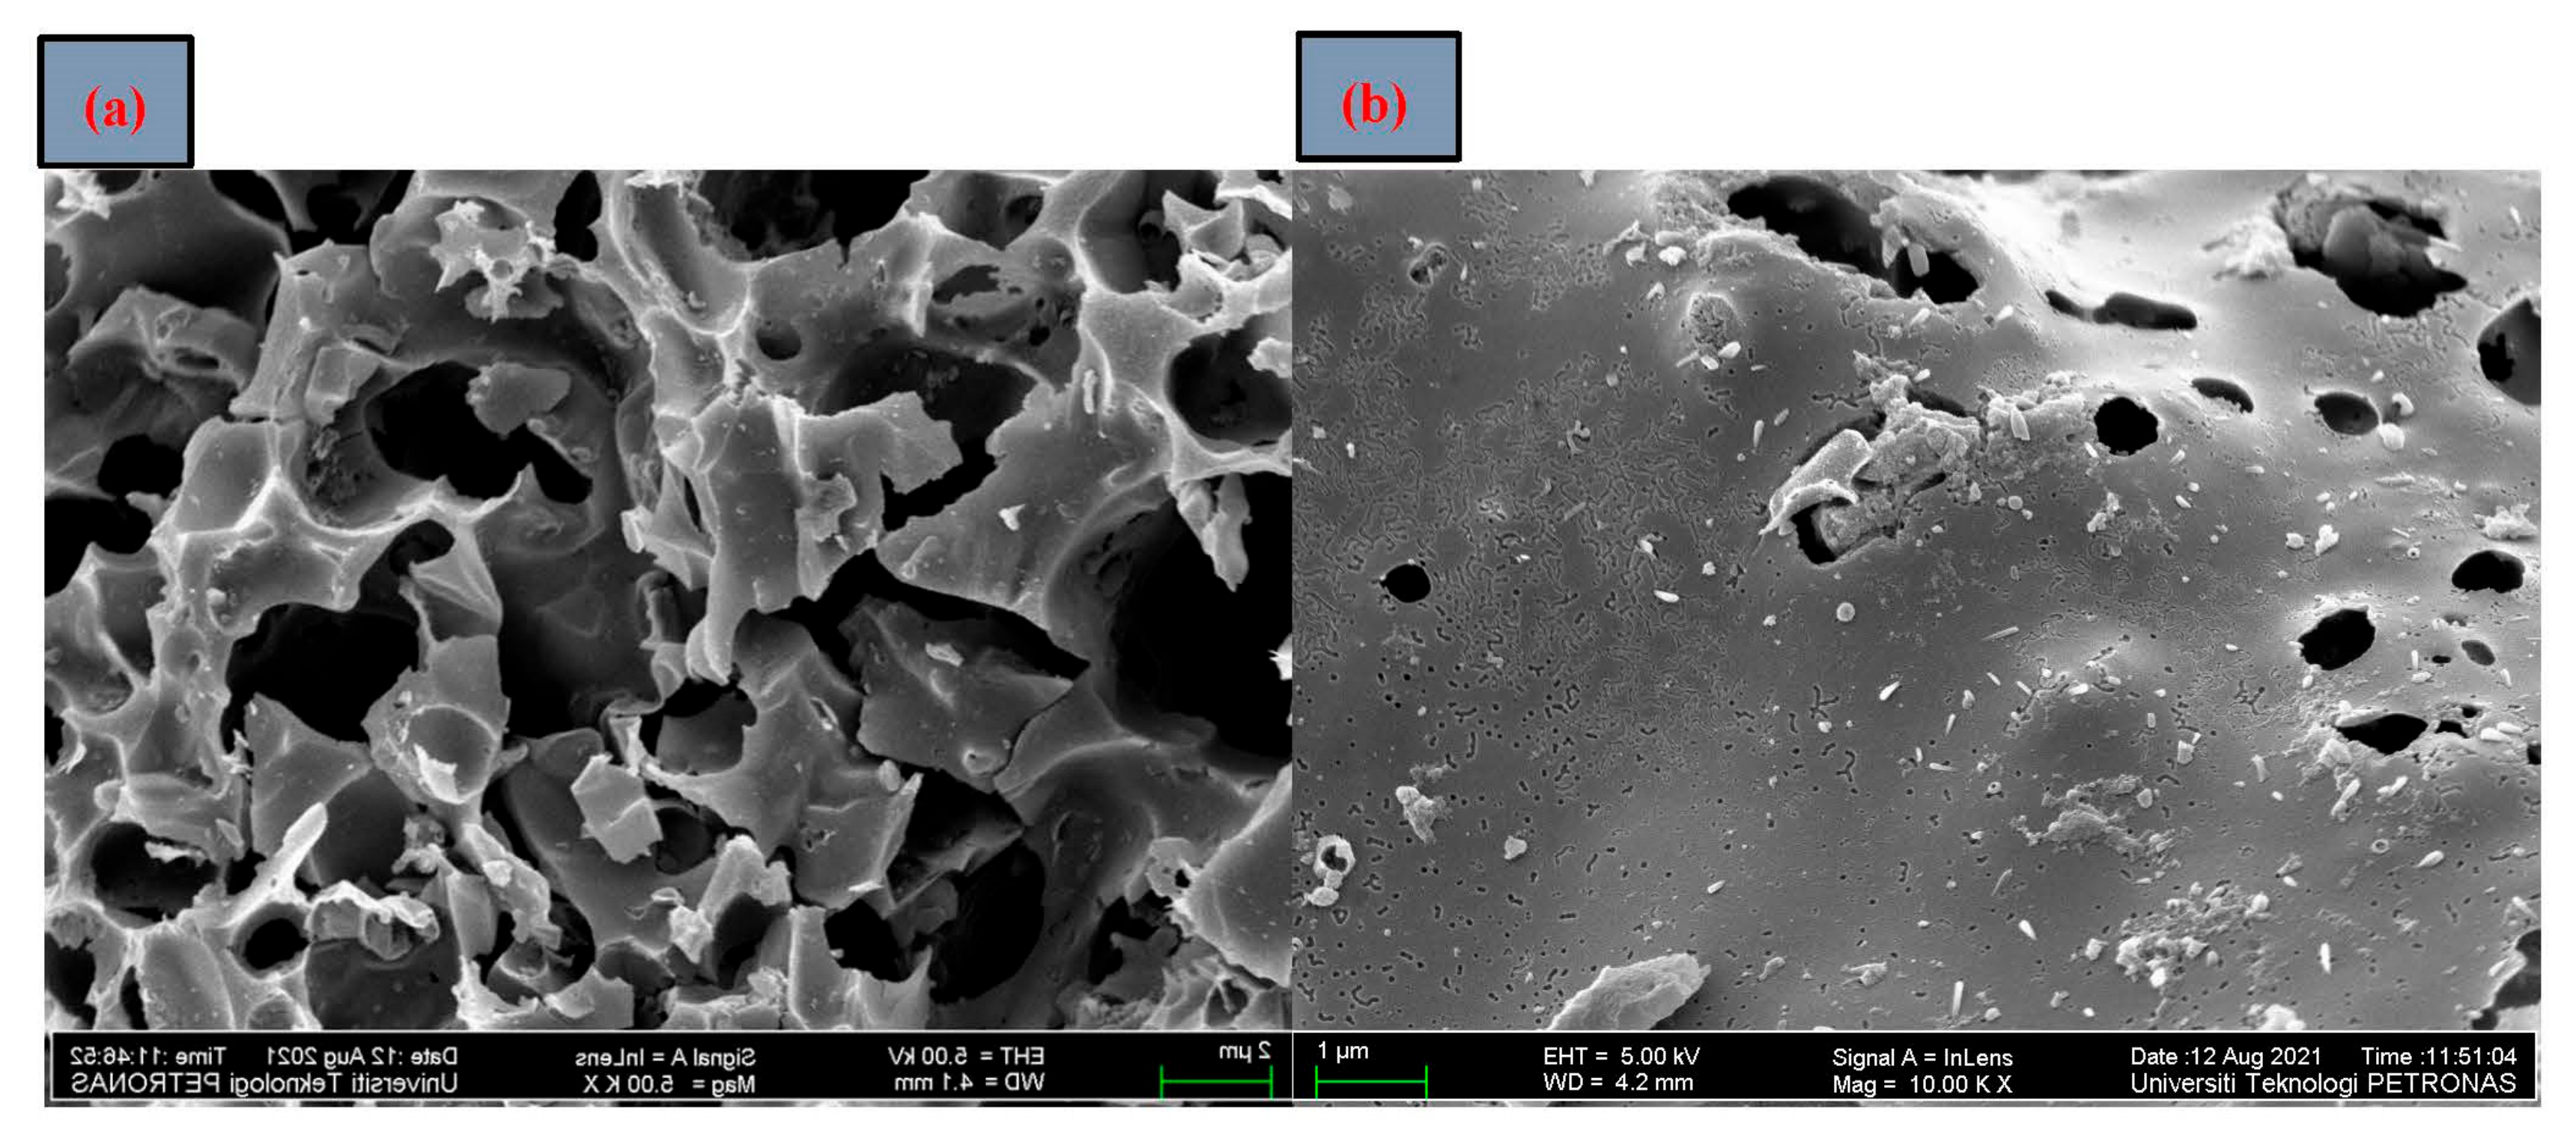
3.2.2. FESEM
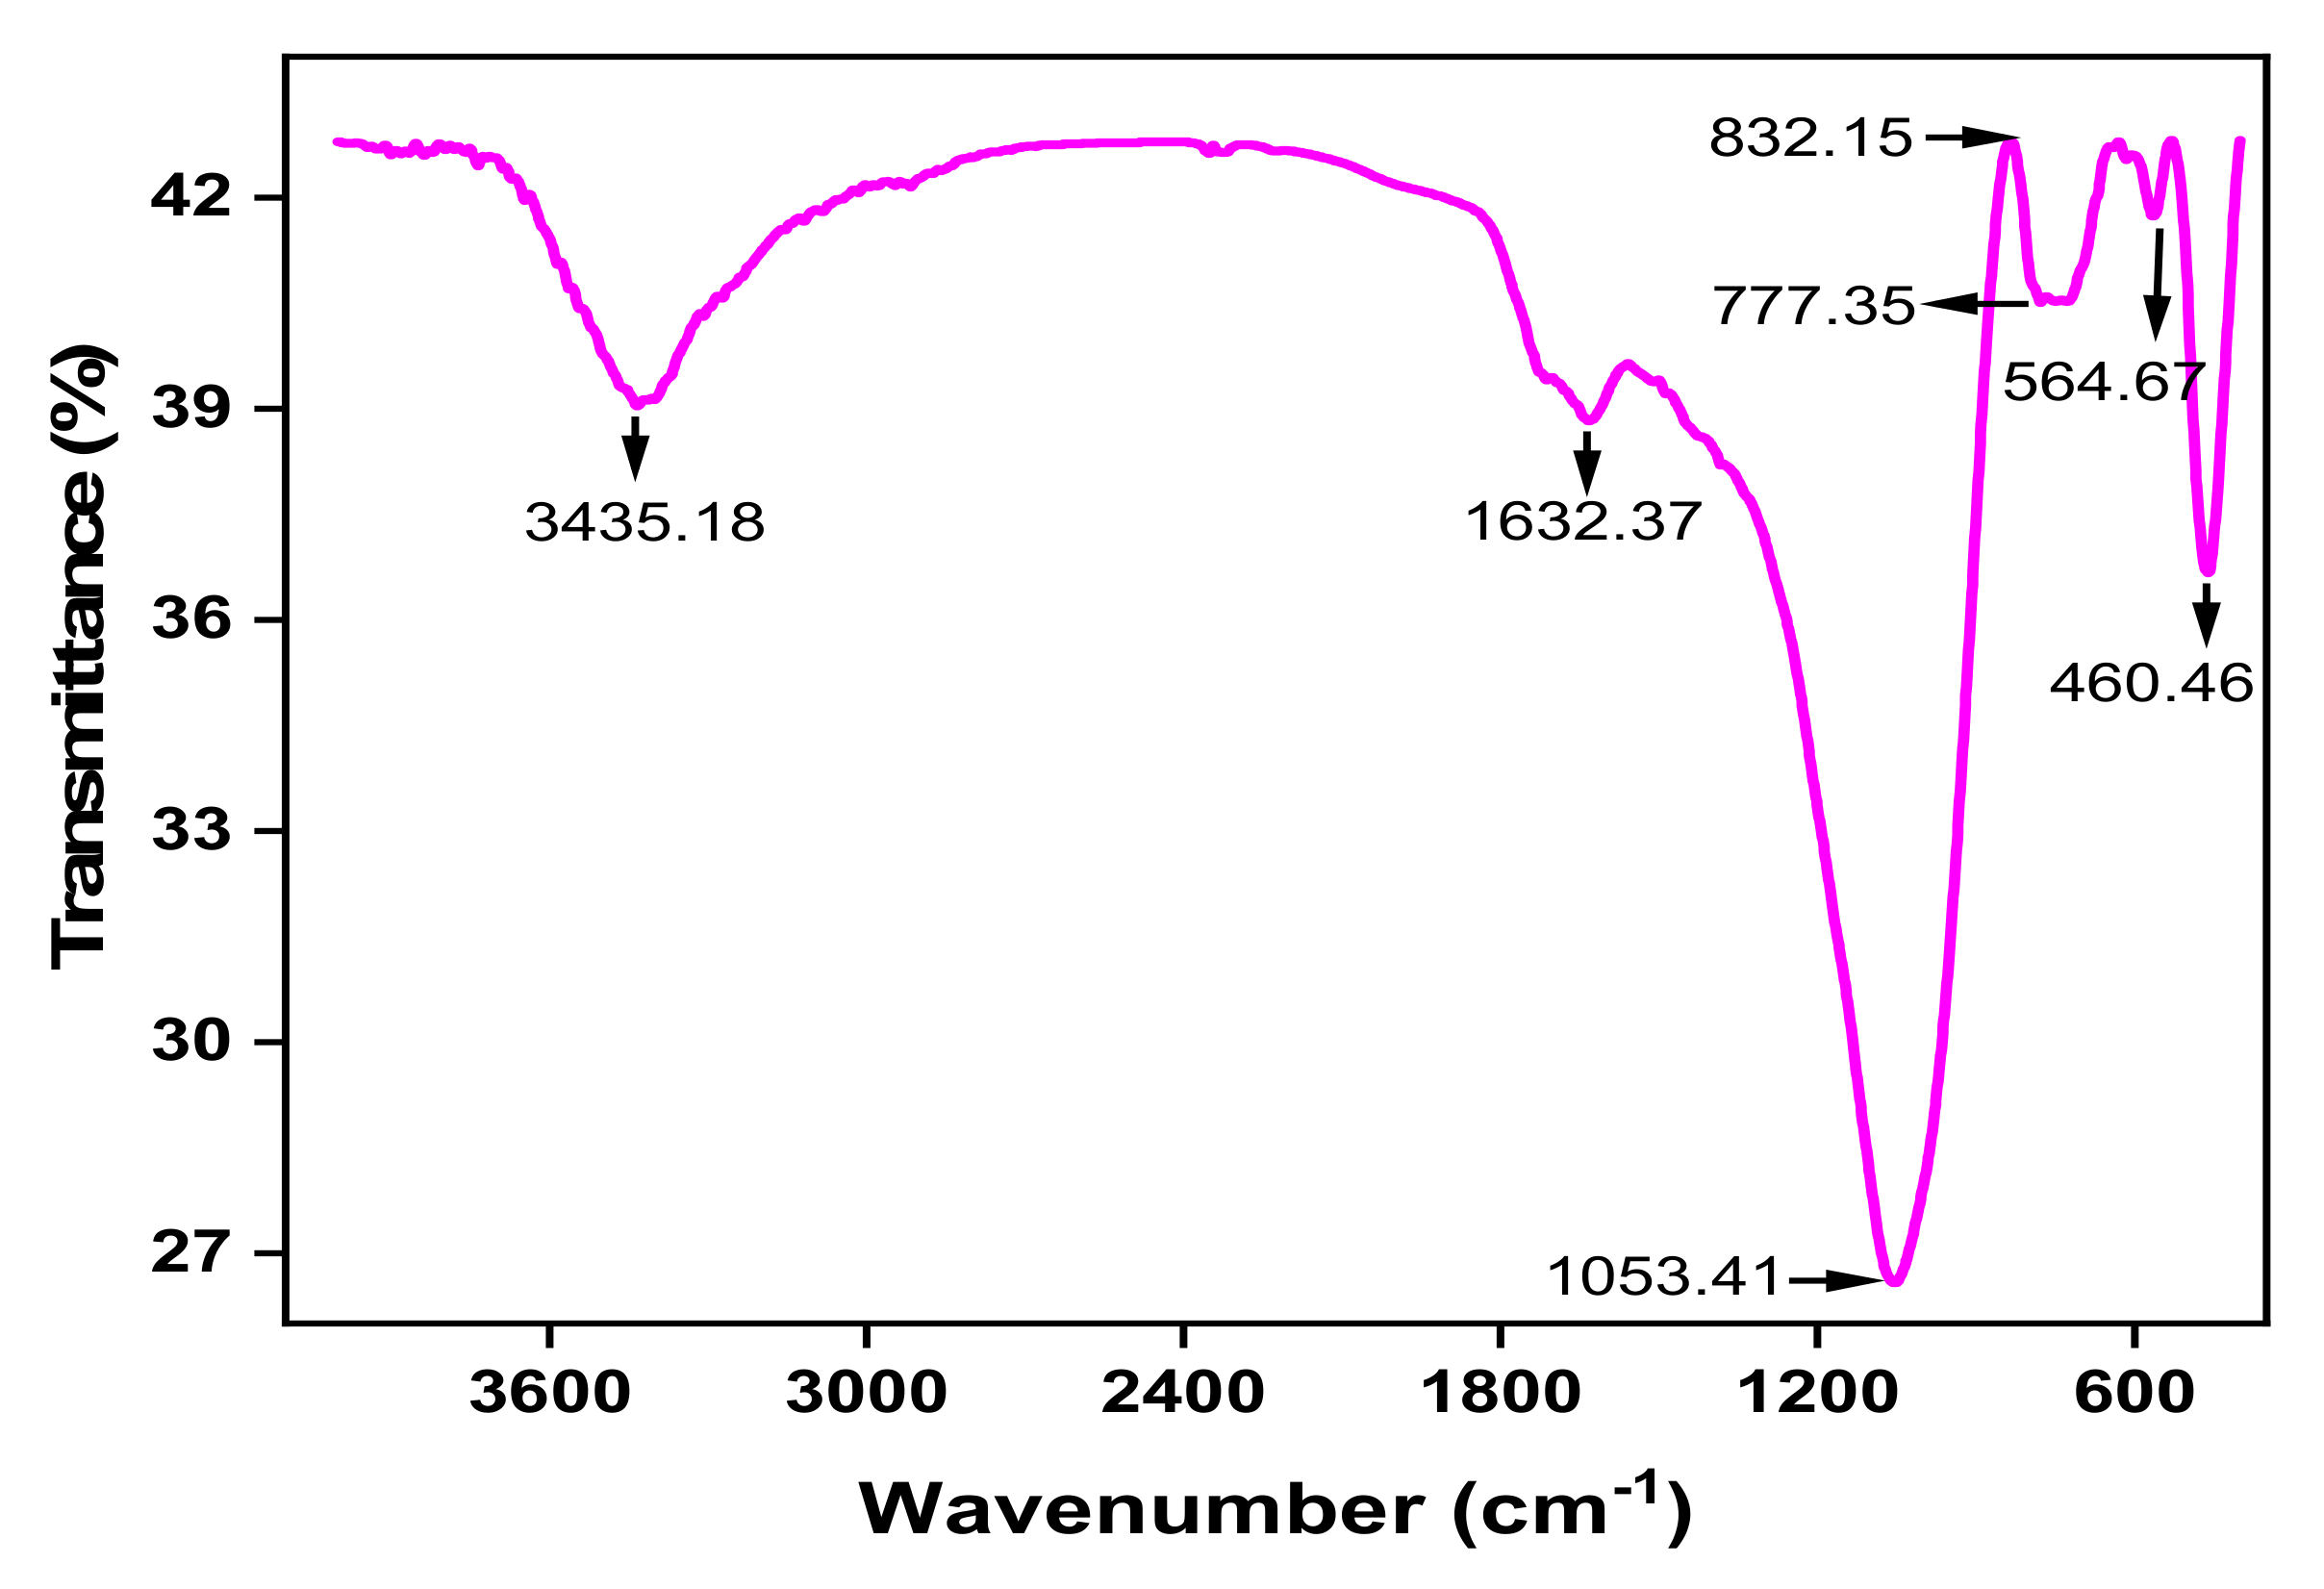
3.2.3. FTIR
3.2.4. Proximate and Ultimate Analysis
3.3. Effect of AIE Concentration and HRT on COD and Color Removal
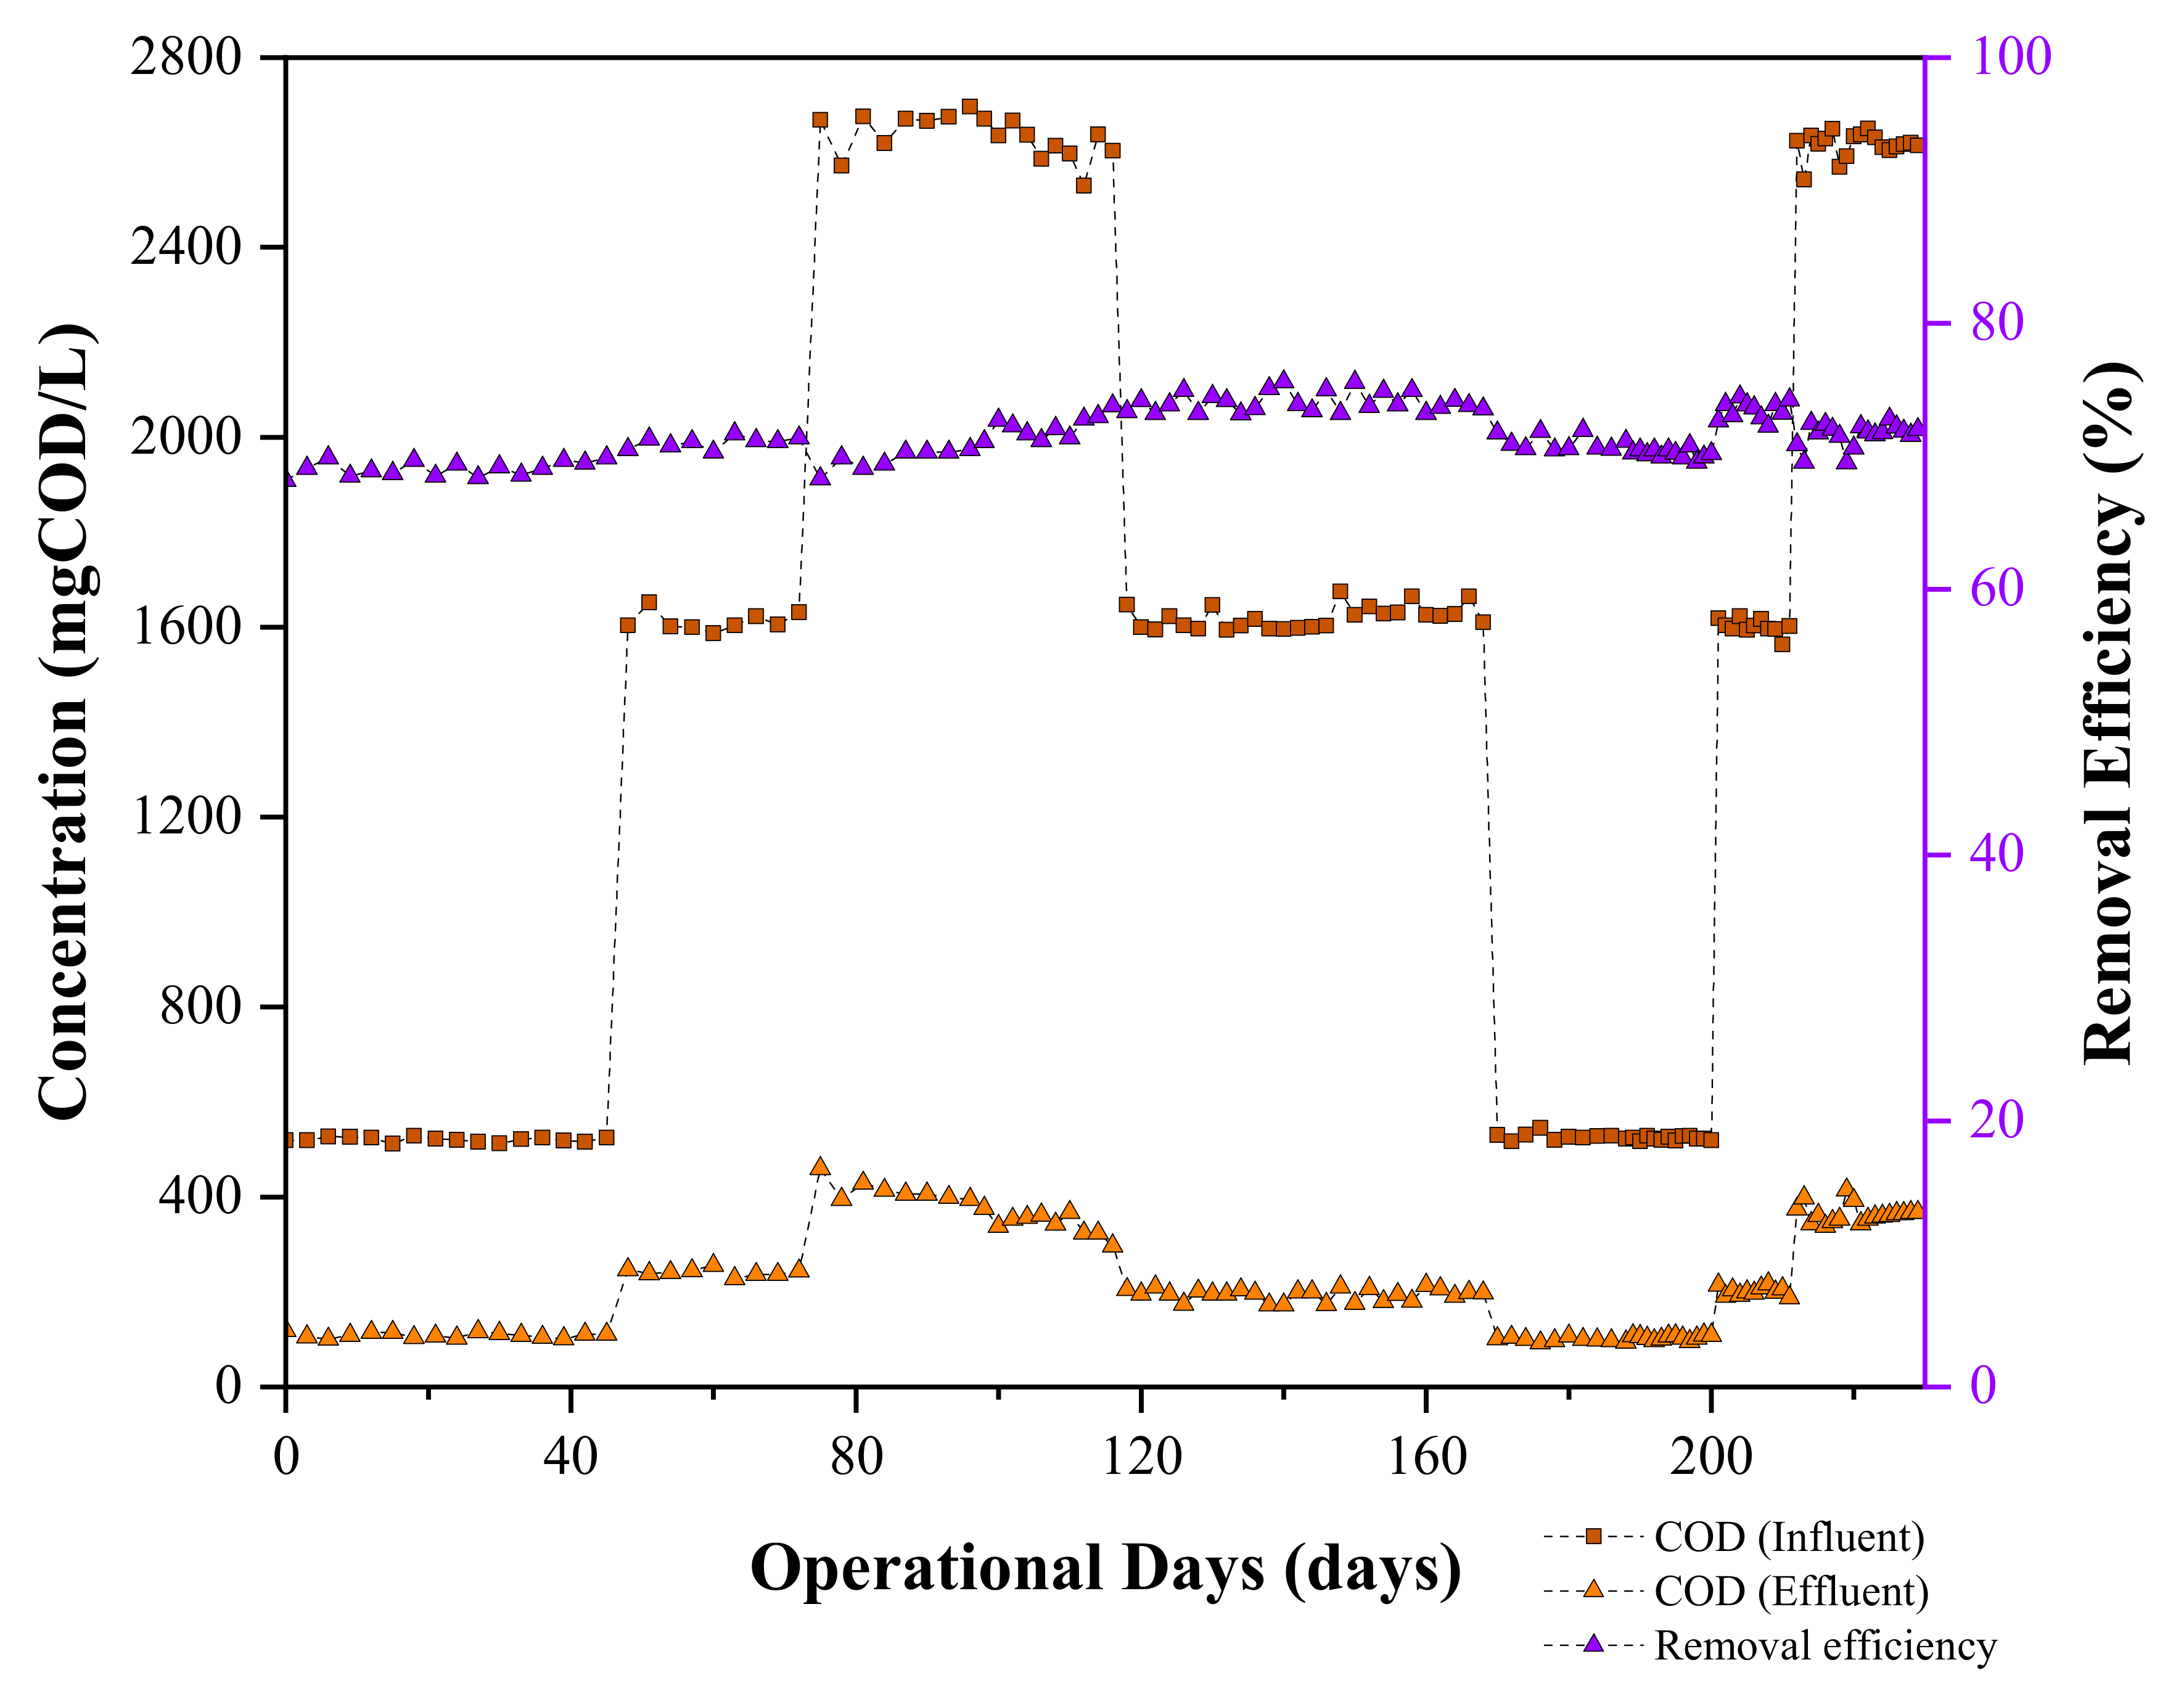
3.3.1. COD Removal
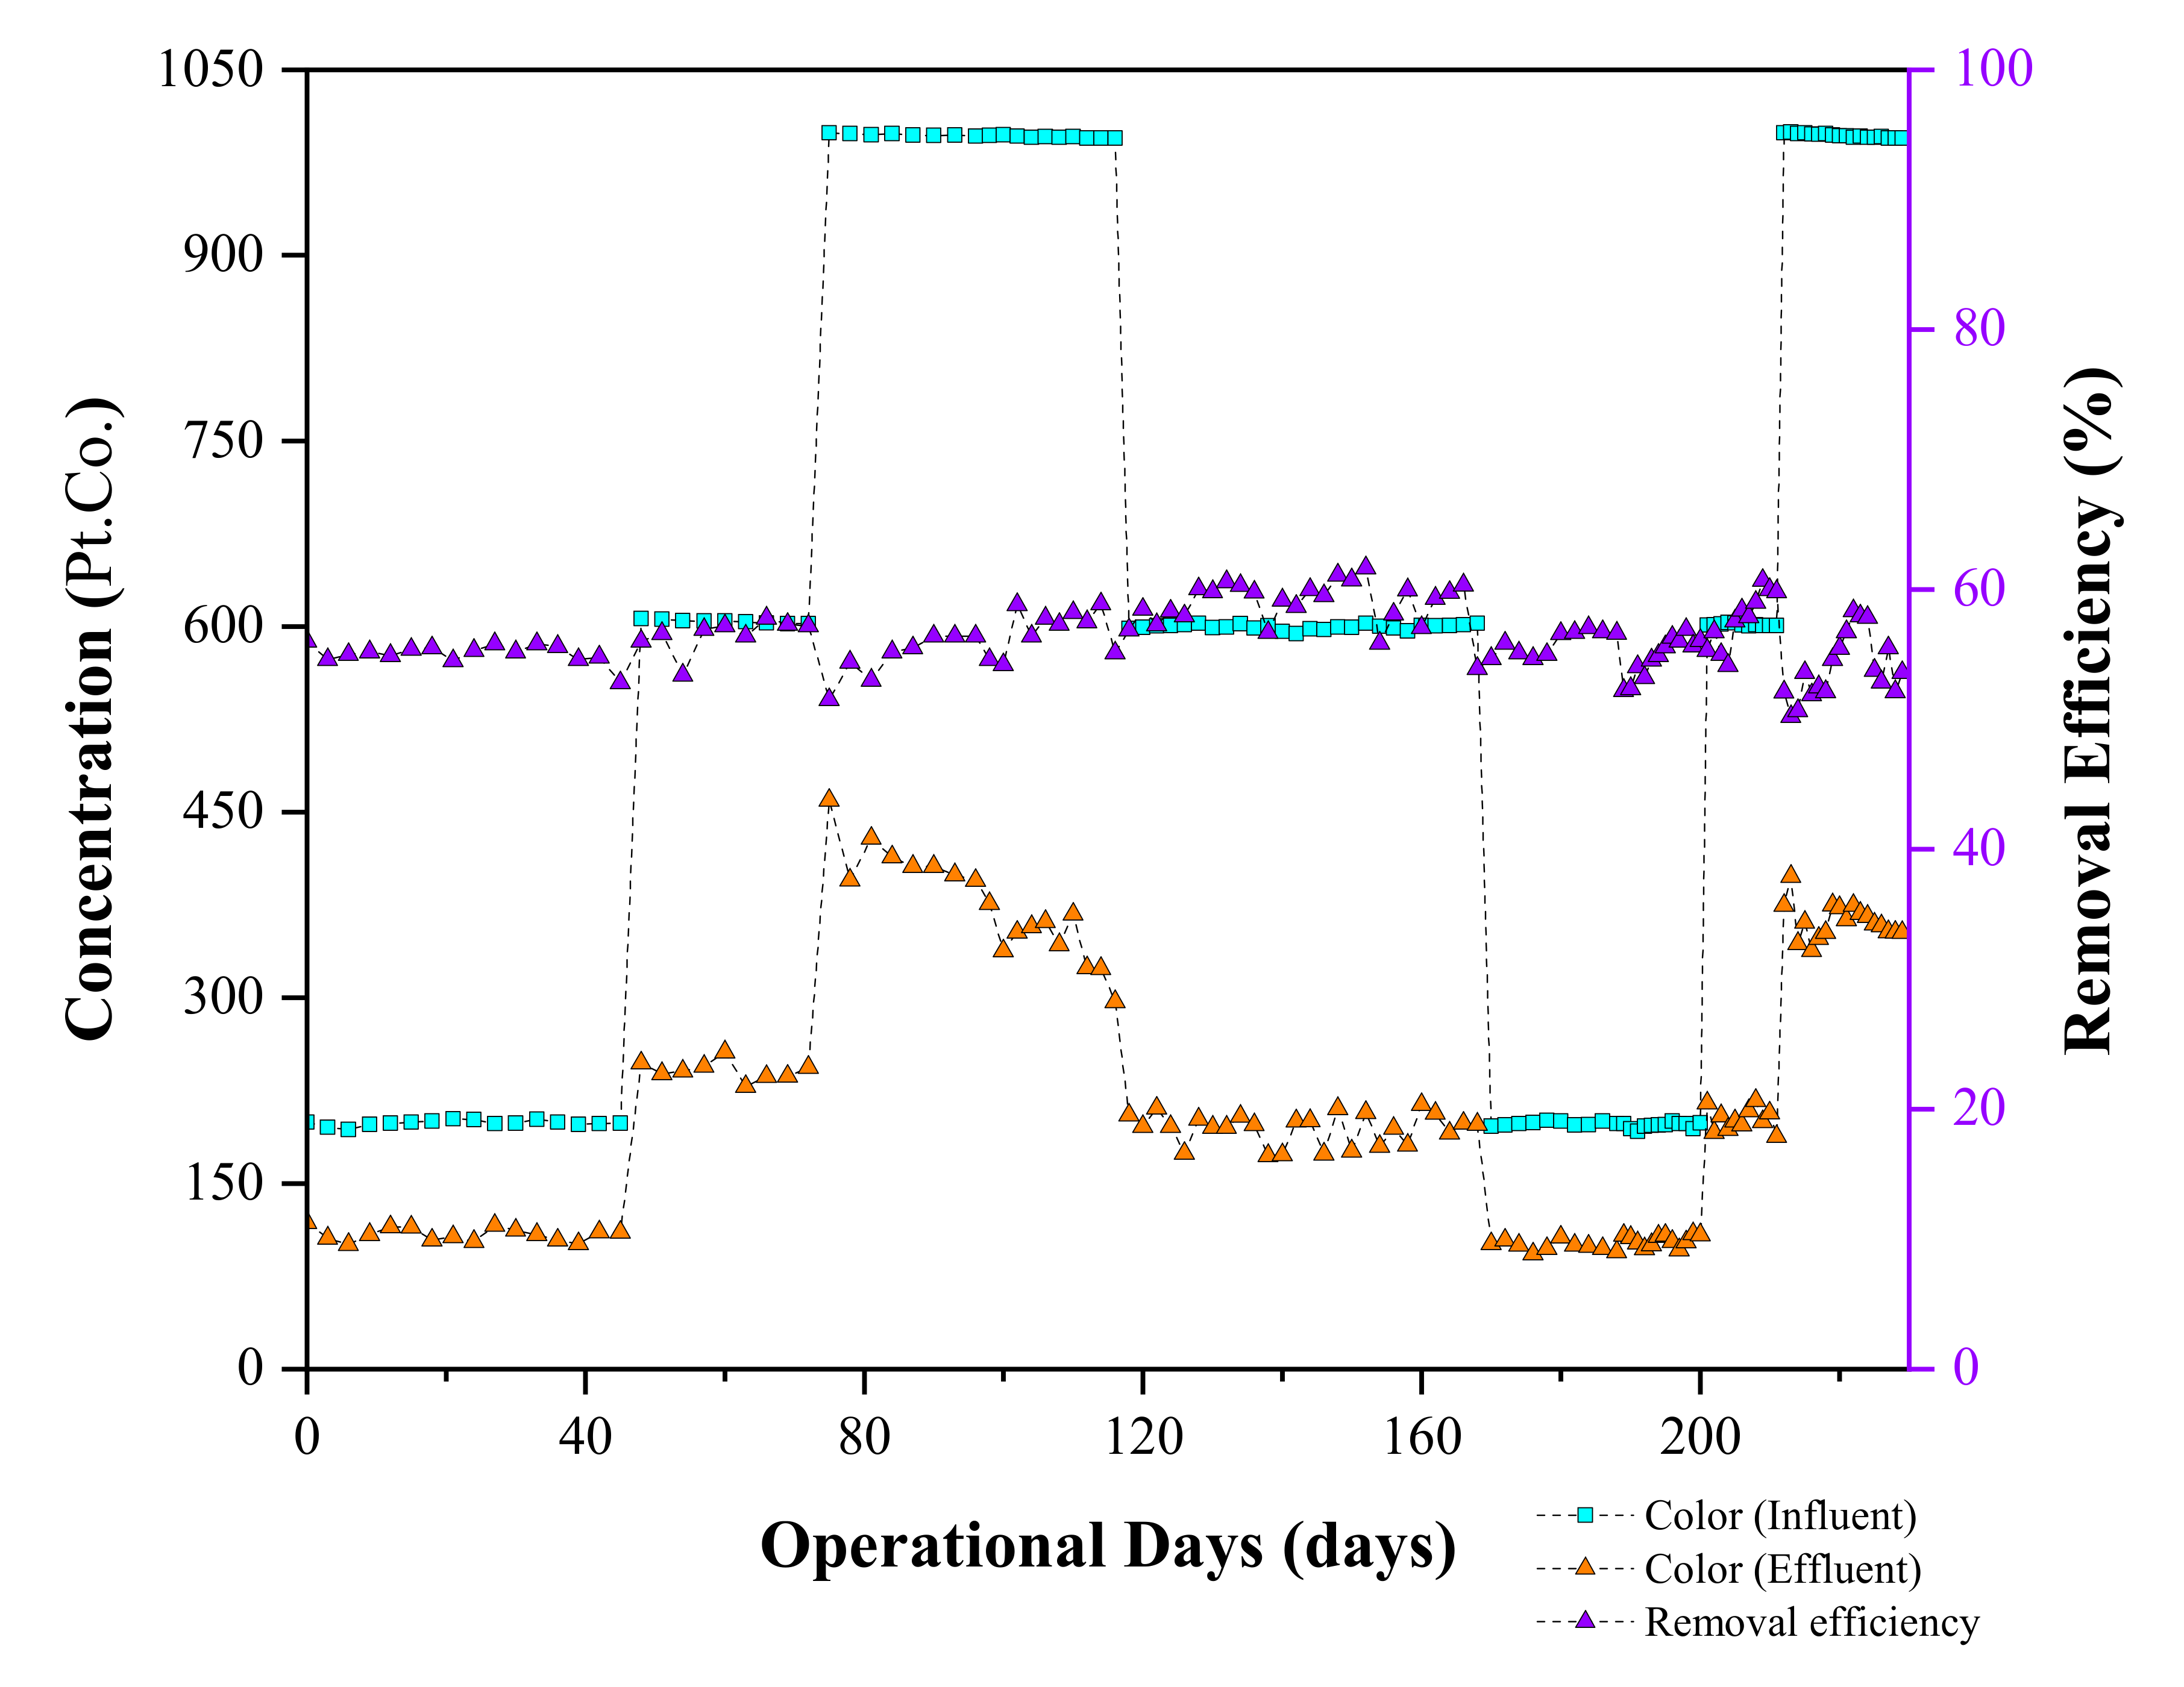
3.3.2. Color Removal
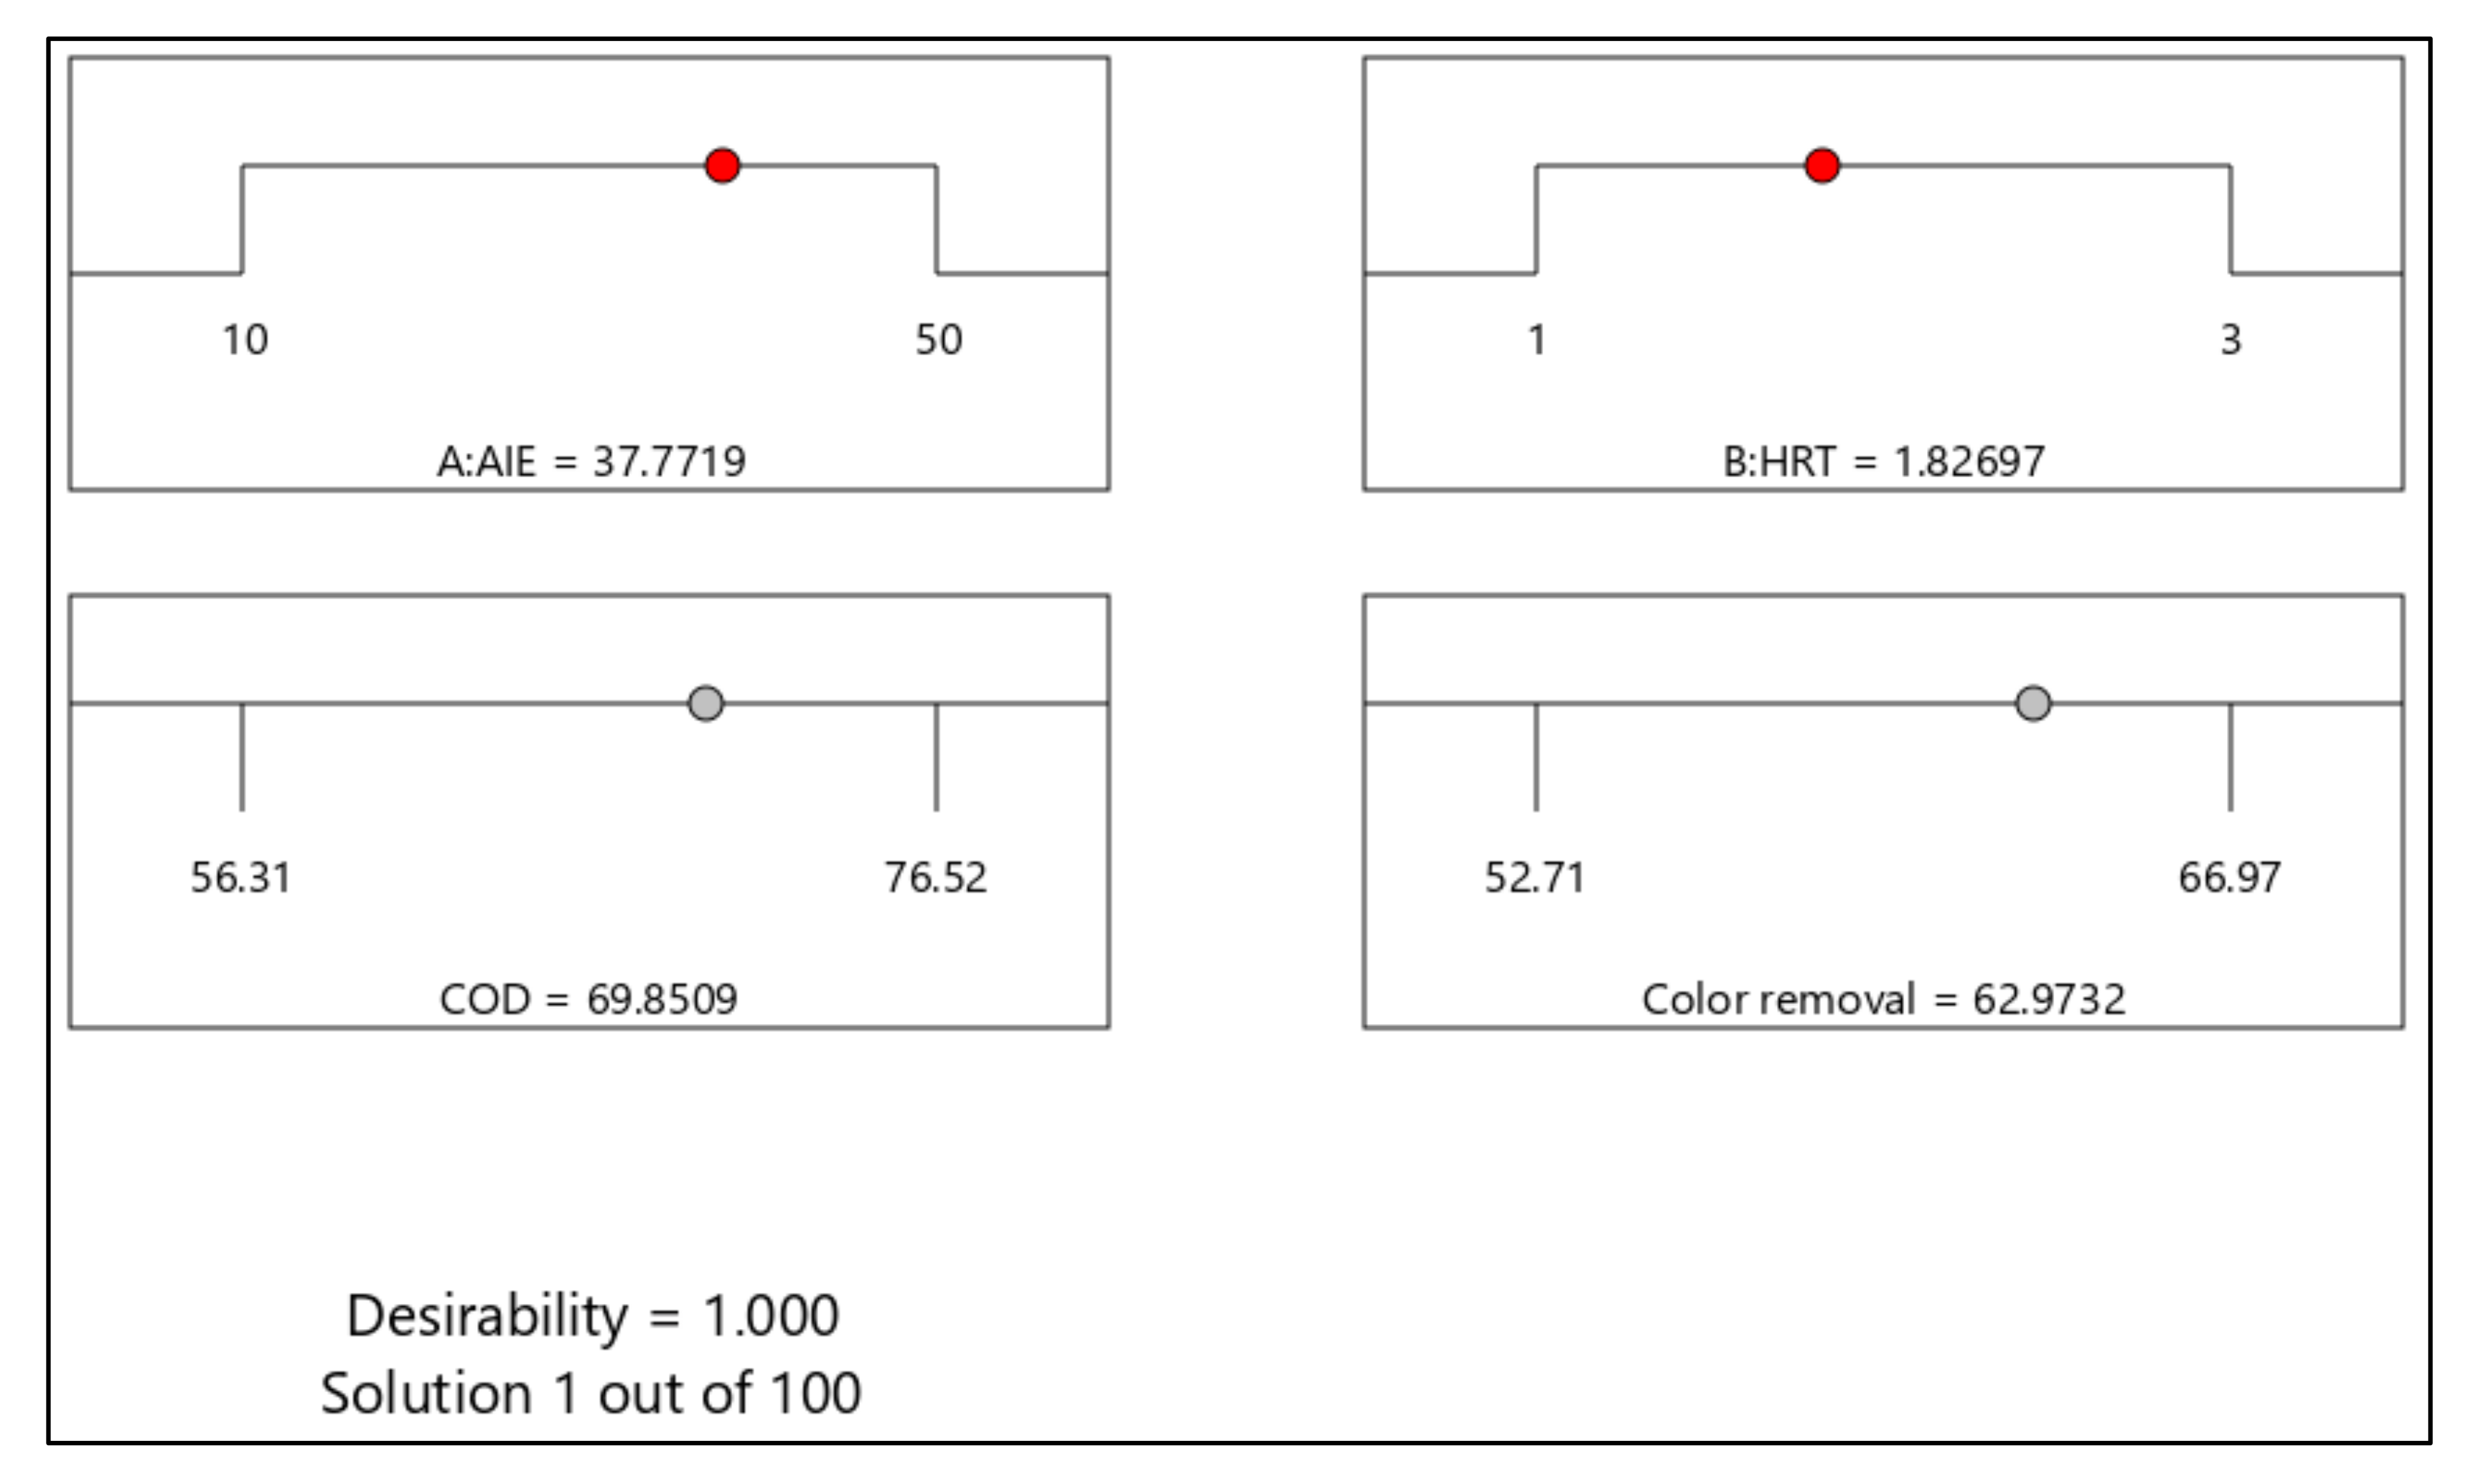
3.4. Optimization by RSM
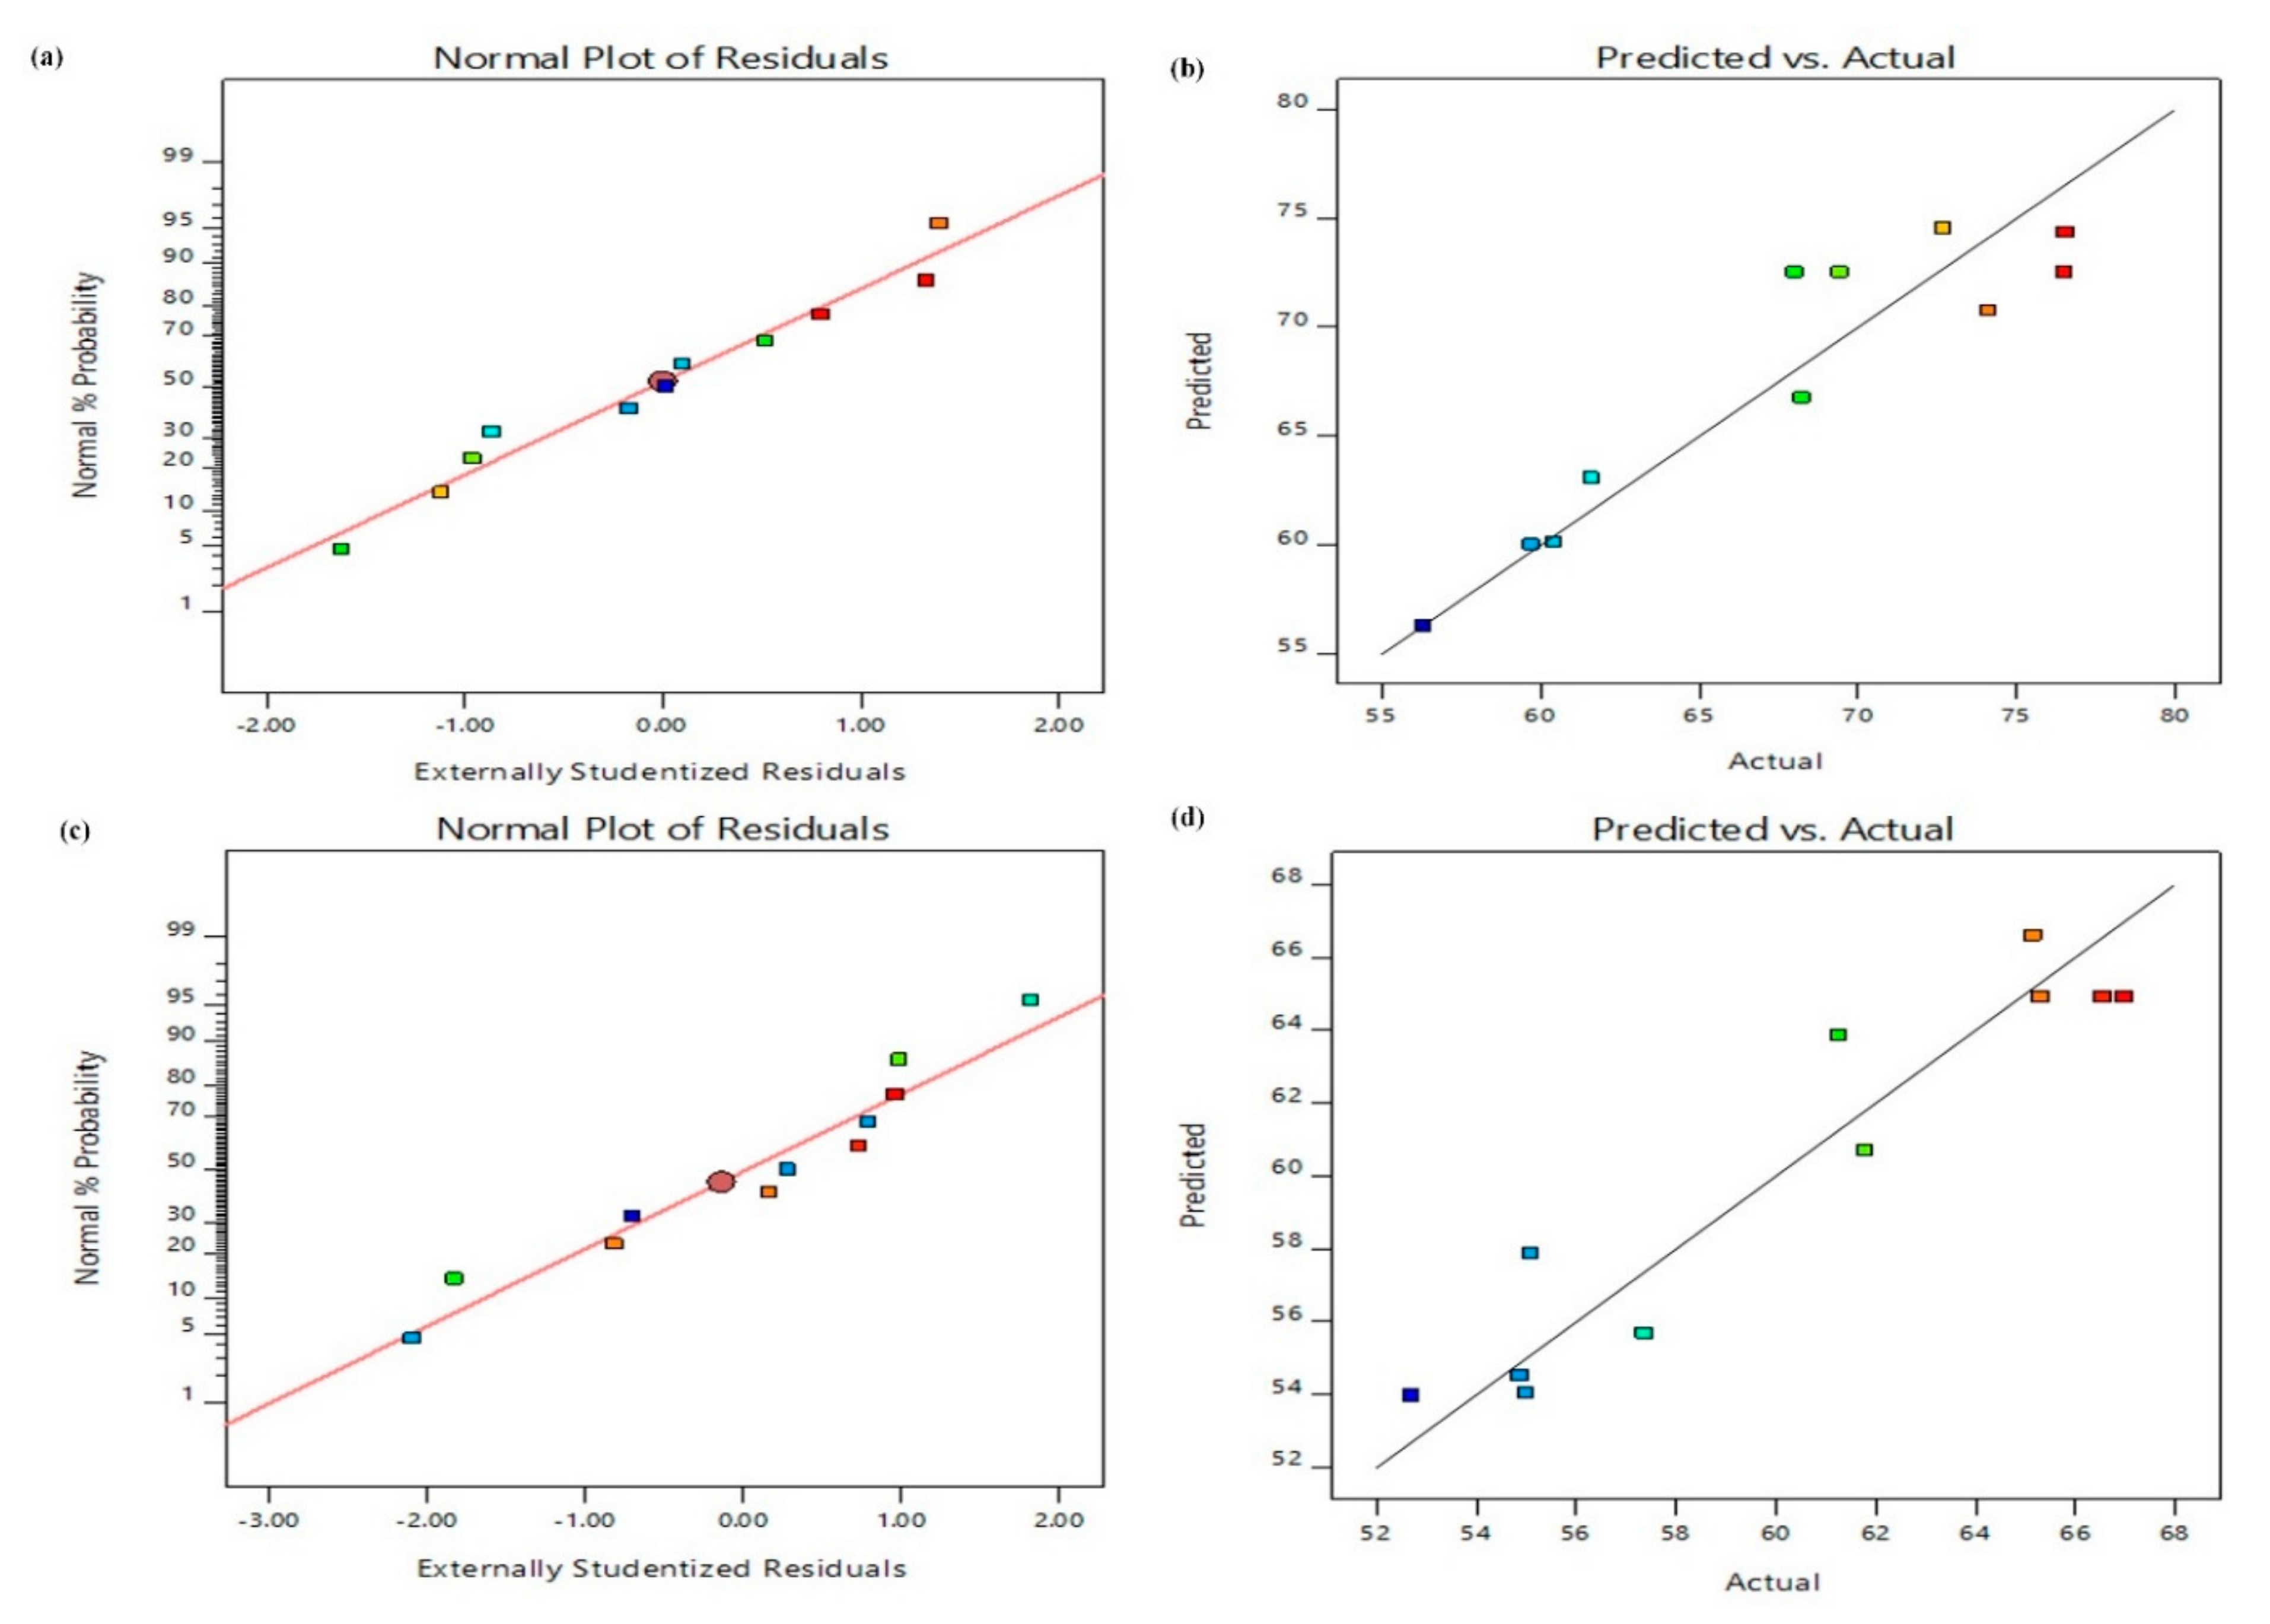
3.4.1. Model Fitting and Statistical Analysis
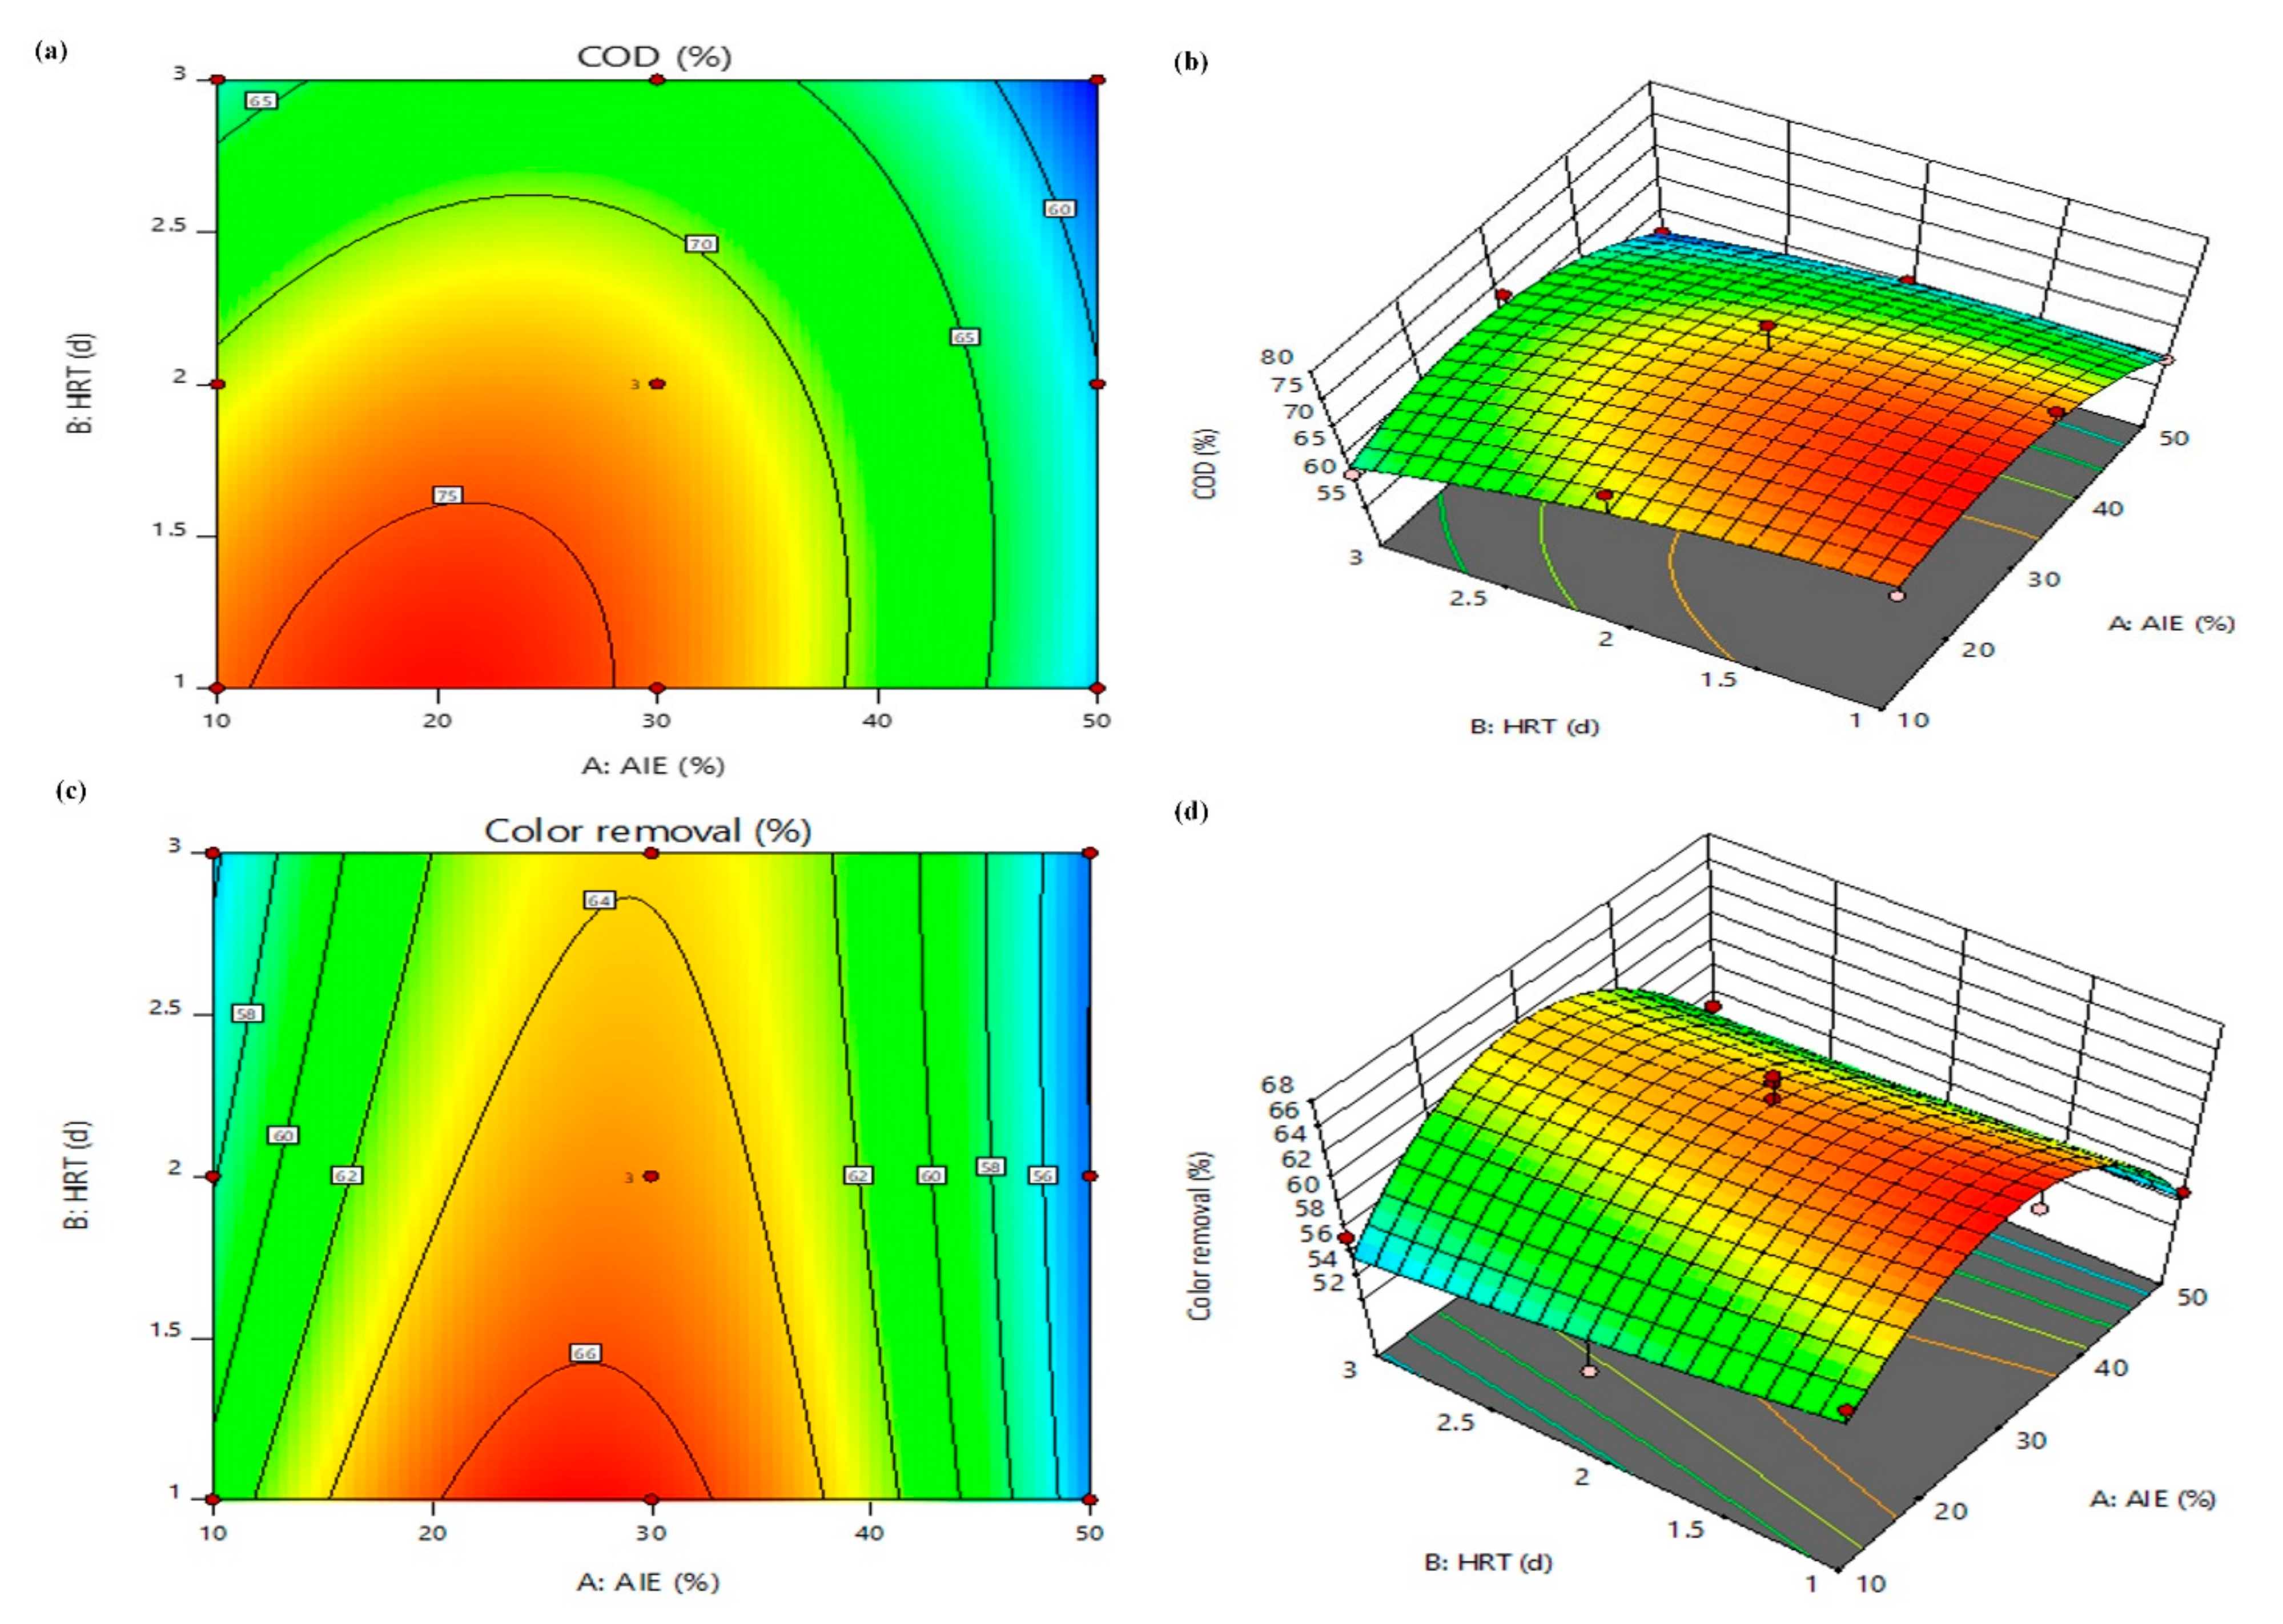
3.4.2. Three-Dimensional Response Surface Plots
3.4.3. Analysis of Variance (ANOVA)
3.4.4. Fit Statistics
3.5. Biokinetic Models for AIE Treatment in the CFBS
3.5.1. First-Order Model
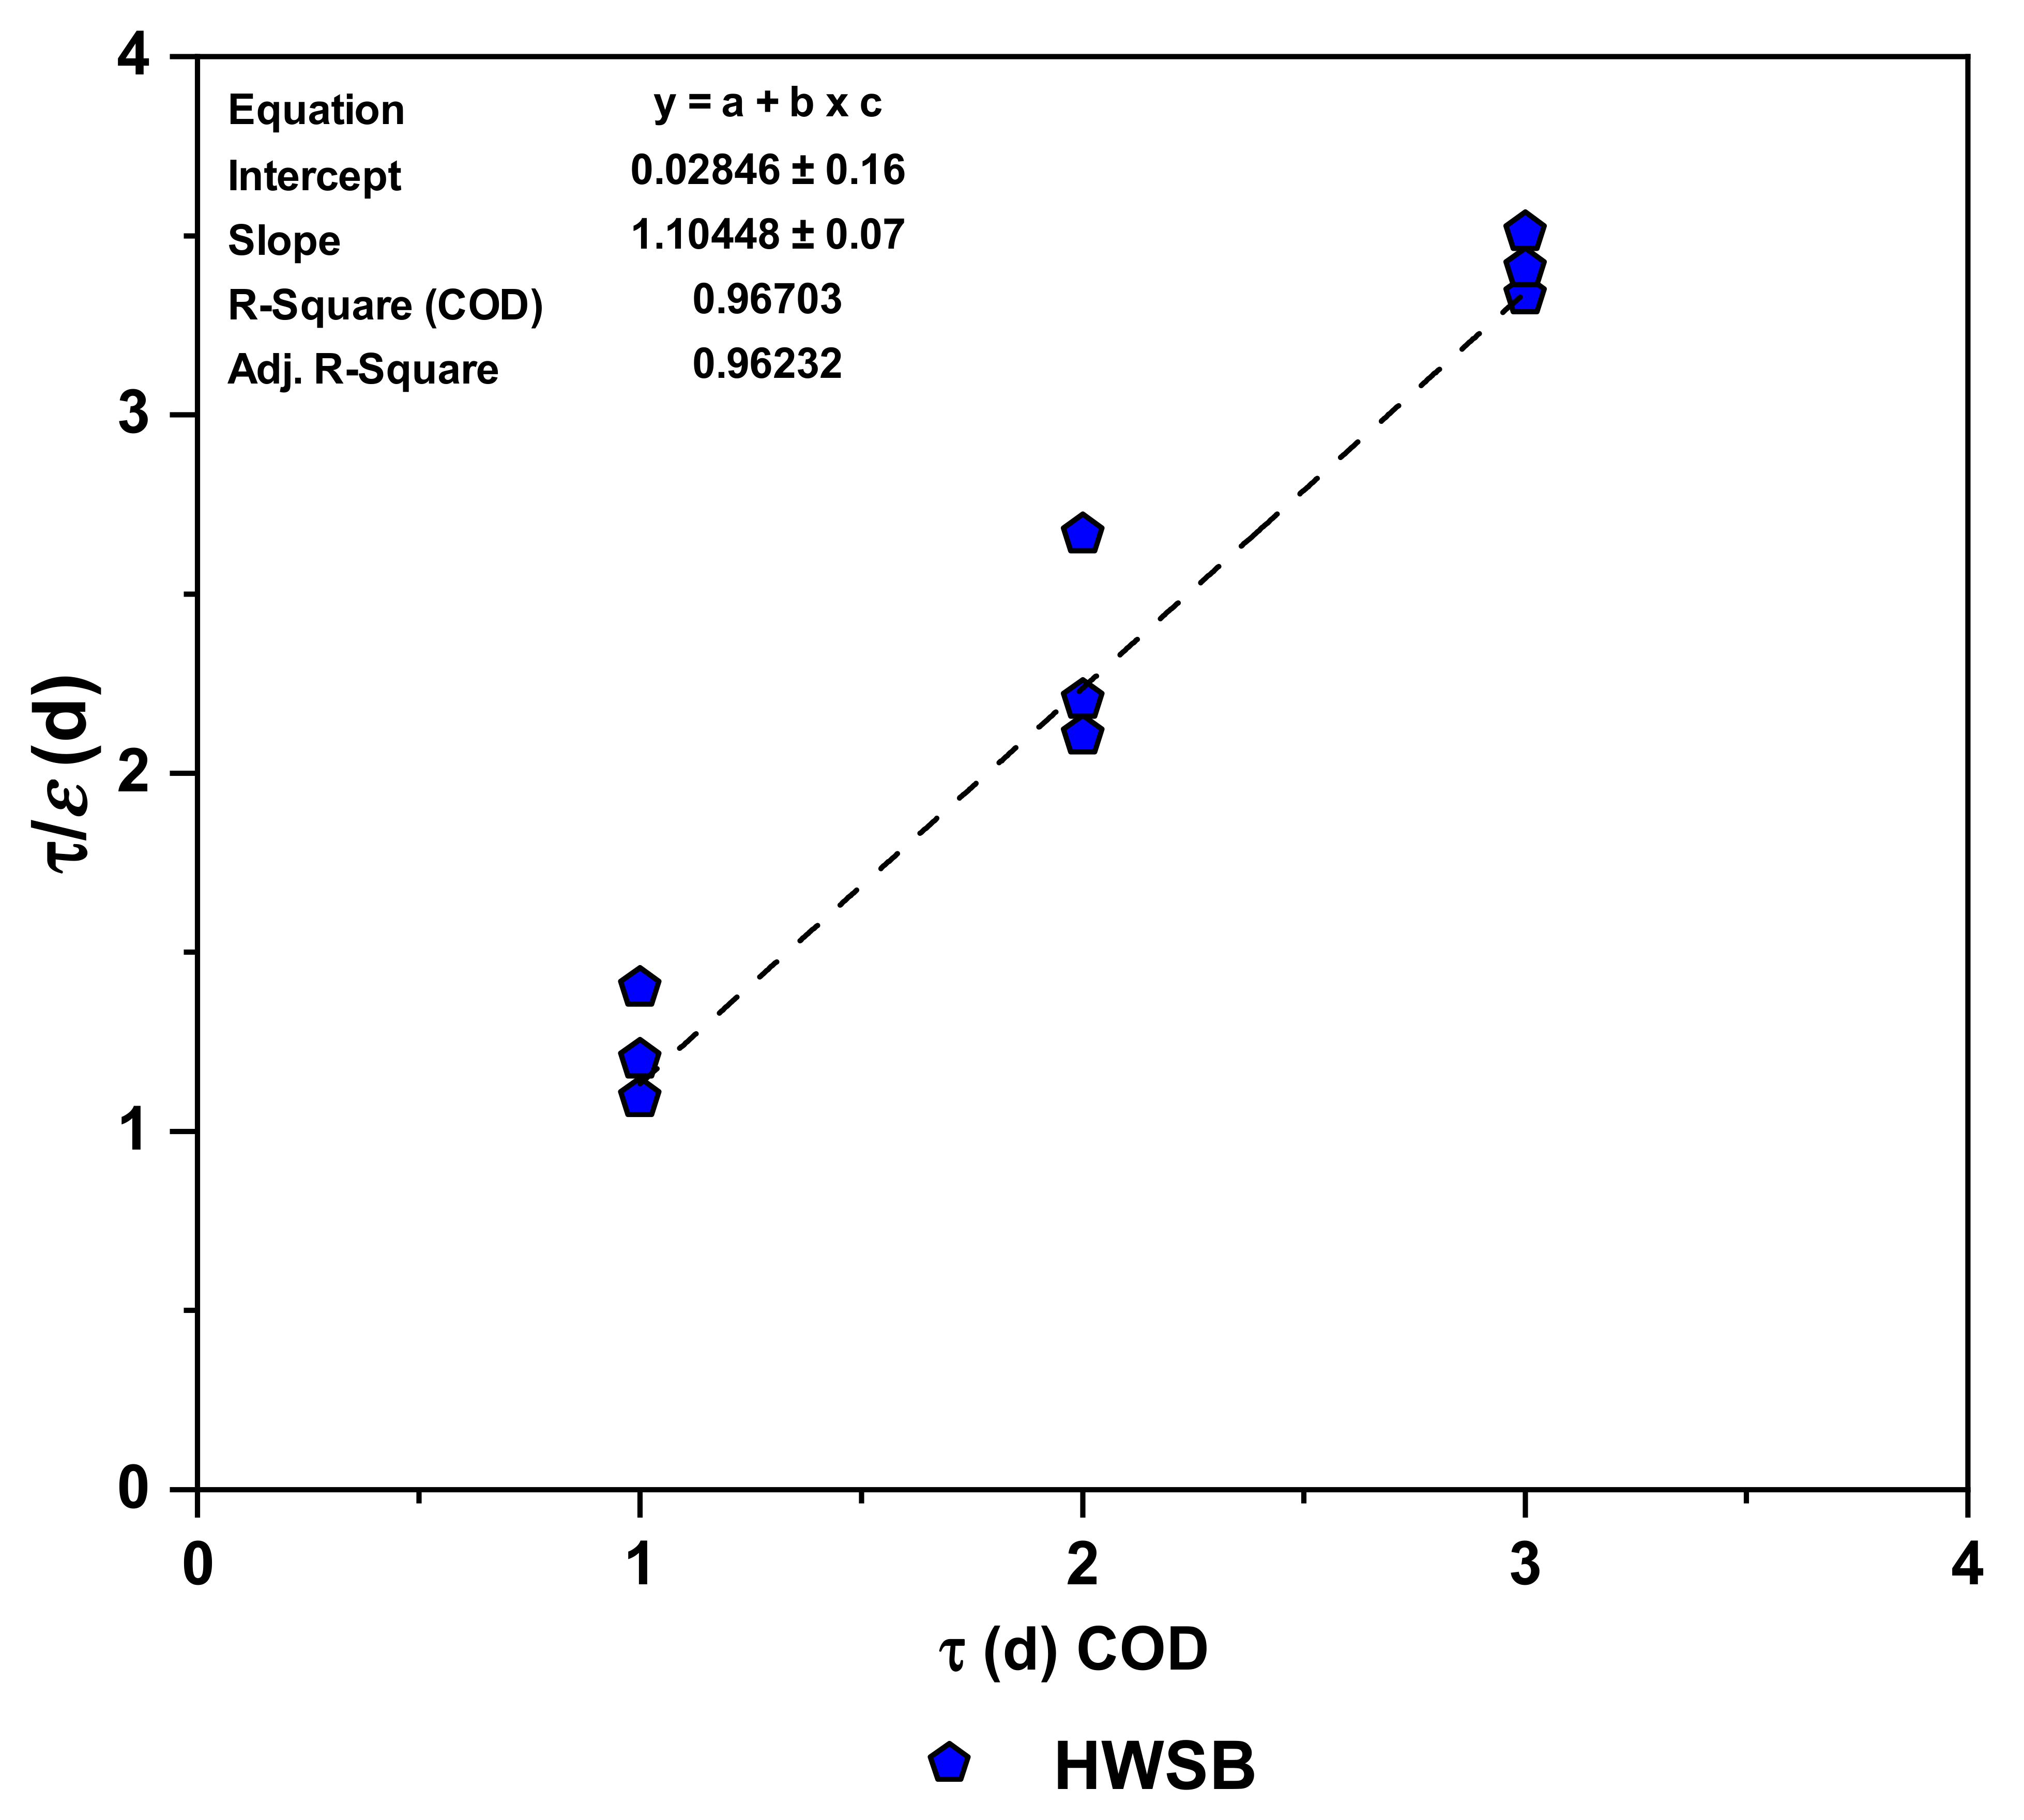
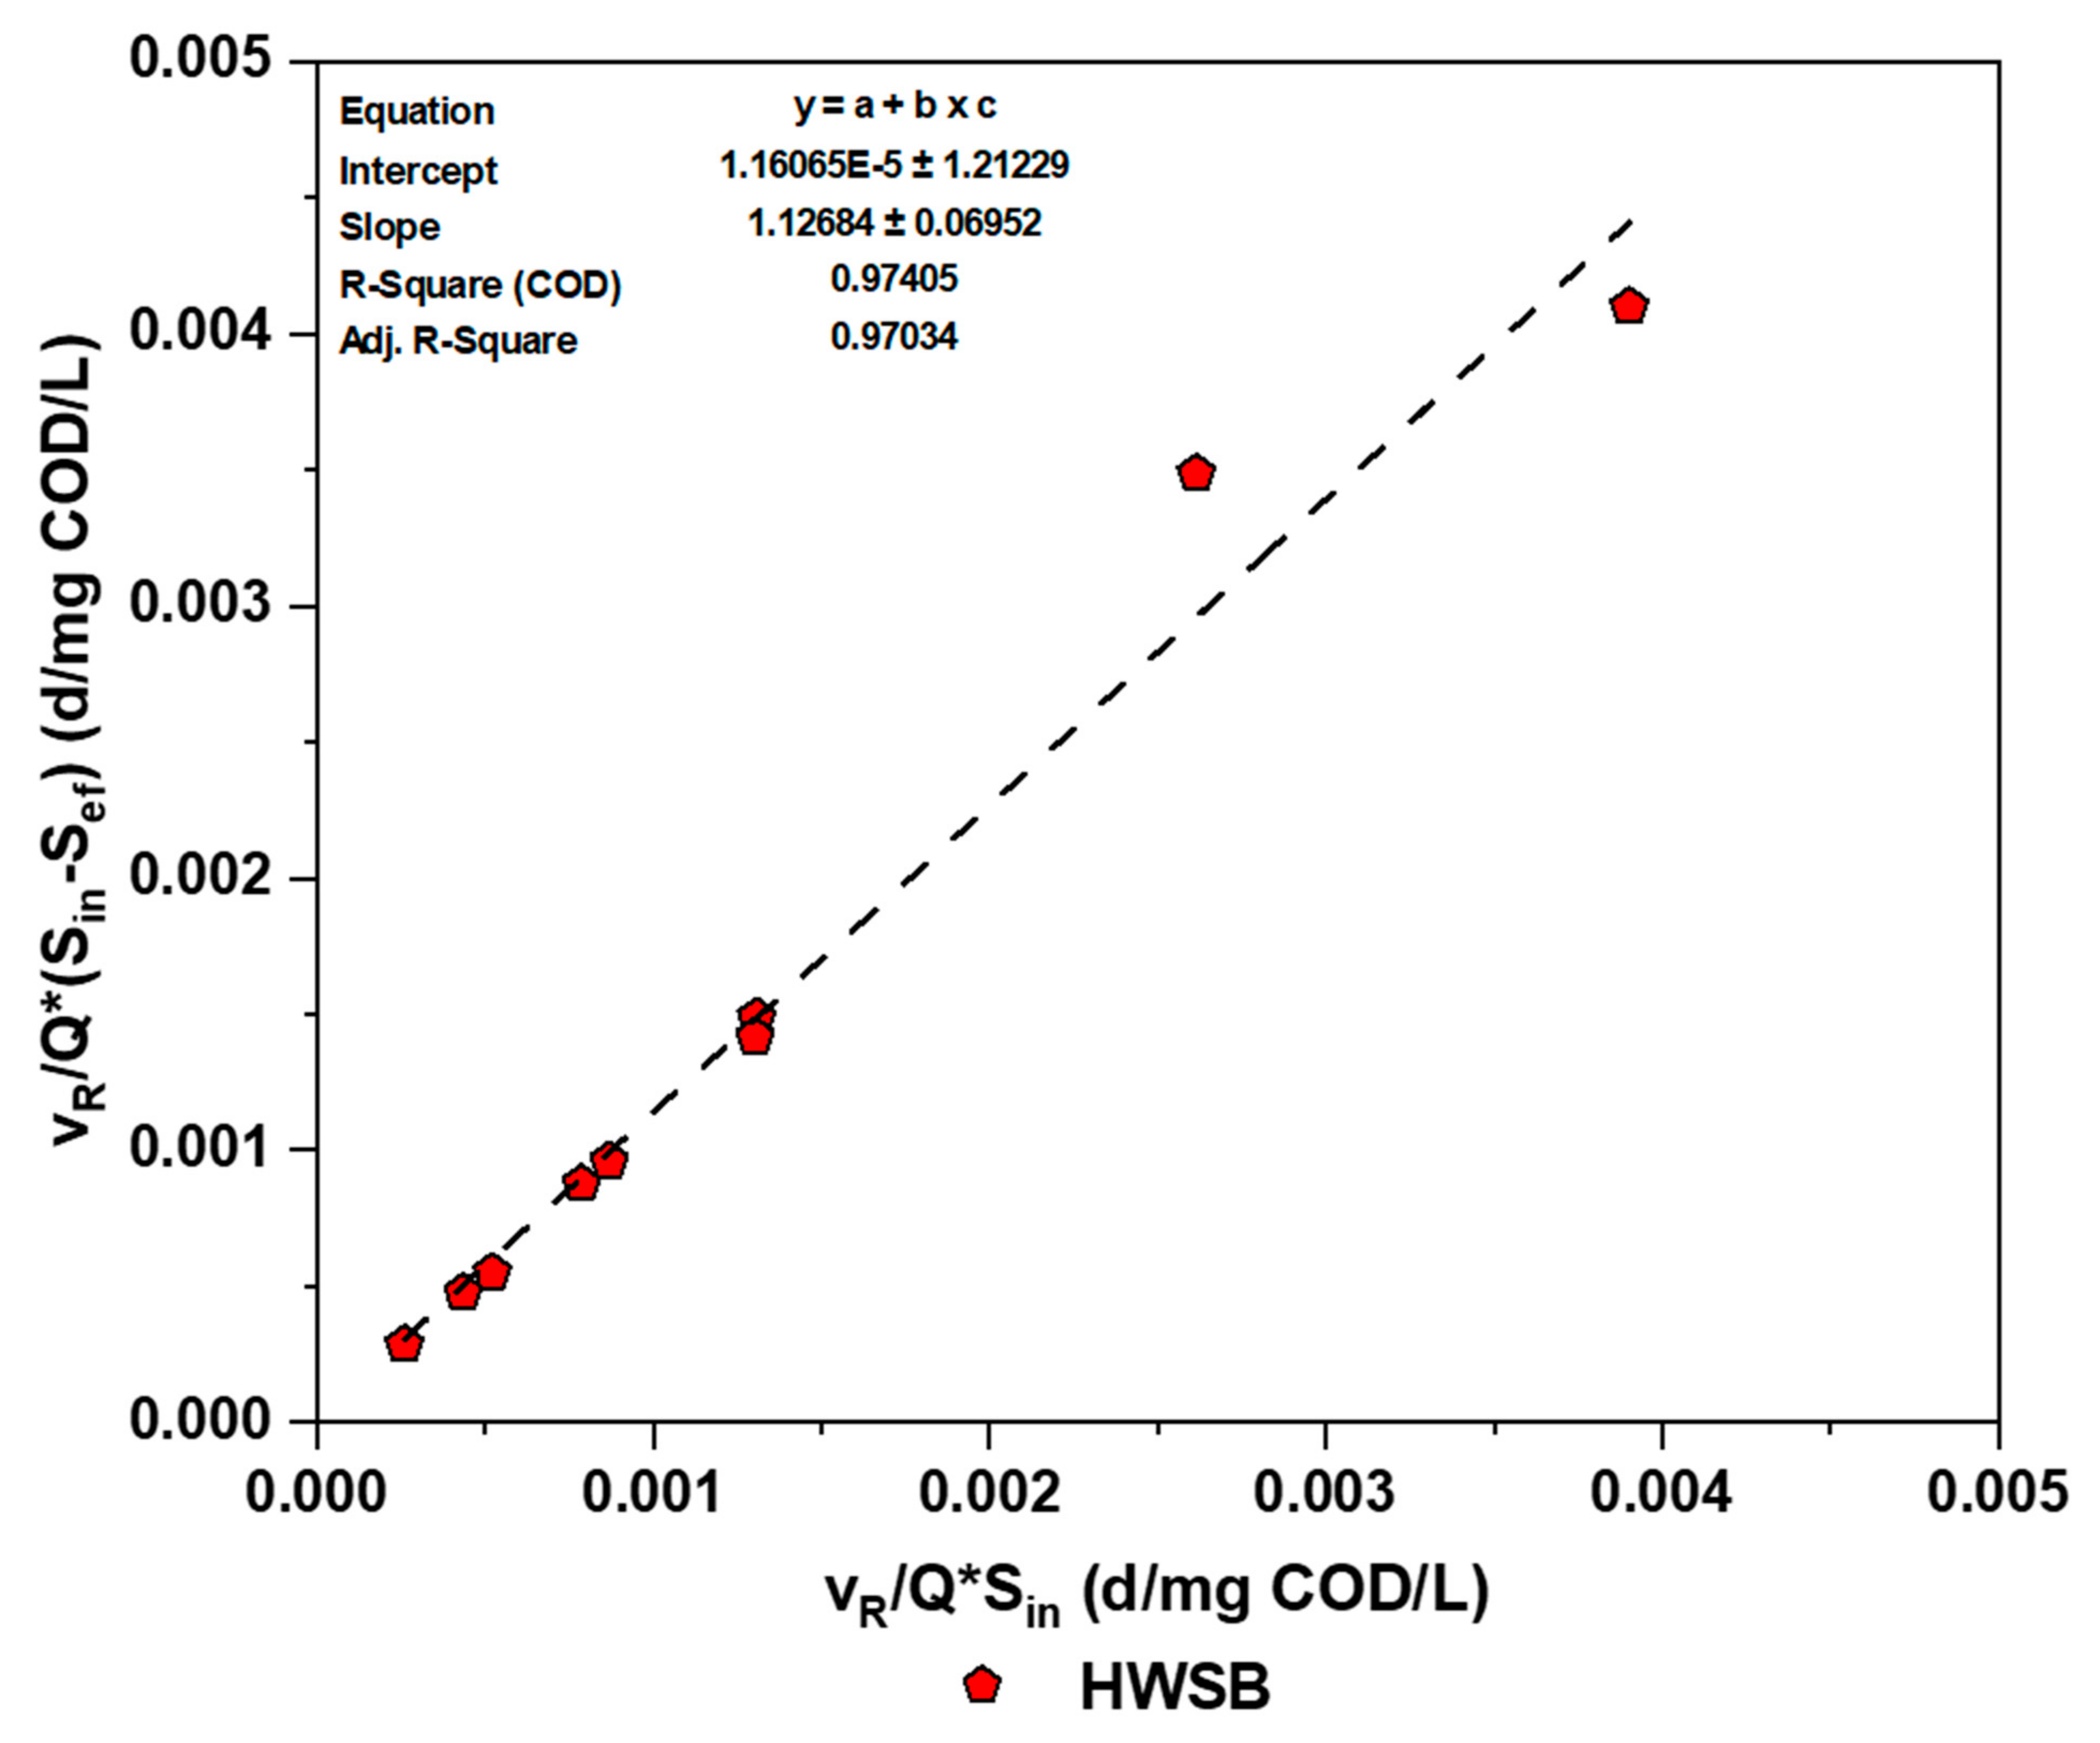
3.5.2. Modified Stover–Kincannon Kinetic Models
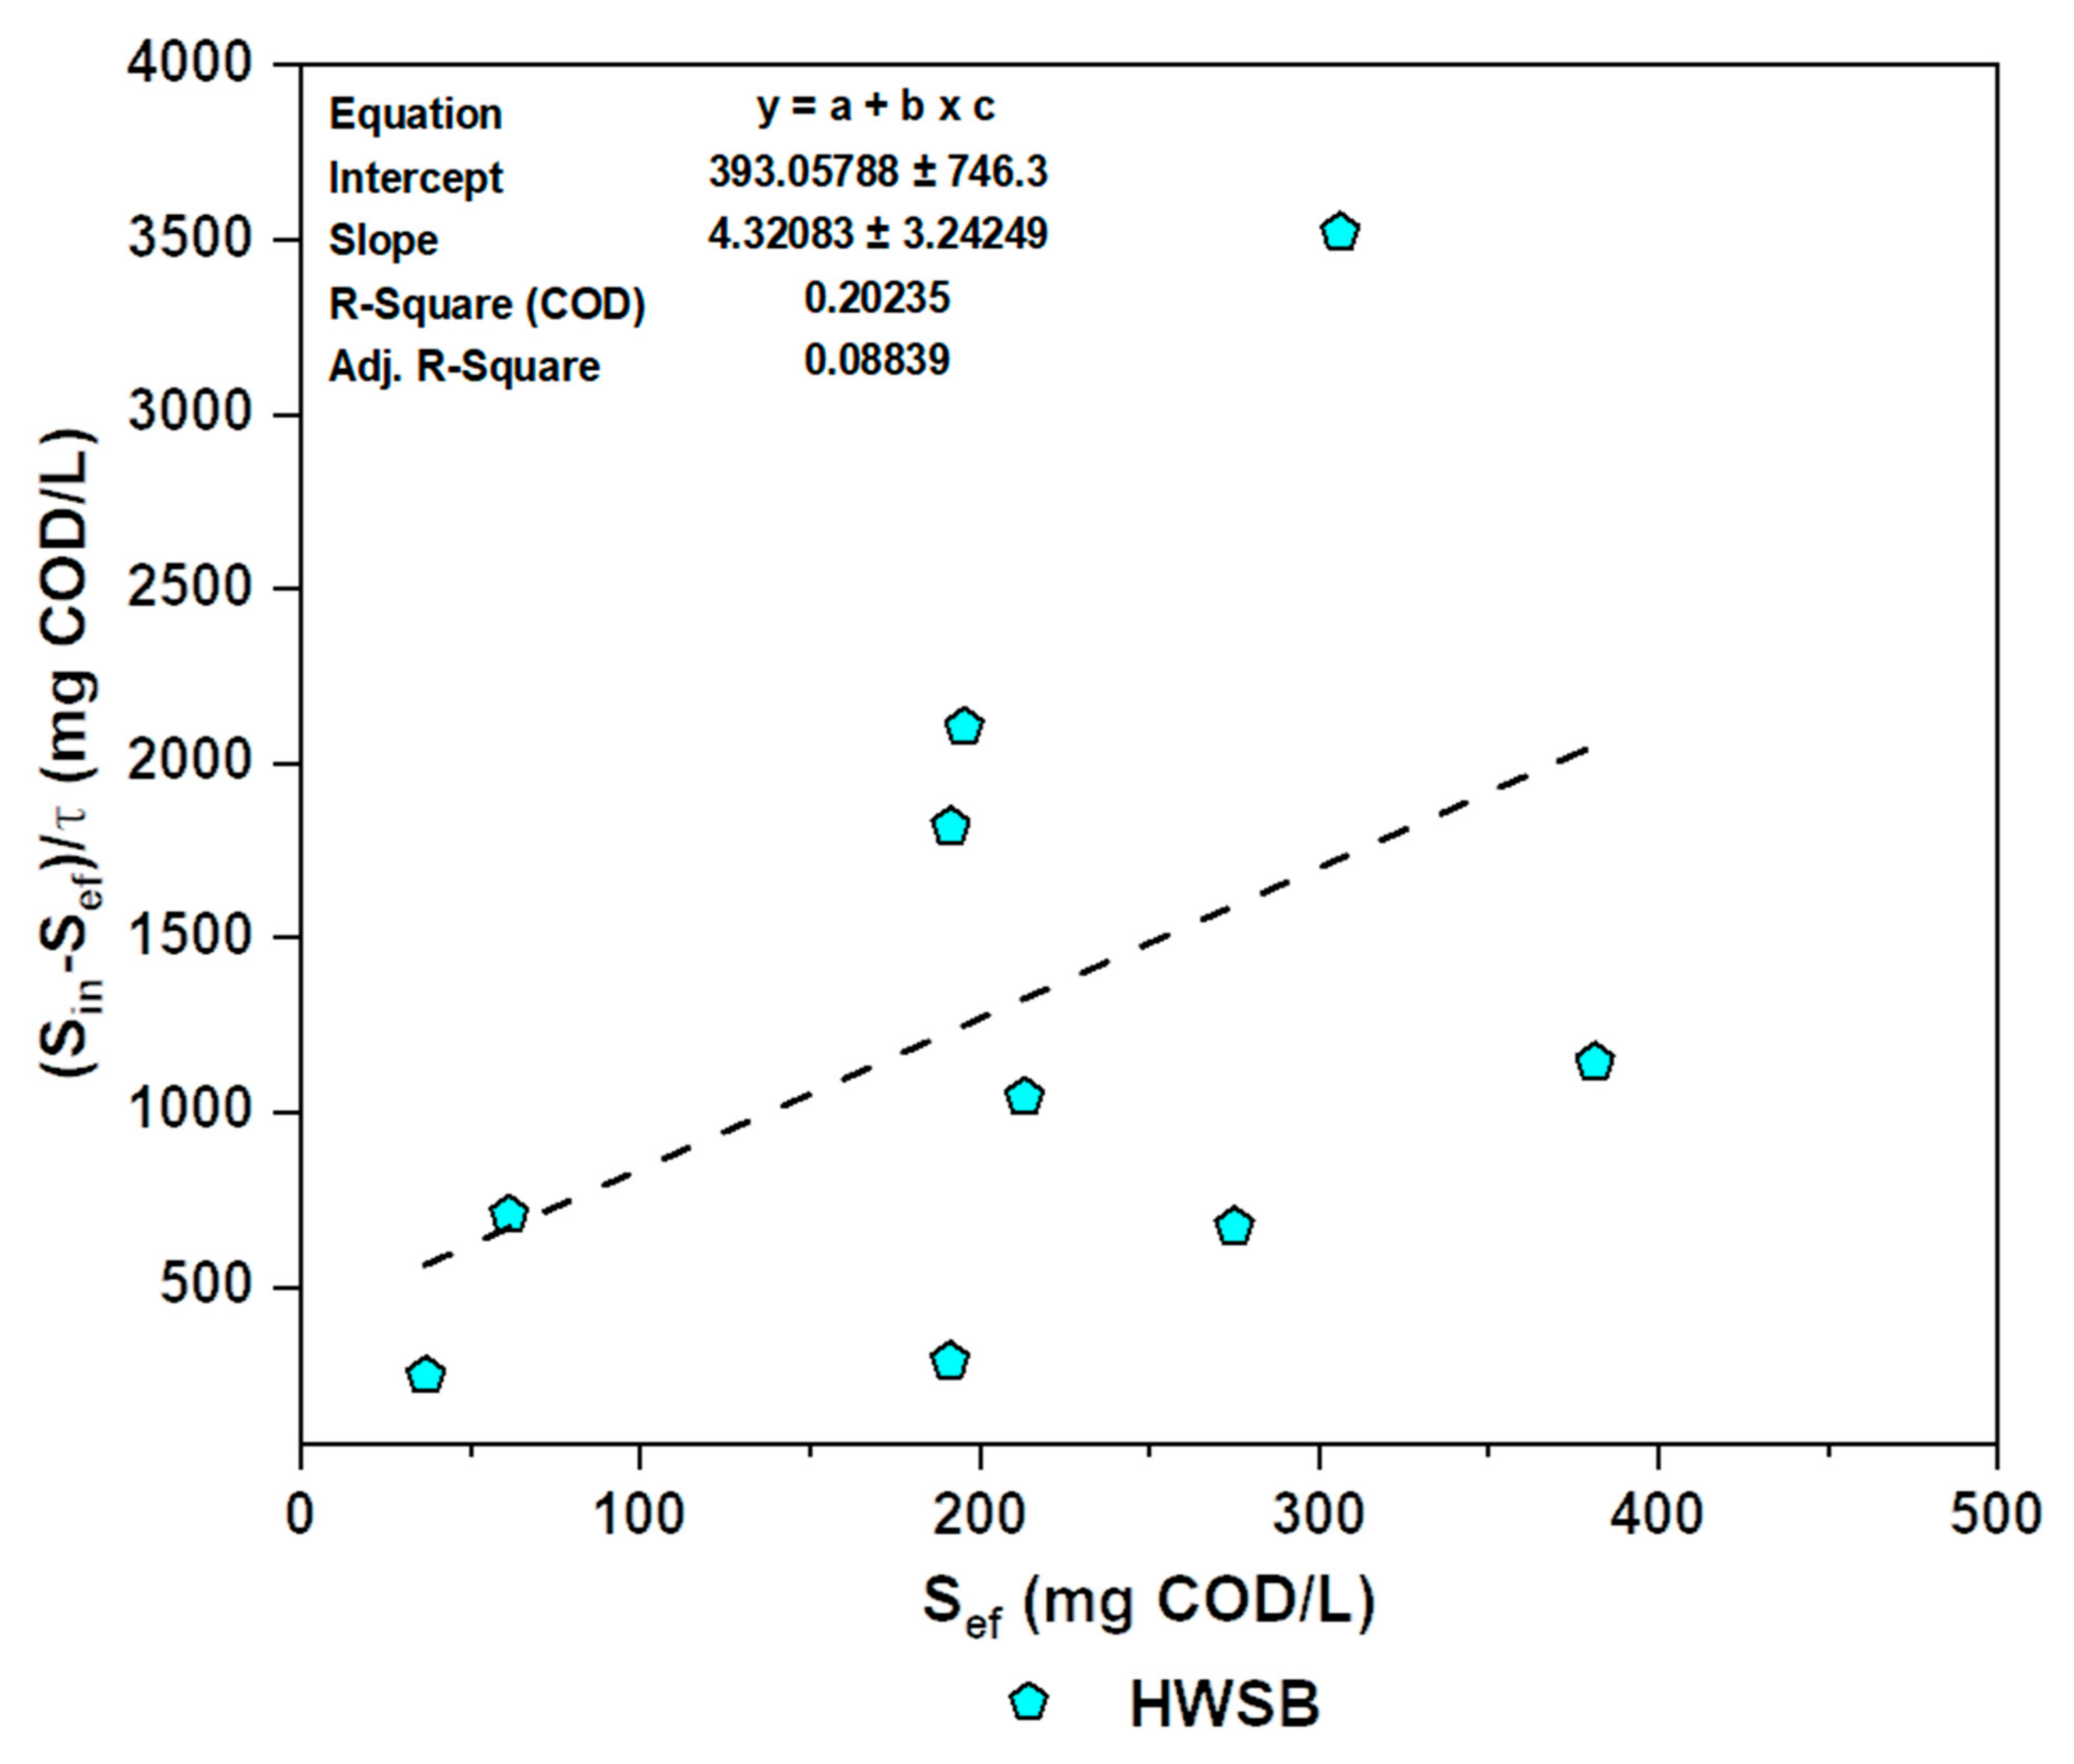
3.5.3. Grau Second-Order Model
4. Conclusions
Supplementary Materials
Author Contributions
Funding
Institutional Review Board Statement
Informed Consent Statement
Data Availability Statement
Acknowledgments
Conflicts of Interest
References
- Hernández, D.; Riaño, B.; Coca, M.; García-González, M. Treatment of agro-industrial wastewater using microalgae–bacteria consortium combined with anaerobic digestion of the produced biomass. Bioresour. Technol. 2013, 135, 598–603. [Google Scholar] [CrossRef] [PubMed]
- Amor, C.; Marchão, L.; Lucas, M.S.; Peres, J.A. Application of advanced oxidation processes for the treatment of recalcitrant agro-industrial wastewater: A review. Water 2019, 11, 205. [Google Scholar] [CrossRef]
- Sekeri, S.H.; Ibrahim, M.N.M.; Umar, K.; Yaqoob, A.A.; Azmi, M.N.; Hussin, M.H.; Othman, M.B.H.; Malik, M.F.I.A. Preparation and characterization of nanosized lignin from oil palm (Elaeis guineensis) biomass as a novel emulsifying agent. Int. J. Biol. Macromol. 2020, 164, 3114–3124. [Google Scholar] [CrossRef] [PubMed]
- Libutti, A.; Gatta, G.; Gagliardi, A.; Vergine, P.; Pollice, A.; Beneduce, L.; Disciglio, G.; Tarantino, E. Agro-industrial wastewater reuse for irrigation of a vegetable crop succession under Mediterranean conditions. Agric. Water Manag. 2018, 196, 1–14. [Google Scholar] [CrossRef]
- Teh, C.Y.; Wu, T.Y.; Juan, J.C. Optimization of agro-industrial wastewater treatment using unmodified rice starch as a natural coagulant. Ind. Crops Prod. 2014, 56, 17–26. [Google Scholar] [CrossRef]
- Abubakar, S.; Lawal, I.; Hassan, I.; Jagaba, A. Quality water analysis of public and private boreholes (a case study of Azare Town, Bauchi, Nigeria). Am. J. Eng. Res. 2016, 5, 204–208. [Google Scholar]
- Chen, W.; Oldfield, T.L.; Patsios, S.I.; Holden, N.M. Hybrid life cycle assessment of agro-industrial wastewater valorisation. Water Res. 2020, 170, 115275. [Google Scholar] [CrossRef]
- Yaqoob, A.A.; Noor, N.H.M.; Umar, K.; Adnan, R.; Ibrahim, M.N.M.; Rashid, M. Graphene oxide–ZnO nanocomposite: An efficient visible light photocatalyst for degradation of rhodamine B. Appl. Nanosci. 2021, 11, 1291–1302. [Google Scholar] [CrossRef]
- Bajpai, P. Biological Treatment of Pulp and Paper Mill Effluents. In Biotechnology for Pulp and Paper Processing; Springer: Singapore, 2018; pp. 313–369. [Google Scholar]
- Jagaba, A.H.; Kutty, S.R.M.; Noor, A.; Affam, A.C.; Ghfar, A.A.; Usman, A.K.; Lawal, I.M.; Birniwa, A.H.; Kankia, M.U.; Afolabi, H.K.; et al. Parametric optimization and kinetic modelling for organic matter removal from agro-waste derived paper packaging biorefinery wastewater. Biomass Convers. Bioref. 2022, 1–18. [Google Scholar] [CrossRef]
- Yaqoob, A.A.; Parveen, T.; Umar, K.; Mohamad Ibrahim, M.N. Role of nanomaterials in the treatment of wastewater: A review. Water 2020, 12, 495. [Google Scholar] [CrossRef]
- Brink, A.; Sheridan, C.; Harding, K. A kinetic study of a mesophilic aerobic moving bed biofilm reactor (MBBR) treating paper and pulp mill effluents: The impact of phenols on biodegradation rates. J. Water Process Eng. 2017, 19, 35–41. [Google Scholar] [CrossRef]
- Jagaba, A.H.; Kutty, S.R.M.; Noor, A.; Isah, A.S.; Lawal, I.M.; Birniwa, A.H.; Usman, A.K.; Abubakar, S. Kinetics of Pulp and Paper Wastewater Treatment by High Sludge Retention Time Activated Sludge Process. J. Hunan Univ. Nat. Sci. 2022, 49, 242–251. [Google Scholar] [CrossRef]
- Birniwa, A.H.; Abubakar, A.S.; Huq, A.O.; Mahmud, H.N.M.E. Polypyrrole-polyethyleneimine (PPy-PEI) nanocomposite: An effective adsorbent for nickel ion adsorption from aqueous solution. J. Macromol. Sci. Part A 2021, 58, 206–217. [Google Scholar] [CrossRef]
- Nasara, M.A.; Zubairu, I.; Jagaba, A.H.; Azare, A.A.; Yerima, Y.M.; Yerima, B. Assessment of Non-Revenue Water Management Practices in Nigeria (A Case Study of Bauchi State Water and Sewerage Cooperation). Am. J. Eng. Res. 2021, 10, 390–401. [Google Scholar]
- Birniwa, A.H.; Abubakar, A.S.; Mahmud, H.N.M.E.; Kutty, S.R.M.; Jagaba, A.H.; Abdullahi, S.S.A.; Zango, Z.U. Application of Agricultural Wastes for Cationic Dyes Removal from Wastewater. In Textile Wastewater Treatment; Springer: Singapore, 2022; pp. 239–274. [Google Scholar]
- Sayed, K.; Baloo, L.; Yekeen, S.T.; Kankia, M.U.; Jagaba, A.H. Determination of Total Petroleum Hydrocarbons Concentration in Coastal Seawater of Teluk Batik Beach, Perak, Malaysia. In Key Engineering Materials; Trans Tech Publications: Zurich, Switzerland, 2021; pp. 119–128. [Google Scholar]
- Nguyen, M.D.; Thomas, M.; Surapaneni, A.; Moon, E.M.; Milne, N.A. Beneficial reuse of water treatment sludge in the context of circular economy. Environ. Technol. Innov. 2022, 28, 102651. [Google Scholar] [CrossRef]
- Baloo, L.; Isa, M.H.; Sapari, N.B.; Jagaba, A.H.; Wei, L.J.; Yavari, S.; Razali, R.; Vasu, R. Adsorptive removal of methylene blue and acid orange 10 dyes from aqueous solutions using oil palm wastes-derived activated carbons. Alex. Eng. J. 2021, 60, 5611–5629. [Google Scholar] [CrossRef]
- Al-Mahbashi, N.M.Y.; Kutty, S.R.M.; Bilad, M.R.; Huda, N.; Kobun, R.; Noor, A.; Jagaba, A.H.; Al-Nini, A.; Ghaleb, A.A.S.; Al-dhawi, B.N.S. Bench-Scale Fixed-Bed Column Study for the Removal of Dye-Contaminated Effluent Using Sewage-Sludge-Based Biochar. Sustainability 2022, 14, 6484. [Google Scholar] [CrossRef]
- Jagaba, A.H.; Kutty, S.R.M.; Baloo, L.; Noor, A.; Abubakar, S.; Lawal, I.M.; Umaru, I.; Usman, A.K.; Kumar, V.; Birniwa, A.H. Effect of Hydraulic Retention Time on the Treatment of Pulp and Paper Industry Wastewater by Extended Aeration Activated Sludge System. In Proceedings of the 2021 Third International Sustainability and Resilience Conference: Climate Change, Online, 15–16 November 2021; pp. 221–224. [Google Scholar]
- Nuanhchamnong, C.; Kositkanawuth, K.; Wantaneeyakul, N. Granular waterworks sludge-biochar composites: Characterization and dye removal application. Results Eng. 2022, 14, 100451. [Google Scholar] [CrossRef]
- Pérez, S.; Giraldo, S.; Forgionny, A.; Flórez, E.; Acelas, N. Eco-Friendly Reuse of Agricultural Wastes to Produce Biocomposites with High Potential in Water Treatment and Fertilizers. Biomass Convers. Bioref. 2022, 1–11. Available online: https://investigaciones-pure.udem.edu.co/en/publications/eco-friendly-reuse-of-agricultural-wastes-to-produce-biocomposite (accessed on 1 September 2022). [CrossRef]
- Jagaba, A.H.; Kutty, S.R.M.; Hayder, G.; Baloo, L.; Noor, A.; Yaro, N.S.A.; Saeed, A.A.H.; Lawal, I.M.; Birniwa, A.H.; Usman, A.K. A systematic literature review on waste-to-resource potential of palm oil clinker for sustainable engineering and environmental applications. Materials 2021, 14, 4456. [Google Scholar] [CrossRef]
- Noor, A.; Kutty, S.R.M.; Jagaba, A.H.; Yusuf, M.; Akram, M.W.; Adil, M.R.; Ahmad, N.; Jamal, M. Kinetic Modelling of Nutrient Removal of Petroleum Industry Wastewater Remediation. In Proceedings of the 2021 Third International Sustainability and Resilience Conference: Climate Change, Online, 15–16 November 2021; pp. 216–220. [Google Scholar]
- Devi, P.; Saroha, A.K. Effect of temperature on biochar properties during paper mill sludge pyrolysis. Int. J. ChemTech Res. 2013, 5, 682–687. [Google Scholar]
- Birniwa, A.; Abdullahi, S. Study on physico-mechanical behaviour of acacia nilotica (gum tree) and glass fiber blend reinforced epoxy resin composite. ChemSearch J. 2019, 10, 46–53. [Google Scholar]
- Witek-Krowiak, A.; Chojnacka, K.; Podstawczyk, D.; Dawiec, A.; Pokomeda, K. Application of response surface methodology and artificial neural network methods in modelling and optimization of biosorption process. Bioresour. Technol. 2014, 160, 150–160. [Google Scholar] [CrossRef]
- Hong, C.; Hao, H.; Haiyun, W. Process optimization for PHA production by activated sludge using response surface methodology. Biomass Bioenergy 2009, 33, 721–727. [Google Scholar] [CrossRef]
- Luo, Y.; Han, Y.; Xue, M.; Xie, Y.; Yin, Z.; Xie, C.; Li, X.; Zheng, Y.; Huang, J.; Zhang, Y. Ball-milled bismuth oxybromide/biochar composites with enhanced removal of reactive red owing to the synergy between adsorption and photodegradation. J. Environ. Manag. 2022, 308, 114652. [Google Scholar] [CrossRef]
- Jagaba, A.; Kutty, S.; Fauzi, M.; Razali, M.; Hafiz, M.; Noor, A. Organic and Nutrient Removal from Pulp and Paper Industry Wastewater by Extended Aeration Activated Sludge System. IOP Conf. Ser. Earth Environ. Sci. 2021, 781, 012021. [Google Scholar] [CrossRef]
- Sharma, P.; Iqbal, H.M.; Chandra, R. Evaluation of pollution parameters and toxic elements in wastewater of pulp and paper industries in India: A case study. Case Stud. Chem. Environ. Eng. 2022, 5, 100163. [Google Scholar] [CrossRef]
- Tian, W.; Gao, Q.; Qian, W. Interlinked porous carbon nanoflakes derived from hydrolyzate residue during cellulosic bioethanol production for ultrahigh-rate supercapacitors in nonaqueous electrolytes. ACS Sustain. Chem. Eng. 2017, 5, 1297–1305. [Google Scholar] [CrossRef]
- Kang, C.; Zhao, Y.; Tang, C.; Addo-Bankas, O. Use of aluminum-based water treatment sludge as coagulant for animal farm wastewater treatment. J. Water Process Eng. 2022, 46, 102645. [Google Scholar] [CrossRef]
- Kankia, M.U.; Baloo, L.; Danlami, N.; Mohammed, B.S.; Haruna, S.; Abubakar, M.; Jagaba, A.H.; Sayed, K.; Abdulkadir, I.; Salihi, I.U. Performance of Fly Ash-Based Inorganic Polymer Mortar with Petroleum Sludge Ash. Polymers 2021, 13, 4143. [Google Scholar] [CrossRef]
- Gupta, V.; Bhardwaj, N.; Rawal, R. Removal of color and lignin from paper mill wastewater using activated carbon from plastic mix waste. Int. J. Environ. Sci. Technol. 2022, 19, 2641–2658. [Google Scholar] [CrossRef]
- Ghaleb, A.; Kutty, S.; Ho, Y.; Jagaba, A.; Noor, A.; Al-Sabaeei, A.; Kumar, V.; Saeed, A. Anaerobic co-digestion for oily-biological sludge with sugarcane bagasse for biogas production under mesophilic condition. IOP Conf. Ser. Mater. Sci. Eng. 2020, 991, 012084. [Google Scholar] [CrossRef]
- Zhang, Y.; Qin, J.; Yi, Y. Biochar and hydrochar derived from freshwater sludge: Characterization and possible applications. Sci. Total Environ. 2021, 763, 144550. [Google Scholar] [CrossRef] [PubMed]
- Kankia, M.U.; Baloo, L.; Danlami, N.; Samahani, W.N.; Mohammed, B.S.; Haruna, S.; Jagaba, A.H.; Abubakar, M.; Ishak, E.A.; Sayed, K. Optimization of Cement-Based Mortar Containing Oily Sludge Ash by Response Surface Methodology. Materials 2021, 14, 6308. [Google Scholar] [CrossRef]
- Sun, C.; Du, Q.; Zhang, X.; Wang, Z.; Zheng, J.; Wu, Q.; Li, Z.; Long, T.; Guo, W.; Ngo, H.H. Role of spent coffee ground biochar in an anaerobic membrane bioreactor for treating synthetic swine wastewater. J. Water Process Eng. 2022, 49, 102981. [Google Scholar] [CrossRef]
- Sayed, K.; Baloo, L.; Kutty, S.R.B.; Al Madhoun, W.; Kankia, M.U.; Jagaba, A.H.; Singa, P.K. Optimization of palm oil mill effluent final discharge as biostimulant for biodegradation of tapis light crude petroleum oil in seawater. J. Sea Res. 2022, 188, 102268. [Google Scholar] [CrossRef]
- Singh, G.; Singh, N.; Shukla, S. Remediation of COD and color from textile wastewater using dual stage electrocoagulation process. SN Appl. Sci. 2019, 1, 1000. [Google Scholar] [CrossRef]
- Puri, S.; Verma, A. Color removal from secondary treated pulp & paper industry effluent using waste driven Fe–TiO2 composite. Chemosphere 2022, 303, 135143. [Google Scholar]
- Abedinzadeh, N.; Shariat, M.; Monavari, S.M.; Pendashteh, A. Evaluation of color and COD removal by Fenton from biologically (SBR) pre-treated pulp and paper wastewater. Process Saf. Environ. Prot. 2018, 116, 82–91. [Google Scholar] [CrossRef]
- Kumar, R.; Singh, A.; Maurya, A.; Yadav, P.; Yadav, A.; Chowdhary, P.; Raj, A. Effective bioremediation of pulp and paper mill wastewater using Bacillus cereus as a possible kraft lignin-degrading bacterium. Bioresour. Technol. 2022, 352, 127076. [Google Scholar] [CrossRef]
- Devi, P.; Saroha, A.K. Risk analysis of pyrolyzed biochar made from paper mill effluent treatment plant sludge for bioavailability and eco-toxicity of heavy metals. Bioresour. Technol. 2014, 162, 308–315. [Google Scholar] [CrossRef] [PubMed]
- Jagaba, A.H.; Kutty, S.R.M.; Salih, G.H.A.; Noor, A.; HAFIZ, M.; Yaro, N.S.A.; Saeed, A.A.H.; Lawal, I.M.; Birniwa, A.H.; Kilaco, A.U. Palm Oil Clinker as a Waste By-Product: Utilization and Circular Economy Potential; IntechOpen: London, UK, 2021; Volume 1. [Google Scholar]
- Sathian, S.; Rajasimman, M.; Radha, G.; Shanmugapriya, V.; Karthikeyan, C. Performance of SBR for the treatment of textile dye wastewater: Optimization and kinetic studies. Alex. Eng. J. 2014, 53, 417–426. [Google Scholar] [CrossRef]
- Jagaba, A.H.; Kutty, S.R.M.; Isa, M.H.; Affam, A.C.; Aminu, N.; Abubakar, S.; Noor, A.; Lawal, I.M.; Umaru, I.; Hassan, I. Effect of Environmental and Operational Parameters on Sequential Batch Reactor Systems in Dye Degradation. In Dye Biodegradation, Mechanisms and Techniques; Springer: Singapore, 2022; pp. 193–225. [Google Scholar]
- Saeed, A.A.H.; Harun, N.Y.; Sufian, S.; Bilad, M.R.; Zakaria, Z.Y.; Jagaba, A.H.; Ghaleb, A.A.S.; Mohammed, H.G. Pristine and magnetic kenaf fiber biochar for Cd2+ adsorption from aqueous solution. Int. J. Environ. Res. Public Health 2021, 18, 7949. [Google Scholar] [CrossRef] [PubMed]
- Birniwa, A.H.; Abdullahi, S.S.A.; Yakasai, M.Y.; Ismaila, A. Studies on physico-mechanical behaviour of kenaf/glass fiber reinforced epoxy hybrid composites. Bull. Chem. Soc. Ethiop. 2021, 35, 171–184. [Google Scholar] [CrossRef]
- Ghaleb, A.A.S.; Kutty, S.R.M.; Salih, G.H.A.; Jagaba, A.H.; Noor, A.; Kumar, V.; Almahbashi, N.M.Y.; Saeed, A.A.H.; Saleh Al-dhawi, B.N. Sugarcane bagasse as a co-substrate with oil-refinery biological sludge for biogas production using batch mesophilic anaerobic co-digestion technology: Effect of carbon/nitrogen ratio. Water 2021, 13, 590. [Google Scholar] [CrossRef]
- Jagaba, A.H.; Kutty, S.R.M.; Lawal, I.M.; Aminu, N.; Noor, A.; Al-dhawi, B.N.S.; Usman, A.K.; Batari, A.; Abubakar, S.; Birniwa, A.H. Diverse sustainable materials for the treatment of petroleum sludge and remediation of contaminated sites: A review. Clean. Waste Syst. 2022, 2, 100010. [Google Scholar] [CrossRef]
- Lawal, I.M.; Bertram, D.; White, C.J.; Jagaba, A.H.; Hassan, I.; Shuaibu, A. Multi-criteria performance evaluation of gridded precipitation and temperature products in data-sparse regions. Atmosphere 2021, 12, 1597. [Google Scholar] [CrossRef]
- Jagaba, A.H.; Kutty, S.R.M.; Noor, A.; Birniwa, A.H.; Affam, A.C.; Lawal, I.M.; Kankia, M.U.; Kilaco, A.U. A systematic literature review of biocarriers: Central elements for biofilm formation, organic and nutrients removal in sequencing batch biofilm reactor. J. Water Process Eng. 2021, 42, 102178. [Google Scholar] [CrossRef]
- Birniwa, A.H.; Mahmud, H.N.M.E.; Abdullahi, S.S.A.; Habibu, S.; Jagaba, A.H.; Ibrahim, M.N.M.; Ahmad, A.; Alshammari, M.B.; Parveen, T.; Umar, K. Adsorption Behavior of Methylene Blue Cationic Dye in Aqueous Solution Using Polypyrrole-Polyethylenimine Nano-Adsorbent. Polymers 2022, 14, 3362. [Google Scholar] [CrossRef]
- Al-mahbashi, N.; Kutty, S.; Jagaba, A.; Al-Nini, A.; Ali, M.; Saeed, A.; Ghaleb, A.; Rathnayake, U. Column Study for Adsorption of Copper and Cadmium Using Activated Carbon Derived from Sewage Sludge. Adv. Civ. Eng. 2022, 2022, 3590462. [Google Scholar] [CrossRef]
- Ghaleb, A.A.S.; Kutty, S.R.M.; Ho, Y.-C.; Jagaba, A.H.; Noor, A.; Al-Sabaeei, A.M.; Almahbashi, N.M.Y. Response surface methodology to optimize methane production from mesophilic anaerobic co-digestion of oily-biological sludge and sugarcane bagasse. Sustainability 2020, 12, 2116. [Google Scholar] [CrossRef] [Green Version]


| Parameter | Mean Value |
|---|---|
| pH | 7.14 |
| Temperature (°C) | 27.42 |
| TS (mg/L) | 10,376 |
| SS (mg/L) | 8205 |
| MLVSS/MLSS | 0.87 |
| Settleability (ml/L) | 244.91 |
| SVI (mL/g) | 99.76 |
| Parameter | Values |
|---|---|
| pH | 7.48 |
| BET surface area (m2/g) | 327.09 |
| Total pore volume (cm3/g) | 0.462 |
| Mean pore radius (Å) | 85.10 |
| Mean pore size (nm) | 1.903 |
| COD Removal | = | Color Removal | = |
|---|---|---|---|
| +70.11561 | +55.01228 | ||
| +0.602719 | AIE | +1.13805 | AIE |
| +1.15640 | HRT | −4.33443 | HRT |
| +0.096000 | AIE × HRT | +0.056750 | AIE × HRT |
| −0.017684 | AIE² | −0.022484 | AIE² |
| −1.95868 | HRT² | +0.316316 | HRT² |
| COD | ||||||
|---|---|---|---|---|---|---|
| Sum of Squares | df | Mean Square | F-Value | p-Value | ||
| Model | 438.63 | 5 | 87.73 | 6.33 | 0.0320 | significant |
| A-AIE conc. | 170.24 | 1 | 170.24 | 12.29 | 0.0172 | |
| B-HRT | 86.56 | 1 | 86.56 | 6.25 | 0.0545 | |
| AB | 14.75 | 1 | 14.75 | 1.06 | 0.3495 | |
| A2 | 126.76 | 1 | 126.76 | 9.15 | 0.0292 | |
| B2 | 9.72 | 1 | 9.72 | 0.7017 | 0.4404 | |
| Residual | 69.25 | 5 | 13.85 | |||
| Lack of Fit | 28.17 | 3 | 9.39 | 0.4570 | 0.7406 | not significant |
| Pure Error | 41.09 | 2 | 20.54 | |||
| Cor Total | 507.89 | 10 | ||||
| Color | ||||||
| Sum of Squares | df | Mean Square | F-Value | p-Value | ||
| Model | 255.91 | 5 | 51.18 | 8.47 | 0.0175 | significant |
| A-AIE conc. | 22.81 | 1 | 22.81 | 3.78 | 0.1096 | |
| B-HRT | 11.21 | 1 | 11.21 | 1.85 | 0.2314 | |
| AB | 5.15 | 1 | 5.15 | 0.8527 | 0.3982 | |
| A2 | 204.91 | 1 | 204.91 | 33.91 | 0.0021 | |
| B2 | 0.2535 | 1 | 0.2535 | 0.0419 | 0.8458 | |
| Residual | 30.21 | 5 | 6.04 | |||
| Lack of Fit | 28.71 | 3 | 9.57 | 12.73 | 0.0737 | not significant |
| Pure Error | 1.50 | 2 | 0.7519 | |||
| Cor Total | 286.12 | 10 | ||||
| COD | Color | |
|---|---|---|
| Std. Dev. | 3.72 | 2.46 |
| Mean | 67.59 | 60.19 |
| C.V. % | 5.51 | 4.08 |
| R² | 0.8636 | 0.8944 |
| Adjusted R² | 0.7273 | 0.7888 |
| Predicted R² | 0.4222 | 0.2790 |
| Adeq. precision | 6.6396 | 6.9549 |
| COD | Color | |
|---|---|---|
| PRESS | 293.44 | 206.29 |
| −2 Log Likelihood | 51.46 | 42.33 |
| BIC | 65.84 | 56.72 |
| AICc | 84.46 | 75.33 |
Publisher’s Note: MDPI stays neutral with regard to jurisdictional claims in published maps and institutional affiliations. |
© 2022 by the authors. Licensee MDPI, Basel, Switzerland. This article is an open access article distributed under the terms and conditions of the Creative Commons Attribution (CC BY) license (https://creativecommons.org/licenses/by/4.0/).
Share and Cite
Jagaba, A.H.; Kutty, S.R.M.; Abubakar, S.; Birniwa, A.H.; Lawal, I.M.; Umaru, I.; Usman, A.K.; Yaro, N.S.A.; Al-Zaqri, N.; Al-Maswari, B.M.; et al. Synthesis, Characterization, and Performance Evaluation of Hybrid Waste Sludge Biochar for COD and Color Removal from Agro-Industrial Effluent. Separations 2022, 9, 258. https://doi.org/10.3390/separations9090258
Jagaba AH, Kutty SRM, Abubakar S, Birniwa AH, Lawal IM, Umaru I, Usman AK, Yaro NSA, Al-Zaqri N, Al-Maswari BM, et al. Synthesis, Characterization, and Performance Evaluation of Hybrid Waste Sludge Biochar for COD and Color Removal from Agro-Industrial Effluent. Separations. 2022; 9(9):258. https://doi.org/10.3390/separations9090258
Chicago/Turabian StyleJagaba, Ahmad Hussaini, Shamsul Rahman Mohamed Kutty, Sule Abubakar, Abdullahi Haruna Birniwa, Ibrahim Mohammed Lawal, Ibrahim Umaru, Abdullahi Kilaco Usman, Nura Shehu Aliyu Yaro, Nabil Al-Zaqri, Basheer M. Al-Maswari, and et al. 2022. "Synthesis, Characterization, and Performance Evaluation of Hybrid Waste Sludge Biochar for COD and Color Removal from Agro-Industrial Effluent" Separations 9, no. 9: 258. https://doi.org/10.3390/separations9090258
APA StyleJagaba, A. H., Kutty, S. R. M., Abubakar, S., Birniwa, A. H., Lawal, I. M., Umaru, I., Usman, A. K., Yaro, N. S. A., Al-Zaqri, N., Al-Maswari, B. M., Ibrahim, M. N. M., & Hussain, F. (2022). Synthesis, Characterization, and Performance Evaluation of Hybrid Waste Sludge Biochar for COD and Color Removal from Agro-Industrial Effluent. Separations, 9(9), 258. https://doi.org/10.3390/separations9090258