

Exploring the Biosorption of Methylene Blue Dye onto Agricultural Products: A Critical Review


 , and
, and 
Abstract
1. Introduction
2. UV-VIS Spectrophotometer
3. Langmuir Sorption Ability
4. Fourier Transform Infrared (FT-IR) Spectroscopy
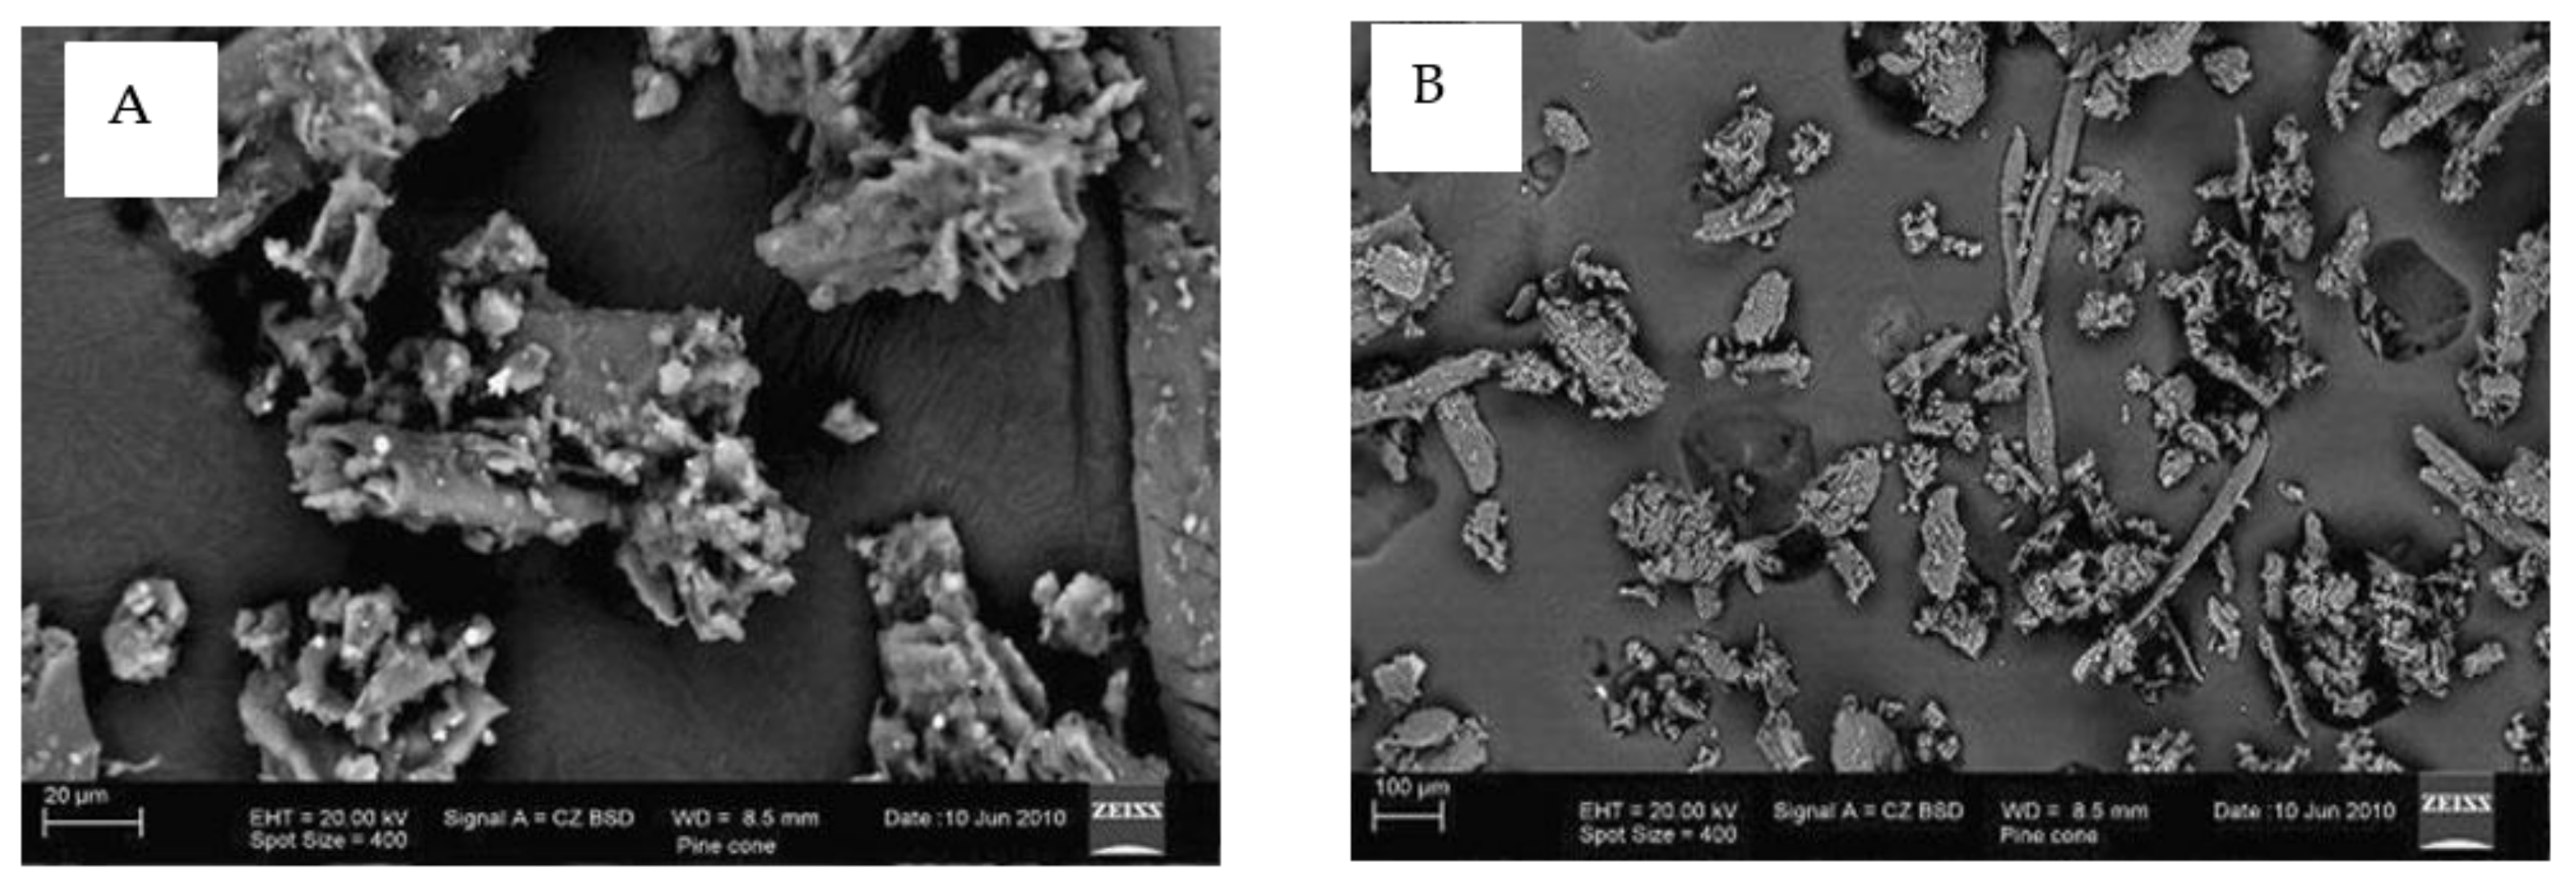
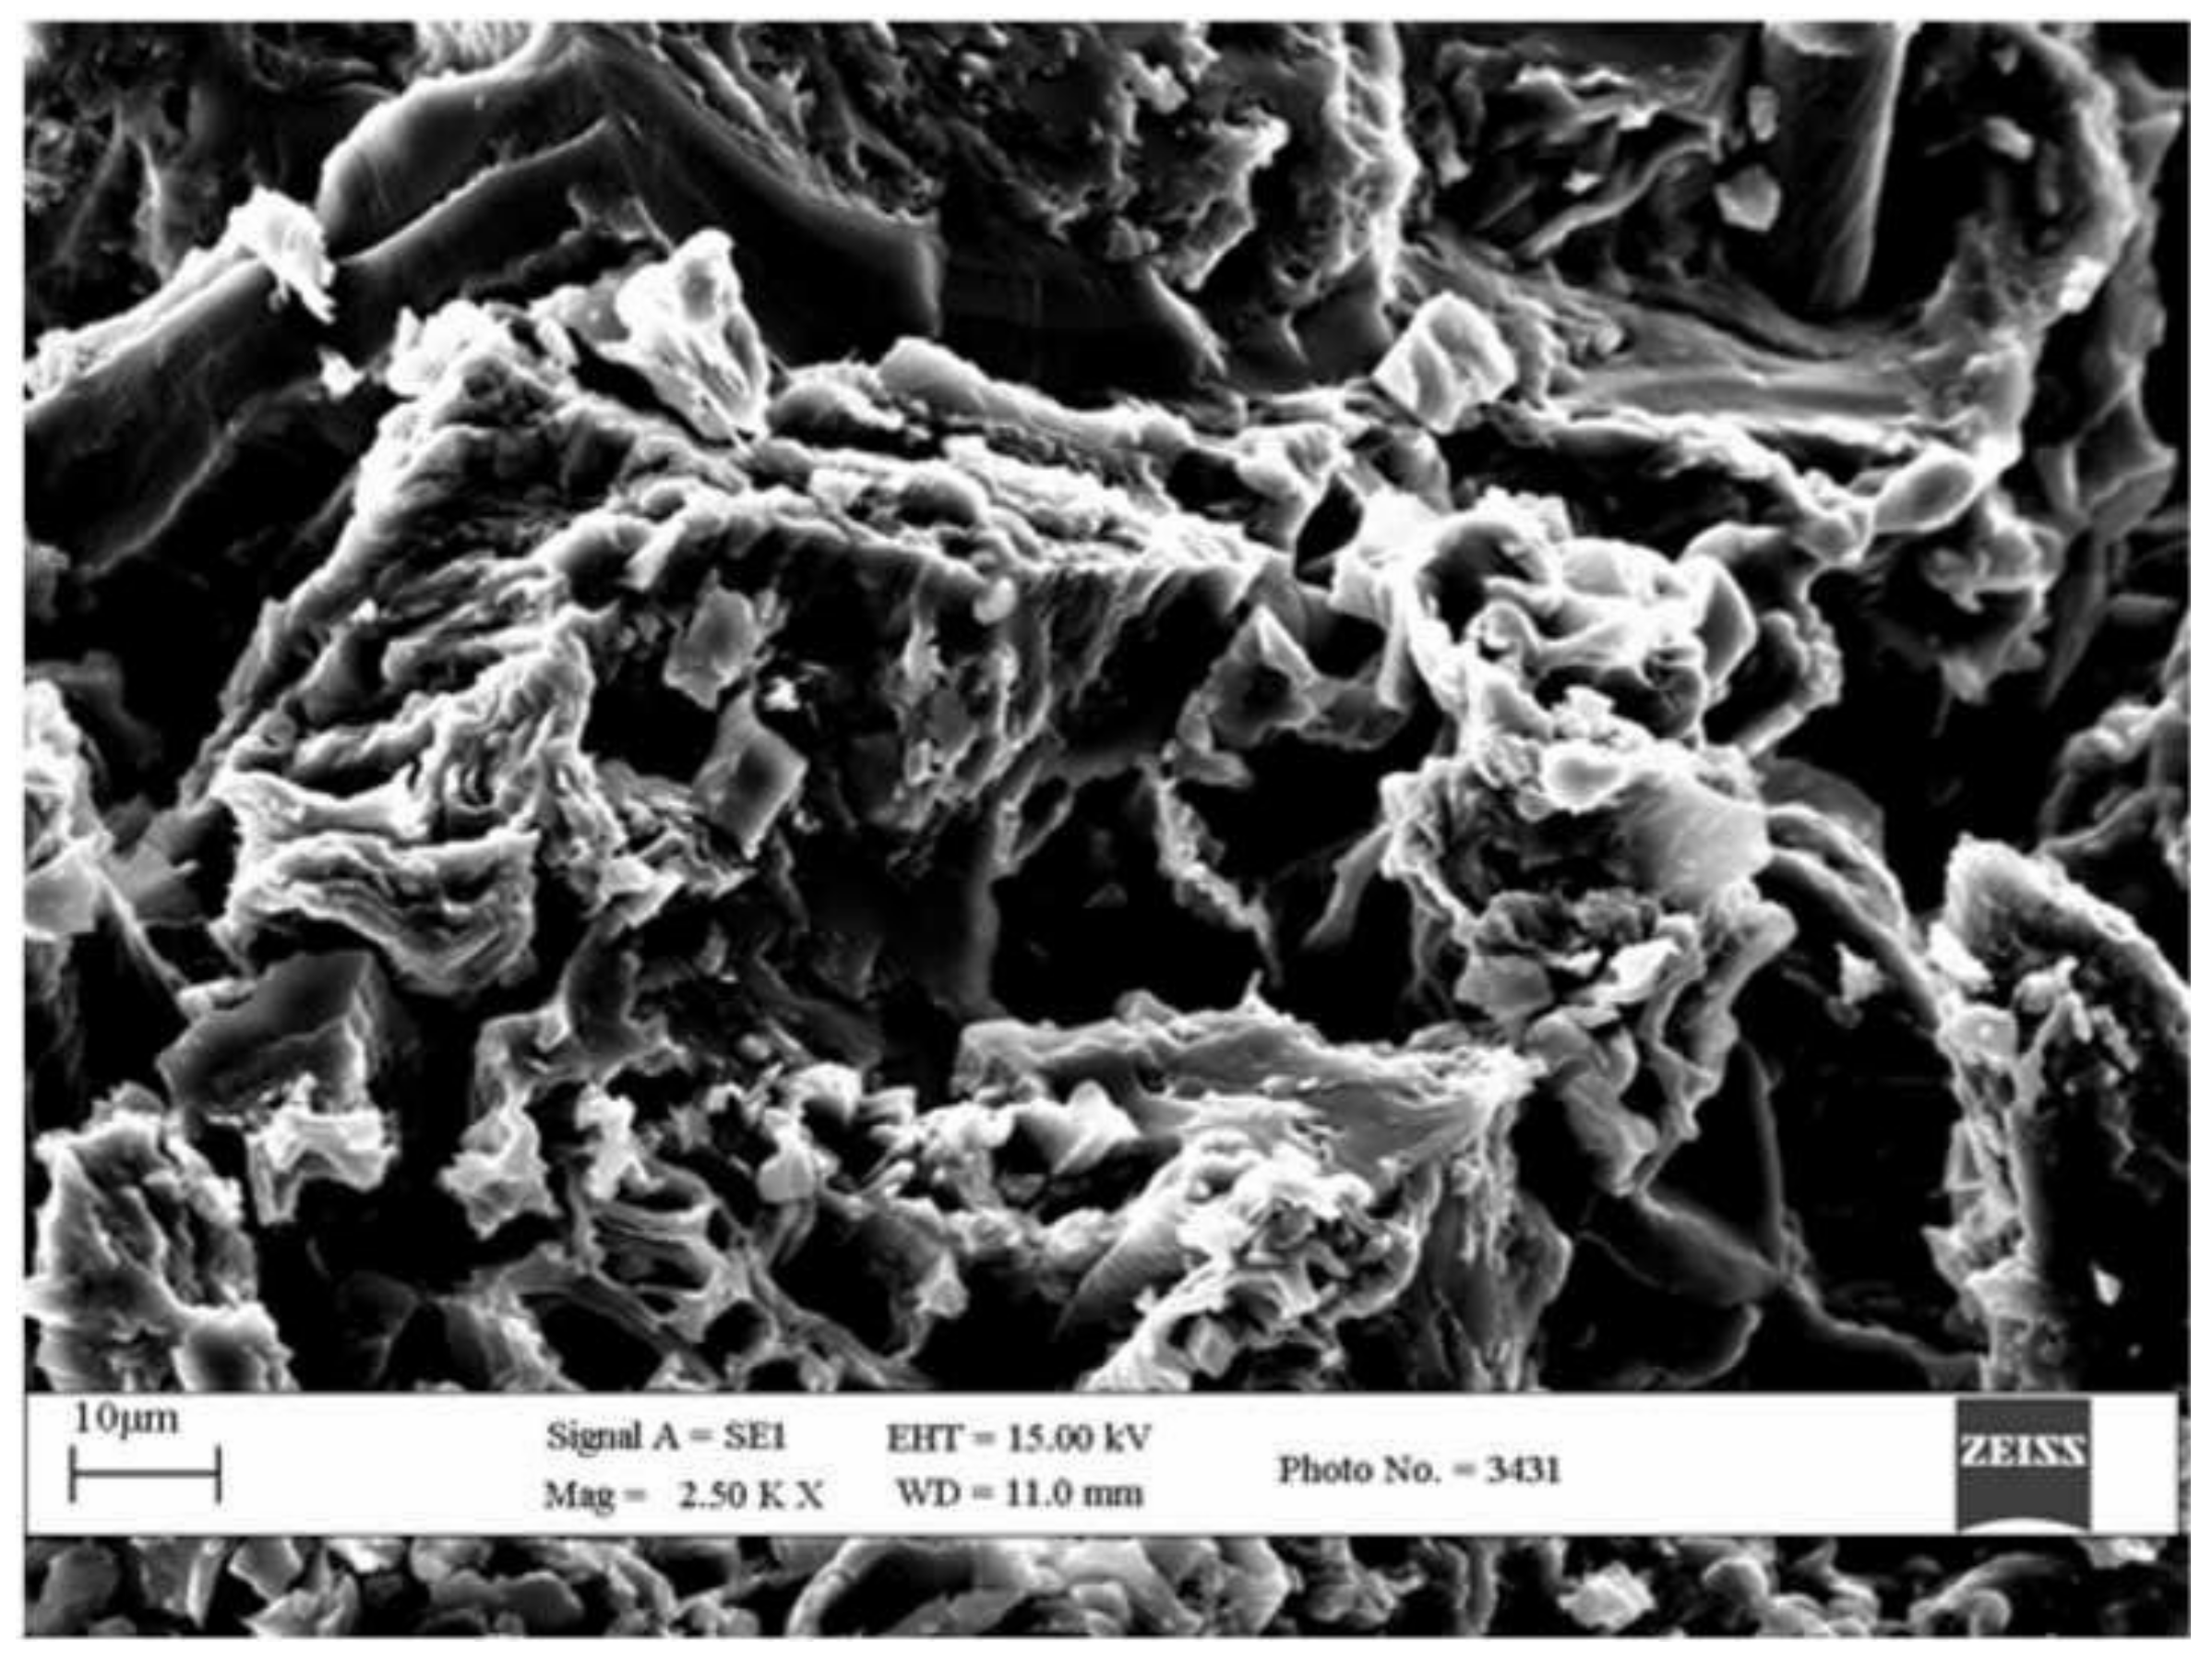
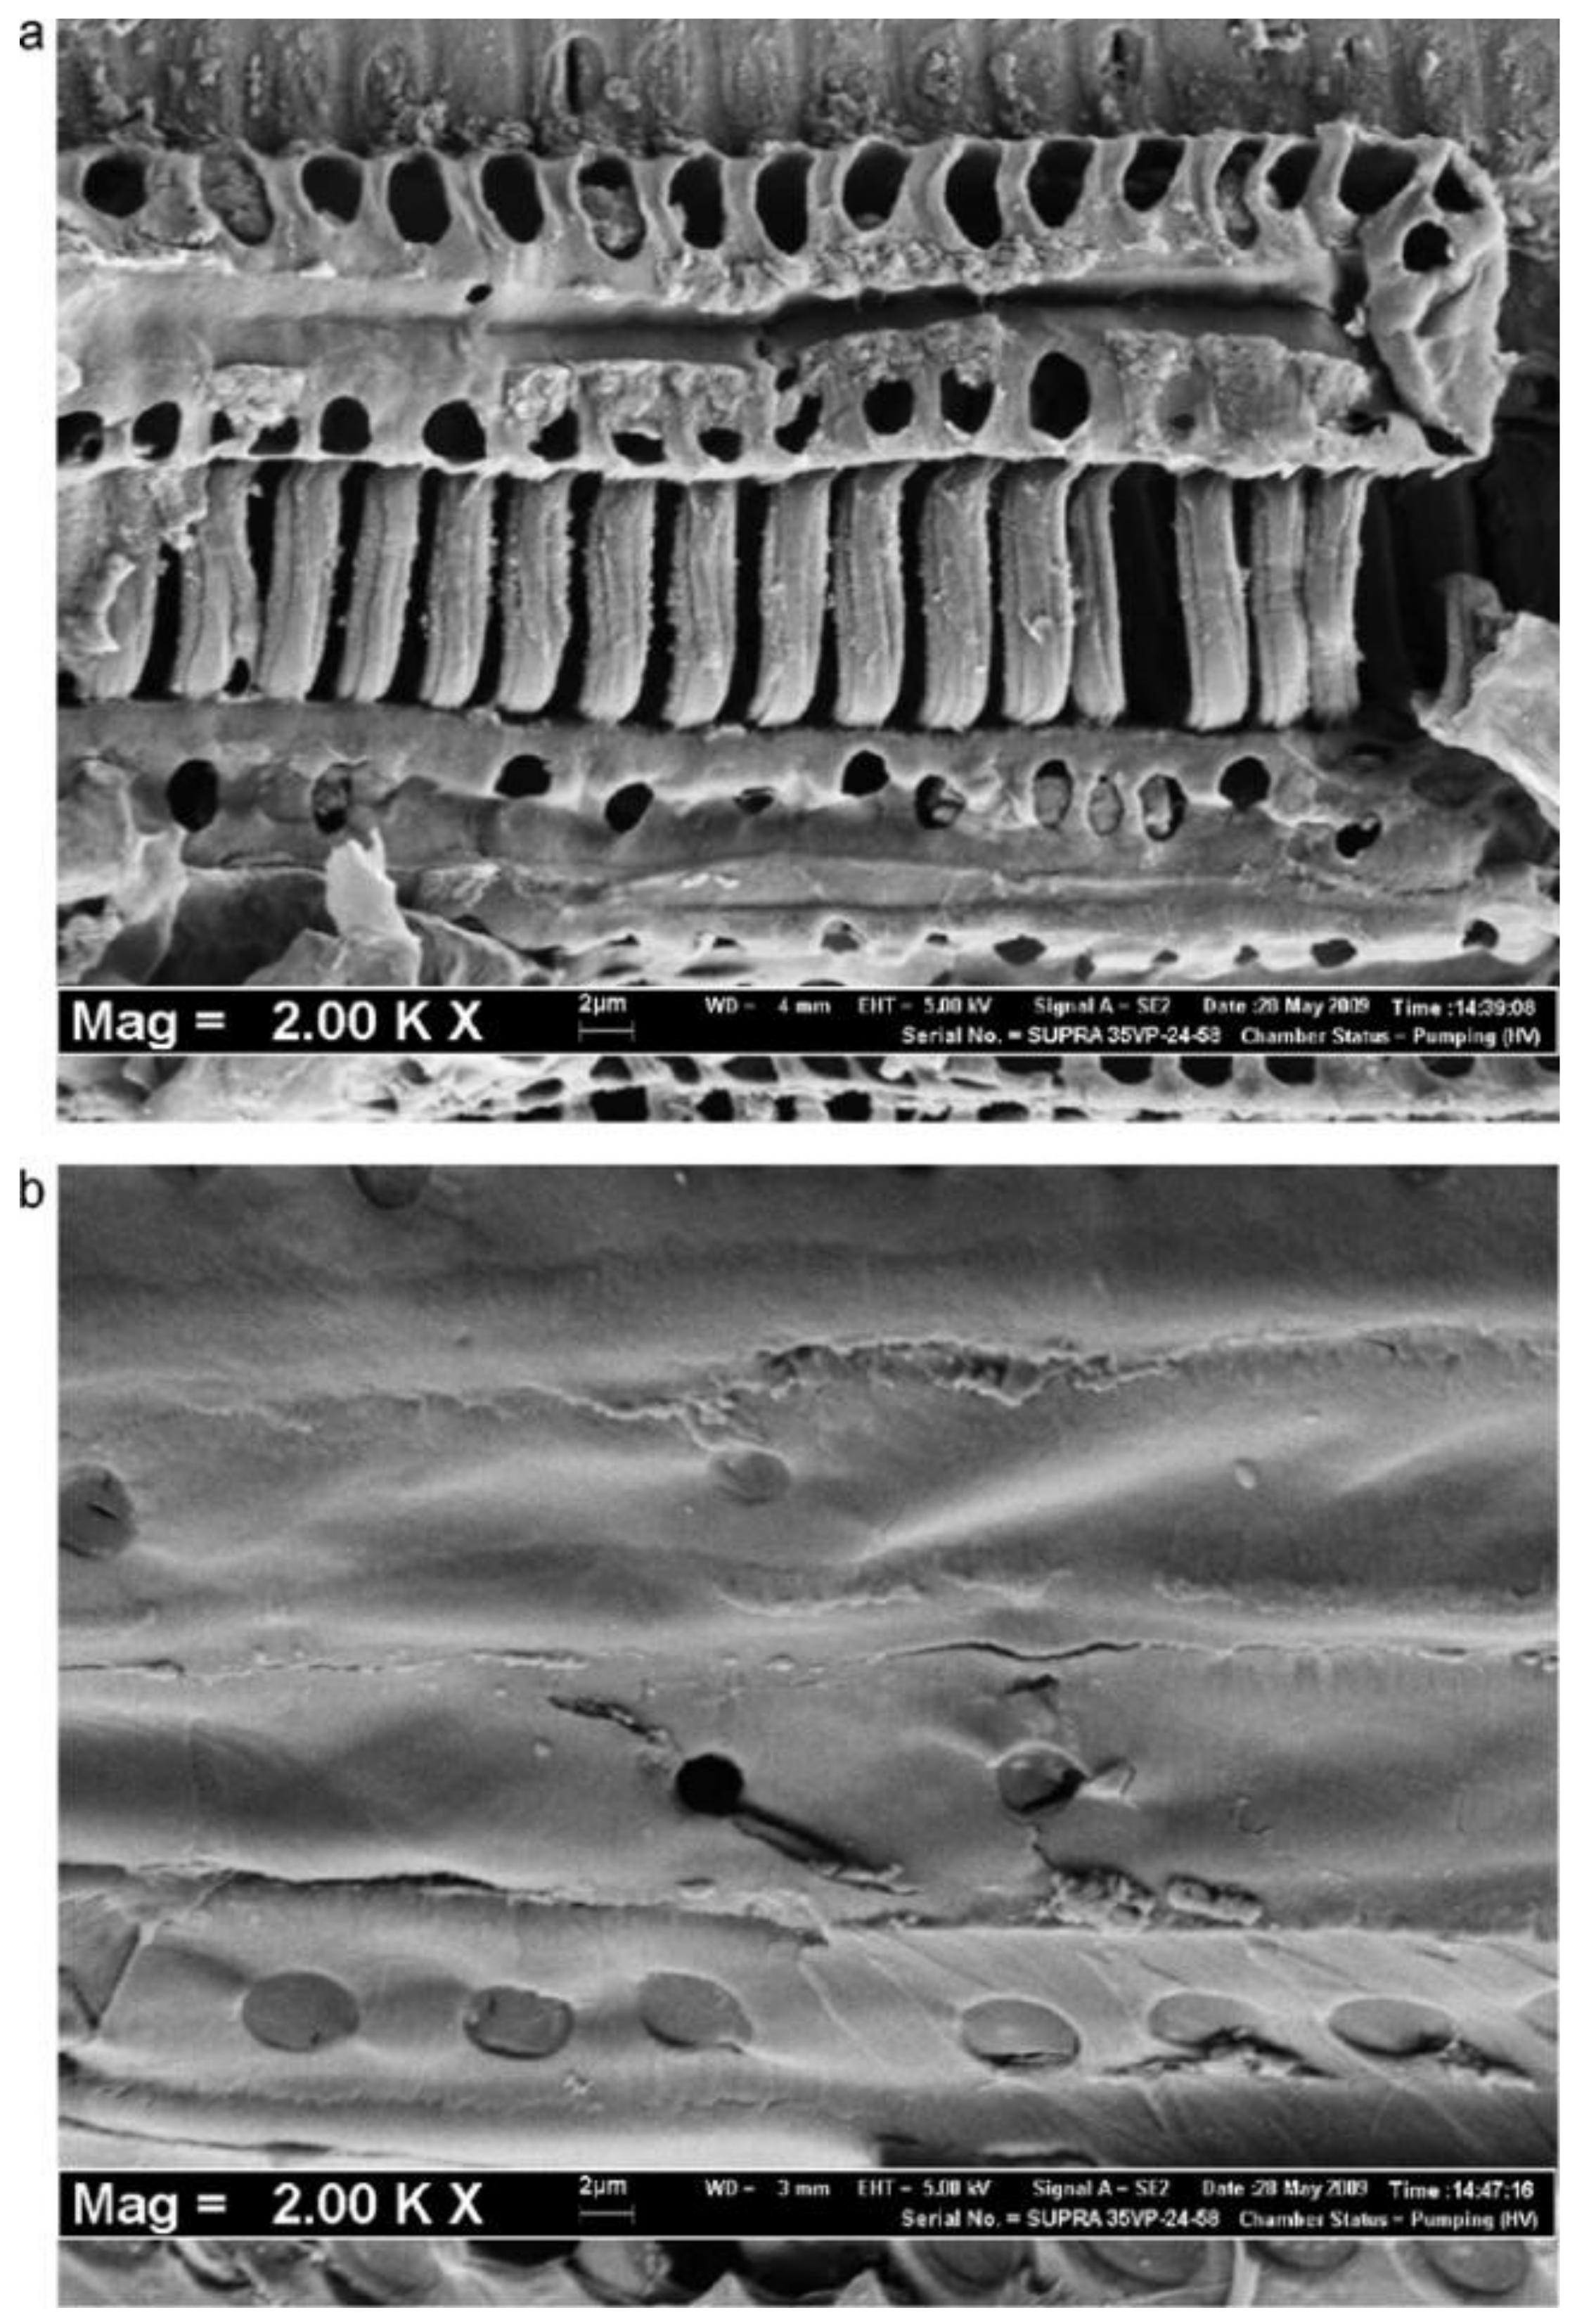
5. SEM
6. Thermodynamic Analysis
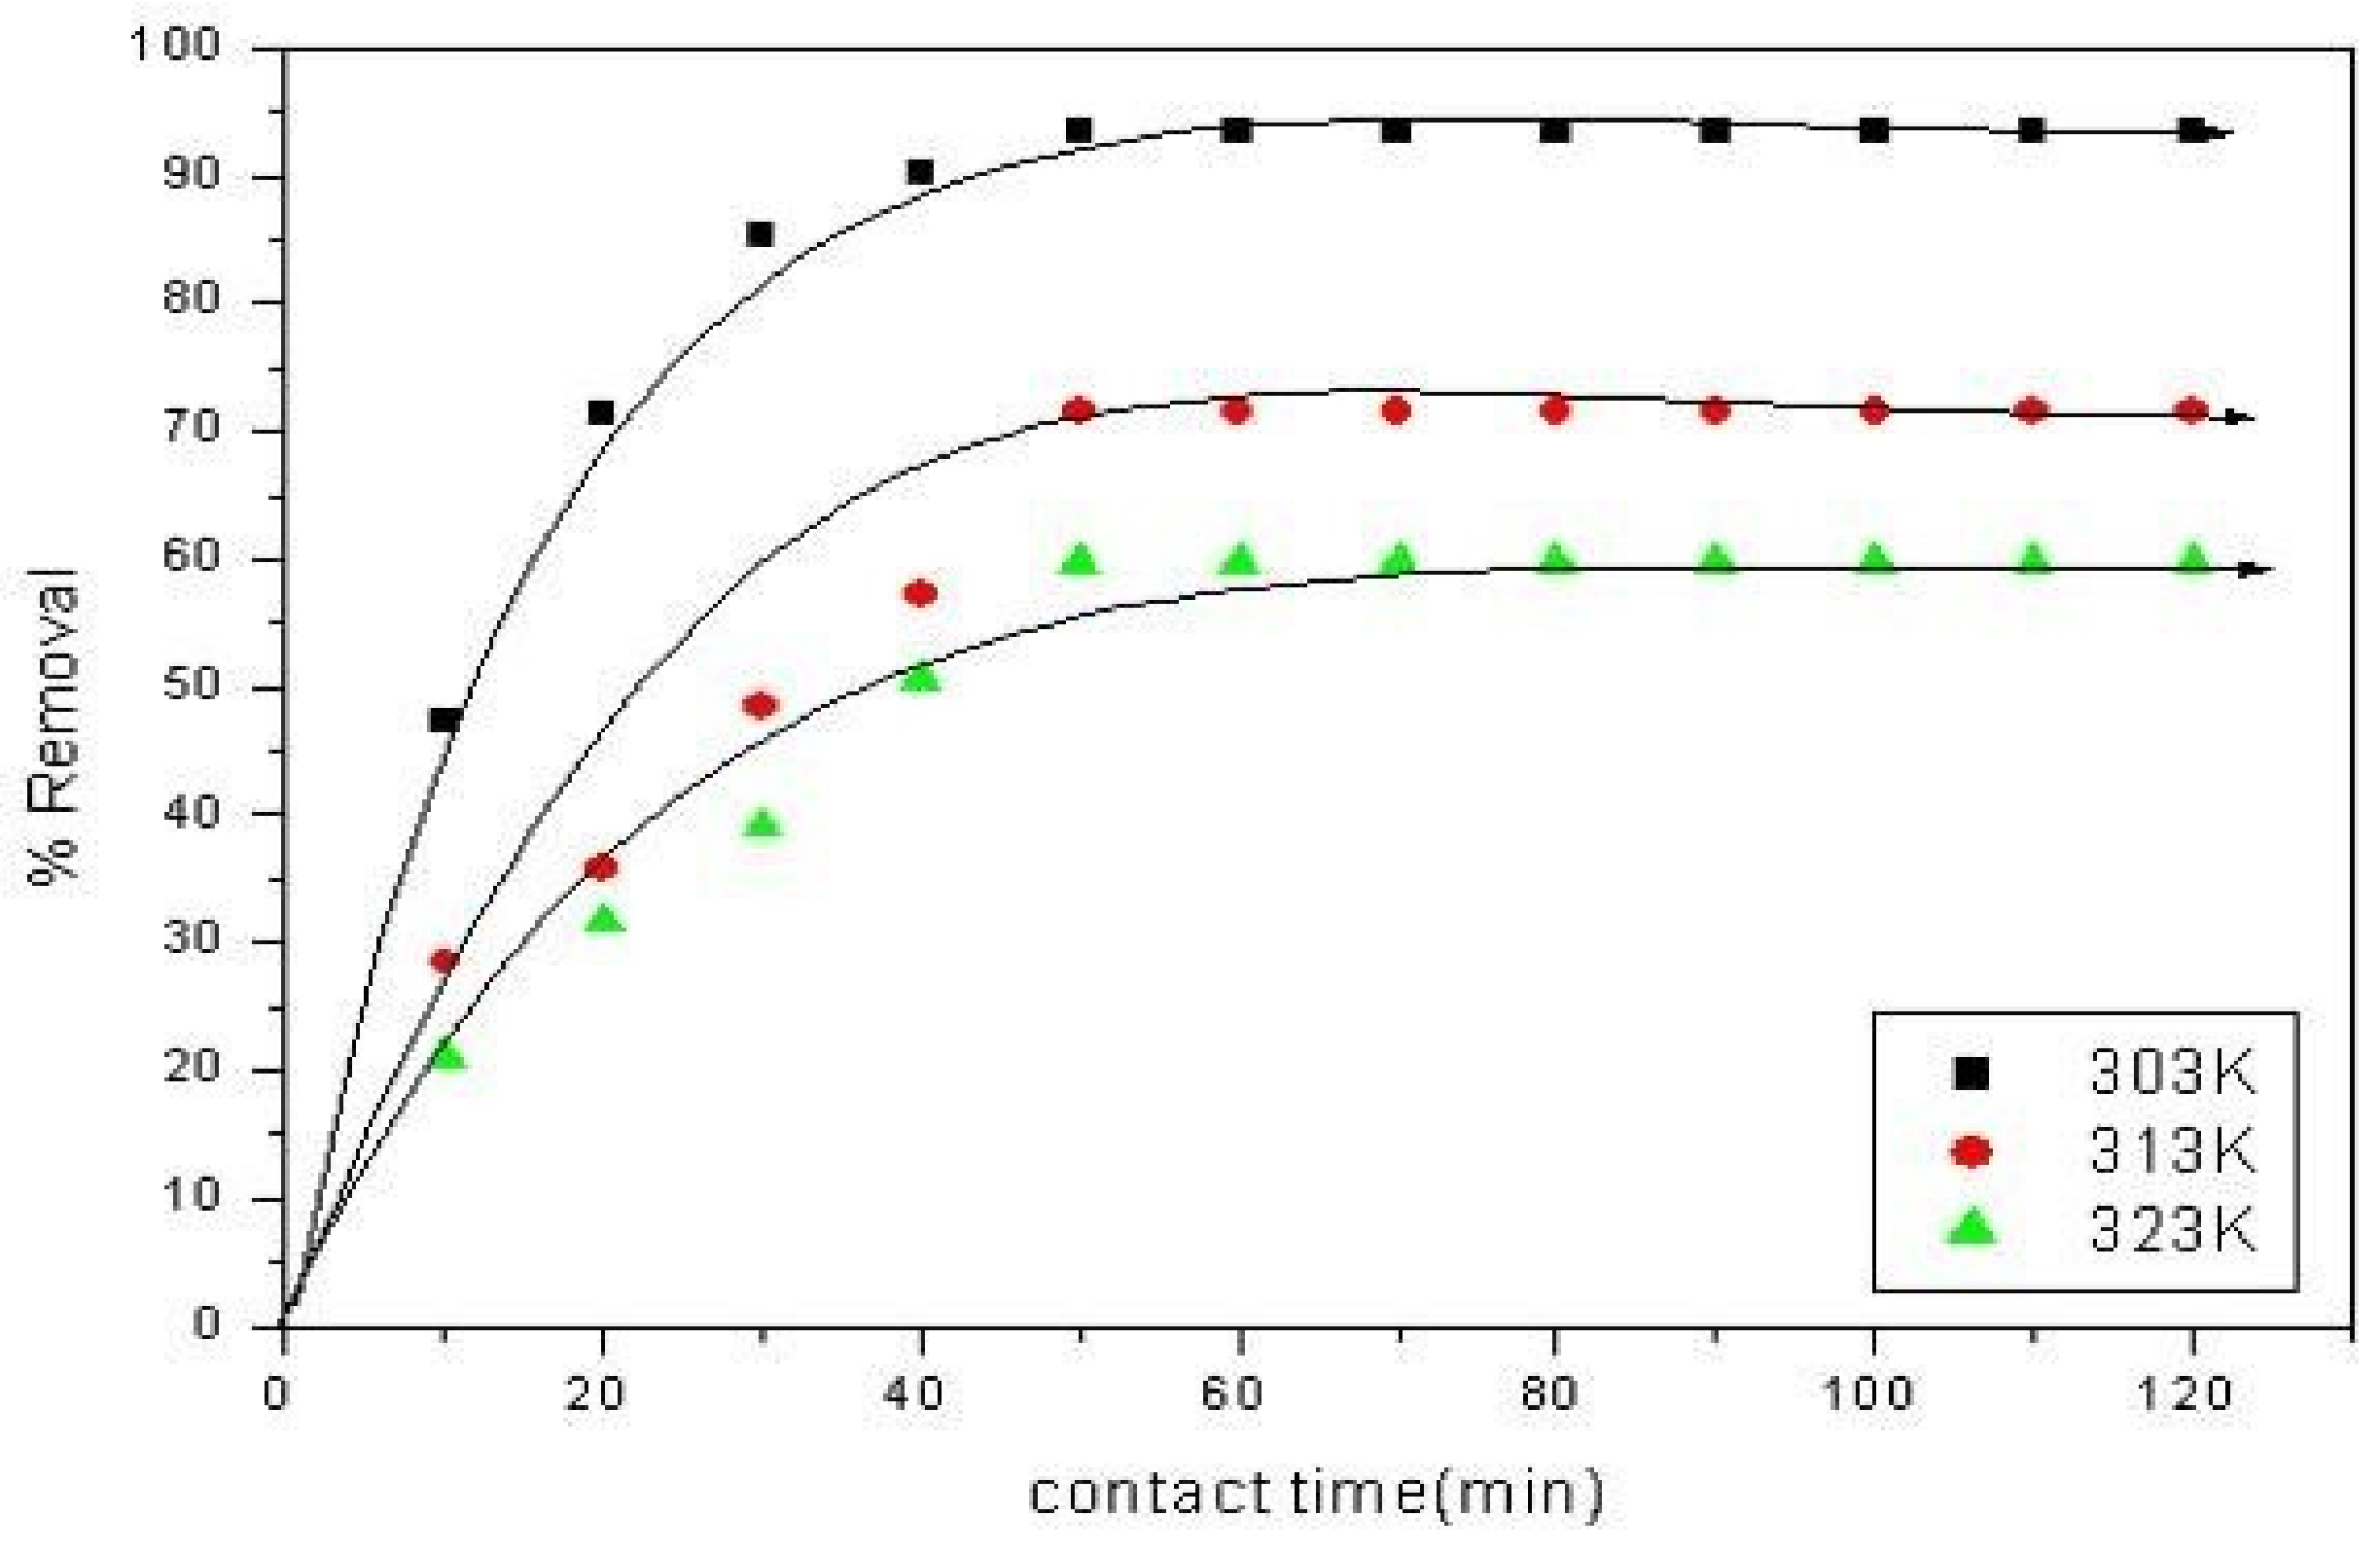
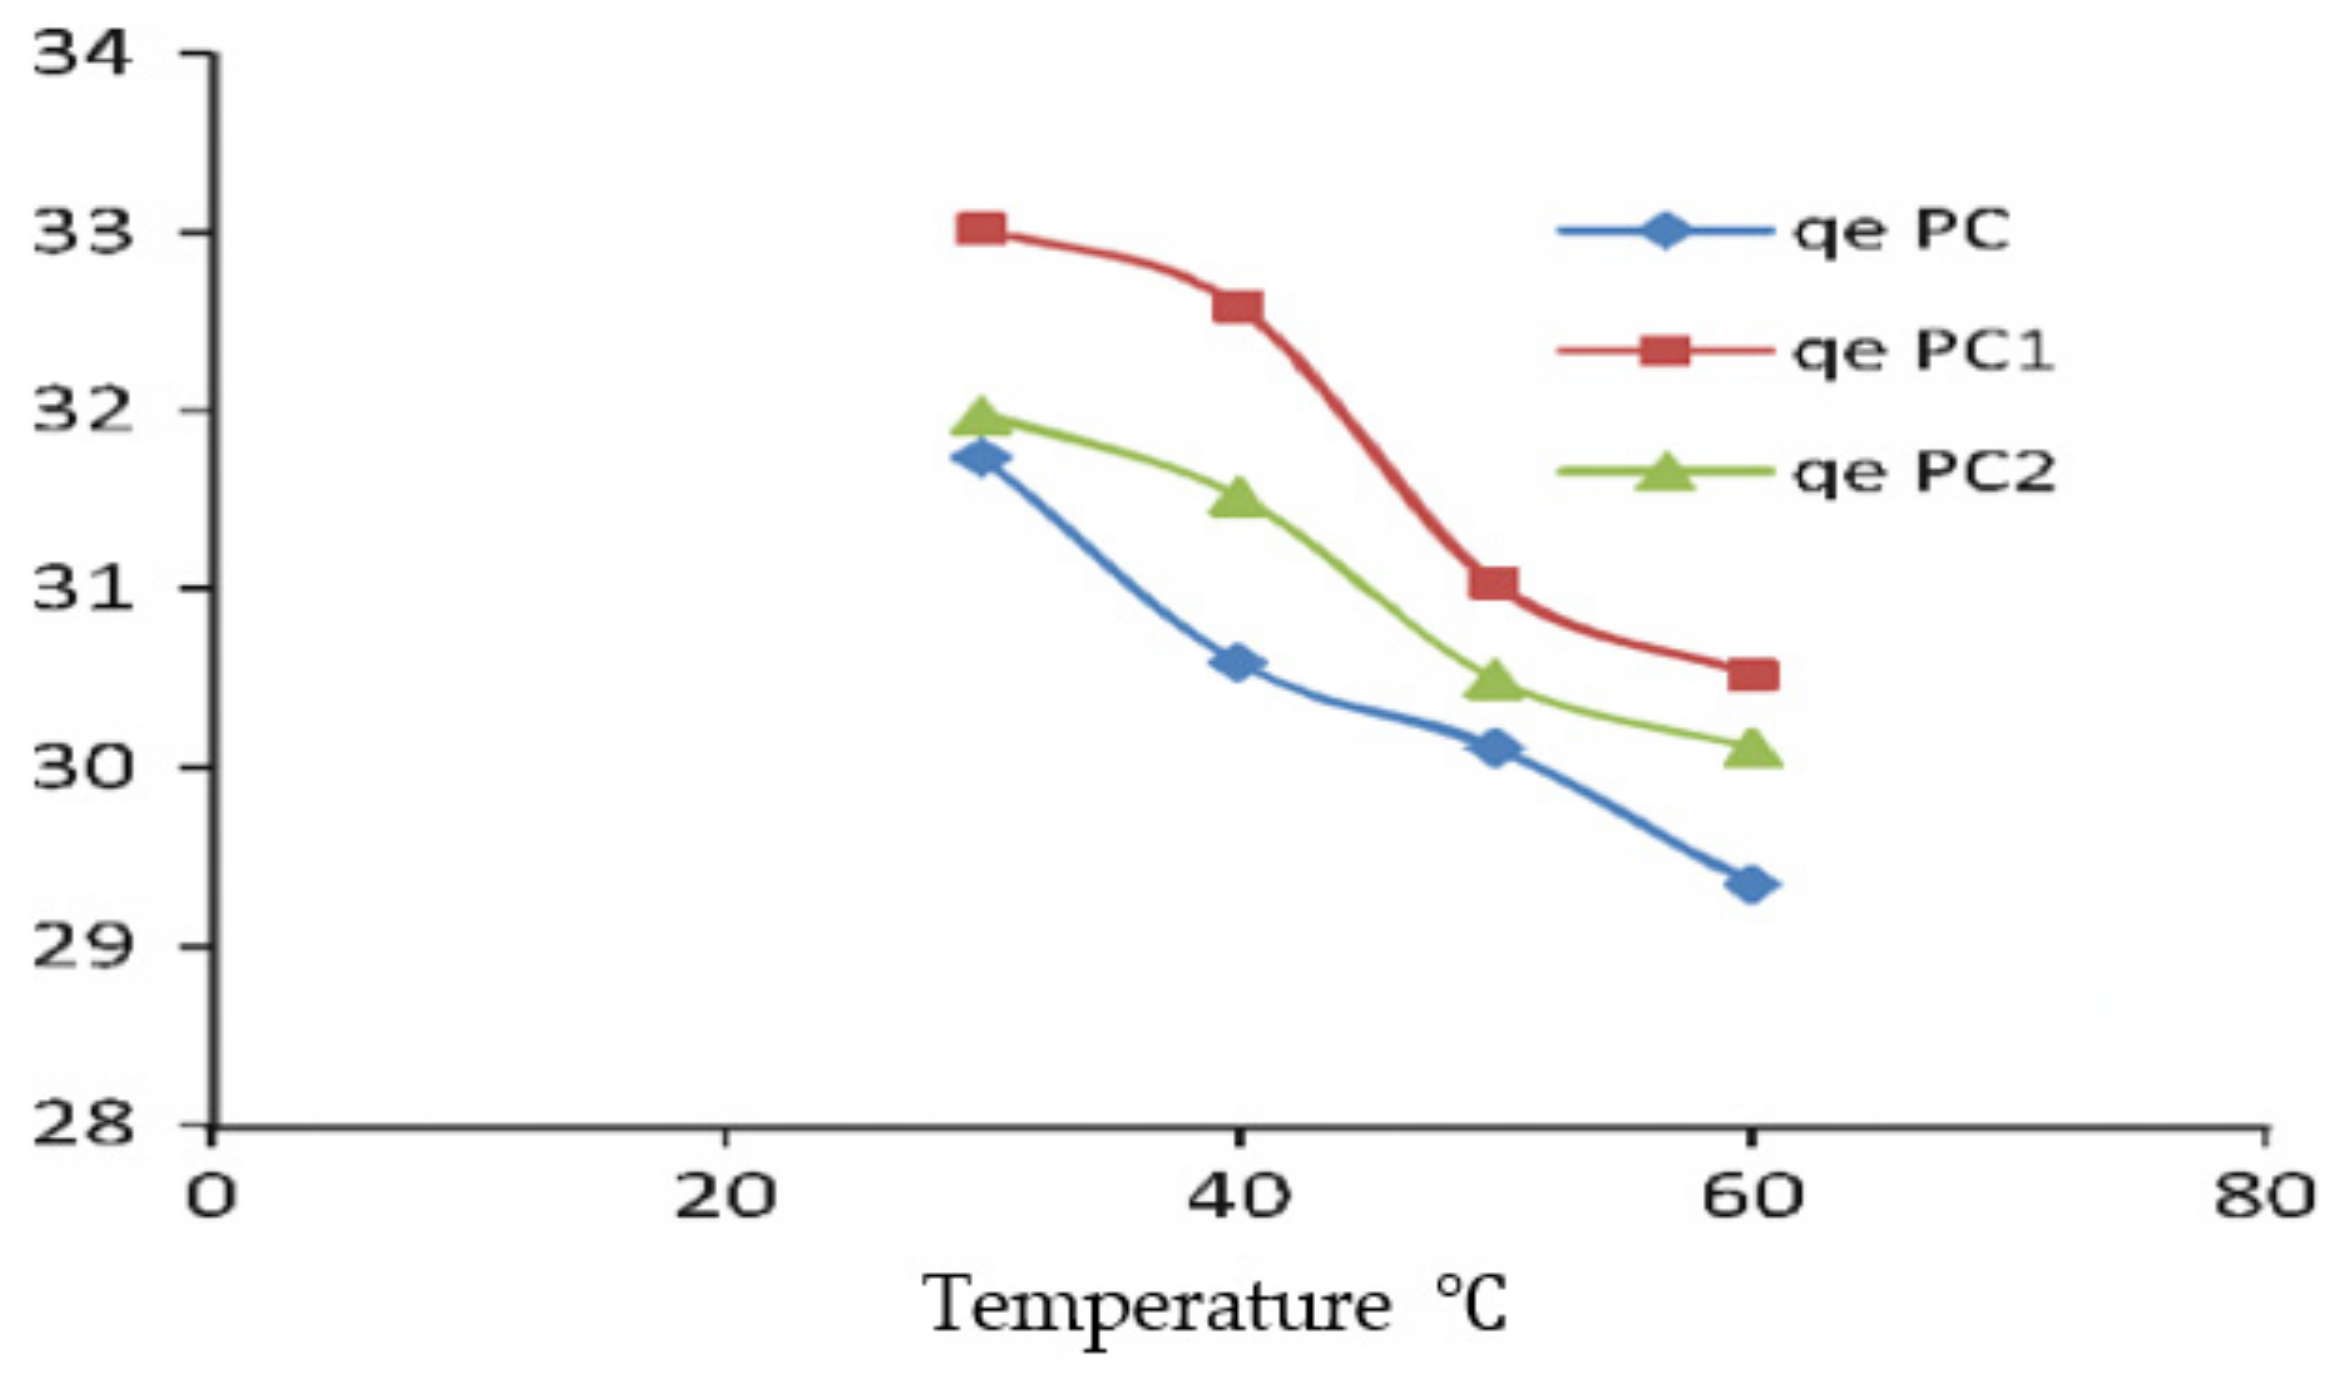
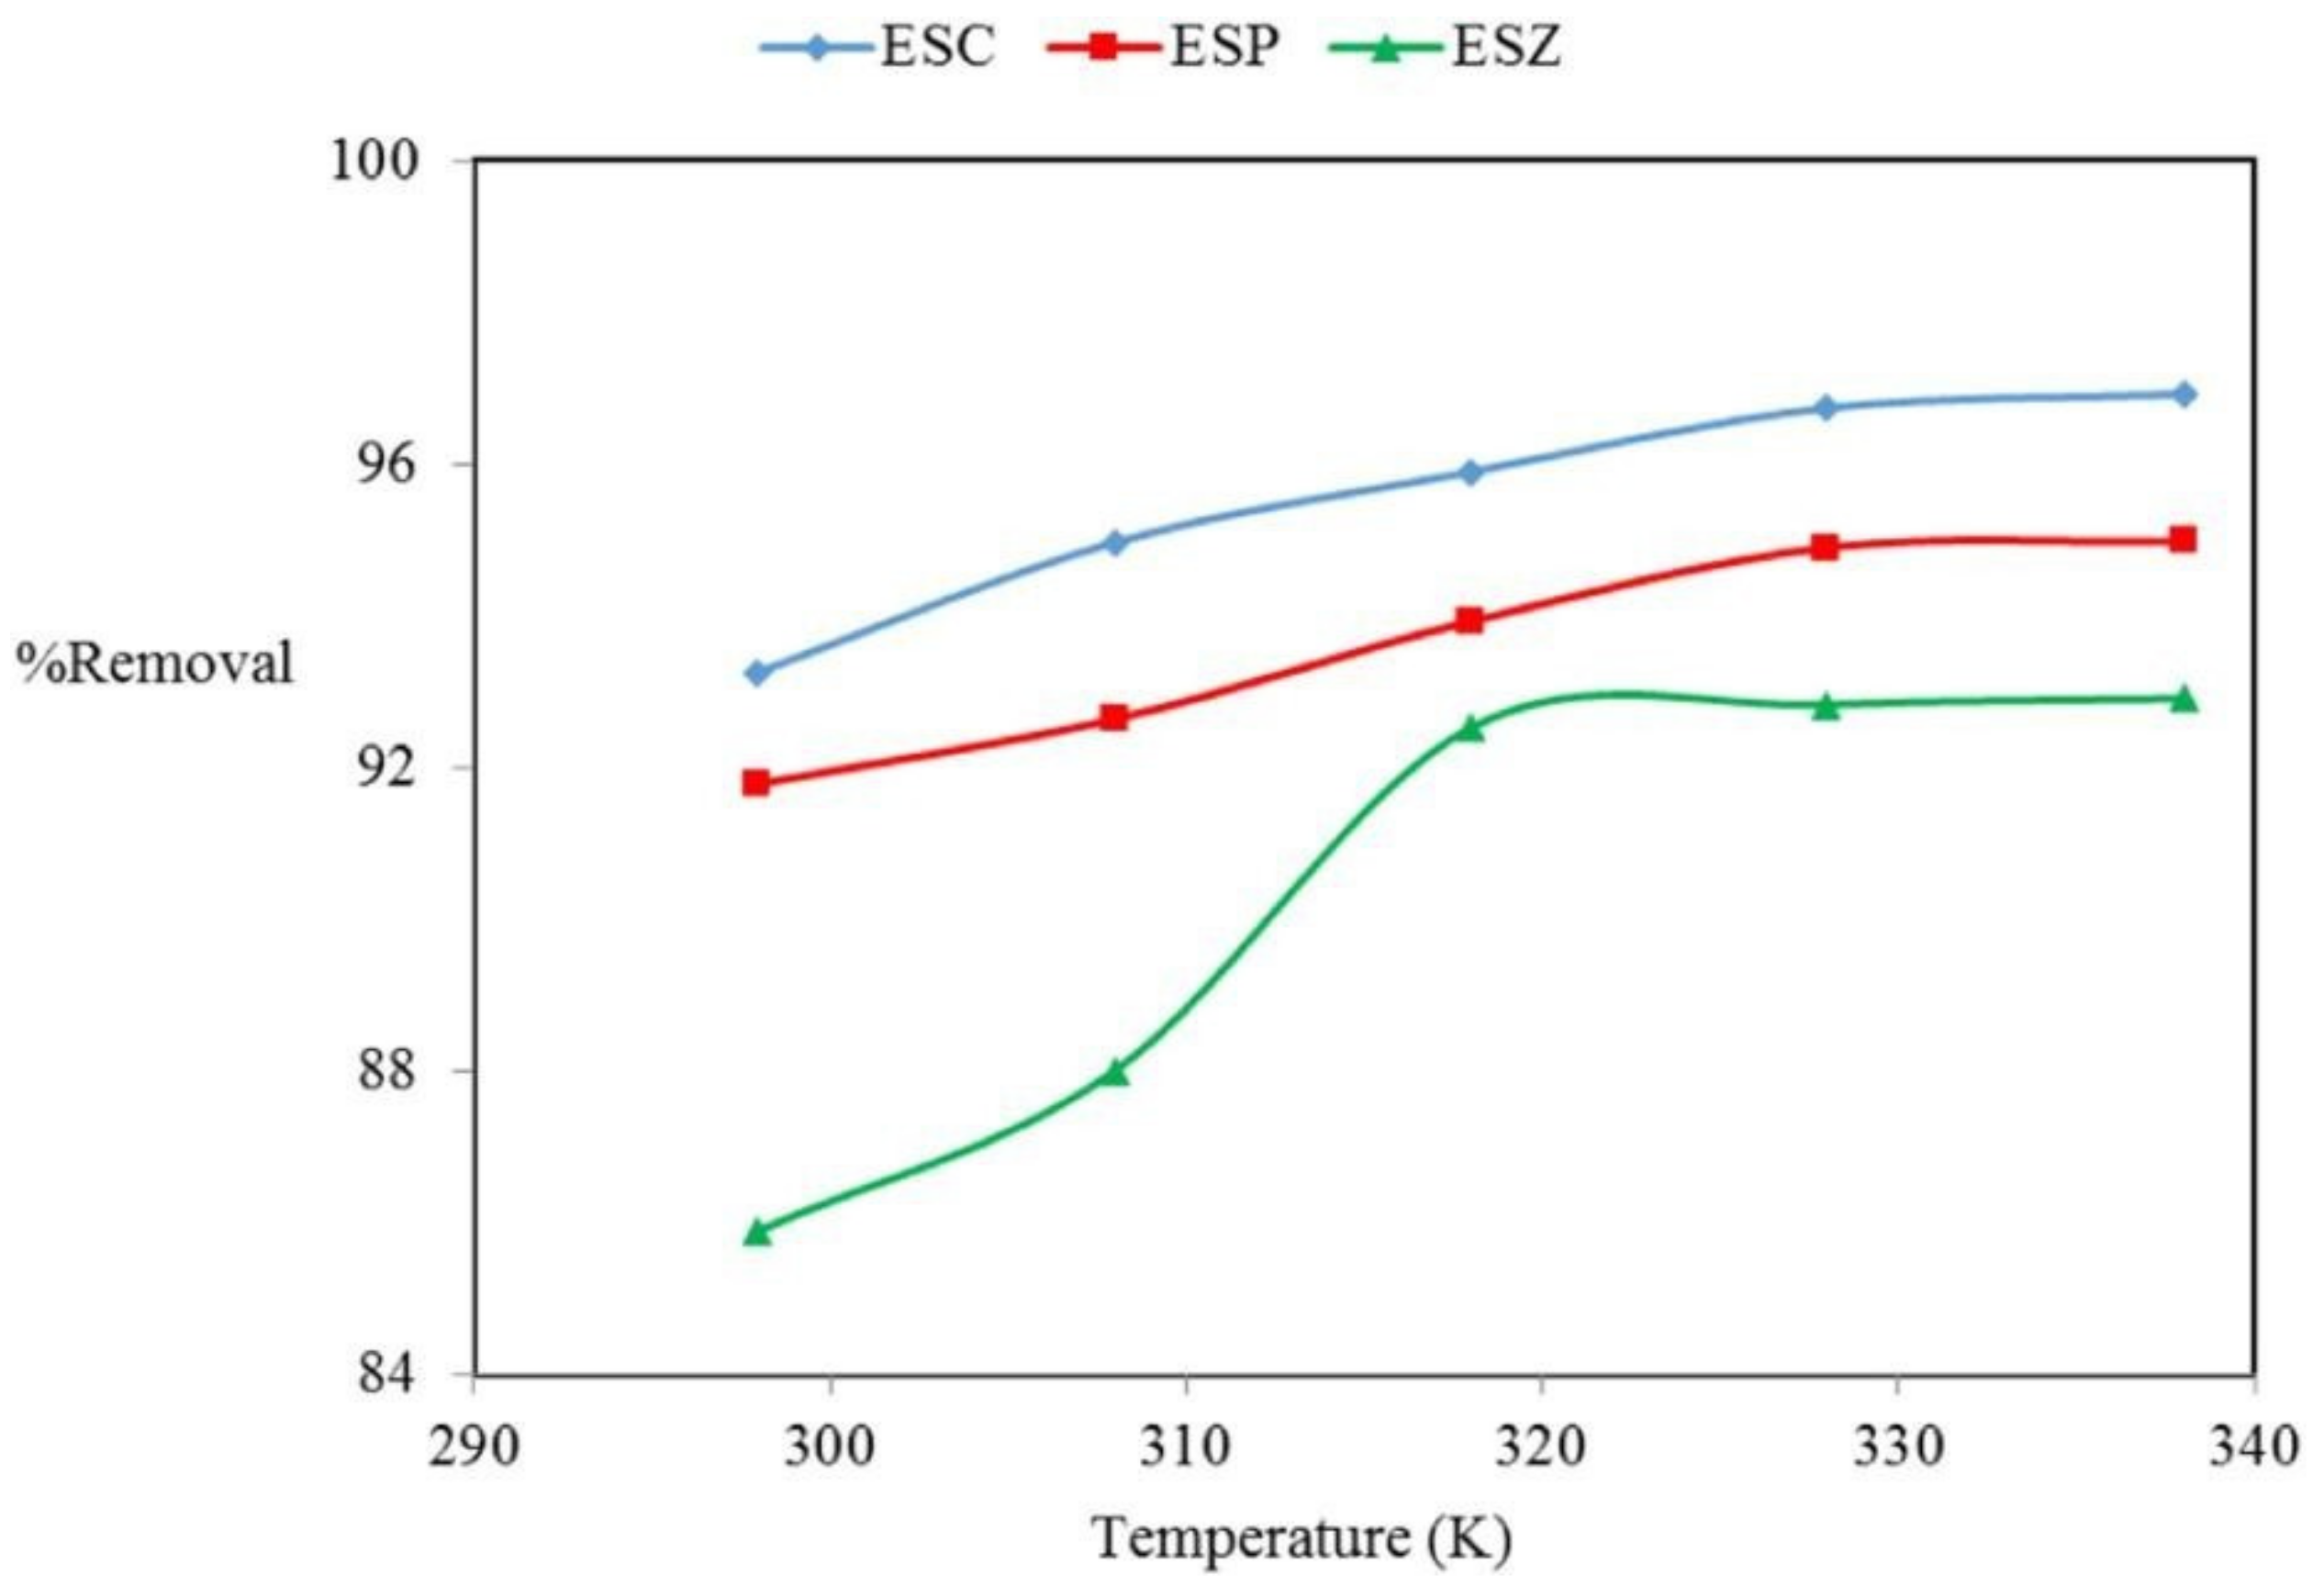
7. Temperature Analysis
8. pH
9. Adsorbent Dosage
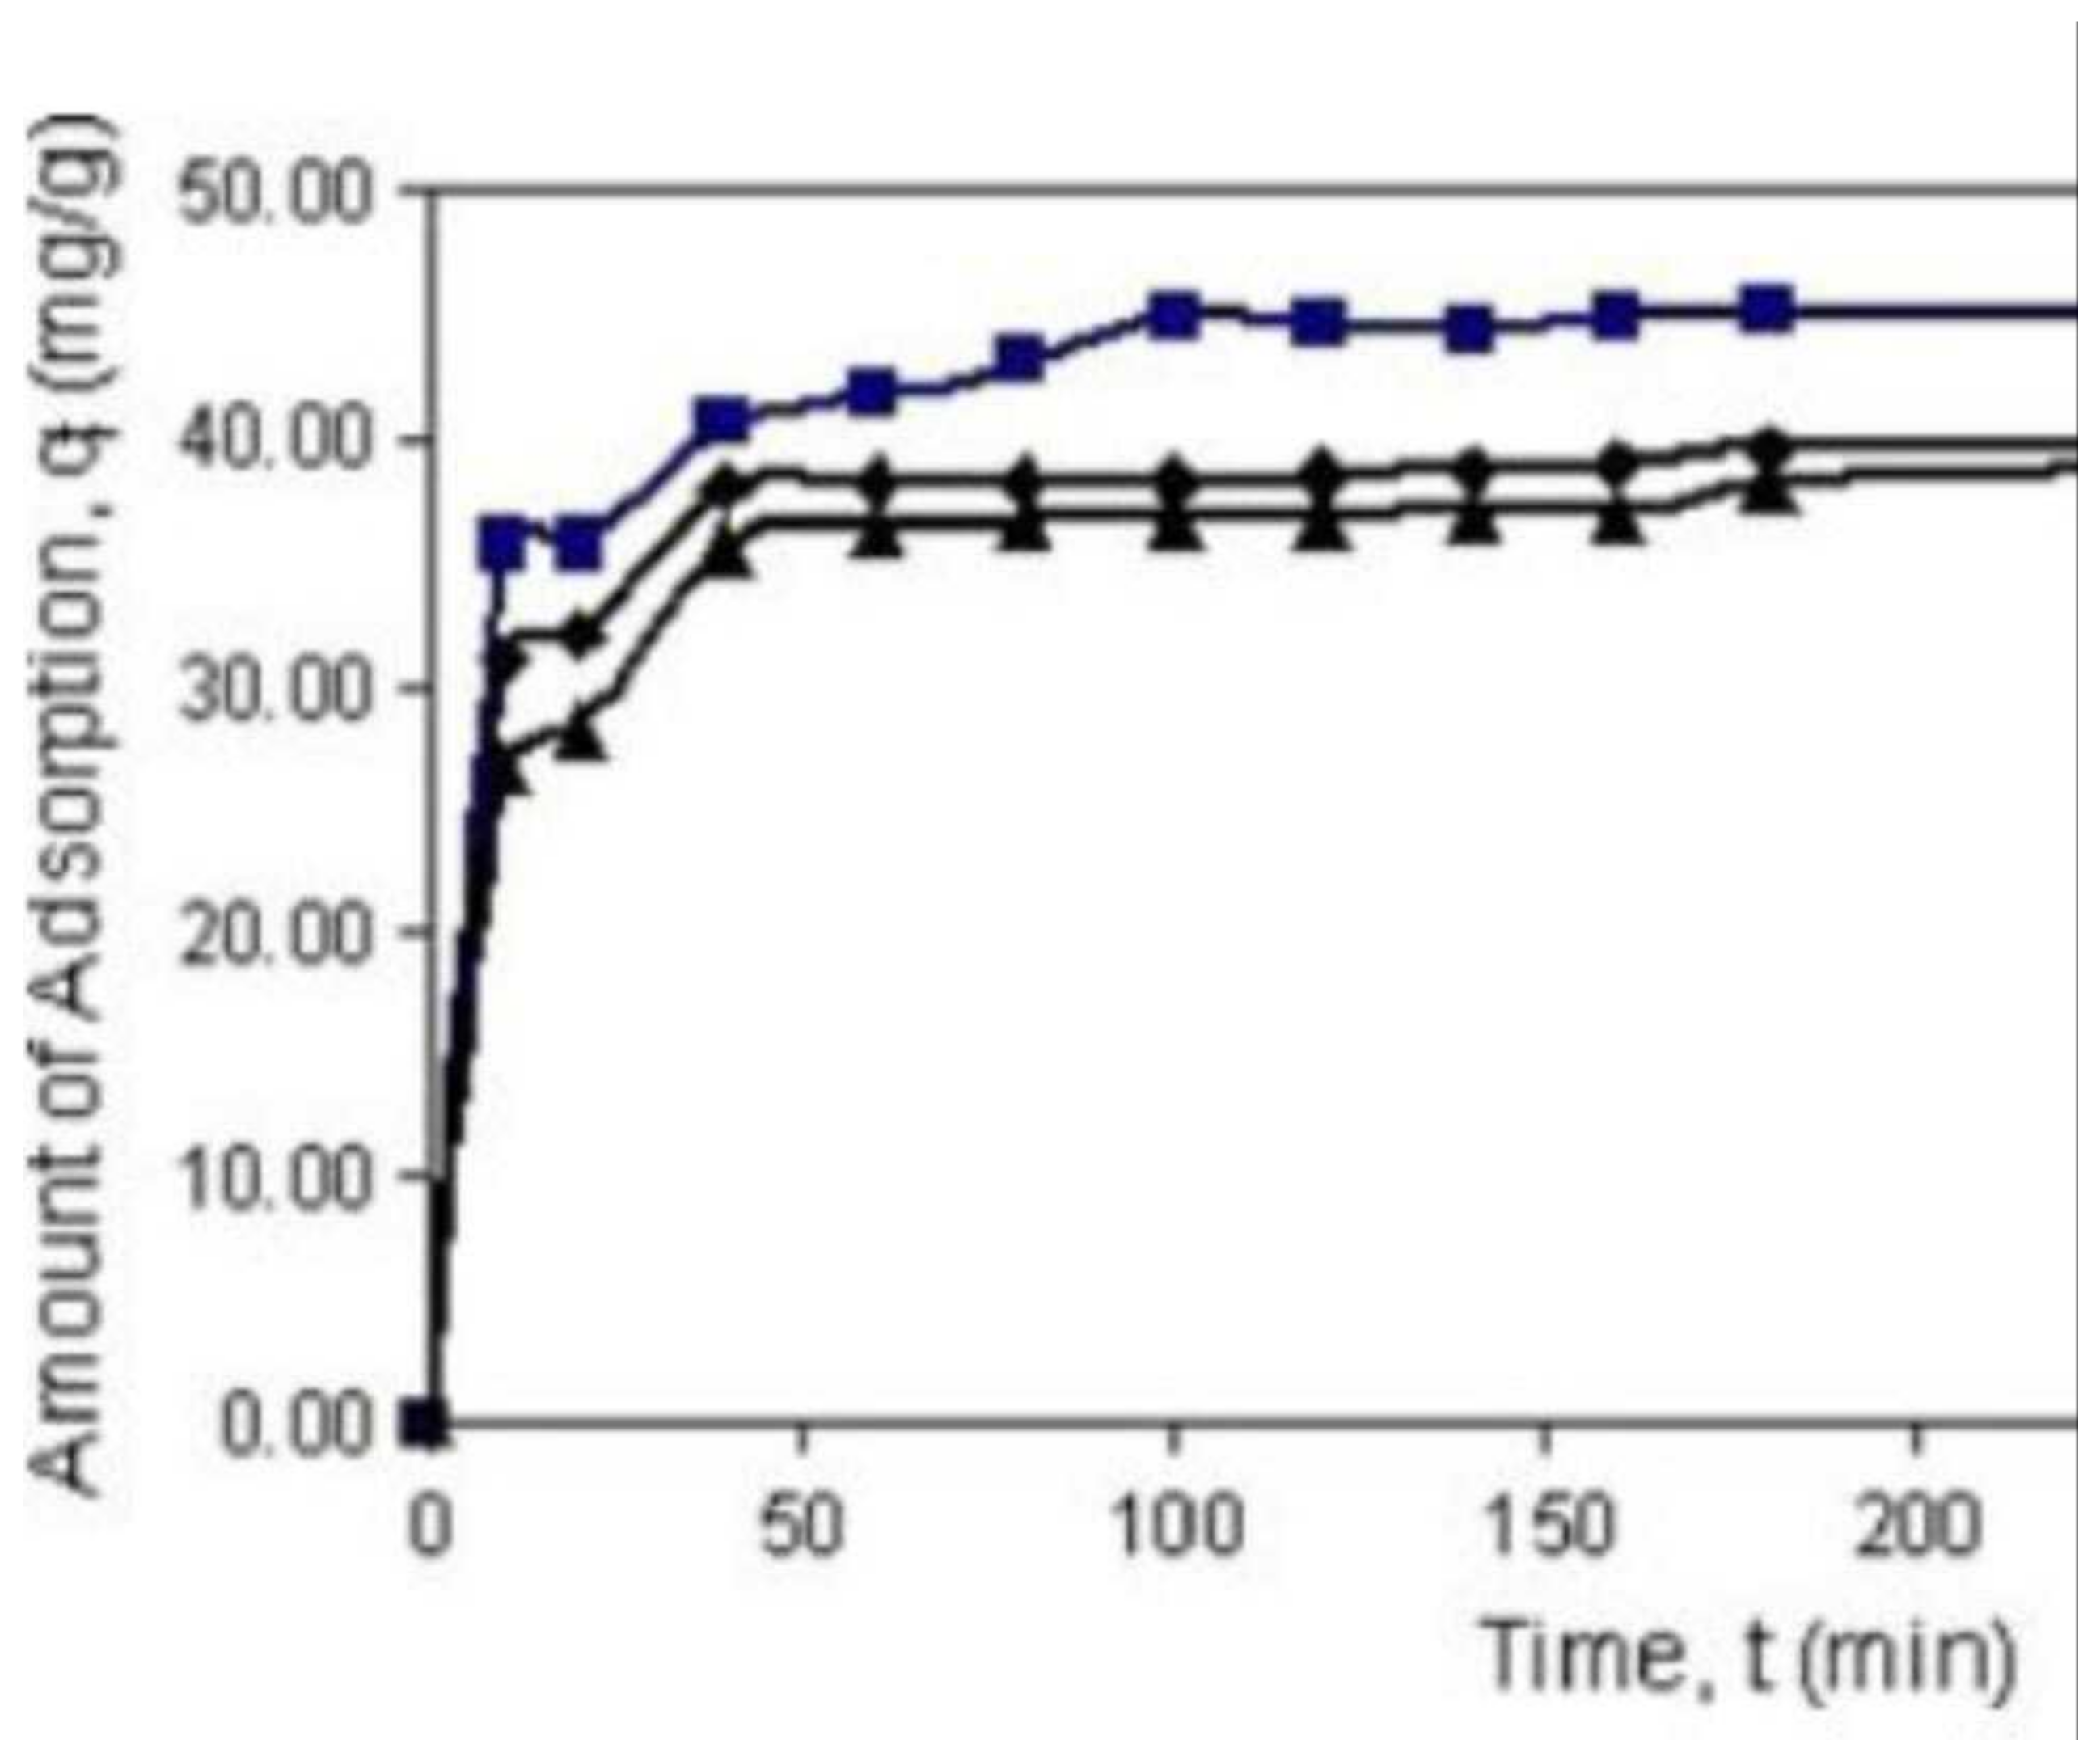
10. Initial Dye Concentration and Contact Time
11. BET Surface Area
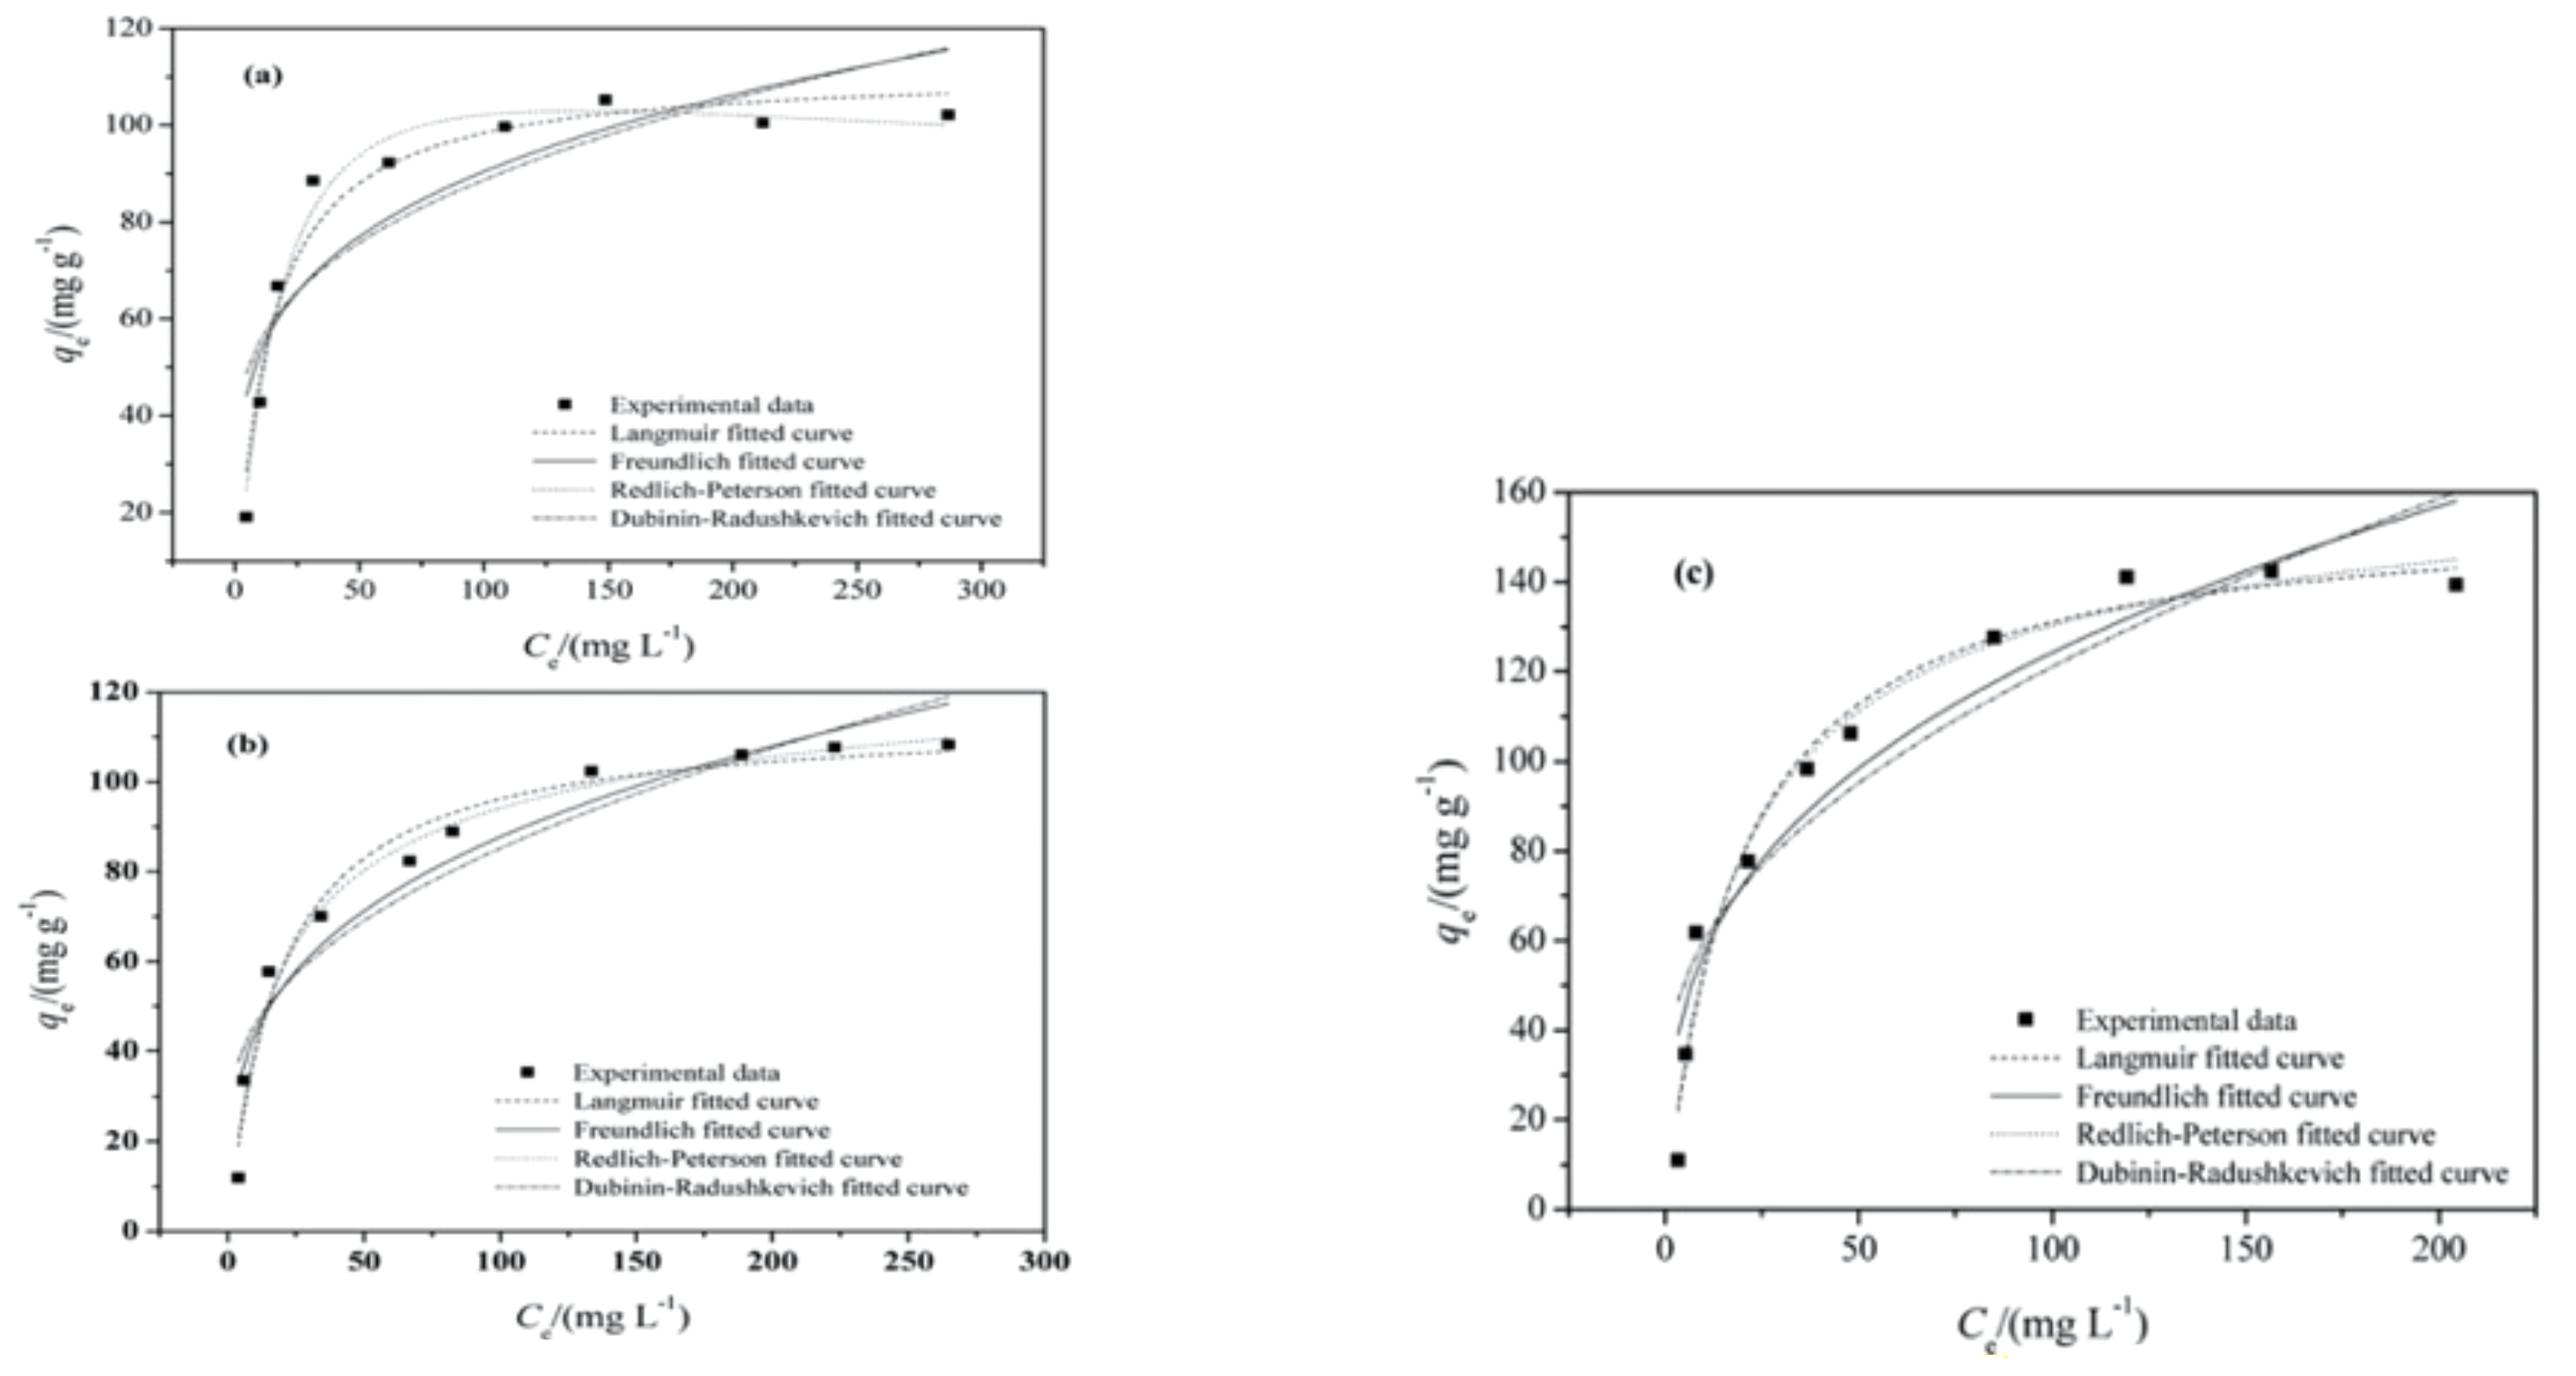
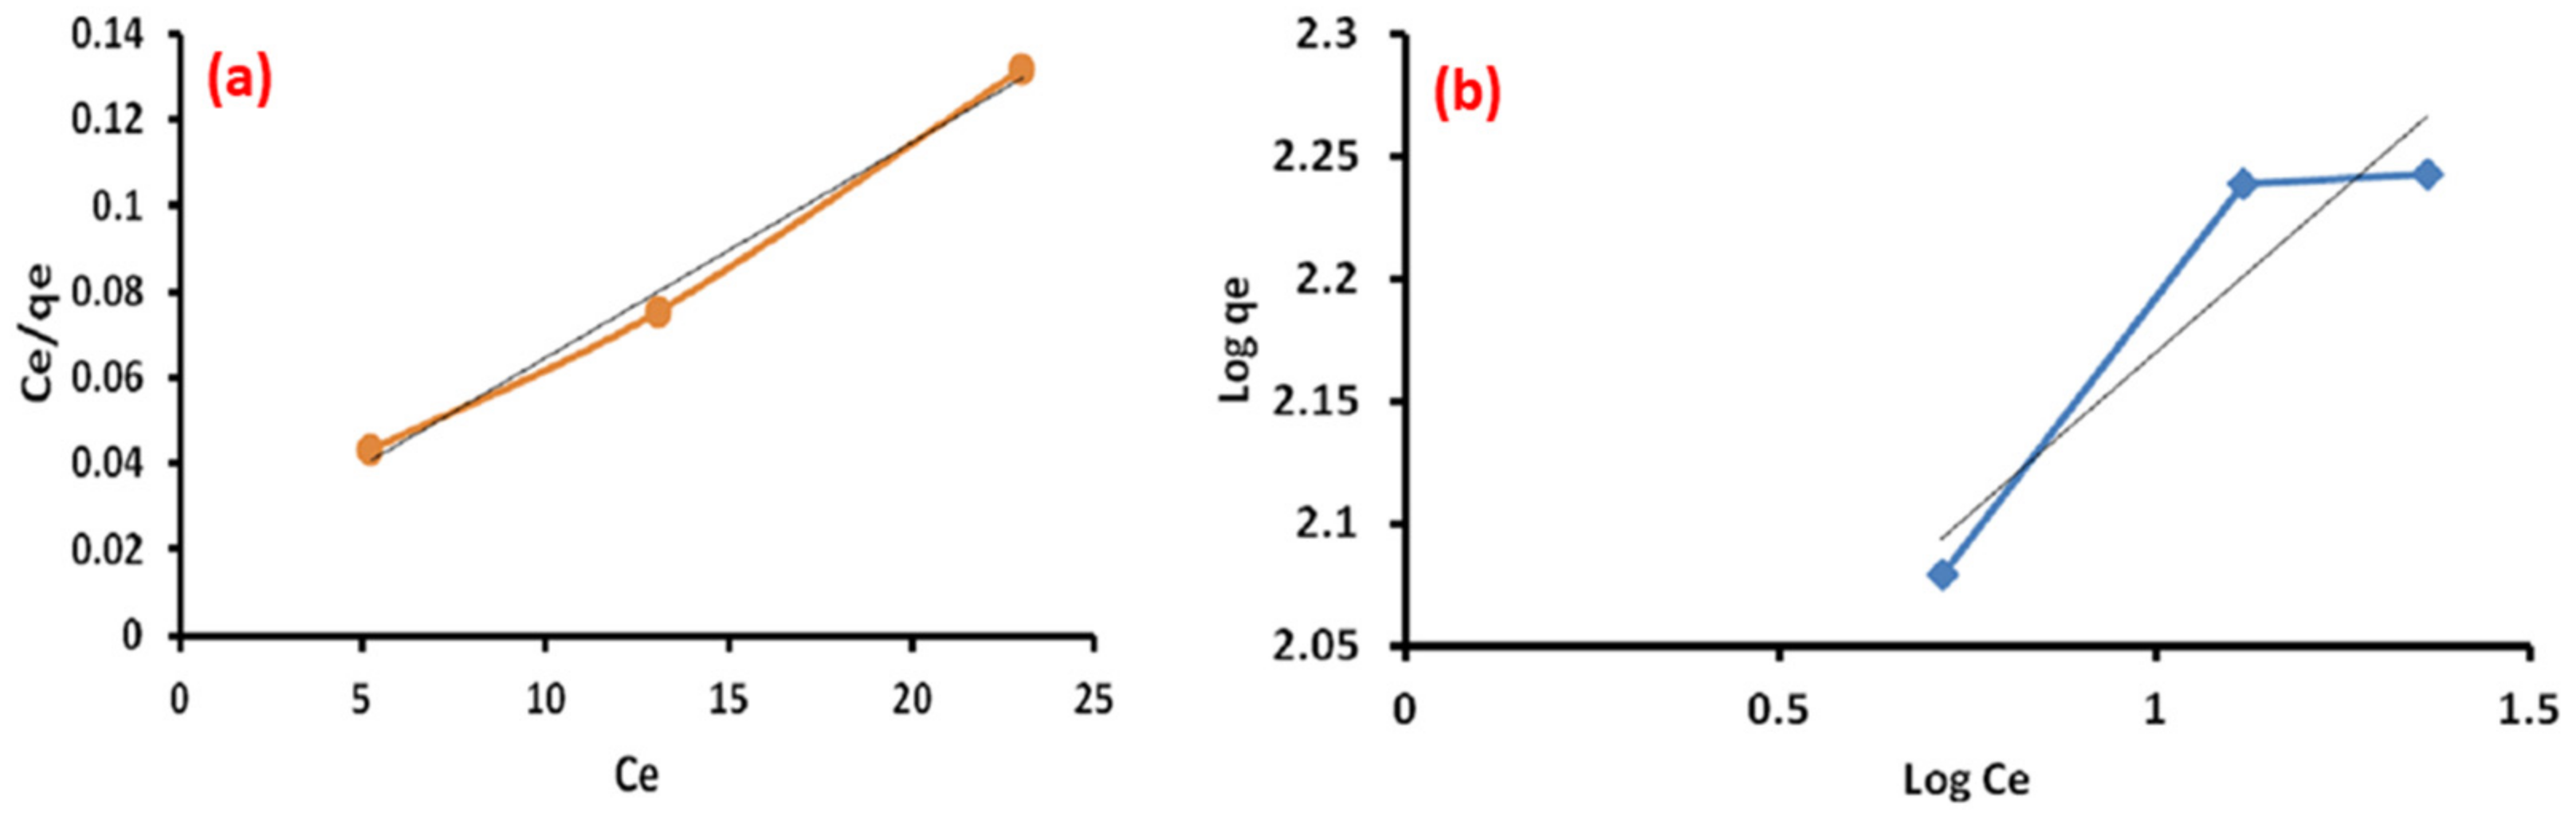
12. Adsorption Isotherm
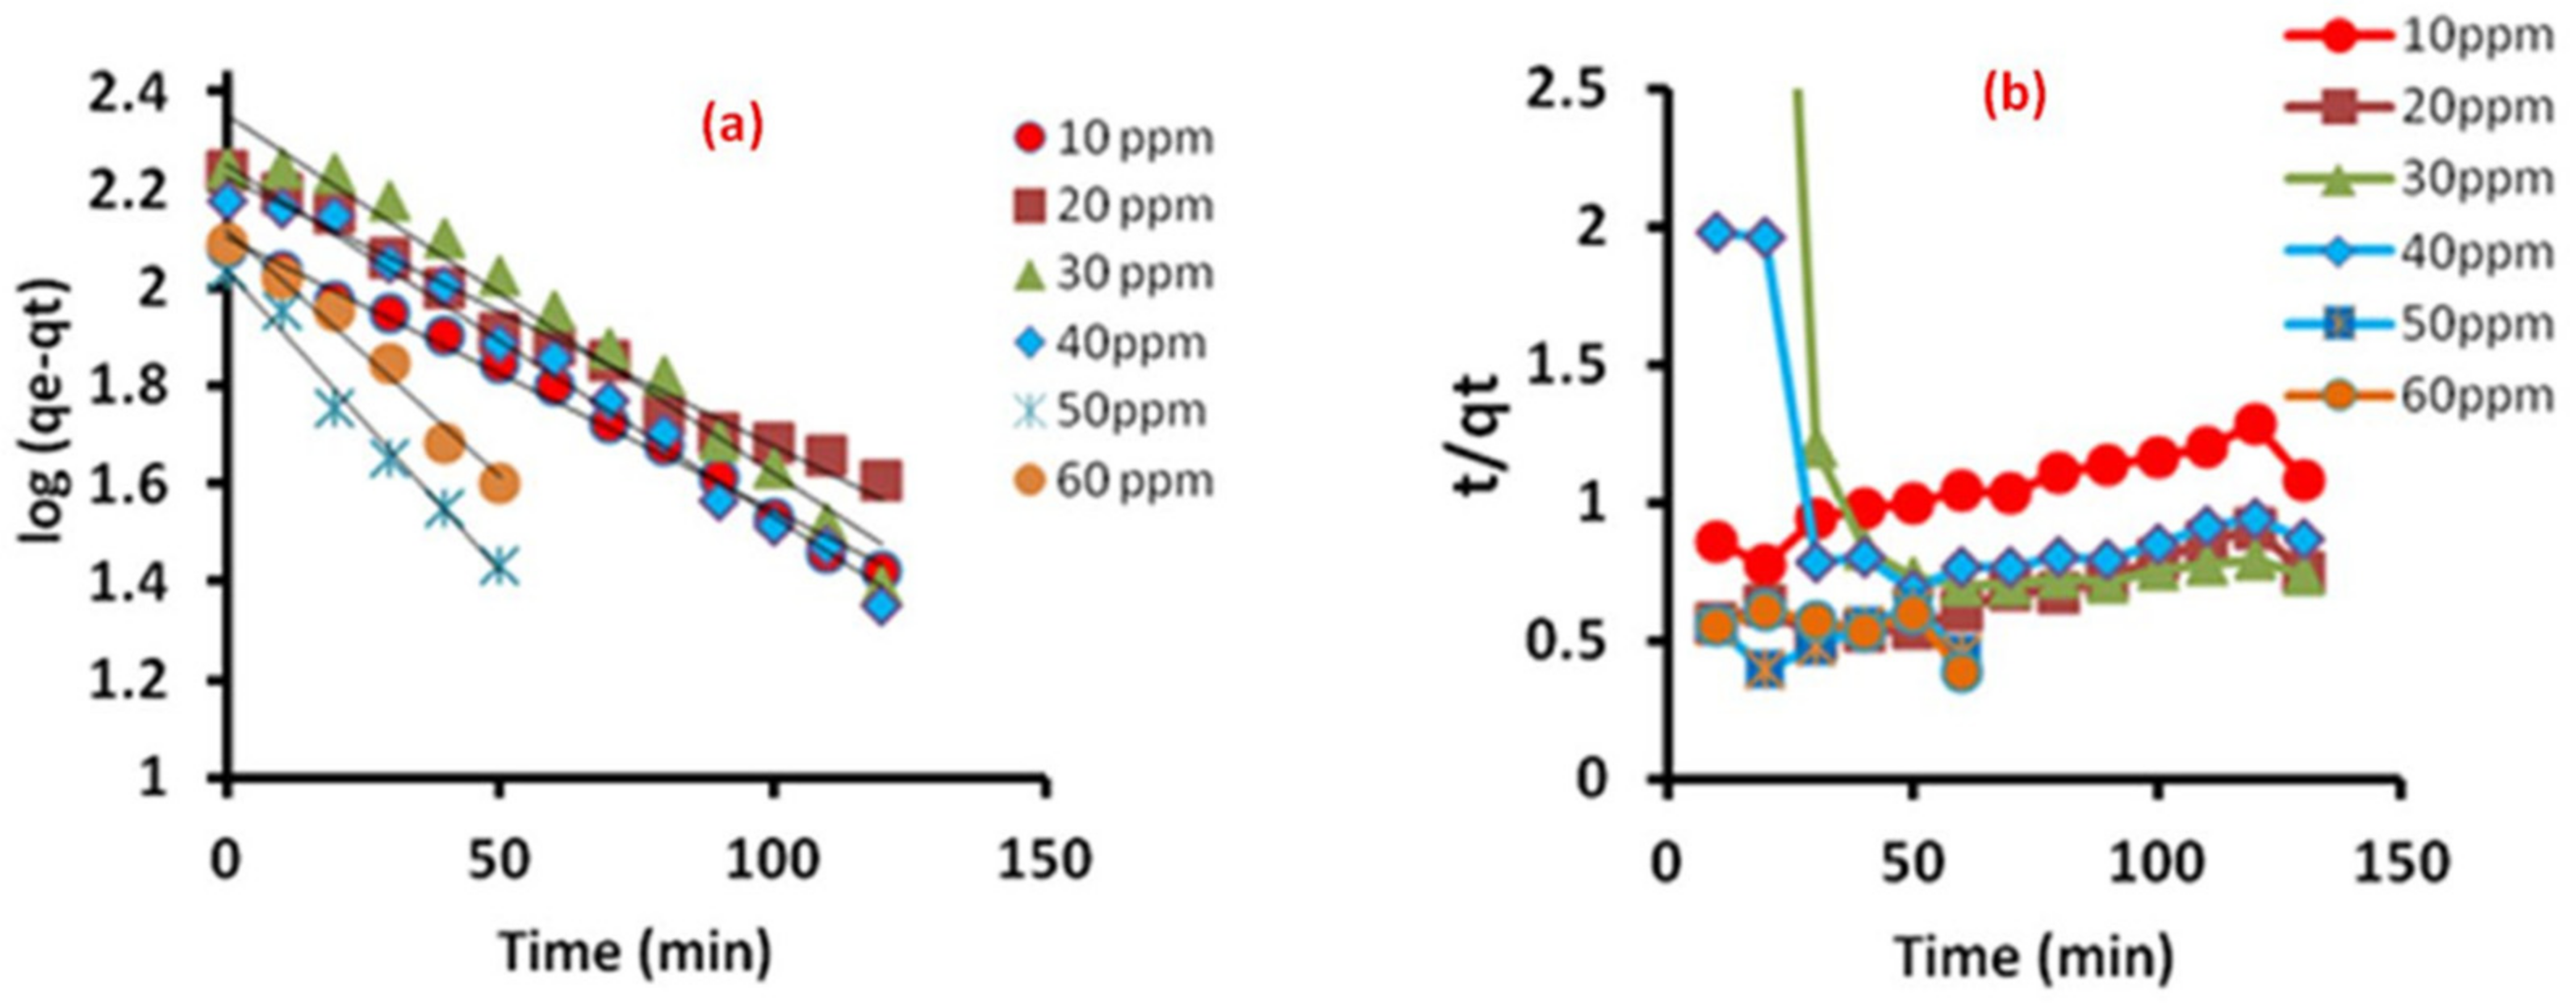
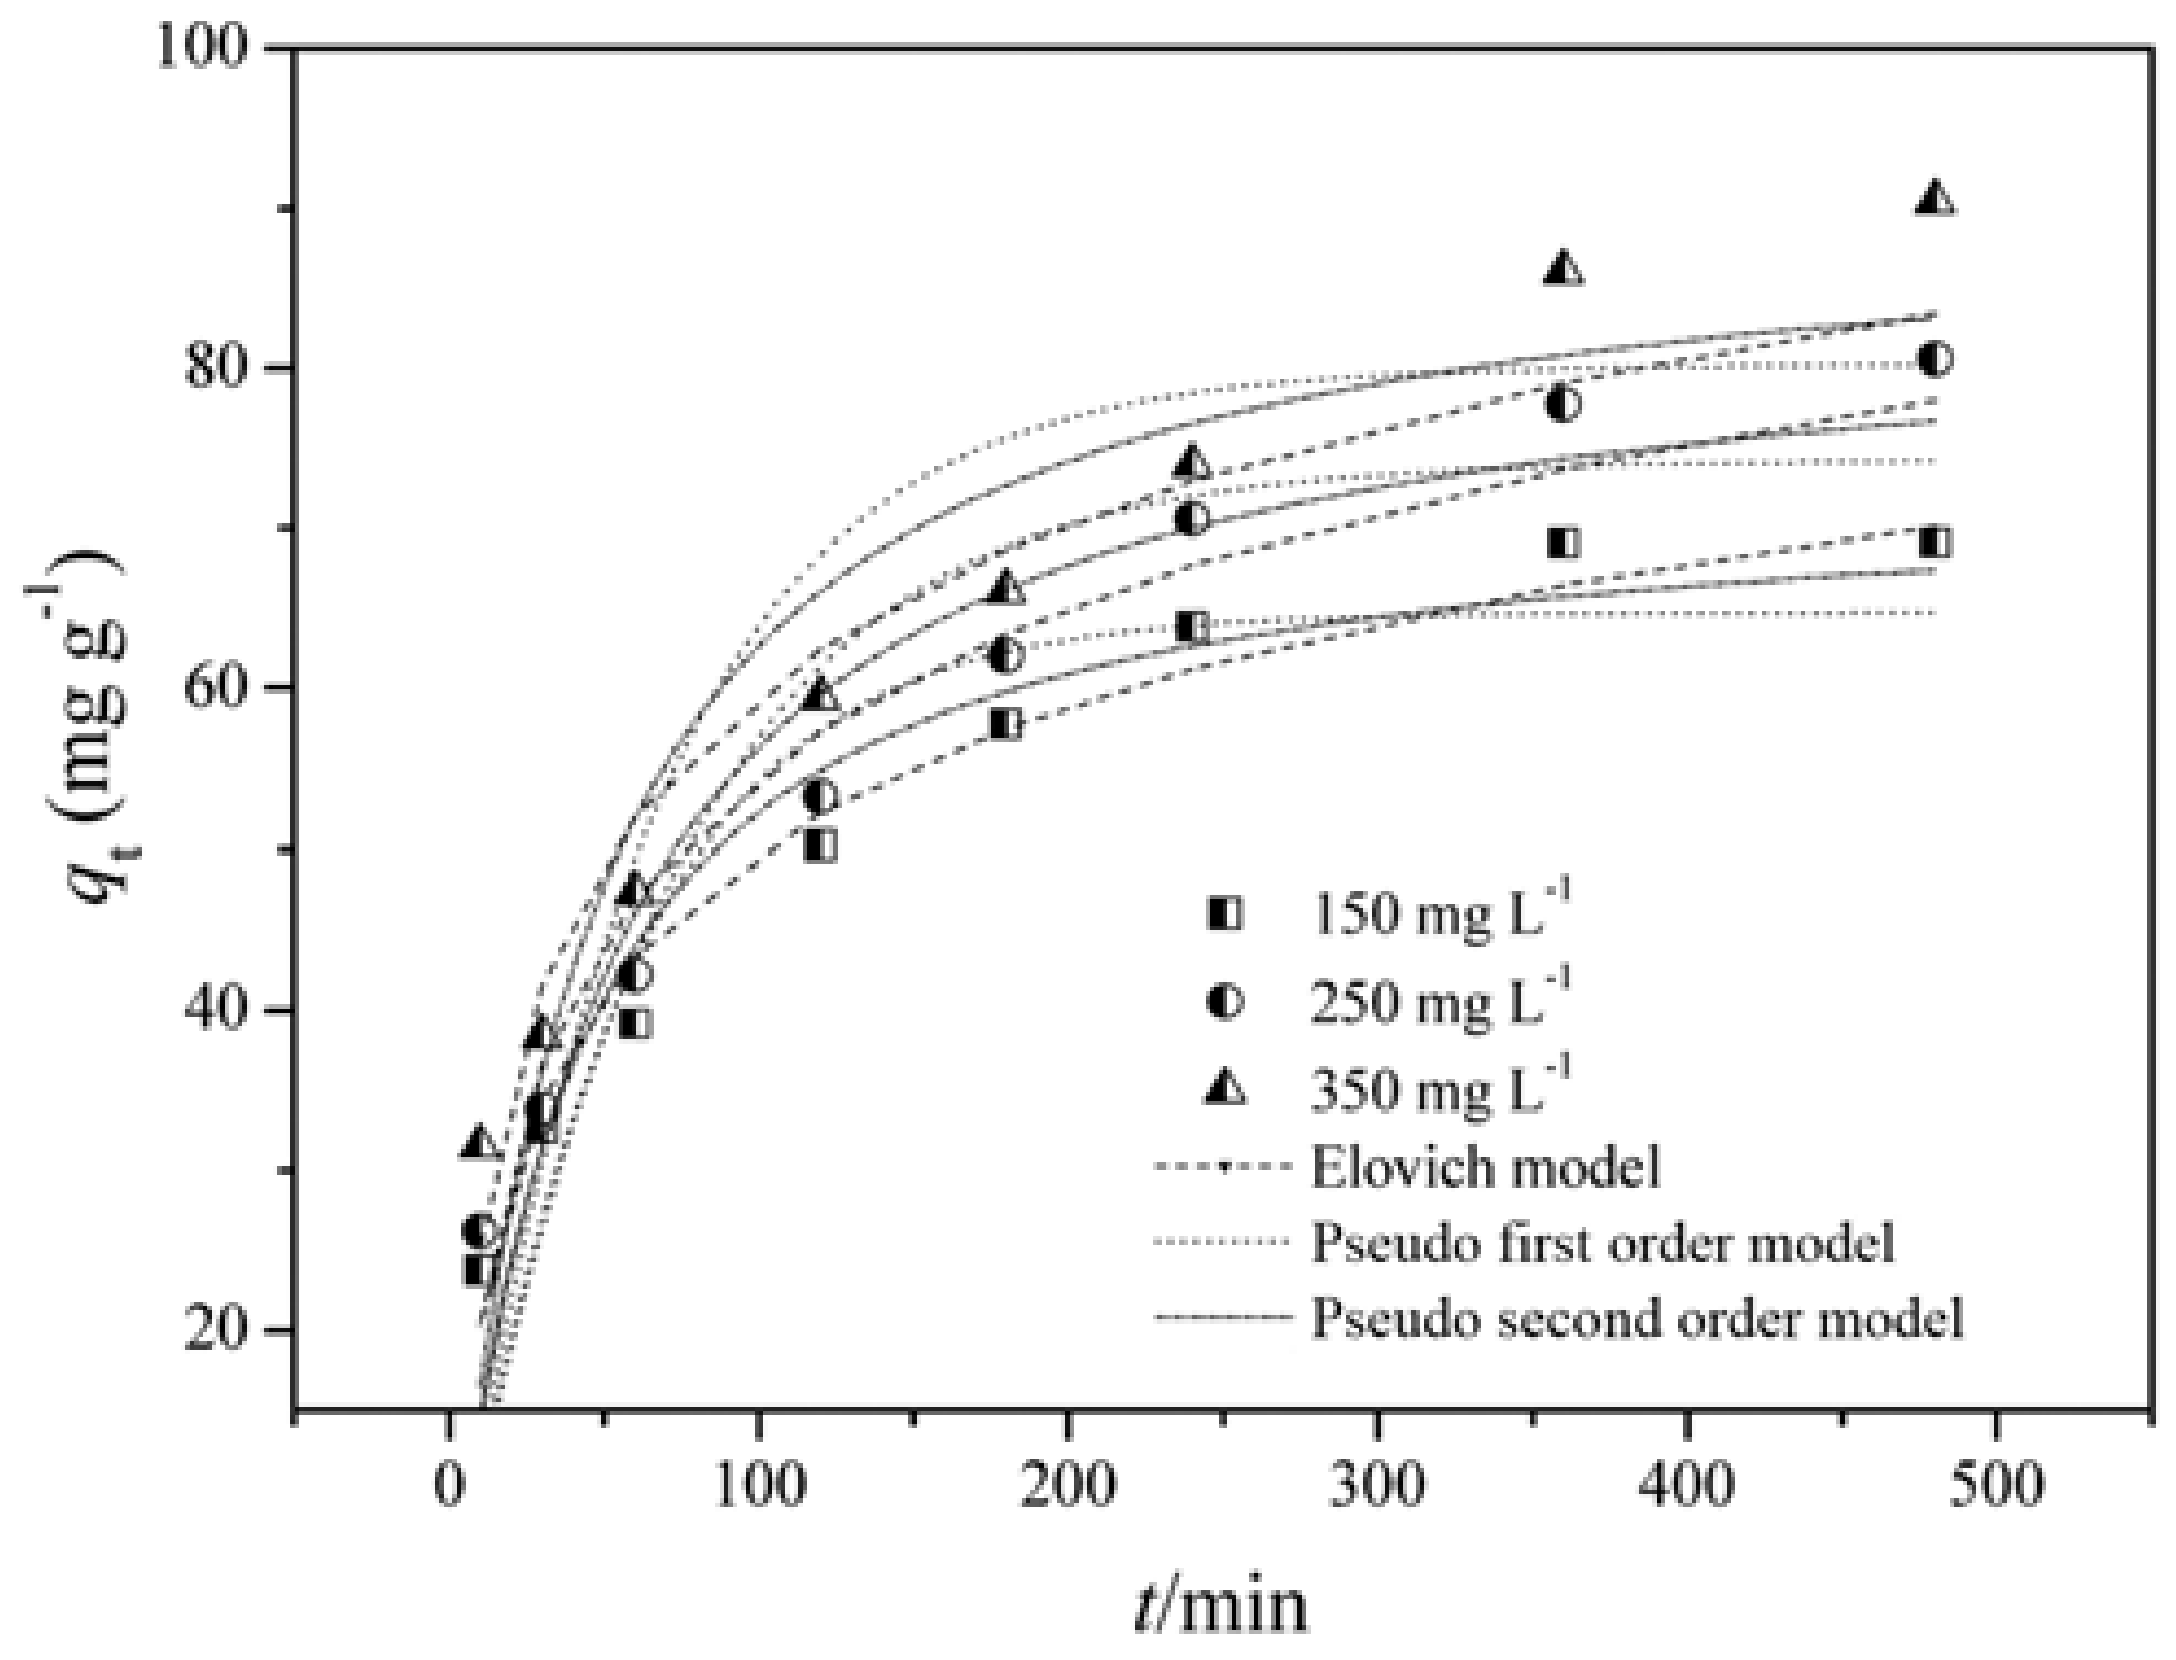
13. Kinetic Study
14. EDX
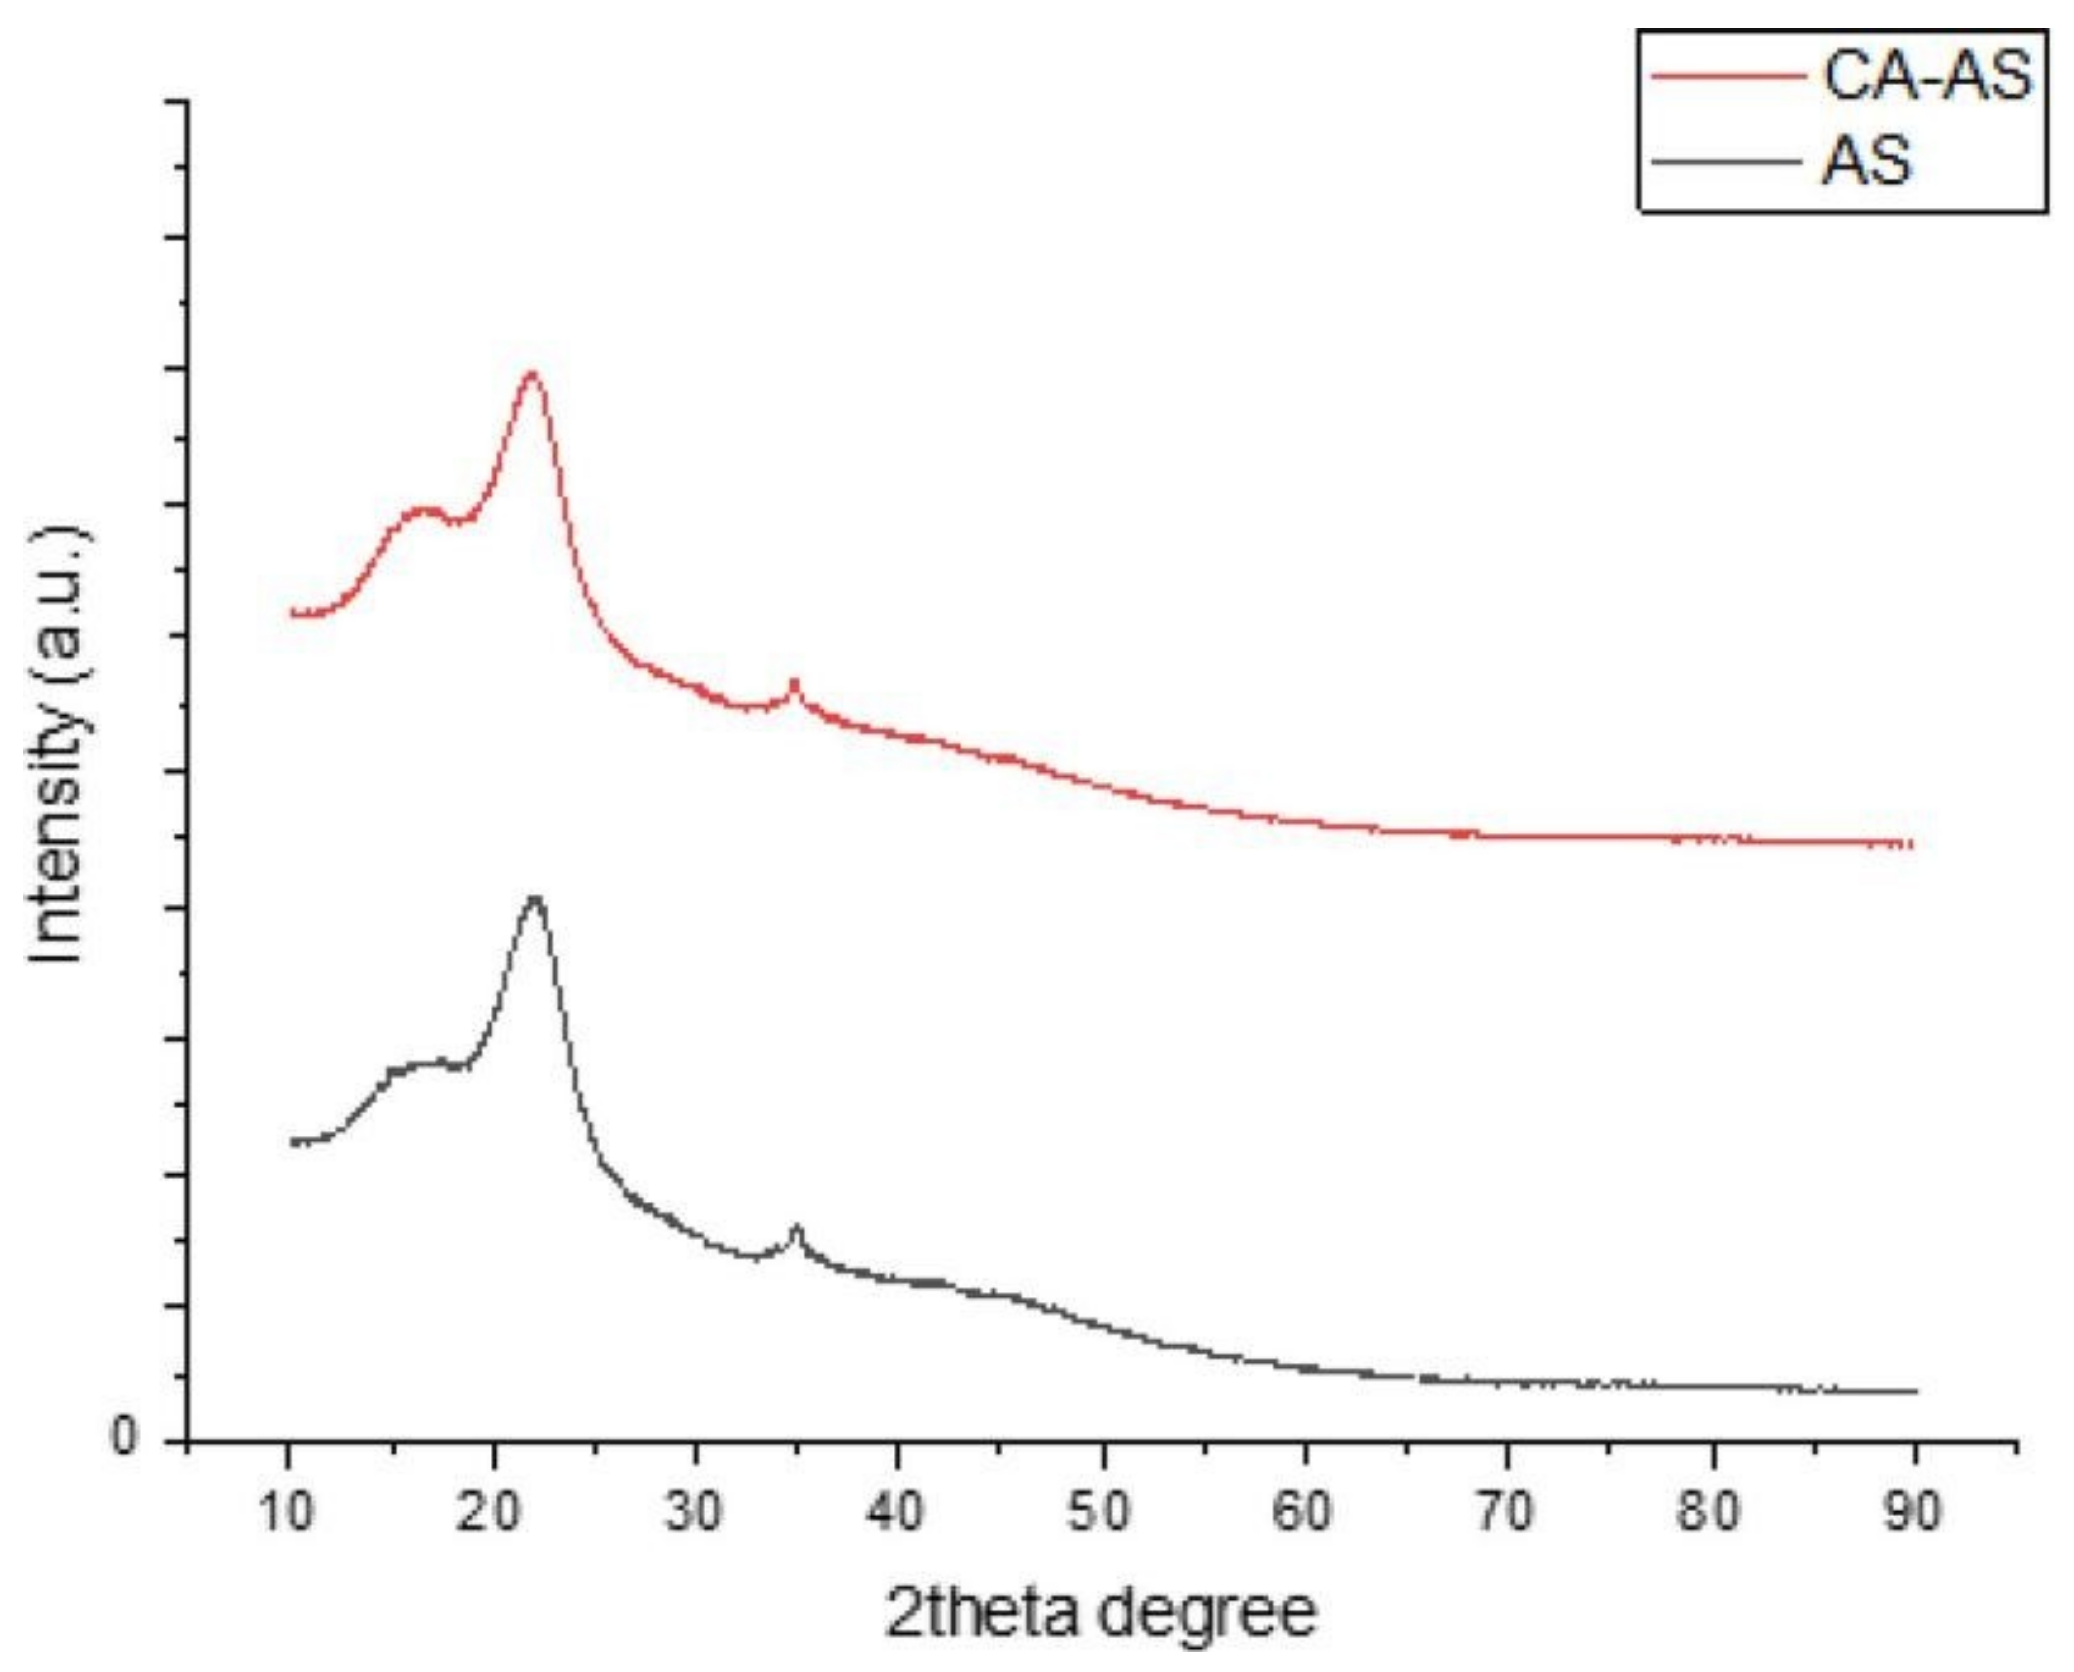
15. XRD
16. Mechanisms of Using Agriculture Products as Adsorbents of MB
17. Nanoparticles Formed Using Agricultural Products
18. Future Prospects Wait
19. Conclusions
Author Contributions
Funding
Conflicts of Interest
Abbreviations
| MB | Methylene blue |
| FT-IR | Fourier transform infrared |
| SEM | Scanning electron microscope |
| EDX | Energy dispersive X-ray spectroscopy |
| BET | Brunauer–Emmette–Teller |
| OL | Organosolv lignin |
| OTPW | Olive tree pruning wastes |
| FCBAC | Ficus carica activated carbon |
| TSA | Tobacco stem ash |
| EDTA | Ethylenediaminetetraacetic acid |
| EDTAD | EDTA dianhydride (EDTAD) |
| Langmuir sorption ability | |
| NRH | Natural rice husk |
| MRH | Modified rice husk |
| MPAC | Mangosteen peel activated carbon |
| NS | Natural white pine sawdust |
| GNSP | Groundnut shell powder |
| CAMS | Citric-acid-modified sawdust |
| SRB | Spent rice biomass |
| -NH | Amido groups |
| R-RT | Raw rejected tea |
| N-RT | NaOH-modified rejected tea |
| m-ALG/RH | Magnetic alginate/rice husk |
| MWH | Modified wheat husk |
| OTPW | Olive tree pruning waste |
| COTPW | Composted olive tree pruning waste |
| KF | Freundlich constant |
| E | Adsorption energy |
| RHAC | Rice husk activated carbon |
References
- Chowdhury, S.; Das, P. Biosorption of methylene blue from aqueous solutions by a waste biomaterial: Hen feathers. Appl. Water Sci. 2012, 2, 209–219. [Google Scholar] [CrossRef]
- Shih, M.-C. Kinetics of the batch adsorption of methylene blue from aqueous solutions onto rice husk: Effect of acid-modified process and dye concentration. Desalin. Water Treat. 2012, 37, 200–214. [Google Scholar] [CrossRef]
- Al-Tohamy, R.; Ali, S.S.; Li, F.; Okasha, K.M.; Mahmoud, Y.A.-G.; Elsamahy, T.; Jiao, H.; Fu, Y.; Sun, J. A critical review on the treatment of dye-containing wastewater: Ecotoxicological and health concerns of textile dyes and possible remediation approaches for environmental safety. Ecotoxicol. Environ. Saf. 2022, 231, 113160. [Google Scholar] [CrossRef]
- Golka, K.; Kopps, S.; Myslak, Z.W. Carcinogenicity of azo colorants: Influence of solubility and bioavailability. Toxicol. Lett. 2004, 151, 203–210. [Google Scholar] [CrossRef]
- Lee, S.-K.; Mills, A. Novel photochemistry of leuco-Methylene Blue. Chem. Commun. 2003, 2366–2367. [Google Scholar] [CrossRef]
- Crettaz, S.; Kämpfer, P.; Brüschweiler, B.J.; Nussbaumer, S.; Deflorin, O. Survey on hazardous non-regulated aromatic amines as cleavage products of azo dyes found in clothing textiles on the Swiss market. J. Consum. Prot. Food Saf. 2019, 15, 49–61. [Google Scholar] [CrossRef]
- Rafatullah, M.; Sulaiman, O.; Hashim, R.; Ahmad, A. Adsorption of methylene blue on low-cost adsorbents: A review. J. Hazard. Mater. 2010, 177, 70–80. [Google Scholar] [CrossRef]
- Ahmad, A.; Mohd-Setapar, S.H.; Chuong, C.S.; Khatoon, A.; Wani, W.A.; Kumar, R.; Rafatullah, M. Recent advances in new generation dye removal technologies: Novel search for approaches to reprocess wastewater. RSC Adv. 2015, 5, 30801–30818. [Google Scholar] [CrossRef]
- Kini, M.S.; Saidutta, M.B.; Murty, V.R. Studies on Biosorption of Methylene Blue from Aqueous Solutions by Powdered Palm Tree Flower (Borassus flabellifer). Int. J. Chem. Eng. 2014, 2014, 306519. [Google Scholar] [CrossRef][Green Version]
- Adelodun, B.; Ajibade, F.; Abdulkadir, T.; Bakare, H.; Choi, K. SWOT analysis of agro-waste based adsorbents for persistent dye pollutants removal from wastewaters. Environ. Degrad. Causes Remediat. Strateg. 2020, 88–103. [Google Scholar] [CrossRef]
- Alver, E.; Metin, A.; Brouers, F. Methylene blue adsorption on magnetic alginate/rice husk bio-composite. Int. J. Biol. Macromol. 2020, 154, 104–113. [Google Scholar] [CrossRef] [PubMed]
- Sharma, Y.C.; Uma; Upadhyay, S.N. An economically viable removal of methylene blue by adsorption on activated carbon prepared from rice husk. Can. J. Chem. Eng. 2011, 89, 377–383. [Google Scholar] [CrossRef]
- Banerjee, S.; Chattopadhyaya, M.C.; Uma; Sharma, Y.C. Adsorption Characteristics of Modified Wheat Husk for the Removal of a Toxic Dye, Methylene Blue, from Aqueous Solutions. J. Hazard. Toxic Radioact. Waste 2014, 18, 56–63. [Google Scholar] [CrossRef]
- Salazar-Rábago, J.J.; Leyva-Ramos, R.; Rivera-Utrilla, J.; Ocampo-Perez, R.; Cerino-Cordova, F. Biosorption mechanism of Methylene Blue from aqueous solution onto White Pine (Pinus durangensis) sawdust: Effect of operating conditions. Sustain. Environ. Res. 2017, 27, 32–40. [Google Scholar] [CrossRef]
- Ahmad, H.B.; Anwar, T.; Ashiq, M.N.; Yousaf, M.; Aleem, M. Comparative studies for the adsorption of remazol blue on rice husk, saw dust and charcoal. J. Chem. Soc. Pak. 2011, 33, 449–453. [Google Scholar]
- Patil, S.; Renukdas, S.; Patel, N. Removal of methylene blue, a basic dye from aqueous solutions by adsorption using teak tree (Tectona grandis) bark powder. Int. J. Environ. Sci. 2011, 1, 711–726. [Google Scholar]
- Ong, S.; Keng, P.; Voon, M.; Lee, S. Application of durian peel (Durio zibethinus Murray) for removal of methylene blue from aqueous solution. Asian J. Chem. 2011, 23, 2898–2902. [Google Scholar]
- Dharmalingam, V.; Ramasamy, A.K.; Balasuramanian, V. Chemical Modification on Reactive Dye Adsorption Capacity of Castor Seeds. E-J. Chem. 2011, 8, S335–S343. [Google Scholar] [CrossRef]
- Vargas, A.M.M.; Cazetta, A.L.; Kunita, M.H.; Silva, T.L.; Almeida, V.C. Adsorption of methylene blue on activated carbon produced from flamboyant pods (Delonix regia): Study of adsorption isotherms and kinetic models. Chem. Eng. J. 2011, 168, 722–730. [Google Scholar] [CrossRef]
- Gunasekar, V.; Ponnusami, V. Kinetics, Equilibrium, and Thermodynamic Studies on Adsorption of Methylene Blue by Carbonized Plant Leaf Powder. J. Chem. 2013, 2013, 415280. [Google Scholar] [CrossRef]
- Gunasekar, V.; Kumar, S.; Ponnusami, V. Prediction of Adsorption Kinetic Rate Constant for Removal of Methylene Blue Using Teak Leaf Powder. Asian J. Sci. Res. 2014, 7, 284–293. [Google Scholar] [CrossRef]
- Fiaz, R.; Hafeez, M.; Mahmood, R. Ficcus palmata leaves as a low-cost biosorbent for methylene blue: Thermodynamic and kinetic studies. Water Environ. Res. 2019, 91, 689–699. [Google Scholar] [CrossRef]
- Dural, M.U.; Cavas, L.; Papageorgiou, S.K.; Katsaros, F.K. Methylene blue adsorption on activated carbon prepared from Posidonia oceanica (L.) dead leaves: Kinetics and equilibrium studies. Chem. Eng. J. 2011, 168, 77–85. [Google Scholar] [CrossRef]
- Mathivanan, M.; Saranathan, E.S. Sugarcane bagasse-a low cost adsorbent for removal of methylene blue dye from aqueous Solution. J. Chem. Pharm. Res. 2015, 7, 817–822. [Google Scholar]
- Nharingo, T.; Shoniwa, V.; Hunga, O.; Shumba, M. Exploring the biosorption of methylene blue dye onto acid treated sugar-cane bagasse. Int. J. Curr. Res. 2013, 5, 2169–2175. [Google Scholar]
- Kumar, S.; Gunasekar, V.; Ponnusami, V. Removal of Methylene Blue from Aqueous Effluent Using Fixed Bed of Groundnut Shell Powder. J. Chem. 2013, 2013, 259819. [Google Scholar] [CrossRef]
- Zhang, S.; Wang, Z.; Zhang, Y.; Pan, H.; Tao, L. Adsorption of Methylene Blue on Organosolv Lignin from Rice Straw. Procedia Environ. Sci. 2016, 31, 3–11. [Google Scholar] [CrossRef]
- Anastopoulos, I.; Margiotoudis, I.; Massas, I. The use of olive tree pruning waste compost to sequestrate methylene blue dye from aqueous solution. Int. J. Phytoremediation 2018, 20, 831–838. [Google Scholar] [CrossRef]
- Pathania, D.; Sharma, S.; Singh, P. Removal of methylene blue by adsorption onto activated carbon developed from Ficus carica bast. Arab. J. Chem. 2017, 10, S1445–S1451. [Google Scholar] [CrossRef]
- Sen, T.K.; Afroze, S.; Ang, H.M. Equilibrium, Kinetics and Mechanism of Removal of Methylene Blue from Aqueous Solution by Adsorption onto Pine Cone Biomass of Pinus radiata. Water Air Soil Pollut. 2010, 218, 499–515. [Google Scholar] [CrossRef]
- Ghosh, R.K.; Reddy, D.D. Tobacco Stem Ash as an Adsorbent for Removal of Methylene Blue from Aqueous Solution: Equilibrium, Kinetics, and Mechanism of Adsorption. Water Air Soil Pollut. 2013, 224, 1582. [Google Scholar] [CrossRef]
- Zou, W.; Bai, H.; Gao, S.; Li, K. Characterization of modified sawdust, kinetic and equilibrium study about methylene blue adsorption in batch mode. Korean J. Chem. Eng. 2013, 30, 111–122. [Google Scholar] [CrossRef]
- Zhang, R.; Zhou, Y.; Gu, X.; Lu, J. Competitive Adsorption of Methylene Blue and Cu2+ onto Citric Acid Modified Pine Sawdust. CLEAN Soil Air Water 2014, 43, 96–103. [Google Scholar] [CrossRef]
- Rehman, M.S.U.; Kim, I.; Han, J.-I. Adsorption of methylene blue dye from aqueous solution by sugar extracted spent rice biomass. Carbohydr. Polym. 2012, 90, 1314–1322. [Google Scholar] [CrossRef]
- Mitrogiannis, D.; Markou, G.; Çelekli, A.; Bozkurt, H. Biosorption of methylene blue onto Arthrospira platensis biomass: Kinetic, equilibrium and thermodynamic studies. J. Environ. Chem. Eng. 2015, 3, 670–680. [Google Scholar] [CrossRef]
- Guler, U.A.; Sarioglu, M. Single and binary biosorption of Cu(II), Ni(II) and methylene blue by raw and pretreated Spirogyra sp.: Equilibrium and kinetic modeling. J. Environ. Chem. Eng. 2013, 1, 369–377. [Google Scholar] [CrossRef]
- Daneshvar, E.; Vazirzadeh, A.; Niazi, A.; Kousha, M.; Naushad, M.; Bhatnagar, A. Desorption of Methylene blue dye from brown macroalga: Effects of operating parameters, isotherm study and kinetic modeling. J. Clean. Prod. 2017, 152, 443–453. [Google Scholar] [CrossRef]
- Nacèra, Y.; Aicha, B. Equilibrium and kinetic modelling of methylene blue biosorption by pretreated dead streptomyces rimosus: Effect of temperature. Chem. Eng. J. 2006, 119, 121–125. [Google Scholar] [CrossRef]
- Agarwal, S.; Tyagi, I.; Gupta, V.K.; Ghasemi, N.; Shahivand, M.; Ghasemi, M. Kinetics, equilibrium studies and thermodynamics of methylene blue adsorption on Ephedra strobilacea saw dust and modified using phosphoric acid and zinc chloride. J. Mol. Liq. 2016, 218, 208–218. [Google Scholar] [CrossRef]
- Gusmão, K.A.G.; Gurgel, L.V.A.; Melo, T.M.S.; Gil, L.F. Adsorption studies of methylene blue and gentian violet on sugarcane bagasse modified with EDTA dianhydride (EDTAD) in aqueous solutions: Kinetic and equilibrium aspects. J. Environ. Manag. 2013, 118, 135–143. [Google Scholar] [CrossRef]
- Nasuha, N.; Hameed, B.H. Adsorption of methylene blue from aqueous solution onto NaOH-modified rejected tea. Chem. Eng. J. 2011, 166, 783–786. [Google Scholar] [CrossRef]
- Jin, Y.; Zhang, Y.; Lü, Q.; Cheng, X. Biosorption of methylene blue by chemically modified cellulose waste. J. Wuhan Univ. Technol. Sci. Ed. 2014, 29, 817–823. [Google Scholar] [CrossRef]
- Yagub, M.T.; Sen, T.K.; Ang, M. Removal of cationic dye methylene blue (MB) from aqueous solution by ground raw and base modified pine cone powder. Environ. Earth Sci. 2013, 71, 1507–1519. [Google Scholar] [CrossRef]
- Spagnoli, A.A.; Giannakoudakis, D.A.; Bashkova, S. Adsorption of methylene blue on cashew nut shell based carbons activated with zinc chloride: The role of surface and structural parameters. J. Mol. Liq. 2017, 229, 465–471. [Google Scholar] [CrossRef]
- Royer, B.; Cardoso, N.F.; Lima, E.C.; Vaghetti, J.C.; Simon, N.M.; Calvete, T.; Veses, R.C. Applications of Brazilian pine-fruit shell in natural and carbonized forms as adsorbents to removal of methylene blue from aqueous solutions—Kinetic and equilibrium study. J. Hazard. Mater. 2009, 164, 1213–1222. [Google Scholar] [CrossRef]
- Pavan, F.A.; Lima, E.C.; Dias, S.L.; Mazzocato, A.C. Methylene blue biosorption from aqueous solutions by yellow passion fruit waste. J. Hazard. Mater. 2008, 150, 703–712. [Google Scholar] [CrossRef]
- Bhagavathi Pushpa, T.; Vijayaraghavan, J.; Vijayaraghavan, K.; Jegan, J. Utilization of Effective Microorganisms based water hyacinth compost as biosorbent for the removal of basic dyes. Desalin. Water Treat. 2016, 57, 24368–24377. [Google Scholar] [CrossRef]
- Vijayaraghavan, J.; Bhagavathi Pushpa, T.; Sardhar Basha, S.J.; Vijayaraghavan, K.; Jegan, J. Evaluation of Red Marine Alga Kappaphycus alvarezii as Biosorbent for Methylene Blue: Isotherm, Kinetic, and Mechanism Studies. Sep. Sci. Technol. 2014, 50, 1120–1126. [Google Scholar] [CrossRef]
- Vijayaraghavan, J.; Bhagavathi Pushpa, T.B.; Sardhar Basha, S.J.; Jegan, J. Isotherm, kinetics and mechanistic studies of methylene blue biosorption onto red seaweed Gracilaria corticata. Desalin. Water Treat. 2015, 57, 13540–13548. [Google Scholar] [CrossRef]
- Senthil Kumar, P.; Abhinaya, R.V.; Gayathri Lashmi, K.; Arthi, V.; Pavithra, R.; Sathyaselvabala, V.; Dinesh Kirupha, S.; Sivanesan, S. Adsorption of methylene blue dye from aqueous solution by agricultural waste: Equilibrium, thermodynamics, kinetics, mechanism and process design. Colloid J. 2011, 73, 651–661. [Google Scholar] [CrossRef]
- Song, J.; Zou, W.; Bian, Y.; Su, F.; Han, R. Adsorption characteristics of methylene blue by peanut husk in batch and column modes. Desalination 2011, 265, 119–125. [Google Scholar] [CrossRef]
- Ince, M.; Ince, O.K. An Overview of Adsorption Technique for Heavy Metal Removal from Water/Wastewater: A Critical Review. Int. J. Pure Appl. Sci. 2017, 3, 10–19. [Google Scholar] [CrossRef]
- Oladoja, N.A.; Aboluwoye, C.O.; Oladimeji, Y.B.; Ashogbon, A.O.; Otemuyiwa, I.O. Studies on castor seed shell as a sorbent in basic dye contaminated wastewater remediation. Desalination 2008, 227, 190–203. [Google Scholar] [CrossRef]
- Kaur, R.; Bhaskar, T. Potential of castor plant (Ricinus communis) for production of biofuels, chemicals, and value-added products. Waste Biorefinery 2020, 269–310. [Google Scholar] [CrossRef]
- Ladda, P.L.; Kamthane, R.B. Ricinus communis (castor): An overview. Int. J. Res. Pharmacol. Pharmacother. 2014, 3, 136–144. [Google Scholar]
- Shah, S.K.; Patel, C.J.; Rathore, B.S.; Desai, A.G. Evaluation of Castor Stems Residue for Cellulose and Lignin Content. Int. J. Agric. Environ. Biotechnol. 2015, 8, 331. [Google Scholar] [CrossRef]
- Marczenko, Z. Spectrophotometric Determination of Elements; Horwood: New York, NY, USA, 1975. [Google Scholar]
- Wang, Y.H.; Liu, X.Q.; Meng, G.Y. Preparation and properties of supported 100% titania ceramic membranes. Mater. Res. Bull. 2008, 43, 1480–1491. [Google Scholar] [CrossRef]
- Sachin, K.M.; Karpe, S.A.; Singh, M.; Bhattarai, A. Self-assembly of sodium dodecylsulfate and dodecyltrimethylammonium bromide mixed surfactants with dyes in aqueous mixtures. R. Soc. Open Sci. 2019, 6, 181979. [Google Scholar] [CrossRef]
- Ahmed, S.; Jiang, X.; Wang, C.; Kalsoom, U.E.; Wang, B.; Khan, J.; Muhammad, Y.; Duan, Y.; Zhu, H.; Ren, X.; et al. An Insightful Picture of Nonlinear Photonics in 2D Materials and their Applications: Recent Advances and Future Prospects. Adv. Opt. Mater. 2021, 9, 2001671. [Google Scholar] [CrossRef]
- Alagarsamy, A.; Chandrasekaran, S.; Manikandan, A. Green synthesis and characterization studies of biogenic zirconium oxide (ZrO2) nanoparticles for adsorptive removal of methylene blue dye. J. Mol. Struct. 2022, 1247, 131275. [Google Scholar] [CrossRef]
- Pirbazari, A.E.; Saberikhah, E.; Kozani, S.H. Fe3O4–wheat straw: Preparation, characterization and its application for methylene blue adsorption. Water Resour. Ind. 2014, 7–8, 23–37. [Google Scholar] [CrossRef]
- Peres, E.C.; Slaviero, J.C.; Cunha, A.M.; Hosseini–Bandegharaei, A.; Dotto, G.L. Microwave synthesis of silica nanoparticles and its application for methylene blue adsorption. J. Environ. Chem. Eng. 2018, 6, 649–659. [Google Scholar] [CrossRef]
- Lu, K.; Wang, T.; Zhai, L.; Wu, W.; Dong, S.; Gao, S.; Mao, L. Adsorption behavior and mechanism of Fe-Mn binary oxide nanoparticles: Adsorption of methylene blue. J. Colloid Interface Sci. 2019, 539, 553–562. [Google Scholar] [CrossRef] [PubMed]
- Sultan, M.; Jamal, Z.; Jubeen, F.; Farooq, A.; Bibi, I.; Uroos, M.; Chaudhry, H.; Alissa, S.A.; Iqbal, M. Green synthesis of biodegradable polyurethane and castor oil-based composite for benign transformation of methylene blue. Arab. J. Chem. 2021, 14, 103417. [Google Scholar] [CrossRef]
- Zhang, Z.; Xu, L.; Liu, Y.; Feng, R.; Zou, T.; Zhang, Y.; Kang, Y.; Zhou, P. Efficient removal of methylene blue using the mesoporous activated carbon obtained from mangosteen peel wastes: Kinetic, equilibrium, and thermodynamic studies. Microporous Mesoporous Mater. 2021, 315, 110904. [Google Scholar] [CrossRef]
- Elmorsi, T.M. Equilibrium Isotherms and Kinetic Studies of Removal of Methylene Blue Dye by Adsorption onto Miswak Leaves as a Natural Adsorbent. J. Environ. Prot. 2011, 02, 817–827. [Google Scholar] [CrossRef]
- Sharma, K.; Sharma, S.; Sharma, V.; Mishra, P.K.; Ekielski, A.; Sharma, V.; Kumar, V. Methylene Blue Dye Adsorption from Wastewater Using Hydroxyapatite/Gold Nanocomposite: Kinetic and Thermodynamics Studies. Nanomaterials 2021, 11, 1403. [Google Scholar] [CrossRef]
- Hashem, A.H.; Saied, E.; Hasanin, M.S. Green and ecofriendly bio-removal of methylene blue dye from aqueous solution using biologically activated banana peel waste. Sustain. Chem. Pharm. 2020, 18, 100333. [Google Scholar] [CrossRef]
- Jawad, A.H.; Hum, N.N.M.F.; Farhan, A.M.; Mastuli, M.S. Biosorption of methylene blue dye by rice (Oryza sativa L.) straw: Adsorption and mechanism study. Desalin. Water Treat. 2020, 190, 322–330. [Google Scholar] [CrossRef]
- Kavci, E.; Erkmen, J.; Bingöl, M.S. Removal of methylene blue dye from aqueous solution using citric acid modified apricot stone. Chem. Eng. Commun. 2021, 1–16. [Google Scholar] [CrossRef]
- Adegoke, K.A.; Bello, O.S. Dye sequestration using agricultural wastes as adsorbents. Water Resour. Ind. 2015, 12, 8–24. [Google Scholar] [CrossRef]
- Miri, A.; Mahabbati, F.; Najafidoust, A.; Miri, M.J.; Sarani, M. Nickel oxide nanoparticles: Biosynthesized, characterization and photocatalytic application in degradation of methylene blue dye. Inorg. Nano-Metal Chem. 2020, 52, 122–131. [Google Scholar] [CrossRef]
- Dhananasekaran, S.; Palanivel, R.; Pappu, S. Adsorption of Methylene Blue, Bromophenol Blue, and Coomassie Brilliant Blue by α-chitin nanoparticles. J. Adv. Res. 2016, 7, 113–124. [Google Scholar] [CrossRef] [PubMed]
- Awad, A.M.; Jalab, R.; Benamor, A.; Nasser, M.S.; Ba-Abbad, M.M.; El-Naas, M.; Mohammad, A.W. Adsorption of organic pollutants by nanomaterial-based adsorbents: An overview. J. Mol. Liq. 2020, 301, 112335. [Google Scholar] [CrossRef]
- Ahmad, K.; Shah, H.R.; Ahmad, M.; Ahmed, M.; Naseem, K.; Riaz, N.; Muhammad, A.; Ayub, A.; Ahmad, M.; Ahmad, Z.; et al. Comparative Study Between Two Zeolitic Imidazolate Frameworks as Adsorbents for Removal of Organoarsenic, As(III) and As(V) Species from Water. Braz. J. Anal. Chem. 2022, 9, 78–97. [Google Scholar] [CrossRef]
- Ahmad, K.; Shah, H.U.; Ashfaq, A.; Ashfaq, M.; Kashif, M.; Naseem, H.A.; Aziz, T.; Parveen, S.; Nazir, I. Synthesis of New Series of Phenyldiazene Based Metal Complexes for Designing Most Active Antibacterial and Antifungal Agents. J. Chem. Soc. Pak. 2021, 43, 578. [Google Scholar] [CrossRef]
- Shah, H.U.R.; Ahmad, K.; Naseem, H.A.; Parveen, S.; Ashfaq, M.; Aziz, T.; Shaheen, S.; Babras, A.; Shahzad, A. Synthetic routes of azo derivatives: A brief overview. J. Mol. Struct. 2021, 1244, 131181. [Google Scholar] [CrossRef]
- Suhaimi, N.; Kooh, M.R.; Lim, C.M.; Chou Chao, C.-T.; Chou Chau, Y.F.; Mahadi, A.H.; Chiang, H.P.; Hassan, N.H.; Thotagamuge, R. The Use of Gigantochloa Bamboo-Derived Biochar for the Removal of Methylene Blue from Aqueous Solution. Adsorpt. Sci. Technol. 2022, 2022, 8245797. [Google Scholar] [CrossRef]
- Kooh, M.R.R.; Thotagamuge, R.; Chou Chau, Y.-F.; Mahadi, A.H.; Lim, C.M. Machine learning approaches to predict adsorption capacity of Azolla pinnata in the removal of methylene blue. J. Taiwan Inst. Chem. Eng. 2022, 132, 104134. [Google Scholar] [CrossRef]


| Sorbent | (mg/g) | Reference |
|---|---|---|
| Castor seed shell | 158.73 | [53] |
| Oxalic-acid-modified rice husk | 53.21 ± 2.43 (293 K) 66.90 ± 3.44 (303 K) 70.10 ± 3.43 (313 K) | [10] |
| Natural rice husk | 19.77 ± 1.83 (293 K) | [10] |
| Magnetic alginate/rice husk | 274.9 | [11] |
| Modified wheat husk | 4.23 (303 K) 4.04 (313 K) 3.78 (323 K) | [13] |
| Posidonia oceanica (L.) dead leaves | 217.39 (298 K) 270.27 (308 K) 285.71 (318 K) | [23] |
| Rice husk activated carbon | 9.83 (303 K) 10.62 (313 K) 14.34 (323 K) | [12] |
| Flamboyant pods activated carbon | 874.68 | [19] |
| Sugarcane bagasse | 108.69 | [24] |
| Groundnut shell powder | 242 | [26] |
| Organosolv lignin from rice straw | 40.02 | [27] |
| Acid-treated sugarcane bagasse | 64.9351 | [25] |
| Olive tree pruning waste | 129.87 (298 K) | [28] |
| Compost of olive tree pruning waste | 250.00 (298 K) | [28] |
| Arthrospira platensis (cyanobacterium) | 312.50 (298 K) | [35] |
| Raw Spirogyra sp. (green alga) | 50.70 (293 K) | [36] |
| Pretreated Spirogyra sp. (green alga) | 64.61 (293 K) | [36] |
| Nizamuddinia zanardinii (brown macroalga) | 95.45 (300 K) | [37] |
| Pretreated dead Streptomyces rimosus | 34.34 (293 K) | [38] |
| Ephedra strobilacea char | 31.055(298K) | [39] |
| Ephedra strobilacea char modified using phosphoric acid | 21.881 (298 K) | [39] |
| Ephedra strobilacea char modified using ZnCl2 | 37.174 (298 K) | [39] |
| Sugarcane bagasse modified with EDTA dianhydride (EDTAD) | 202.43 (298 K) | [40] |
| NaOH-modified rice husk | 39.2 ± 2.7 (298 K) | [40] |
| NaOH-modified rejected tea | 242.11 (303 K) | [41] |
| Cellulose waste modified with citric acid | 211.42 (293 K) | [42] |
| Raw pinecone | 129.87 (303 K) | [43] |
| Pinecone modified with 0.1 M NaOH | 142.86 (303 K) | [43] |
| Pinecone modified with 0.05 M NaOH | 135.13 (303 K) | [43] |
| Carbon derived from cashew nut shell activated with ZnCl2 | 456 | [44] |
| Pine-fruit shell (Araucaria angustifolia) | 185 (298 K) | [45] |
| Yellow passion fruit | 44.70 (298 K) | [46] |
| Effective microorganism (EM)-based water hyacinth compost | 295.65 | [47] |
| Red marine (alga Kappaphycus alvarezii) | 74.40 (303 K) | [48] |
| Gracilaria corticata (red seaweed) | 95.41(303K) | [49] |
| (Ficus carica bast) FCBAC | 47.62 | [29] |
| Pinus radiata cone | 109.89 | [30] |
| Tobacco stem ash | 35.7(300K) | [31] |
| Modified sawdust | 111.46 (293 K) 114.40 (303 K) 156.6 (313 K) | [32] |
| Carbonized plant leaf powder from teak (Tectona grandis) and guava (Psidium guajava) trees | 61.22 | [20] |
| Sugar extracted from spent rice biomass | 8.30 | [34] |
| Cashew nut shell | 5.31 | [50] |
| Peanut husk | 72.13 ± 3.03 | [51] |
| Biogenic zirconium oxide (ZrO2) | 23.26 | [61] |
| Fe3O4 magnetic nanoparticles | 1374.6 | [62] |
| Nano–silica (nSiO2) | 679.9 | [63] |
| Fe–Mn binary oxide | 72.32 | [64] |
| Presence | cm−1 | Reference |
|---|---|---|
| OH groups associated with silanol groups (Si-OH) to adsorb water | 3300–3450 | [25] |
| OH groups bound to methyl radicals observed in lignin structures | 2920–2940 | [18,26,29,40,41] |
| Peaks showing carbonyl stretching from aldehydes and ketones | 1640–1670 | [32,33] |
| Peaks showing aromatic rings | 1511 | [14,32,40] |
| Structures of SiO2, i.e., silica | 1130–1050 | [25] |
| Bending vibration of SiO2 | 466 | [25] |
| Asymmetric stretching of -COO- group vibrations | 1592 | [40] |
| Symmetric stretching of -COO- group vibrations | 1412 | [40] |
| Peaks showing asymmetric and symmetric stretching of –CH2 groups | 2914 | [30] |
| Peaks showing symmetric stretching of –CH2 | 2868 | [30] |
| Peaks showing vibration stretching of CO | 1076 | [32,33] |
| The peak of ester acetyl groups in carboxylic acid groups of lignin or hemicellulose | 1700 | [40,14] |
| Stretching vibration of Si-O bond in rice husk structure | 800 | [2,11,14,41] |
| Stretching vibration of -C=N | 1594 | [11,14] |
| Stretching vibration of -C-N | 1334 | [11,14,36] |
| Stretching vibration of -C=S | 1492 | [11] |
| Adsorbent | Temperature (K) | ∆G (kJ mol−1) | ∆H (kJ mol−1) | ∆S (kJ mol−1K−1) | Reference |
|---|---|---|---|---|---|
| Raw pinecone | 303 | −13.64 | −14.61 | −0.017 | [43] |
| 313 | −13.12 | −14.16 | −0.017 | ||
| 323 | −0.017 | −0.017 | −0.017 | ||
| Pine sawdust (Pinus tabulaeformis) | 293 | −12.68 | 1.899 | 0.495 | [32] |
| 303 | −12.95 | ||||
| 313 | −13.67 | ||||
| Pinus radiata | 303 | −7.56 | −26.50 | −0.062 | [30] |
| 318 | −6.63 | −26.50 | −0.062 | ||
| 333 | −5.69 | −26.50 | −0.062 | ||
| Sugar extracted from spent rice biomass | 298 | −1314 | 1568 | 9.67 | [34] |
| 323 | −1508 | ||||
| (Ficus carica bast) FCBAC | −1.55 | 21.55 | 76.24 | [29] | |
| NaOH-modified rejected tea | 303 | −9.823 | 7.169 | 56.082 | [41] |
| 313 | −11.049 | ||||
| 323 | −11.941 | ||||
| Carbonized plant leaf powder from teak (Tectona grandis) and guava (Psidium guajava) trees | 293 | −21,650. | 23,146.4 | 153.1 | [20] |
| 303 | −23,323.6 | ||||
| 313 | −24,748.1 | ||||
| 323 | −26,270.6 | ||||
| Raw Spirogyra sp. (green alga) | −20.89 | −15.03 | 0.02 | [36] | |
| Pretreated Spirogyra sp. (green alga) | −19.24 | −13.38 | 0.02 | ||
| OTPW | 298 | −26.97 | −11.85 | +0.051 | [28] |
| 333 | −28.75 | +0.051 | |||
| COTPW | 298 | −28.07 | −30.93 | −0.010 | |
| 333 | −27.73 | −0.010 | |||
| ESC | 298 | −20.79 | 17.44 | 0.128 | [39] |
| 308 | −22.29 | ||||
| 318 | −23.58 | ||||
| 328 | −24.97 | ||||
| ESP | 298 | −19.43 | 12.04 | 0.105 | |
| 308 | −20.39 | ||||
| 318 | −21.60 | ||||
| 328 | −22.78 | ||||
| ESZ | 298 | −18.76 | 17.39 | 0.121 | |
| 308 | −19.87 | ||||
| 318 | −21.90 | ||||
| 328 | −22.71 |
Publisher’s Note: MDPI stays neutral with regard to jurisdictional claims in published maps and institutional affiliations. |
© 2022 by the authors. Licensee MDPI, Basel, Switzerland. This article is an open access article distributed under the terms and conditions of the Creative Commons Attribution (CC BY) license (https://creativecommons.org/licenses/by/4.0/).
Share and Cite
Sah, M.K.; Edbey, K.; EL-Hashani, A.; Almshety, S.; Mauro, L.; Alomar, T.S.; AlMasoud, N.; Bhattarai, A. Exploring the Biosorption of Methylene Blue Dye onto Agricultural Products: A Critical Review. Separations 2022, 9, 256. https://doi.org/10.3390/separations9090256
Sah MK, Edbey K, EL-Hashani A, Almshety S, Mauro L, Alomar TS, AlMasoud N, Bhattarai A. Exploring the Biosorption of Methylene Blue Dye onto Agricultural Products: A Critical Review. Separations. 2022; 9(9):256. https://doi.org/10.3390/separations9090256
Chicago/Turabian StyleSah, Manish Kumar, Khaled Edbey, Ashraf EL-Hashani, Sanad Almshety, Luisetto Mauro, Taghrid S. Alomar, Najla AlMasoud, and Ajaya Bhattarai. 2022. "Exploring the Biosorption of Methylene Blue Dye onto Agricultural Products: A Critical Review" Separations 9, no. 9: 256. https://doi.org/10.3390/separations9090256
APA StyleSah, M. K., Edbey, K., EL-Hashani, A., Almshety, S., Mauro, L., Alomar, T. S., AlMasoud, N., & Bhattarai, A. (2022). Exploring the Biosorption of Methylene Blue Dye onto Agricultural Products: A Critical Review. Separations, 9(9), 256. https://doi.org/10.3390/separations9090256