Abstract
Morus spp. leaves (MSLs) show various beneficial effects in the treatment of metabolic-related diseases, which have created a growing interest in MSL development as dietary supplements and functional foods. The illustration of chemical compositions and screening of high-quality MSL resources are therefore necessary for further application. This study developed a new UHPLC-ESI-QTOF-MS/MS strategy of in-source collision-induced dissociation (IS-CID) and target collision-cell CID (TCC-CID) to quickly capture analogues with consistent skeleton, and combined global natural product social molecular networking (GNPS) to efficiently annotate bioactive phytochemicals in MSLs. For the results, 49 bioactive ingredients, including quercetin-type flavonoids, kaempferol-type flavonoids, chlorogenic acid isomers, 1-deoxynojirimycin, γ-aminobutyric acid, amino acids, and unsaturated fatty acids, were systematically identified in MSLs for the first time. Quantification for the typical components was simultaneously carried out in MSLs of 90 Morus resources collected from different locations. Partial least squares discriminant analysis (PLS-DA) indicated that quercetin-3-O-(6″-O-malonyl)-glucoside, rutin, kaempferol-3-O-(6″-O-malonyl)-glucoside, kaempferol-3-O-rutinoside, and chlorogenic acid showed high variable importance in the project (VIP > 1) that were significant constituents for the differences between MSL species. Then, high-quality MSLs were comprehensively screened in multiple Morus cultivars based on the criteria importance through intercriteria correlation (CRITIC) method. This study presented an efficient strategy to annotate bioactive compounds, revealed the difference of bioactive components in MSLs, and provided important information for the high-value production of Morus cultivars in food and supplement fields.
1. Introduction
Morus spp. (also commonly named mulberry) belong to the family Moraceae and are natively cultivated in China, as well as distributed in Japan and Korea [1]. For 5000 years, the mulberry plant (leaves) has been the sole fodder for silkworms (Bombyx mori) for the production of silk in China, and sericulture is one of the most important symbols of ancient China [2]. The major mulberry species, such as Morus alba L., Morus multicaulis Pitter., and Morus atropurpurea Roxb., are extensively used to produce mulberry leaves for silkworms after thousands of years of improvement and domestication. These species are generally divided into eight cultivar types according to their geographical distribution in China: Pearl River Basin type, Taihu Basin type, Sichuan Basin type, Middlestream of the Yangtze River type, Downstream of the Yellow River type, Loess Plateau type, Xinjiang type, and Northeast type [3].
In addition to application as plant fodder in traditional sericulture, mulberry leaves possess great developmental potential and utilization value in relation to medicine, food, and ecological protection [2]. For example, the dry leaves of M. alba are a traditional Chinese medicine recorded as Mori Folium in the Chinese Pharmacopoeia (2020 edition) to treat anemopyretic cold, lung cough, headache, and dizziness [4]. In particular, its fresh leaves serve as a general food due to enriched nutrients such as carbohydrates, protein, fats, fiber, and vitamins [5,6], which are an essential part of a healthy lifestyle. They also possess numerous essential compounds with various bioactivities that are important for the health of organisms. Previous research suggested that flavonoids, alkaloids, chlorogenic acid, free amino acids, some organic acids, etc., were the main bioactive constituents in M. spp. leaves (MSLs) [7,8,9,10]. The preclinical and clinical studies indicated that MSLs possessed beneficial functions, such as antidiabetic, antihyperglycemic, antioxidant, and antiobesity functions [11].
The multiple beneficial functions of MSLs explain their extensive application in food products, such as mulberry leaf tea and beverages [12,13,14]. MSLs are also usually pulverized as an additive to improve the flavor and nutritional value of food. Mulberry leaf kueh (桑叶粿) is a delicious pastry made of homogenized liquid of fresh MSLs and glutinous rice, which has been popular in the Chaoshan region of China for hundreds of years [15]. Nevertheless, bioactive compositions of different MSL resources have not yet been illustrated clearly or compared comprehensively by researchers. Even the same variety of MSL usually shows great variation in widely cultivated regions. Therefore, it is very important to systematically analyze the compositions in different MSL resources for screening of highly valuable Morus cultivars.
Liquid chromatography coupled with high-resolution mass spectrometry (LC-HRMS) methods, such as ultrahigh-performance liquid chromatography–electrospray ionization quadrupole time-of-flight mass spectrometry (UHPLC-ESI-QTOF-MS/MS), have been successfully used for efficient annotation and rapid quantification of organic ingredients in complex matrices [16,17,18,19,20,21]. These improved LC-HRMS technologies have made it easier to study bioactive components in foods and plants. This study developed an improved LC-HRMS strategy to systematically identify the main components and construct chemical profiles of MSLs using UHPLC-ESI-QTOF-MS/MS coupled with global natural product social molecular networking (GNPS). Furthermore, multiple MSL resources collected from different geographical areas were evaluated by semiquantitation of these typical components. High-quality Morus cultivars were finally screened based on multivariate statistical analysis methods.
2. Materials and Methods
2.1. Materials and Chemicals
A total of 90 Morus resources that mainly originated from eight geographical areas, including three major species, namely Morus alba L., Morus multicaulis Perr., and Morus atropurpurea Roxb., along with Morus cathayana Hemsl., Morus bombycis Koidz., Morus australis Poir., and Morus mizuho Hotta., were cultivated in the Mulberry Variety Resources Nursery of Sericultural Research Institute in Changsha City, the Mulberry Experimental Base in Lixian County, and the Donghuang Mulberry Seedling Base in Ningxiang City, China. The leaves of each of them were collected in June 2021. The fresh weight of mulberry leaves of each sample was first calculated and then dried at 50 °C to constant dry weight. The dried leaf samples were milled with a grinder and then screened through a 100-mesh sieve. The filtered powder was stored in a desiccator at room temperature in the dark before the experiment.
Commercial standards comprising isoleucine, leucine, phenylalanine, tryptophan, valine, 1-deoxynojirimycin (1-DNJ), γ-aminobutyric acid (GABA), chlorogenic acid, rutin, isoquercitrin, quercetin, and kaempferol were purchased from Yuanye Bio-Technology Co., Ltd. (Shanghai, China) and had over 98% purity as detected by high-performance liquid chromatography (HPLC). Acetonitrile, methanol, and formic acid were of chromatographic grade for LC-HRMS analysis (Merck KGaA Co., Ltd., Darmstadt, Germany). Analytical ethanol and other reagents were purchased from Sinopharm Chemical Reagent Co., Ltd. (Shanghai, China). Wahaha purified water was used in the study.
2.2. Preparation Solutions of Standards and Samples for LC-HRMS Analysis
In total, 12 reference standards, isoleucine (1.06 mg), leucine (1.04 mg), phenylalanine (1.03 mg), tryptophan (1.01 mg), valine (1.07 mg), 1-DNJ (0.81 mg), GABA (0.98 mg), chlorogenic acid (1.17 mg), rutin (1.07 mg), isoquercitrin (0.90 mg), quercetin (0.77 mg), and kaempferol (0.83 mg), were each dissolved in 1.0 mL acetonitrile/methanol (1:1, v/v) to prepare individual stock solutions. Each solution was diluted at appropriate concentrations of 5.0−10.0 μg/mL for qualitative analysis. All the stock solutions were mixed and further diluted into a series of appropriate concentrations at a range of 0.03−100.0 µg/mL for quantitative analysis.
Next, 0.15 g powder of each sample was added to 3.0 mL 60% ethanol solution and extracted for 20 min using an ultrasonic instrument with consistent power (200 W, 40 Hz; Kunshan Ultrasonic Instrument Co., Ltd., Kunshan, China). The extract was centrifuged at 12,000 rpm for 15 min, and then 1.0 mL of supernatant was filtered by a 0.22 μm membrane and then used for LC-HRMS analysis. All of the tests on the sample were carried out in triplicate.
2.3. LC-HRMS Conditions
An Agilent 1290 UHPLC coupled with a 6545B ESI-Q-TOF/MS system (Agilent Technologies, Palo Alto, CA, USA) was employed for the qualitative and quantitative analysis of mulberry leaves. An SB C18 column (2.1 × 100 mm, 1.8 µm, Agilent Technologies, Palo Alto, CA, USA) at a consistent temperature condition of 35 °C was used for the chromatographic separation. A two-phase system composed of phase A (ultrapure water containing 0.1% formic acid) and phase B (acetonitrile) was adopted with a flow rate of 0.15 mL/min, and an optimized gradient elution condition was created (0–2 min, 2% B; 2–3 min, 2–10% B; 3–5 min, 10% B; 5–8 min, 10–25% B; 8–10 min, 25% B; 10–13 min, 25–55% B; 13–16 min, 55% B; 16–19 min, 55–90% B; 19–21 min, 90–98% B; 21–30 min, 98% B). The injection volume for individual samples and standard solutions was 2.0 µL.
The mass-spectrometric conditions were improved in positive and negative ESI modes. The drying gas temperature was 325 °C with a flow rate was 9 L/min, the nebulizer pressure was 50 psi, the sheath gas temperature was 365 °C with a flow rate of 11 L/min, the nozzle voltage was 0.5 kV, the VCAP voltage was 4.0 kV, the fragmentor voltage was from 80 to 200 V, the OCT1 RF Vpp was 750 V, and the skimmer voltage was 65 V. The mass data were obtained at a range of between m/z 50 and m/z 1000 Da. Fragment ions of individual mass peaks were acquired under collision energies from 5 to 40 eV. Data acquisition and processing were carried out with Agilent Acquisition software and Agilent MassHunter Qualitative Analysis (version B.08.00), respectively.
2.4. GNPS Library Help to Identification of Compounds
The “.d” data were converted into “.MGF” file format by Agilent MassHunter Quantitative Navigator (version B.08.00), and the dedicated module “Create Molecular Networking” was used to create a network on the GNPS web platform to match potential compounds by comparing MS/MS spectra in the GNPS library. This work can be accessed via the GNPS website at https://gnps.ucsd.edu/ProteoSAFe/status.jsp?task=8d05eff8ec5e4fb3a8786c5018600d49 (25 December 2021).
2.5. Quality Evaluation by Multivariate Statistical Analysis
The SIMCA tool (14.1) was employed to analyze responsible markers in MSL samples. The criteria importance through intercriteria correlation (CRITIC) method was used to comprehensively evaluate the MSL quality [22].
3. Results and Discussion
One type of bioactive analogue generally possessed a certain kind of skeleton and was found extensively in complex matrices. Thus, it is important to rapidly mark and effectively identify these substances. However, some compounds were found to have the same m/z of skeleton (isomeric structures) when MS/MS analysis was carried out. It is necessary to discriminate fragments of skeleton ions to avoid the possible misattribution of homologues. The identification of compounds was undertaken using the strategy of combining in-source collision-induced dissociation (IS-CID) with target collision-cell CID (TCC-CID) to quickly catch analogues with the same skeleton (Figure 1).
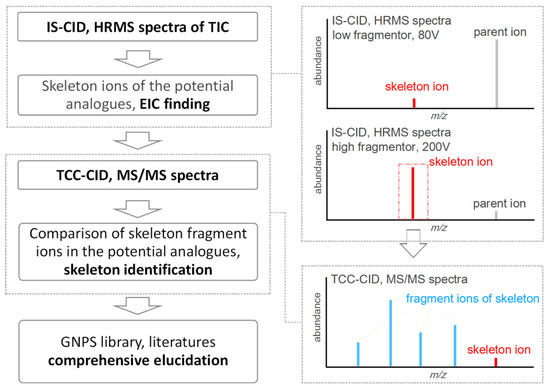
Figure 1.
An improved strategy combining IS-CID with TCC-CID to screen analogues with the same skeleton.
The fragmentor (80–200 V) has traditionally been selected according to the structural characteristics of compounds to obtain HRMS spectra with low dissociation for parent ions. In this study, a strategy that combined IS-CID with TCC-CID based on UHPLC-ESI-QTOF-MS/MS was successfully established for fast annotation of analogues with the same skeleton. In brief, TIC containing the HRMS spectrum of a sample solution was first collected under a higher fragmentor voltage (200 V) after liquid chromatography separation. The intensity of the skeleton ion dissociated from the parent ions generally increased after improving the fragmentor, and then the RT for each potential analogue was marked by an EIC finding. Subsequently, TCC-CID at a specific collision energy (CE) was performed for the potential skeleton ion (with consistent mass to charge, m/z) to capture the MS/MS spectrum. These MS/MS spectra were compared with each other to accurately label the skeleton with unanimous fragment ions and intensity to screen analogues.
3.1. Characterization of Morus Leaves
To quickly acquire more abundant mass data of bioactive components present in these Morus leaves, a QC sample was prepared by mixing an equal solution of each MSL sample, and the mass information was collected by the IS-CID−TCC-CID strategy (Figure 2a,b). The typical mass characteristics of total ion chromatograms (TICs) under ESI positive and negative modes indicated that multiple bioactive compositions in MSLs potentially exist (Table 1). Efficient identification of these bioactive ingredients is the basic foundation for understanding the beneficial effects. Therefore, GNPS was introduced to assist in the identification of potential compounds by comparison with MS/MS spectra in the online library.

Figure 2.
TICs of Morus spp. leaves (QC) in −ESI (a) an d +ESI (b) modes, EIC finding potential skeletons of quercetin, kaempferol, and quinic acid at m/z 303.05 (c), m/z 287.05 (d), and m/z 191.05 (e), respectively.

Table 1.
Bioactive and nutritive compositions in 90 samples of Morus leaves under UHPLC-ESI-QTOF-MS/MS investigation in positive and negative ESI modes.
3.1.1. Identification of Quercetin-Type Flavonoids (QTFs)
The general nomenclature of the aglycone fragments is shown in Figure 3a. The IS-CID technique was first performed to dissociate the QTFs with a fragmentor at 200 V, and the potential QTFs were screened by EIC finding with m/z 303.05 (skeleton ion of potential quercetin) as shown in Figure 2c. Then, these skeleton ions were measured with target MS/MS by the TCC-CID technique, resulting in MS/MS spectra of individual skeleton ions (Figure 3b), which were compared with MS/MS spectra of the standard quercetin (Figure 3c). The MS/MS spectra of quercetin exhibited the consecutive loss of the neural ions of H2O and CO (Figure 3c), resulting in typical fragment ions at m/z 257.04 [M + H - H2O - CO]+, m/z 229.05 [M + H - H2O - 2 × CO]+, and m/z 201.05 [M + H - 2 × H2O - 2 × CO]+. Simultaneously, m/z 165.02 [0,2A]+, m/z 153.02 [1,3A]+, and m/z 137.02 [0,2B]+ showed the typical fractures of quercetin. Therefore, aglycones of compounds 24, 26, 27, 29, 30, 32, 33, and 37 showed consistent fragment ions with quercetin that were undoubtedly classified as QTFs. The next step was to assign the linkage between quercetin aglycone and a sugar unit, which was performed under a moderate fragmentor voltage (100 V) to capture HRMS spectra of TIC with low dissociation of parent ions. QTFs possess a basic quercetin skeleton that generally joins glucoside, rutinoside, or malonyl-glucoside with C3, which were confirmed as the major phytochemicals in MSLs. The C7 position would link to some other sugar unit when C3 was occupied.
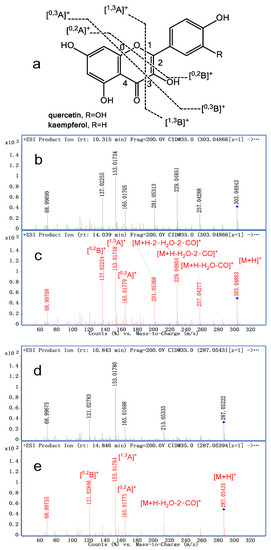
Figure 3.
General nomenclature of the aglycone fragments (a); comparison of MS/MS spectrum between potential quercetin skeleton (b) and authorized quercetin substance (c); comparison of MS/MS spectrum between potential kaempferol skeleton (d) and authorized kaempferol substance (e).
Compounds 29, 30, and 37 were identified as rutin (que-3-rut), isoquercitrin (que-3-glu), and quercetin, respectively, by comparison with the authorized substances. Compound 24 showed a parent ion at m/z 713.16 [M + H]+, and fragment ions at m/z 551.10 [M + H - glu]+, m/z 465.10 [M + H - glu - mal]+, and m/z 303.05 [M + H - glu - mal - glu]+ were identified as quercetin-3-O-(6″-O-malonyl)-glucose-7-O-glucoside (que-mal-glu-glu) by referring to the GNPS library. Similarly, compound 26 had a parent ion and m/z 697.16 [M + H]+ and possessed fragment ions at m/z 611.16 [M + H - mal]+, m/z 465.10 [M + H - mal - rha]+, and m/z 303.05 [M + H - mal - rha - glu]+. Compound 27 possessed parent ion and m/z 757.22 [M + H]+ and possessed fragment ions at m/z 611.16 [M + H - rha]+, m/z 465.10 [M + H - rha - rha]+, m/z 449.11 [M + H - rut]+, and m/z 303.05 [M + H - rha - rut]+. Compounds 26 and 27 were identified as quercetin-3-O-(6″-O-malonyl)-glucose-7-O-rhamnoside (que-mal-glu-rha) and quercetin-3-O-rutinoside-7-O-rhamnoside (que-rut-rha), respectively, by comparing MS/MS data. Compounds 32 and 33 showed the same parent ion and fragment ion at m/z 551.10 and m/z 303.05, respectively, which indicated the existence of malonyl-glucoside in conjunction with quercetin aglycone, and both were empirically identified as quercetin-3-O-(6″-O-malonyl)-glucoside (que-mal-glu 1) and quercetin-3-O-(2″-O-malonyl)-glucoside (que-mal-glu 2), respectively.
3.1.2. Identification of Kaempferol-Type Flavonoids (KTFs)
KTFs are also important bioactive compounds in MSLs that contain kaempferol aglycone and show the same sugar connection mode as QTFs. Potential KTFs were screened by an EIC finding with m/z 287.05 (skeleton ion of potential kaempferol) using the IS-CID technique with a fragmentor at 200 V (Figure 2d). Similarly, TCC-CID was performed to compare MS/MS spectra of these skeleton ions with the standard kaempferol (Figure 3d,e). The MS/MS spectra of kaempferol showed similar fragment patterns to quercetin and had diagnostic ions at m/z 121.03 [0,2B]+, which had been confirmed in our previous study [23].
As results, compounds 28, 31, 34, 35, and 36 accurately belonged to KTFs compared with MS/MS spectra of the standard kaempferol (40). Compound 28 had a parent ion at m/z 741.22 [M + H]+ and fragment ions at m/z 595.17 [M + H - rha]+, m/z 449.18 [M + H - rha - rha]+, and m/z 287.05 [M + H - rha - rut]+; compound 31 exhibited a parent ion at m/z 595.17 [M + H]+ and fragment ions at m/z 449.18 [M + H - rha]+ and m/z 287.05 [M + H - rut]+; compound 34 showed a parent ion and m/z 449.18 [M + H]+ and a fragment ion at m/z 287.05 [M + H - glu]+. These three compounds were annotated as kaempferol-3-O-rutinoside-7-O-rhamnoside (kae-rut-rha), kaempferol-3-O-rutinoside (kae-rut), and kaempferol-3-O-glucoside (kae-glu), respectively. Compounds 35 and 36 showed the same parent ion and typical fragment ion at m/z 535.11 and m/z 287.05, respectively, which indicated the existence of malonyl-glucoside in conjunction with kaempferol aglycone, and both were empirically assigned as kaempferol-3-O-(6″-O-malonyl)-glucoside (kae-mal-glu 1) and kaempferol-3-O-(2″-O-malonyl)-glucoside (kae-mal-glu 2), respectively.
3.1.3. Identification of Chlorogenic Acids (CAs)
IS-CID with a fragmentor at 200 V in ESI negative mode showed a consistent skeleton ion of four potential quinic acid homologues at m/z 191.06 (Figure 2e). One of them was identified as chlorogenic acid by standard reference (compound 22). The skeleton ions (m/z 191.06) of the other three peaks showed consistent MS/MS spectra with the skeleton ion of chlorogenic acid under TCC-CID, which indicated that they were isomers due to the variety of different substituted positions of the caffeoyl unit on quinic acid (Figure 4a).
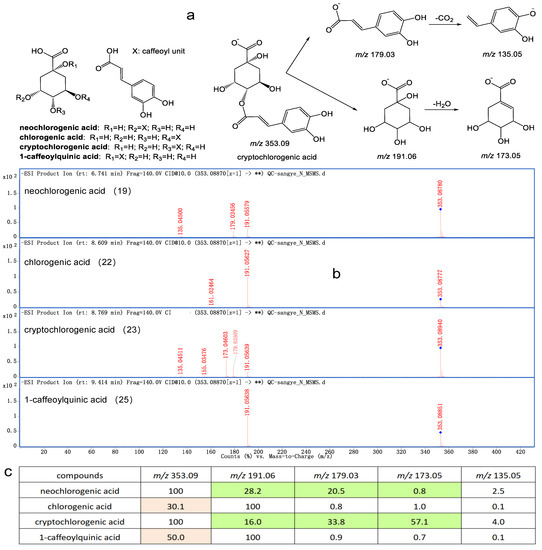
Figure 4.
Fragmentation patterns (a), MS/MS spectrum (b) and ion ratios of four chlorogenic acid isomers (c).
It is very difficult to accurately annotate these positional isomers. Fortunately, Jia-Yu Zhang et al. reported these four CA isomers [24], and MS/MS spectra in this study showed consistent retention behaviors and fragment ions with them. CAs 19, 23, and 25 were identified as neochlorogenic acid, cryptochlorogenic acid, and 1-caffeoylquinic acid, respectively, which exhibited similar fragment patterns. For cryptochlorogenic acid, for example, the parent ion (m/z 353.09 [M - H]−) was dissociated from m/z 179.04 by loss of quinic acid and subsequently generated m/z 135.05 by loss of CO2, or was dissociated from m/z 191.06 by loss of caffeoyl unit and then generated m/z 173.05 by loss of H2O (Figure 4b). These similar fragment ions might lead to uncertain annotation; therefore, this study calculated the ratio of parent ion to skeleton ion at a specific collision energy (10 eV), and each CA isomer was efficiently discriminated in complex matrices (Figure 4c).
3.1.4. Identification of 1-DNJ, GABA, Amino Acids, and Unsaturated Fatty Acids
1-DNJ (3) and GABA (9) were typical bioactive compounds in MSLs and were accurately identified by referring to the authorized compounds. In total, 16 amino acids (AAs), including the standard substances valine, isoleucine, leucine, phenylalanine, and tryptophan, and the initial identified AAs by accurate mass, MS/MS spectra, GNPS library, were determined. A pair of AA isomers, isoleucine and leucine, showed close RT and fragment ions. This study also provided an effective identification method that showed that isoleucine generally exhibited a higher fragment ion at m/z 69.07 than leucine in one consistent LC-HRMS setting in ESI positive mode. Additionally, unsaturated fatty acids and the other compounds in MSLs were also tentatively elucidated referring to accurate mass and fragment ions (Table 1).
3.2. Qualification of Bioactive Compounds
Semiquantitative analysis was performed using mixed standard solutions by Agilent MassHunter Quantitative Analysis (version 10.2). The calibration curve of each compound with correlation coefficients (R2) higher than 0.997 in appropriate concentration ranges was determined. Limits of detection (LOD) and quantification (LOQ) were obtained accordingly. RSD values of precision, reproducibility, and stability of the 12 compounds within 2.9% indicated that the method was suitable for the qualified requirement. Analogous or isomeric compounds that do not have standard substances were tentatively quantified using a similar authorized structure [19,25]. Specifically, the identified AAs, flavonoids, and CAs were quantified by referring to isoleucine, rutin, and chlorogenic acid, respectively.
The contents of 36 identified bioactive and nutritive compounds were quantified in 90 MSLs from different Morus cultivars. For the sum of 16 nutritive AAs, S55, S16, S34, S61, S40, S38, S53, S27, S05, S46, S59, S04, S20, and S37 showed higher values from 10.00 to 13.45 mg/g. Heat map analysis suggested that phenylalanine, leucine tyrosine, isoleucine, valine, proline, tryptophan, and asparagine possessed the major contents in the MSL samples (Figure 5a).
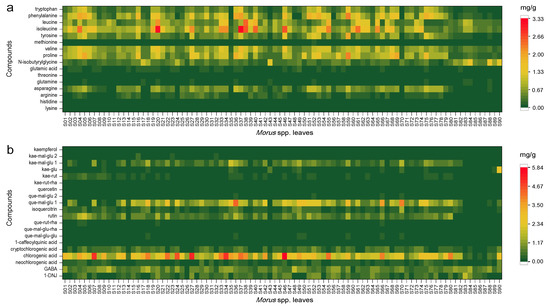
Figure 5.
Amino acids (a) and typical bioactive compounds (b) in different Morus spp. leaves.
The concentrations of 20 bioactive compositions in different MSLs were calculated as shown in Figure 5b. The unique bioactive compound in MSLs was 1-DNJ, which showed over 1.00 mg/g in S64, S84, S20, S53, S56, S52, S27, and S83, from 1.00 to 1.83 mg/g. GABA had values over 1.50 mg/g in S84, S18, S10, and S48, from 1.54 to 1.82 mg/g. Chlorogenic acid possessed high content compared to all qualified compounds, and 80 of the 90 MSL samples had chlorogenic acid content of over 1.10 mg/g. Chlorogenic acid above 5.00 mg/g was detected in S34, S27, and S46 (Figure 5b). Rutin, quercetin-3-O-(6″-O-malonyl)-glucoside (que-mal-glu 1), and kaemferol-3-O-(6″-O-malonyl)-glucoside (kae-mal-glu 1) were the main flavonoids in MSLs. In particular, que-mal-glu 1 showed values of more than 1.50 mg/g in 35 MSL samples, and it showed high content in S66, S70, and S36 from 3.51 to 4.38 mg/g. Most of the wild MSLs (S81–S90) showed low contents of the qualified bioactive compounds. For the sum of 20 bioactive compounds, S33, S27, S20, S50, S75, S42, S51, S24, S80, S34, S37, S52, S07, S35, S22, S59, S70, S18, S66, S49, S46, and S36 exhibited higher values from 10.27 to 15.60 mg/g. As a result, S20, S37, S46, and S59 were screened with high values of nutritive AAs and bioactive compounds that all exceeded 10.00 mg/g in MSL samples.
3.3. Important Variables of M. spp. Leaves
The fact that there were several quantified datasets made the interpretation of MSL quality difficult. Therefore, partial least squares discriminant analysis (PLS-DA) was initially introduced to find important variables in these samples. First, 90 MSL samples were divided according to the species (cultivars), and the PLS-DA score scatter plot was presented (Figure 6a). The corresponding score plot combined with variable importance in the project (VIP > 1) values screened out compounds, namely quercetin-3-O-(6″-O-malonyl)-glucoside (que-mal-glu 1), chlorogenic acid, kaempferol-3-O-rutinoside (kae-rut), rutin, kaempferol-3-O-(6″-O-malonyl)-glucoside (kae-mal-glu 1), isoleucine, valine, N-isobutyrylglycine, and phenylalanine, which were significant constituents of the differences between MSL species (Figure 6b). Then, these samples were divided based on geographical distribution in a PLS-DA score scatter plot (Figure 6c). Similarly, these compounds mentioned above, along with proline and asparagine, were important variables (VIP > 1) for the differences between MSL original types (Figure 6d). The combined results of the PLS-DA data demonstrated that these important variables could serve as key values in evaluating the quality of different MSL samples.
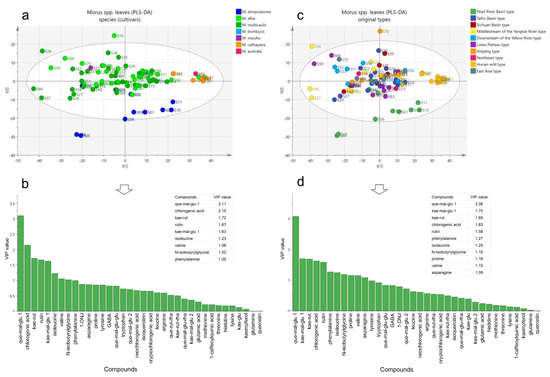
Figure 6.
PLS-DA score scatter plot for different species of Morus spp. leaves (a) and VIP value of compounds (b); PLS-DA score scatter plot for different original types of Morus spp. leaves (c) and VIP value of compounds (d).
3.4. Quality Evaluation of M. spp. Leaves
To comprehensively evaluate the quality of MSL samples according to the screened important variables obtained in PLS-DA analysis, the objective weight (Wj) of each compound was calculated according to the CRITIC method that was based on characteristic conflict (Rj), correlation of indicators (rij), amount of information (Cj), and standard deviation or intensity (σj). In short, the data matrix was established according to the standardized data and formulas (experimental values − experimental minimum)/(experimental maximum − experimental minimum), and the objective weight of each indicator was obtained (Table 2). The calculated formulas are depicted as follows [22]:
Table 2.
Comparison of intensity, conflict, information, and objective weight of each indicator.
This objective method resulted in a comprehensive evaluation of MSL resources from different species and areas of origin (Table 3). Samples S46 (M. multicaulis), S37 (M. multicaulis), S36 (M. multicaulis), S59 (M. alba), S20 (M. multicaulis), S34 (M. multicaulis), S27 (M. multicaulis), S66 (M. alba), S33 (M. alba), S52 (M. multicaulis), etc., had a higher score in the 90 MSL samples, which indicated the excellent potential of these Morus cultivars for higher value application of MSLs in the field of medicine and food.
Table 3.
Comprehensive evaluation of M. spp. leaves from different areas using the CRITIC method.
4. Conclusions
There have been many studies on the chemical composition of mulberry leaves. However, due to the potential existence of isomeric skeletons in MSLs, there were possible attribution errors in the identification of homologous compounds. This study constructed an IS-CID−TCC-CID strategy based on UHPLC-ESI-QTOF-MS/MS that showed the advantage of being able to solve this problem by accurately comparing the skeleton MS/MS spectra of analogous compounds. Meanwhile, semiquantitative determination combined with PLS-DA analysis showed that the major flavonoids (rutin, que-mal-glu 1, kae-rut, and kae-mal-glu 1), chlorogenic acid, and amino acids (isoleucine, phenylalanine, valine, N-isobutyrylglycine, proline, and asparagine) were important indicators of qualitative differences between MSL cultivars. Then, the high-quality MSLs were comprehensively screened in 90 Morus cultivars based on the CRITIC method, which will provide excellent genetic resources for further utilization of MSLs in food and supplement fields.
Author Contributions
Y.-J.H. and X.-Y.Z. conceived and designed the experiments; X.-Y.Z. and Y.-J.H. performed the experiments, analyzed the data, and wrote the paper; Y.-H.Y. and Z.-B.L. prepared the materials; X.-P.Y. participated in the coordination of the experiments; H.Y. helped revise the manuscript. All authors have read and agreed to the published version of the manuscript.
Funding
This research was supported by the Natural Science Foundation of Hunan Province (grant number: 2020JJ4043).
Institutional Review Board Statement
Not applicable.
Informed Consent Statement
Not applicable.
Data Availability Statement
Data are available in the article.
Conflicts of Interest
The authors declare no conflict of interest.
References
- Chan, W.C.; Lye, P.Y.; Wong, S.K. Phytochemistry, pharmacology, and clinical trials of Morus alba. Chin. J. Nat. Med. 2016, 14, 17–30. [Google Scholar] [PubMed]
- Jiao, F.; Luo, R.; Dai, X.; Liu, H.; Yu, G.; Han, S.; Lu, X.; Su, C.; Chen, Q.; Song, Q.; et al. Chromosome-level reference genome and population genomic analysis provide insights into the evolution and improvement of domesticated mulberry (Morus alba). Mol. Plant 2020, 13, 1001–1012. [Google Scholar] [CrossRef] [PubMed]
- Lu, C.; Ji, D.F. Mulberry Cultivars in China; Southwest Normal University Press: Chongqing, China, 2017; Chapter 1. [Google Scholar]
- National Pharmacopoeia Commission. Chinese Pharmacopeia; China Medical Science Press: Beijing, China, 2020.
- Srivastava, S.; Kapoor, R.; Thathola, A.; Srivastava, R.P. Nutritional quality of leaves of some genotypes of mulberry (Morus alba). Int. J. Food Sci. Nutr. 2006, 57, 305–313. [Google Scholar] [CrossRef] [PubMed]
- Butt, M.S.; Nazir, A.; Sultan, M.T.; Schroen, K. Morus alba L. nature’s functional tonic. Trends Food Sci. Technol. 2008, 19, 505–512. [Google Scholar] [CrossRef]
- Gryn-Rynko, A.; Bazylak, G.; Olszewska-Slonina, D. New potential phytotherapeutics obtained from white mulberry (Morus alba L.) leaves. Biomed. Pharmacother. 2016, 84, 628–636. [Google Scholar] [CrossRef]
- Sanchez-Salcedo, E.M.; Tassotti, M.; Del Rio, D.; Hernandez, F.; Martinez, J.J.; Mena, P. (Poly)phenolic fingerprint and chemometric analysis of white (Morus alba L.) and black (Morus nigra L.) mulberry leaves by using a non-targeted UHPLC-MS approach. Food Chem. 2016, 212, 250–255. [Google Scholar] [CrossRef]
- Nastic, N.; Linares, I.; Sanchez, J.; Gajic, J.; Carretero, A. Optimization of the extraction of phytochemicals from black mulberry (Morus nigra L.) leaves. J. Ind. Eng. Chem. 2018, 68, 282–292. [Google Scholar] [CrossRef]
- He, X.R.; Fang, J.C.; Ruan, Y.L.; Wang, X.X.; Sun, Y.; Wu, N.; Zhao, Z.F.; Chang, Y.; Ning, N.; Guo, H.; et al. Structures, bioactivities and future prospective of polysaccharides from Morus alba (white mulberry): A review. Food Chem. 2018, 245, 899–910. [Google Scholar] [CrossRef]
- Thaipitakwong, T.; Numhom, S.; Aramwit, P. Mulberry leaves and their potential effects against cardiometabolic risks: A review of chemical compositions, biological properties and clinical efficacy. Pharm. Biol. 2018, 56, 109–118. [Google Scholar] [CrossRef]
- Katsube, T.; Yamasaki, Y. Apoptosis-inducing activity of ethanol extracts from the tea of mulberry (Morus alba) leaves in HL-60 cells. J. Jpn. Soc. Food Sci. 2002, 49, 195–198. [Google Scholar] [CrossRef][Green Version]
- Pothinuch, P.; Tongchitpakdee, S. Melatonin contents in mulberry (Morus spp.) leaves: Effects of sample preparation, cultivar, leaf age and tea processing. Food Chem. 2011, 128, 415–419. [Google Scholar] [CrossRef] [PubMed]
- Charunuch, C.; Tangkanakul, P.; Limsangouan, N.; Sonted, V. Effects of extrusion conditions on the physical and functional properties of instant cereal beverage powders admixed with mulberry (Morus alba L.) leaves. Food Sci. Technol. Res. 2008, 14, 421–430. [Google Scholar] [CrossRef][Green Version]
- Zhang, G.Q.; Cai, X.Y.; Zhang, Y.J. Research development of mulberry leaf food. Farm Prod. Process 2017, 435, 43–45. [Google Scholar]
- He, Y.J.; Zhou, Y.; Qin, Y.; Zhou, Z.S.; Zhu, M.; Zhu, Y.Y.; Wang, Z.J.; Xie, T.Z.; Zhao, L.X.; Luo, X.D. Development of a LC-HRMS based approach to boost structural annotation of isomeric citrus flavanones. Phytochem. Anal. 2021, 32, 749–756. [Google Scholar] [CrossRef]
- He, Y.J.; Zhu, M.; Zhou, Y.; Zhao, K.H.; Zhou, J.L.; Qi, Z.H.; Zhu, Y.Y.; Wang, Z.J.; Xie, T.Z.; Tang, Q.; et al. Comparative investigation of phytochemicals among ten citrus herbs by ultra high performance liquid chromatography coupled with electrospray ionization quadrupole time-of-flight mass spectrometry and evaluation of their antioxidant properties. J. Sep. Sci. 2020, 43, 3349–3358. [Google Scholar] [CrossRef]
- Tang, Q.; Zhang, R.Y.; Zhou, J.L.; Zhao, K.H.; Lu, Y.; Zheng, Y.J.; Wu, C.Q.; Chen, F.; Mu, D.T.; Ding, Z.X.; et al. The levels of bioactive ingredients in Citrus aurantiumL. at different harvest periods and antioxidant effects on H2O2-induced RIN-m5F cells. J. Sci. Food Agr. 2021, 101, 1479–1490. [Google Scholar] [CrossRef]
- He, Y.J.; Qin, Y.; Zhang, T.L.; Zhu, Y.Y.; Wang, Z.J.; Zhou, Z.S.; Xie, T.Z.; Luo, X.D. Migration of (non-) intentionally added substances and microplastics from microwavable plastic food containers. J. Hazard. Mater. 2021, 417, e126074. [Google Scholar] [CrossRef]
- Trovato, E.; Arigo, A.; Vento, F.; Micalizzi, G.; Dugo, P.; Mondello, L. Influence of citrus flavor addition in brewing process: Characterization of the volatile and non-volatile profile to prevent frauds and adulterations. Separations 2021, 8, 18. [Google Scholar] [CrossRef]
- Almalki, A.H.; Ali, N.A.; Elroby, F.A.; El Ghobashy, M.R.; Emam, A.A.; Naguib, I.A. ESI-LC-MS/MS for therapeutic drug monitoring of binary mixture of pregabalin and tramadol: Human plasma and urine applications. Separations 2021, 8, 21. [Google Scholar] [CrossRef]
- He, Y.J.; Chen, Y.; Shi, Y.T.; Zhao, K.H.; Tan, H.Y.; Zeng, J.G.; Tang, Q.; Xie, H.Q. Multiresponse optimization of ultrasonic-assisted extraction for Aurantii Fructus to obtain high yield of antioxidant flavonoids using a response surface methodology. Processes 2018, 6, 258. [Google Scholar] [CrossRef]
- Lu, Y.; Zhu, S.; He, Y.; Mo, C.; Wu, C.; Zhang, R.; Zheng, X.; Tang, Q. Systematic characterization of flavonoids from Siraitia grosvenorii leaf extract using an integrated strategy of high-speed counter-current chromatography combined with ultra high performance liquid chromatography and electrospray ionization quadrupole time-of-flight mass spectrometry. J. Sep. Sci. 2020, 43, 852–864. [Google Scholar] [PubMed]
- Zhang, J.Y.; Zhang, Q.; Li, N.; Wang, Z.J.; Lu, J.Q.; Qiao, Y.J. Diagnostic fragment-ion-based and extension strategy coupled to DFIs intensity analysis for identification of chlorogenic acids isomers in Flos Lonicerae Japonicae by HPLC-ESI-MS(n). Talanta 2013, 104, 1–9. [Google Scholar] [CrossRef] [PubMed]
- Kruve, A. Strategies for drawing quantitative conclusions from nontargeted liquid chromatography-high-resolution mass spectrometry analysis. Anal. Chem. 2020, 92, 4691–4699. [Google Scholar] [CrossRef] [PubMed]


Publisher’s Note: MDPI stays neutral with regard to jurisdictional claims in published maps and institutional affiliations. |
© 2022 by the authors. Licensee MDPI, Basel, Switzerland. This article is an open access article distributed under the terms and conditions of the Creative Commons Attribution (CC BY) license (https://creativecommons.org/licenses/by/4.0/).