Abstract
Vitamin A (retinol) and some of its derivatives are a group of fat-soluble compounds used in cosmetic products as bioactive ingredients. Therefore, it is necessary to perform the quality control of final product to ensure their efficacy and safety. A simple and rapid method to determine retinol, retinal, retinyl acetate, retinyl propionate and retinyl palmitate in cosmetics is presented here. The method is based on vortex and/or ultrasound-assisted leaching of the analytes in ethanol followed by liquid chromatography with ultraviolet detection. The analytical performance of the method was evaluated. It has shown high levels of linearity, at least up to 100 µg mL−1; high precision with RSD values below 14% and high sensitivity with low MLODs ranging between 0.3 × 10⁻⁴ and 5.9 × 10⁻⁴ % w/w, which are enough to monitor these compounds in cosmetic products. The proposed method was successfully applied to seven commercial cosmetic samples to detect and quantify the target analytes, showing the method is suitable for its employment for quality control in cosmetic industries. Cosmetic samples were spiked at two levels of concentration and recovery values around 100% were obtained, showing no significant matrix effects and, therefore, external calibration was adequate for this determination.
1. Introduction
Vitamins can be classified in two different groups as a result of their different chemical structure: water- and fat-soluble vitamins [1]. Vitamin A is classified as a fat-soluble vitamin group (i.e., retinoids) and it is used in general term to refer to retinol, retinal, retinoic acid, and retinyl esters. However, in a narrower sense, vitamin A is only referred to retinol [2]. These retinoids show structural and/or functional similarities [3], and present an essential role in human diet. Moreover, some of them, such as retinol, retinal, retinyl acetate, retinyl propionate and retinyl palmitate, have been also widely used as bioactive ingredients in cosmetic products due to their efficiency towards oxidative stress, epidermis renewing and skin diseases such as acne and psoriasis [4,5,6].
Retinoic acid (i.e., tretinoin) and its salts are considered as pharmaceutical drugs, present risk of teratogenicity [7] and are specifically prohibited in the European Regulation on Cosmetic Products [8]. Retinol and the other above-mentioned vitamin A derivatives are allowed in cosmetics and their concentration is not limited at the moment. However, the European Scientific Committee on Consumer Safety issued its positive opinion on the safety of retinol, retinyl acetate and retinyl palmitate, but specifying which are the concentrations that can be considered safe (less than 0.05% in body lotions and 0.3% in hand and face creams as well as rinse-off products) [9].
Therefore, analytical methods for the simultaneous determination of retinoids in cosmetics samples are required in order to perform the quality control for both to achieve the desired efficacy and to ensure the consumers’ safety.
Retinoids have been determined in different matrices, such as food, pharmaceutical preparations and biological fluids, employing liquid chromatography (LC) coupled to tandem mass spectrometry, and with ultraviolet (UV) detection, fluorescence spectrometry, capillary electrophoresis and electrochemical detection [10,11,12]. Regarding cosmetic products, there are no official methods for the simultaneous determination of retinol and its derivatives in cosmetic samples, and the published analytical methods related to the quantification of some retinoids are scarce. Retinol has been determined in different cosmetic matrices by LC-UV [13] and UV spectrophotometry [5], whereas some LC-UV methods have been described to determine retinyl palmitate, as the most commonly used retinol-derivative [14,15,16]. On the other hand, about the simultaneous determination of different retinoids, only combinations of a few retinoids have been described: retinol, retinal and retinoic acid by differential pulse voltammetry and LC-UV [17]; retinol, retinyl palmitate and retinoic acid by LC-UV [18]; retinol, retinyl palmitate and retinyl acetate by LC-UV [19]; and retinyl acetate and retinyl palmitate by cyclic voltammetry [20]. It should be also noted that retinyl propionate has not been determined in none of these publications, and moreover these methods require the use of organic solvents such as methanol, n-hexane, dichloromethane, or chloroform in both sample preparation and analysis.
Considering all the above, the main aim of this work is to develop a rapid and simple analytical method for the simultaneous quantification of the five most common retinoids (Table 1) in cosmetic samples. The proposed method is based on LC-UV technique with a rapid treatment of the sample, by simple dilution with ethanol, a more benign solvent than those usually employed [21], and without requiring multistage sample preparation procedures. It provides similar or improved analytical features than the previous works with similar purpose, allowing to perform both pre- and in-market analytical control in the cosmetic sector.

Table 1.
Chemical structure and some relevant data of the target analytes.
2. Materials and Methods
2.1. Reagents and Samples
Retinol (ROL) ≥ 95%, all-trans-retinal (RAL) ≥ 98%, retinyl propionate (RPr) ≥ 98%, retinyl acetate (RAc) pharmaceutical secondary standard from Sigma-Aldrich (St. Louis, MO, USA); and retinyl palmitate (RPal) 1.7 M.I.U./g from Alfa Aesar (Kandel, Germany) were used as standards. The chemical structures and relevant data are presented in Table 1.
LC-grade absolute ethanol (EtOH) from Panreac (Barcelona, Spain), and deionized water obtained from a Connect water purification system provided by Adrona (Riga, Latvia) were used to prepare the chromatographic mobile phase. Considering the chemical features of the analytes, butylhydroxytoluene (BHT) from Guinama S.L. (Valencia, Spain) was used as antioxidant reagent in the standard and sample solutions.
Seven commercial cosmetic samples of different formulation (i.e., a night moisturizer (S1), a rejuvenating face mask (S2), a hand cream (S3), an anti-age serum (S4), and three anti-age creams (S5–S7)) were purchased at local stores and analyzed by the proposed method. Due to confidentiality reasons, their brands are not mentioned. A summary of the declared retinoid in the cosmetic label is presented in Table 2.

Table 2.
Summary of the declared retinoids in the cosmetic label.
2.2. Apparatus
An Agilent 1220 Infinity LC system with a degasser, a binary pump, an autosampler with up to 100 μL injection volume, a thermostated column oven, and a variable wavelength UV/V is detector was used. Data acquisition and processing were performed with ‘Agilent LC ChemStation v.04.03’ software from Agilent Technologies (Palo Alto, CA, USA).
A ZX3 vortex mixer from VELP Scientifica (Usmate Velate, Italy) and an Ultrasons-HD ultrasonic bath from JP Selecta (Barcelona, Spain) were used to ease the dispersion of the samples.
2.3. Proposed Method
2.3.1. Preparation of Standards and Sample Solutions
A solution of EtOH (containing 50 µg mL−1 of BHT as antioxidant) was used as solvent (hereinafter, ethanolic solution). A stock standard solution containing 100 µg mL−1 of the five target retinoids was prepared. This stock solution was stable for at least one month at −20 °C. From this solution, working calibration solutions (1–10 µg mL−1) were freshly prepared by proper dilution with the ethanolic solution.
Sample solutions were prepared by weighing 0.01–0.5 g of cosmetic sample into a 10-mL volumetric flask. For this purpose, a small amount of the sample was placed on the tip of a Pasteur pipette and carefully deposited on the inner walls of the volumetric flask. Then, it was dissolved and diluted up to the line with the ethanolic solution. The samples that were not completely dissolved were stirred by vortex and/or sonication (ca. 5 min) to carry out the leaching of the analytes and the solutions were filtered throughout 0.22-µm nylon filters to remove non-soluble compounds. Finally, both standard and sample solutions were placed into amber injection vials for LC-UV analysis.
2.3.2. Chromatographic Analysis
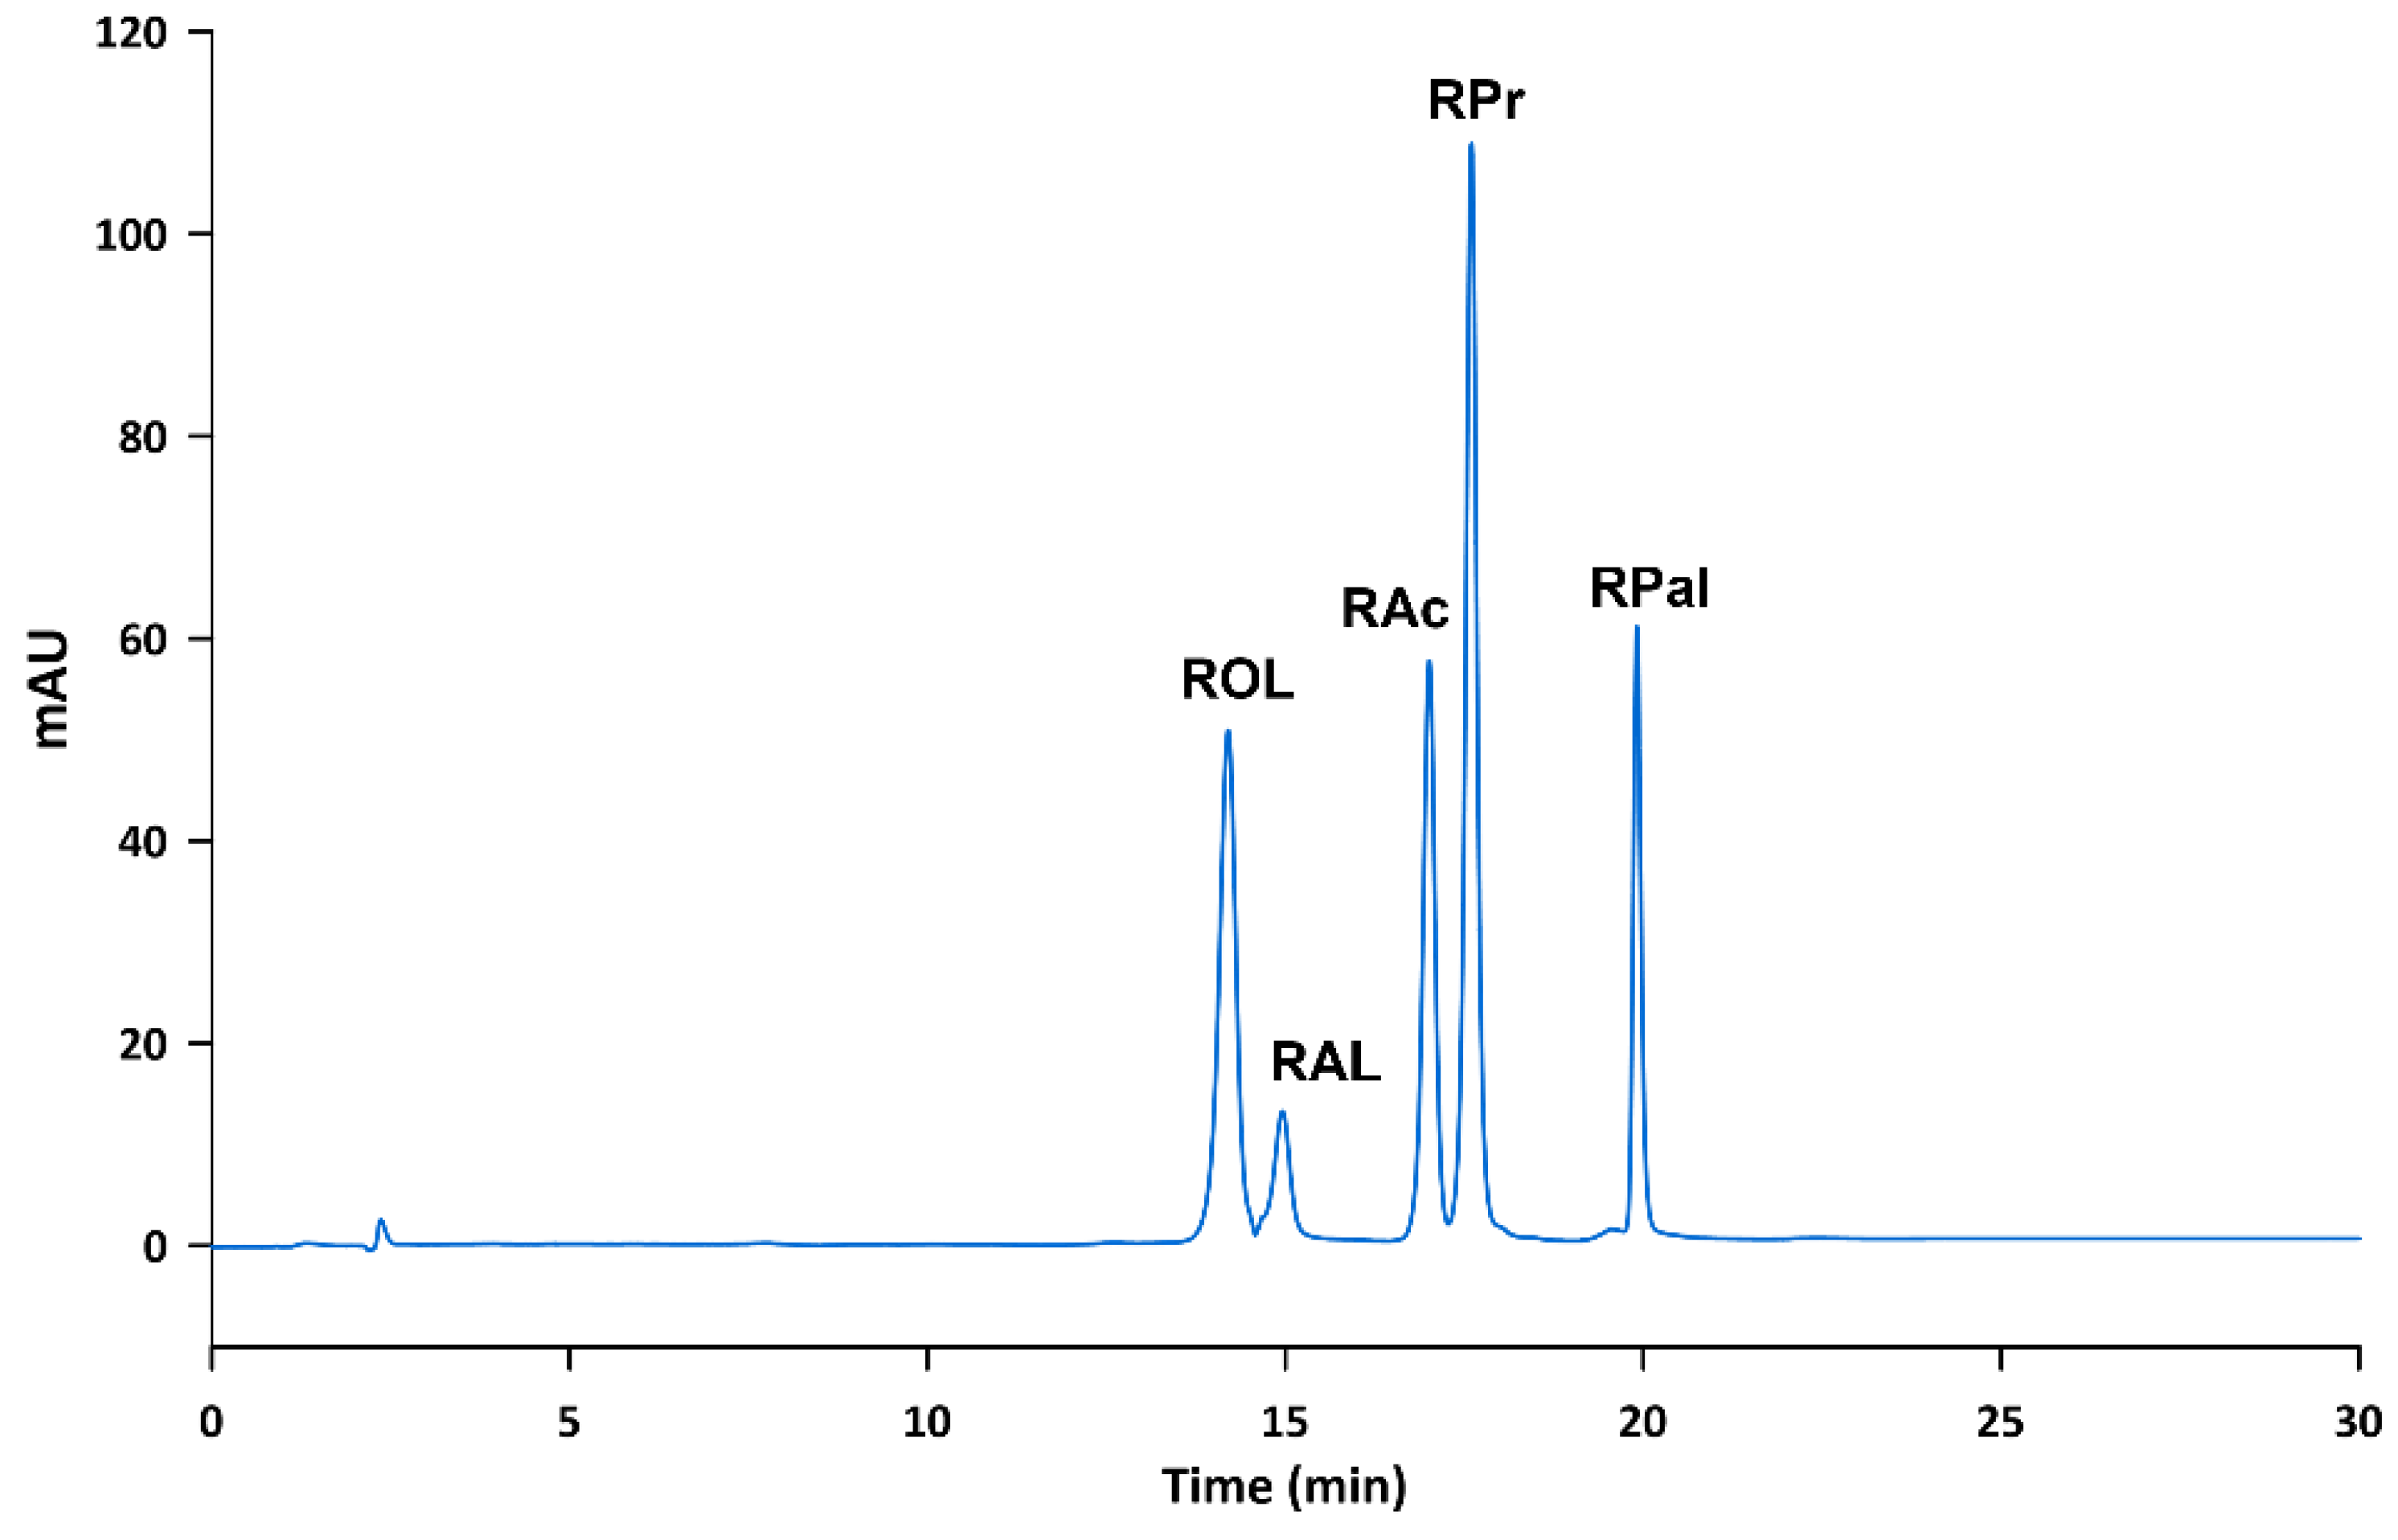
A LiChrospher® 60 RP-select B (250 mm length, 4 mm I.D., 5 µm particle size) column from Merck (Darmstadt, Germany) was used for the chromatographic separation. Twenty microliters of standard or sample solution were injected into the chromatographic system. Mobile phase consisted of water (solvent A) and ethanol (solvent B), and the pump supplied the following gradient program: 0 to 8 min, 55% solvent B; 8 to 16 min linear gradient to 83% solvent B; 16 to 16.1 min linear gradient to 100% solvent B, held for 8 min; and 24 to 24.1 min return to 55% solvent B and held for 6 min. The run time was 30 min. The flow rate was set at 1 mL min−1 and the column temperature was maintained constant at 40 °C. Given that the absorption maximum of the analytes lies at 325 nm except for RAL, whose absorption maximum lies at 380 nm, a compromise wavelength of 350 nm was selected. Figure 1 shows a chromatogram obtained according to the proposed method.
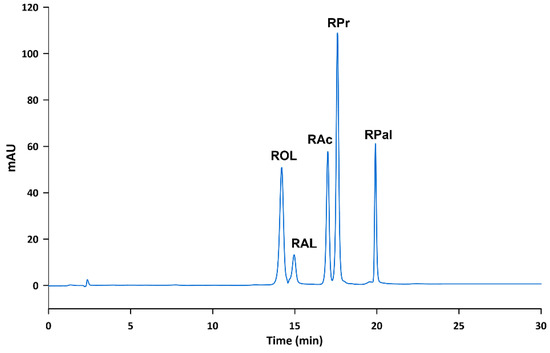
Figure 1.
Chromatogram of a standard solution containing the analytes at 10 µg mL−1 obtained according to the proposed method.
3. Results and Discussion
3.1. Study of the Chromatographic Variables
With the aim of obtaining the best chromatographic resolution in the shortest analysis time, different variables, such as chromatographic column, oven temperature and composition of mobile phase were studied. To carry out these studies, a standard solution containing ROL and RAL at 25 µg mL−1 was firstly used due to their structural similarity. Once ROL and RAL were chromatographically resolved, a standard solution containing all the target analytes at 25 µg mL−1 was employed to separate the most non-polar analytes (i.e., RAc, RPr and RPal). Water and EtOH were selected as solvents for the mobile phase. Non-buffered water was used since the target analytes are not ionizable and, therefore, not affected by pH. EtOH was preferred as organic modifier over other typical solvents, such as methanol or acetonitrile, due to its less toxic nature, being the proposed method more environmentally friendly than those previously reported.
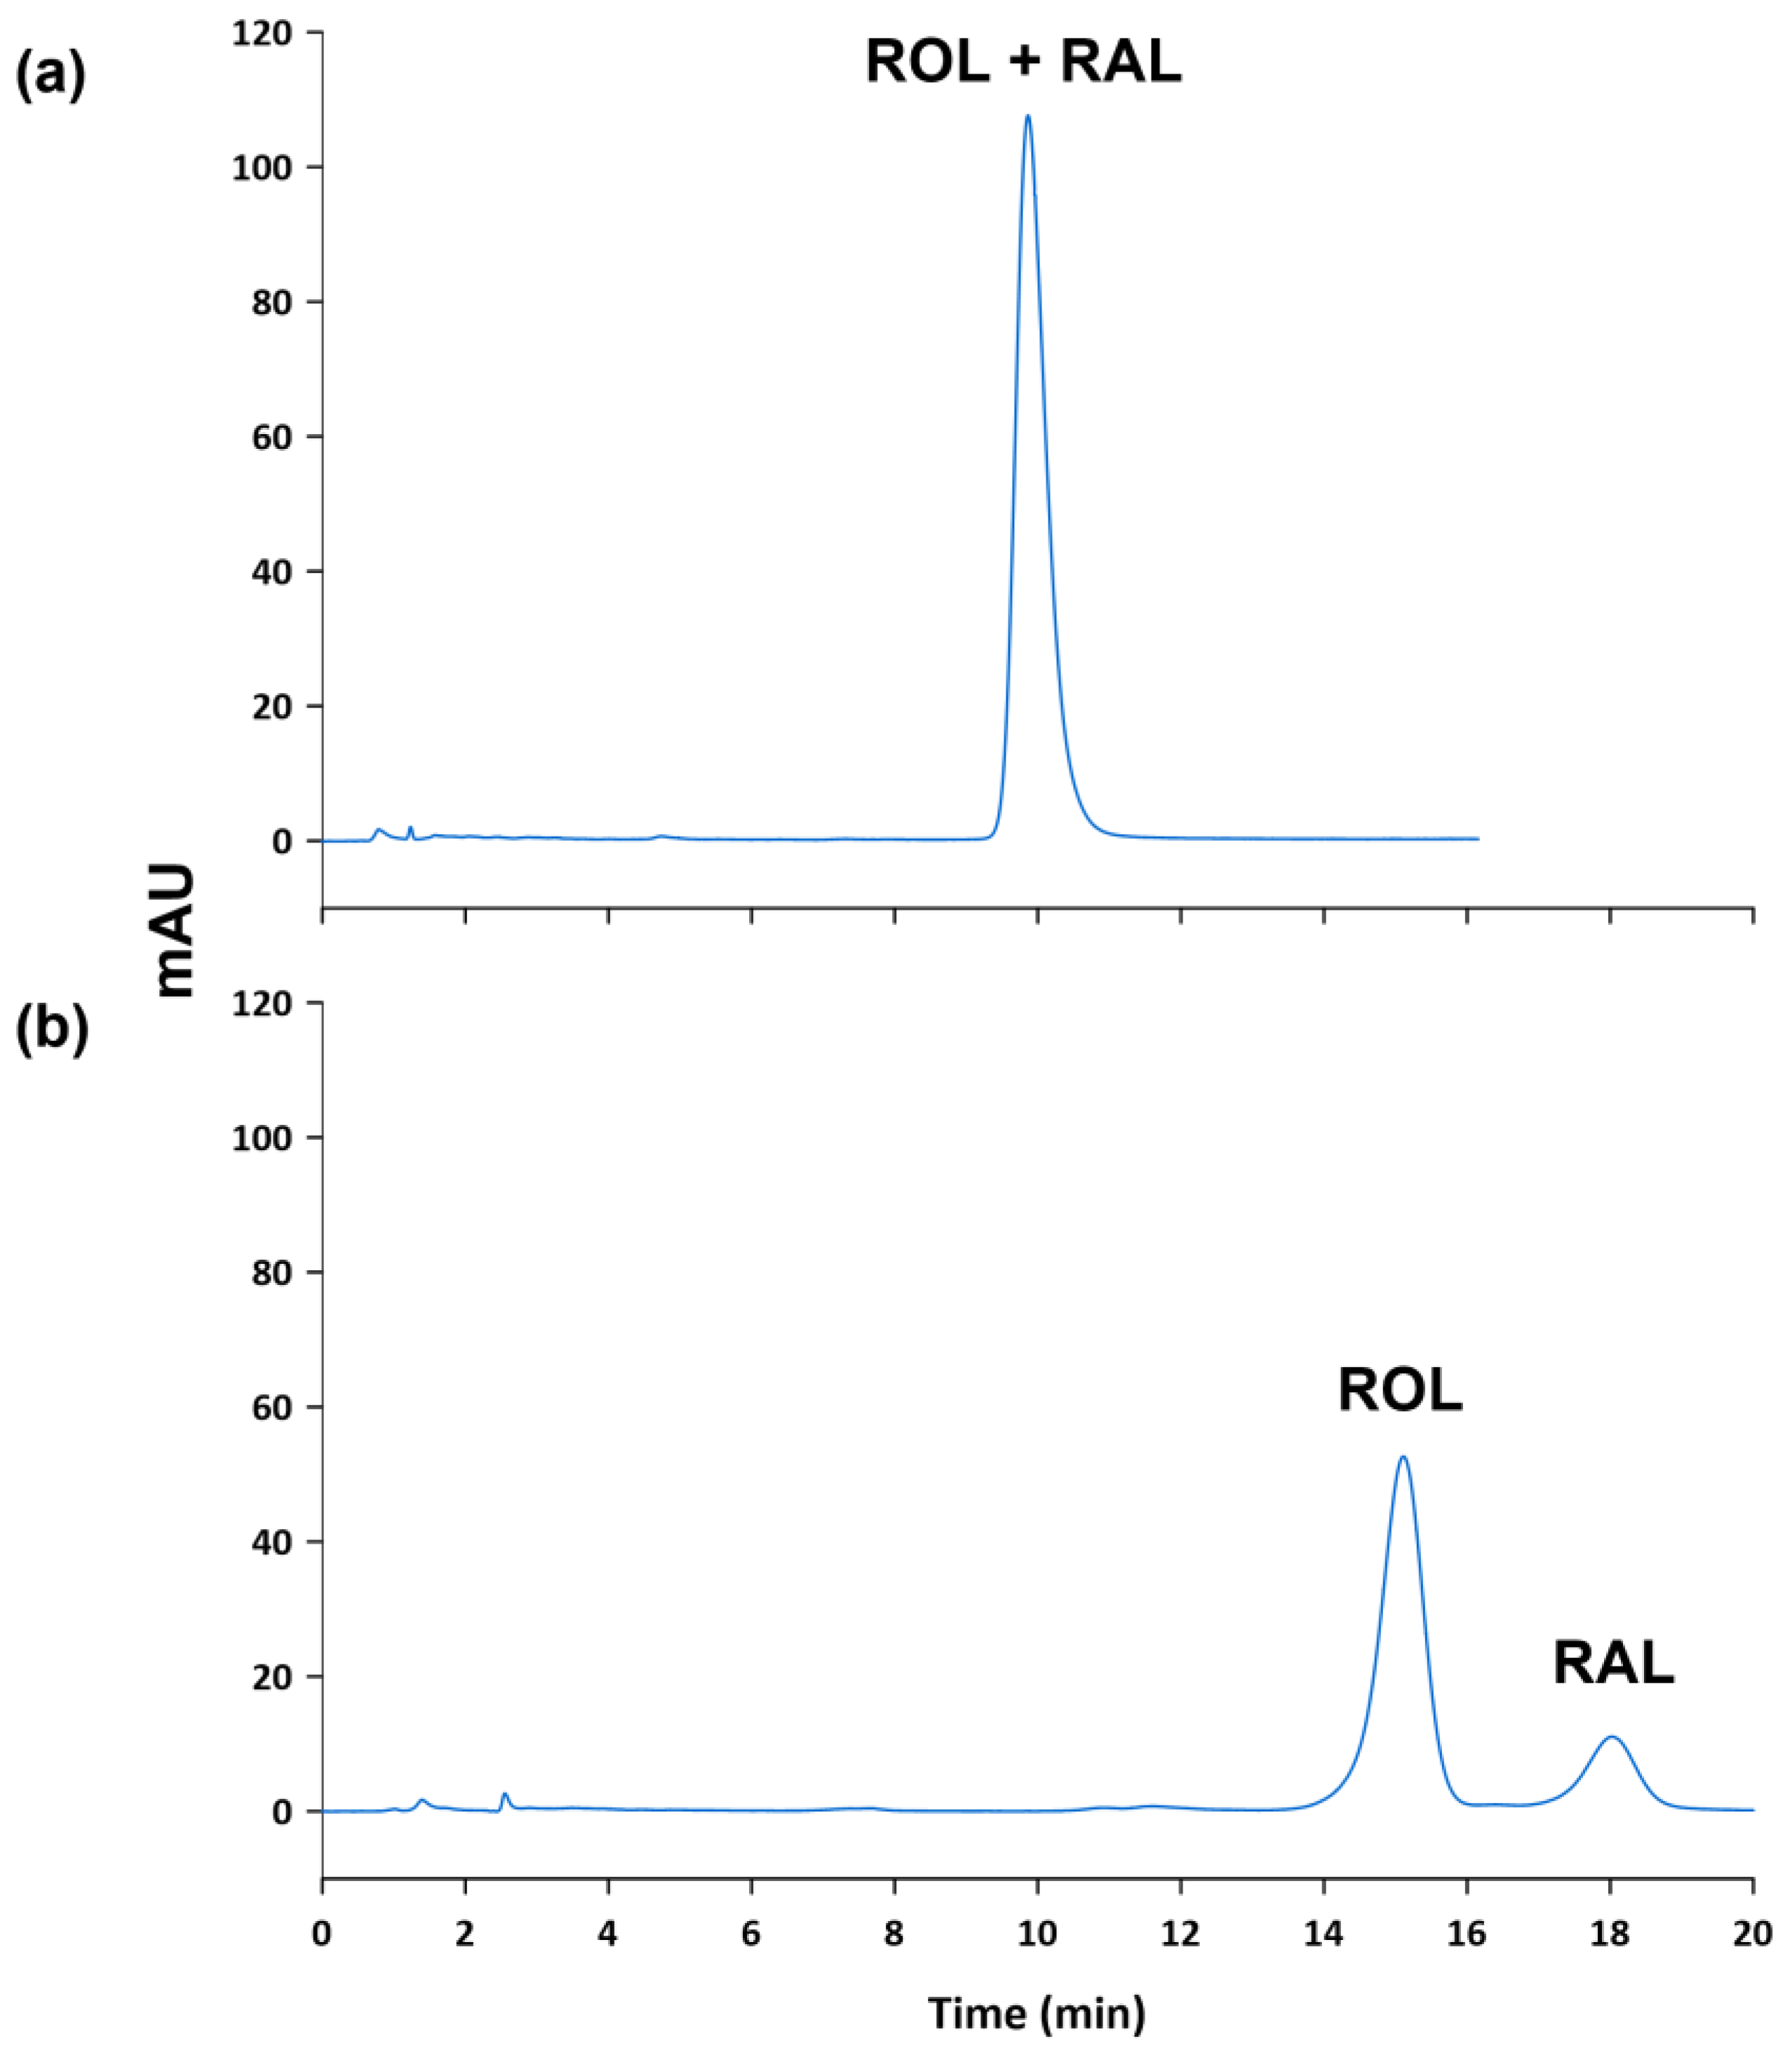
Different reversed-phase columns were used to study the effect of the column packing, while maintaining constant the composition of the mobile phase (i.e., 60% of EtOH by isocratic elution) and the oven temperature (i.e., 25 °C). First, a Purospher® STAR RP-18 endcapped (125 mm length, 4 mm I.D., 5 µm particle size) was tested, but ROL and RAL were completely overlapped. In order to separate them, less elution force was tested (i.e., 50% of EtOH), but the analytes did not elute in reasonable chromatographic times. Consequently, a LiChrospher® 100 RP-18 (250 mm length, 4 mm I.D., 5 µm particle size) was then used in order to observe the effect of the column length. The increase of the column length did not achieve to resolve ROL and RAL peaks in a reasonable time. For this reason, alternative column packings (i.e., C8 columns) were tested. In this sense, when a LiChrospher® 60 Select-B (250 mm length, 4 mm I.D., 5 µm particle size) was used, ROL and RAL peaks were resolved in approximately 20 min. In order to reduce these retention times, a LiChrospher® 60 Select-B (125 mm length, 4 mm I.D., 5 µm particle size) was tested but ROL and RAL peaks overlapped again (see Figure 2). Thus, a LiChrospher® 60 Select-B (250 mm length, 4 mm I.D., 5 µm particle size) was selected for further analysis.
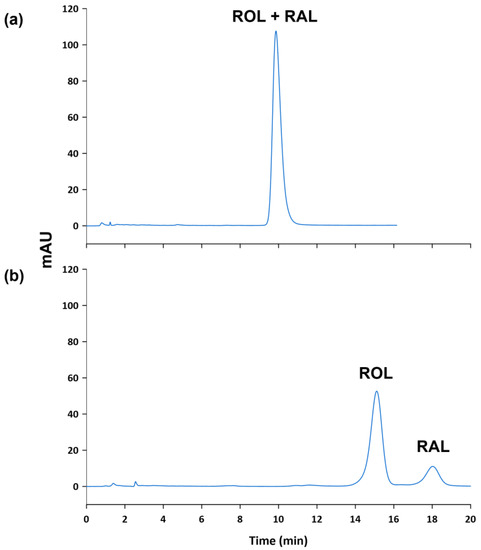
Figure 2.
Chromatograms of a standard solution containing ROL and RAL at 10 µg mL−1 obtained using a (a) LiChrospher® 60 Select-B (125 mm × 4 mm, 5 µm), and (b) a LiChrospher® 60 Select-B (250 mm × 4 mm, 5 µm).
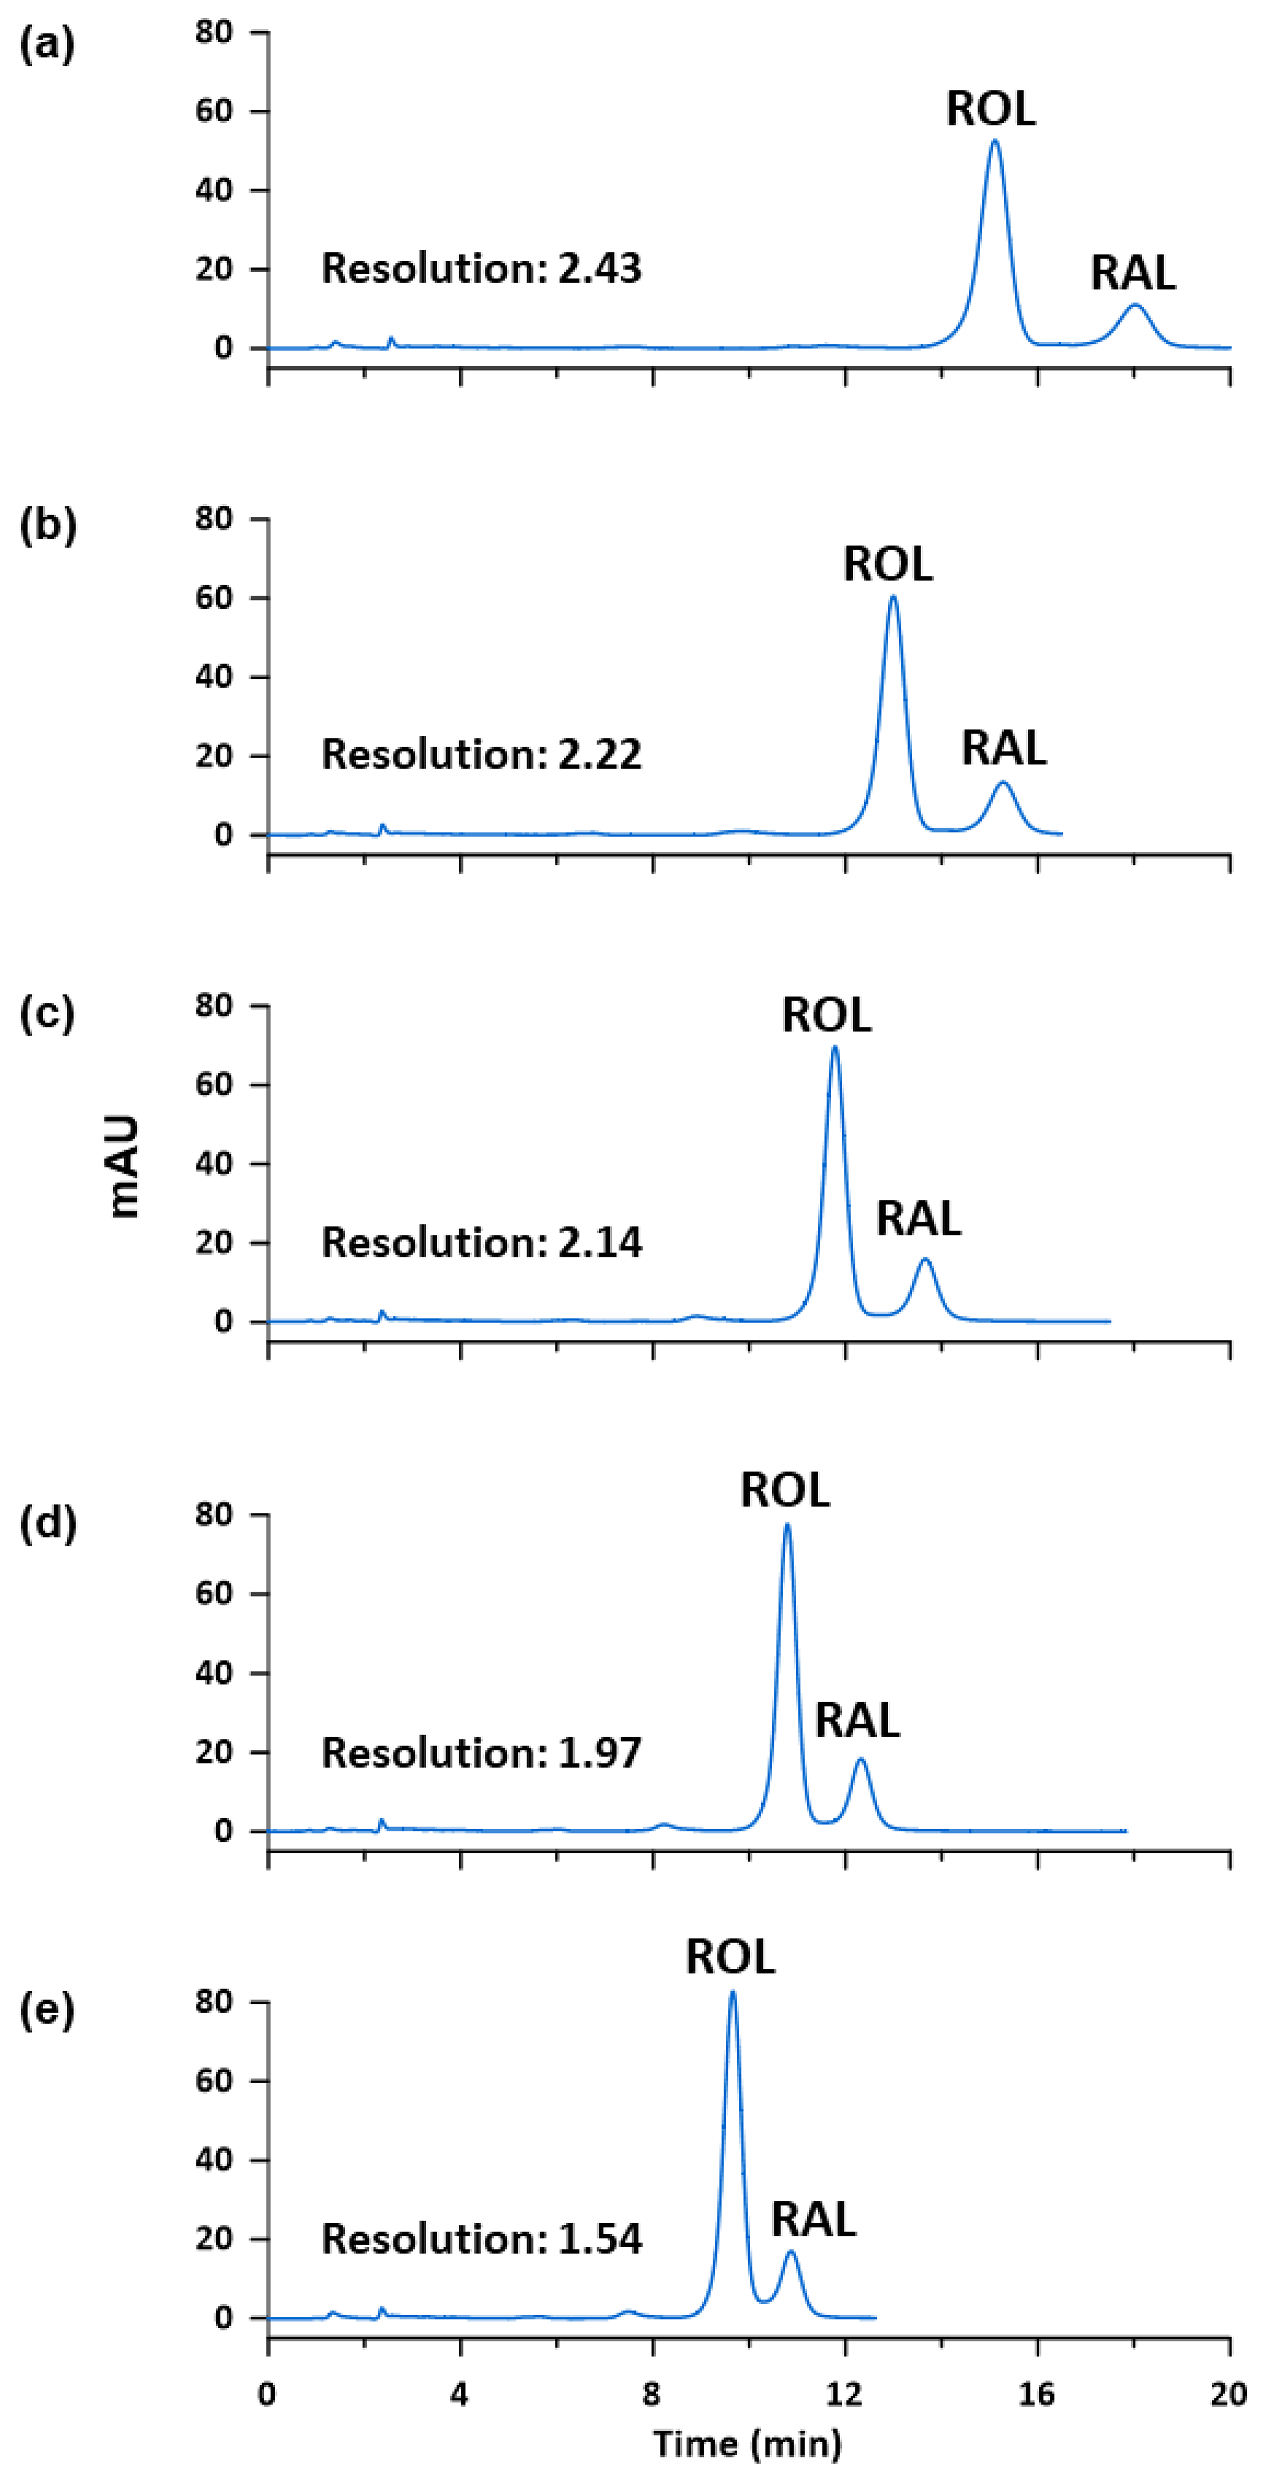
Regarding the oven temperature, different values between 25 and 45 °C were tested in order to improve the resolution of the peaks and to reduce the retention times. The composition of the mobile phase was set at 60% of EtOH by isocratic elution, in a LiChrospher® 60 Select-B (250 mm length, 4 mm I.D., 5 µm particle size). As the oven temperature increased, the resolution of the peaks, provided by the software, decreased from 2.43 to 1.54, and the retention time got lower (see Figure 3). Nevertheless, when the oven temperature was set at 45 °C, a partial overlapping between ROL and RAL was observed due to the asymmetry of both peaks even though resolution was greater than 1.5. Thus, 40 °C was selected for further analysis.
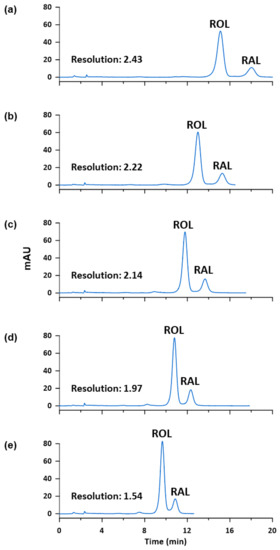
Figure 3.
Chromatograms of a standard solution containing ROL and RAL at 10 µg mL−1 obtained at (a) 25 °C, (b) 30 °C, (c) 35 °C, (d) 40 °C and (e) 45 °C.
Finally, once column packing and oven temperature were selected, a gradient elution program was optimized in order to achieve the best resolution for all the target analytes. In this sense, starting with 55% of EtOH for 8 min, and then a linear gradient to 83% for other 8 min, improved the resolution of ROL and RAL peaks making them less wide. Moreover, this linear gradient allowed to elute RAc and RPr with a good resolution. RPal was finally eluted when the gradient turned to 100% of EtOH due to its high lipophilic character.
3.2. Sample Treatment
Samples with different cosmetic formulation were assayed (i.e., a night moisturizer, a rejuvenating face mask, a hand cream, an anti-age serum, and three anti-age creams) in order to find a green sample treatment that was common for all of them, regardless of their matrix.
EtOH containing 50 µg mL−1 of BHT was used as a solvent due to several reasons: (i) the target retinoids are highly soluble at working concentration levels in this solvent, (ii) they are stabilized by the antioxidant action of BHT [22], (iii) they are satisfactorily leached without the necessity of total dissolution, and (iv) it is a suitable solvent for LC-UV.
This procedure only required a brief shaking assisted by ca. 5 min of vortex and/or sonication in order to achieve the complete leaching of the target analytes to the organic phase from the cosmetic matrix. It should be mentioned that the retinoids remained stable during the sonication of the sample solution for at least 10 min.
3.3. Analytical Figures of Merit of the Developed Method
Analytical parameters of the proposed method were evaluated in terms of linearity, limits of detection and quantification, and repeatability. These results are summarized in Table 3.

Table 3.
Analytical figures of merit of the developed method.
The linearity reached at least up to 100 µg mL−1 for all the analytes, obtaining good coefficients of determination (R2 > 0.998). The working range to prepare the external calibration was established from 1 to 10 µg mL−1.
The instrumental limits of detection (ILOD) and quantification (ILOQ) were calculated as 3 and 10 times the signal-to-noise ratio (S/N), respectively, of a standard solution at 1 µg mL−1. They were at the low µg mL−1 level, ranging from 0.02 to 0.3 µg mL−1 and from 0.06 to 1.0 µg mL−1, respectively. The method limits of detection (MLOD) and quantification (MLOQ), considering the maximum recommended weight of sample and its dilution, ranged from 0.3 × 10⁻⁴ to 5.9 × 10⁻⁴ % w/w and 1.1 × 10⁻⁴ to 19.3 × 10⁻⁴ % w/w, respectively. The low limits and wide linear range allow to determine the target analytes in a wide range of concentrations.
The precision of the method was evaluated by applying the developed method to five independent replicates of standard solution containing all the target analytes at three concentration levels (i.e., 1, 10 and 25 µg mL−1) on the same day (intra-day precision) and on five consecutive days (inter-day precision). As it is shown in Table 3, the results expressed as relative standard deviation (RSD, %) ranged from 0.7 to 13.8%, showing the good precision of the proposed method.
System suitability test was carried out to ensure the chromatographic parameters are acceptable for the intended application. In this sense, Table 4 shows values of retention time, asymmetry factor, number of theoretical plates per meter and retention factor for each analyte in a 10 µg mL−1 standard solution.

Table 4.
System suitability test for a standard solution of 10 µg mL−1 applying the proposed method.
3.4. Analysis of Commercially-Available Cosmetic Samples
Seven commercially available cosmetic samples (samples S1–S7) were prepared by triplicate as specified in Section 2.3.1 and injected into the LC system under the selected conditions. The results obtained by using the proposed method are shown in Table 5.

Table 5.
Retinoids content in seven commercial cosmetics applying the proposed method.
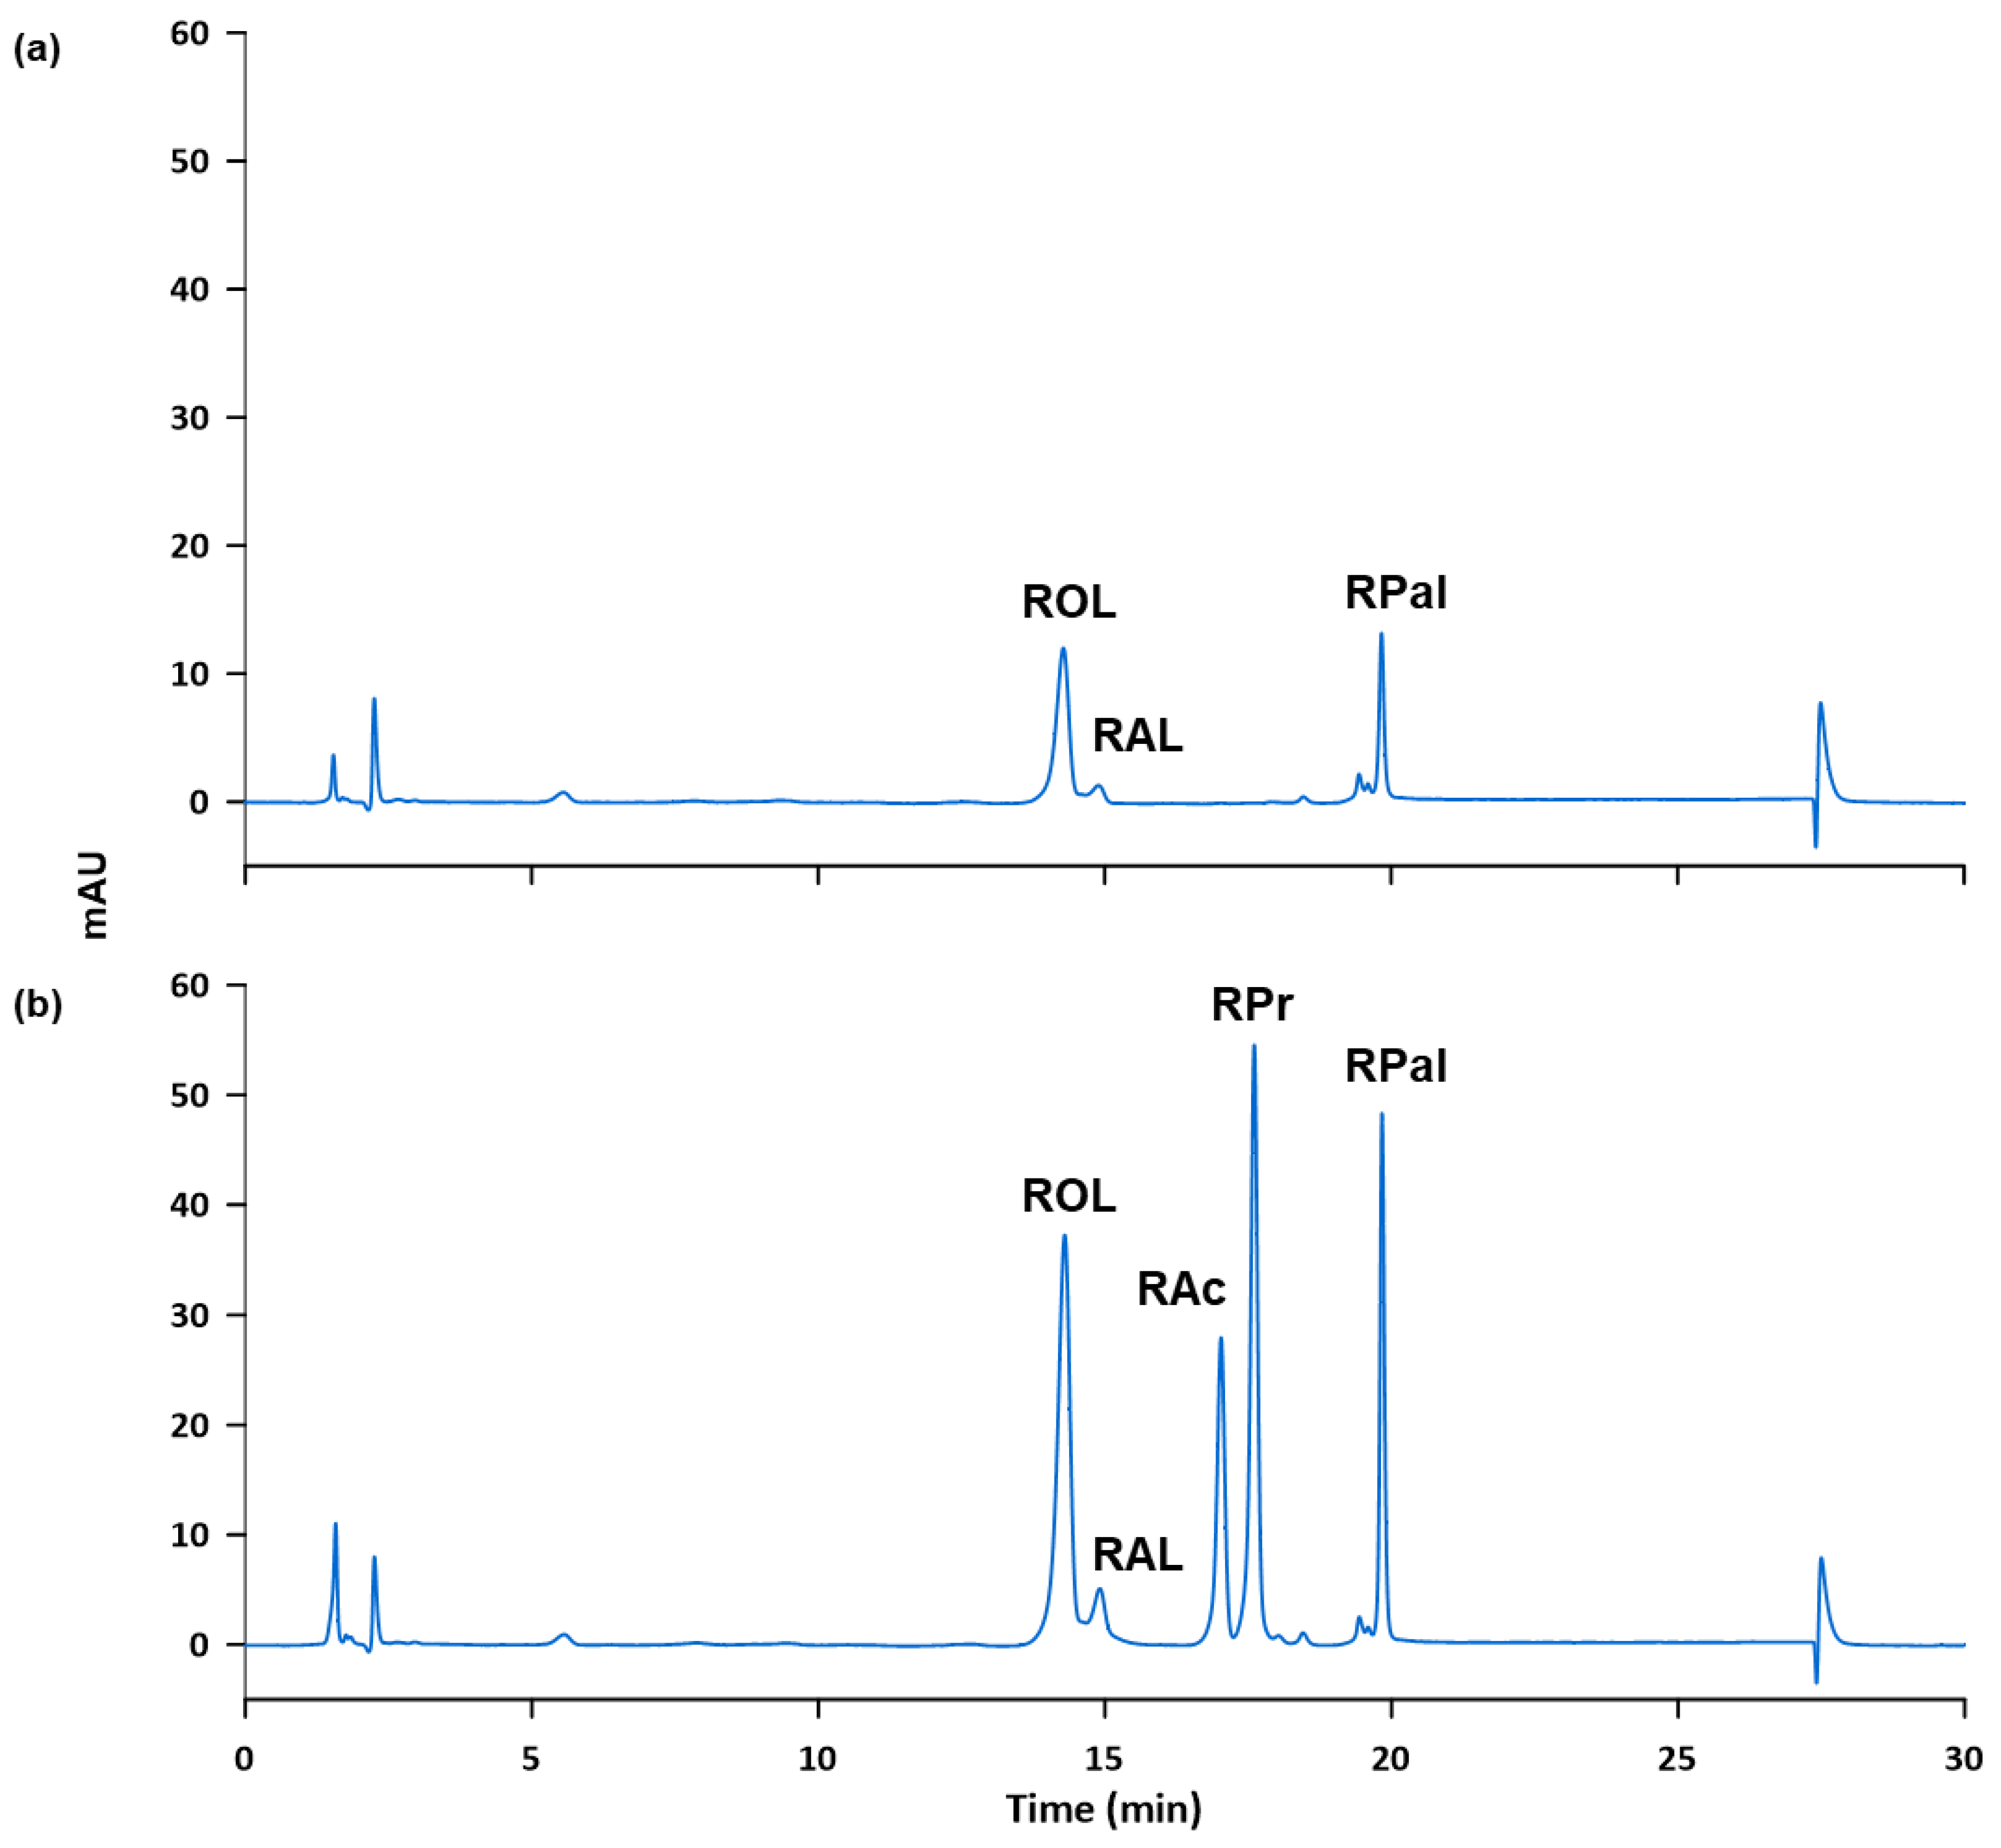
Subsequently, the accuracy and possible matrix effects were evaluated by performing recovery studies. Two fortifications were done to get 2 µg mL−1 and 4 µg mL−1, respectively, of the standards in the final sample solution. To achieve this, samples were weighed as indicated in Section 2.3.1, the corresponding volume of the 100 µg mL−1 standard solution was added to fortify the sample and the appropriate dilution was made. The process was carried out in triplicate for each level of fortification and the fortified samples were analyzed according to the proposed method. The obtained recovery values, shown in Table 6, ranged from 79 and 117%, revealing negligible matrix effects and that external calibration can be used as described in the proposed method. Figure 4 shows, as example, the chromatograms obtained for the cosmetic sample S5 (a) unfortified and (b) fortified at 4 µg mL−1.

Table 6.
Recovery values of the target compounds in the analyzed cosmetic samples.
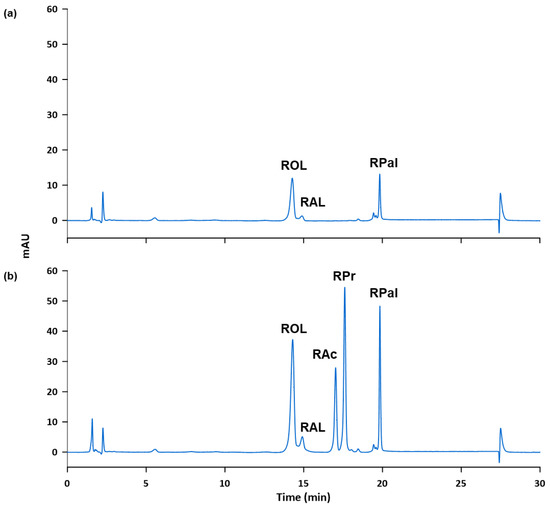
Figure 4.
Chromatogram of sample S5 obtained according to the proposed method: (a) unfortified and (b) fortified at 4 µg mL−1.
According to the labels, the seven commercial cosmetic products analyzed should contain several retinoids (see Table 2), but Table 5 shows that some of the retinoids indicated in the label were undetected. As described above, matrix effects were negligible in cosmetic samples and low limits of detection were achieved (see Table 3). Given that samples and standards were kept in right conditions to avoid degradation and that both were injected in the same chromatographic conditions, results indicate that the analytes that have not been detected must be, if present, in a very low concentration, being their efficacy as active ingredients questionable.
3.5. Advantages of the Proposed Method: Evaluation of the Greenness of the Proposed Sample Preparation
A comparison of the proposed method with other previously published methods with similar purpose is presented in Table 7. The proposed method allows to determine simultaneously the highest number of retinoids (i.e., retinol and four derivatives), whereas in the other methods only a maximum of three retinoids is determined. RPr was not determined in any of the previously published methods.

Table 7.
Comparison of the proposed approach with other methods for the determination of retinoids in cosmetic products.
Moreover, these other methods require the use of organic solvents such as tetrahydrofuran, n-hexane, or ethyl acetate. As a consequence, these approaches result less environmentally friendly than the proposed method.
A wide variety of methodologies to evaluate the greenness of analytical methods have been described, such as the Analytical Eco-Scale [23], the Green Analytical Procedure Index (GAPI) [24] and the Green Certificate [25]. The proposed sample preparation has been evaluated according to the Green Certificate, which assigns penalty points to those aspects of the method that differ from the principles of Green Analytical Chemistry [26] (i.e., use of reagents, consumed energy, operational hazards and generated wastes), stablishing a scale from A to G. Penalty points assigned to the proposed method are: (i) 2.5 points due to the use of 10 mL per sample of ethanol; (ii) 3.8 points due to the generated waste of 10 mL per sample of ethanol; (iii) 2 points due to the energy consumption of the ultrasound-assisted leaching, and (iv) 0 points due to the low energy consumption of the vortex instrument (i.e., <0.1 kWh). Hence, with a total of 8.3 penalty points, the sample treatment is considered a class A method (less than 10 penalty points), being in accordance with the principles of Green Analytical Chemistry.
4. Conclusions
In this work, a simple and rapid method for the simultaneous determination of vitamin A and four of its derivatives in hygiene and personal care products is presented. This method based on LC-UV after a simple vortex and/or ultrasound-assisted leaching of the target compounds has shown high levels of linearity, at least up to 100 µg mL−1; high precision with RSD values below 14 % and high sensitivity with low MLODs ranging between 0.3 × 10⁻⁴ and 5.9 × 10⁻⁴ % w/w, which are enough to monitor these compounds in cosmetic products. Recovery values around 100% showed that matrix effects were negligible and, thus external standard calibration is appropriate for quantification.
The method was successfully applied to commercial cosmetic samples, it is effective for the quantification of these analytes and therefore it can be useful for manufacturers to ensure the quality, efficacy and safety of cosmetic products.
Additionally, the proposed sample treatment is safe for both the operator and the environment, being in line with current trends set by Green Analytical Chemistry.
Author Contributions
Conceptualization, V.V.-G., C.A., J.L.B., A.C. and A.S.; methodology, V.V.-G., A.C. and A.S.; validation, V.V.-G., C.A., J.L.B., A.C. and A.S.; formal analysis, S.C.-O.; investigation, V.V.-G., S.C.-O. and C.A.; resources, J.L.B., A.C. and A.S.; data curation, S.C.-O.; writing—original draft preparation, V.V.-G. and C.A.; writing—review and editing, J.L.B., A.C. and A.S.; supervision, J.L.B., A.C. and A.S.; project administration, A.C. and A.S.; funding acquisition, A.C. and A.S. All authors have read and agreed to the published version of the manuscript.
Funding
Authors thank the Generalitat Valenciana and the European Social Fund for the predoctoral grant of V.V.-G. (ACIF/2020/107); and the Spanish Ministry of Universities for the predoctoral grant of C.A. (FPU19/04239).
Institutional Review Board Statement
Not applicable.
Informed Consent Statement
Not applicable.
Data Availability Statement
Not applicable.
Conflicts of Interest
The authors declare no conflict of interest. The funders had no role in the design of the study; in the collection, analyses, or interpretation of data; in the writing of the manuscript, or in the decision to publish the results.
References
- Casas, C. Vitamins. In Analysis of Cosmetic Products, 1st ed.; Salvador, A., Chisvert, A., Eds.; Elsevier: Amsterdam, The Netherlands, 2007; pp. 364–379. [Google Scholar]
- Takahashi, N.; Saito, D.; Hasegawa, S.; Yamasaki, M.; Imai, M. Vitamin A in Health Care: Suppression of Growth and Induction of Differentiation in Cancer Cells by Vitamin A and Its Derivatives and Their Mechanisms of Action. Pharmacol. Ther. 2021, 107942, in press. [Google Scholar] [CrossRef] [PubMed]
- Ross, A.C. Retinol: Properties and Determination. In Encyclopedia of Food and Health, 1st ed.; Elsevier: Amsterdam, The Netherlands, 2015; Volume 1, pp. 604–609. [Google Scholar]
- European Commission. Commission Decision of 9 February 2006 Amending Decision 96/335/EC Establishing an Inventory and a Common Nomenclature of Ingredients Employed in Cosmetic Products. Official Journal of the European Union, 5 April 2006; L97. [Google Scholar]
- Zasada, M.; Budzisz, E.; Kolodziejska, J.; Kalinowska-Lis, U. An Evaluation of the Physicochemical Parameters and the Content of the Active Ingredients in Original Formulas Containing Retinol. J. Cosmet. Dermatol. 2020, 19, 2374–2383. [Google Scholar] [CrossRef] [PubMed]
- CosIng Database—European Comission Database for Information on Cosmetic Substances and Ingredients. Available online: https://ec.europa.eu/growth/tools-databases/cosing/index.cfm?fuseaction=search.simple (accessed on 11 January 2022).
- Mukherjee, S.; Date, A.; Patravale, V.; Korting, H.C.; Roeder, A.; Weindl, G. Retinoids in the Treatment of Skin Aging: An Overview of Clinical Effi Cacy and Safety. Clin. Interv. Aging 2006, 1, 327–348. [Google Scholar] [CrossRef]
- Regulation (EC), No. 1223/2009 of the European Parliament and of the Council of 30 November 2009 on Cosmetic Products, and Its Successive Amendments. Official Journal of the European Union, 22 December 2009; L342.
- Rousselle, C. Opinion of the Scientific Committee on Consumer Safety (SCCS)—Final Version of the Opinion on Vitamin A (Retinol, Retinyl Acetate and Retinyl Palmitate) in Cosmetic Products. Regul. Toxicol. Pharm. 2017, 84, 102–104. [Google Scholar] [CrossRef]
- Fanali, C.; D’Orazio, G.; Fanali, S.; Gentili, A. Advanced Analytical Techniques for Fat-Soluble Vitamin Analysis. TrAC—Trends Anal. Chem. 2017, 87, 82–97. [Google Scholar] [CrossRef]
- Karaźniewicz-Łada, M.; Głõwka, A. A Review of Chromatographic Methods for the Determination of Water- and Fat-Soluble Vitamins in Biological Fluids. J. Sep. Sci. 2016, 39, 132–148. [Google Scholar] [CrossRef]
- Wang, X.; Li, K.; Yao, L.; Wang, C.; Van Schepdael, A. Recent Advances in Vitamins Analysis by Capillary Electrophoresis. J. Pharm. Biomed. Anal. 2018, 147, 278–287. [Google Scholar] [CrossRef]
- Akhavan, A.; Levitt, J. Assessing Retinol Stability in a Hydroquinone 4%/Retinol 0.3% Cream in the Presence of Antioxidants and Sunscreen under Simulated-Use Conditions: A Pilot Study. Clin. Ther. 2008, 30, 543–547. [Google Scholar] [CrossRef]
- Scalia, S.; Renda, A.; Ruberto, G.; Bonina, F.; Menegatti, E. Assay of Vitamin A Palmitate and Vitamin E Acetate in Cosmetic Creams and Lotions by Supercritical Fluid Extraction and HPLC. J. Pharm. Biomed. Anal. 1995, 13, 273–277. [Google Scholar] [CrossRef]
- Wang, L.H.; Huang, S.H. Determination of Vitamins A, D, E, and K in Human and Bovine Serum, and β-Carotene and Vitamin A Palmitate in Cosmetic and Pharmaceutical Products, by Isocratic HPLC. Chromatographia 2002, 55, 289–296. [Google Scholar] [CrossRef]
- Guaratini, T.; Gianeti, M.D.; Campos, P.M.B.G.M. Stability of Cosmetic Formulations Containing Esters of Vitamins E and A: Chemical and Physical Aspects. Int. J. Pharm. 2006, 327, 12–16. [Google Scholar] [CrossRef]
- Wang, L.H. Simultaneous Determination of Retinal, Retinol and Retinoic Acid (All-Trans and 13-Cis) in Cosmetics and Pharmaceuticals at Electrodeposited Metal Electrodes. Anal. Chim. Acta 2000, 415, 193–200. [Google Scholar] [CrossRef]
- Hubinger, J.C. Determination of Retinol, Retinyl Palmitate, and Retinoic Acid in Consumer Cosmetic Products. J. Cosmet. Sci. 2009, 60, 485–500. [Google Scholar] [CrossRef]
- Temova Rakuša, Ž.; Škufca, P.; Kristl, A.; Roškar, R. Quality Control of Retinoids in Commercial Cosmetic Products. J. Cosmet. Dermatol. 2021, 20, 1166–1175. [Google Scholar] [CrossRef]
- Jashari, G.; Musliu, A.; Sýs, M.; Arbneshi, T.; Mikysek, T.; Švancara, I.; Metelka, R. Simultaneous Determination of Lipophilic Vitamin Esters Using Square-Wave Voltammetry at the Glassy Garbon Electrode. Electroanalysis 2021, 33, 537–542. [Google Scholar] [CrossRef]
- Eldin, A.B.; Ismaiel, O.A.; Hassan, W.E.; Shalaby, A.A. Green Analytical Chemistry: Opportunities for Pharmaceutical Quality Control. J. Anal. Chem. 2016, 71, 861–871. [Google Scholar] [CrossRef]
- Carlotti, M.E.; Rossatto, V.; Gallarate, M. Vitamin A and Vitamin A Palmitate Stability over Time and under UVA and UVB Radiation. Int. J. Pharm. 2002, 240, 85–94. [Google Scholar] [CrossRef]
- Gałuszka, A.; Migaszewski, Z.M.; Konieczka, P.; Namieśnik, J. Analytical Eco-Scale for Assessing the Greenness of Analytical Procedures. TrAC—Trends Anal. Chem. 2012, 37, 61–72. [Google Scholar] [CrossRef]
- Płotka-Wasylka, J. A New Tool for the Evaluation of the Analytical Procedure: Green Analytical Procedure Index. Talanta 2018, 181, 204–209. [Google Scholar] [CrossRef]
- Armenta, S.; de la Guardia, M.; Namieśnik, J. Green Microextraction. In Analytical Microextraction Techniques; Valcarcel, M., Cárdenas, S., Lucena, R., Eds.; Bentham Science Publishers: Sharjah, United Arab Emirates, 2016; pp. 3–27. [Google Scholar]
- Gałuszka, A.; Migaszewski, Z.; Namieśnik, J. The 12 Principles of Green Analytical Chemistry and the SIGNIFICANCE Mnemonic of Green Analytical Practices. TrAC—Trends Anal. Chem. 2013, 50, 78–84. [Google Scholar] [CrossRef]
Publisher’s Note: MDPI stays neutral with regard to jurisdictional claims in published maps and institutional affiliations. |
© 2022 by the authors. Licensee MDPI, Basel, Switzerland. This article is an open access article distributed under the terms and conditions of the Creative Commons Attribution (CC BY) license (https://creativecommons.org/licenses/by/4.0/).

