Abstract
Mixotrophic denitrification has showed great potential for treating wastewater with a low C/N ratio. Mixotrophic denitrification is the process combining autotrophic denitrification and heterotrophic denitrification in one system. It can compensate the disadvantage of the both denitrifications. Instead of using sodium acetate and glucose as carbon source for the heterotrophic denitrification, agriculture solid wastes including rice straw (RS), wheat straw (WS), and corncob (CC) were employed in this study to investigate their potential as carbon source for treating low C/N wastewater. The carbon releasing pattern of the three carbon rich materials has been studied as well as their capacity in denitrification. The results showed that the highest denitrification occurred in the corncob system which was 0.34 kg N/(m3·d). Corncob was then selected to combine with sulfur beads to build the mixotrophic denitrification system. The reactor packed with sulfur bead on the top and corncob on the bottom achieved 0.34 kg N/(m3·d) denitrification efficiency, which is higher than that of the reactor packed with completely mixed sulfur bead and corncob. The autotrophic denitrification and heterotrophic denitrification were 42.2% and 57.8%, respectively. The microorganisms in the sulfur layer were Thermomonas, Ferritrophicum, Thiobacillus belonging to autotrophic denitrification bacteria. Kouleothrix and Geothrix were mostly found in the corncob layer, which have the function for fiber hydrolysis and denitrification. The study has provided an insight into agriculture solid waste application and enhancement on denitrification of wastewater treatment.
1. Introduction
Due to the great concern on the eutrophication of water bodies, a discharge limit on nitrogen concentration in the effluent of wastewater treatment becomes more strictly needed than before in China [1]. Municipal wastewater treatment normally consists of an aerobic step and anoxic step; sometimes anaerobic steps are also involved when phosphorus removal is required. In aerobic step, organic matters generally presented as chemical oxygen demand (COD) are removed and ammonia nitrogen is converted to nitrate through nitrification. In anoxic, nitrate is turned into nitrogen gas which finally leads to the nitrogen removal from wastewater. It can be seen that nitrification and denitrification are the key steps for nitrogen removal from municipal wastewater by biological processes. In fact, nitrification can be easily accomplished through the aerobic process in current wastewater treatment. The denitrification is the main obstacle. Denitrification requires a carbon source as an electron donor; however, the municipal wastewater generally contains low organic matters (low COD concentration) in China [2,3]. It suggests that COD is consumed during aerobic step and there is no (or less) extra carbon source left for denitrification.
Sulfur-based autotrophic denitrification can achieve denitrification without the requirement of a carbon source. However, it demands chemical addition to neutralize the alkalinity and generates SO42− which could cause the inhibition of microorganism activity. Engaging heterotrophic denitrification with autotrophic denitrification to establish the mixotrophic denitrification can overcome the shortage of sulfur-based autotrophic denitrification. The combination of heterotrophic denitrification with autotrophic denitrification is considered as mixotrophic denitrification. Mixotrophic denitrification has been reported for nitrogen removal in drinking water treatment, wetland, and advanced treatment of wastewater [4,5,6]. The alkalinity generated by heterotrophic denitrification can neutralize the proton generated by autotrophic denitrification [4]. The pH could be kept at around 6.5 to 7 which is suitable for denitrification. In addition, the SO42− formed in mixotrophic denitrification is less compared to the solo autotrophic denitrification [7,8].
To achieve heterotrophic denitrification in mixotrophic denitrification to treat low C/N wastewater, methanol, acetate and glucose are normally used as carbon sources [9,10,11]. In addition, a new type of carbon source, rhamnolipid, a biosurfactant generated by bacteria, has also been utilized [12]. These types of carbon sources are soluble and can easily be assimilated by heterotrophic denitrification bacteria, but it is very difficult to control the dosage which might cause the COD concentration in the effluent over the discharging limit. It suggests that slow carbon releasing materials are highly required. Solid carbon sources, including polyvinyl alcohol (PVA), carrageenan (CG), polylactic acid (PLA), polycaprolactone (PCL), and some their composites have been used as slow-release carbon sources in mixotrophic denitrification, and the solid carbon source utilization showed enhanced denitrification performance [3,13,14,15,16,17]. The carbon can slowly release from the solid carbon source during degradation by microorganisms, and thus eliminates the risk of COD concentration exceeding the discharging limit. It reveals that instead of using the soluble materials or chemicals as a carbon source, solid carbon source would be a better choice to provide carbon in denitrification. Simultaneous nitrification and denitrification were found in the solid carbon source denitrification process, which would be one of the reasons for nitrogen removal enhancement [3]. In addition, solid carbon sources could provide the adsorption surface for denitrifying bacteria to attach to, which would assist to enrich the denitrifying bacteria in the system and hence improve denitrification.
Chemical solid carbon sources are costly. To make the process sustainable, carbon-rich solid wastes are a great replacement. Agriculture wastes, such as crop residues, contain plenty of organic carbon. Crop residues are generated in large quantities and their annual yield was up to around 970 × 106 tons in China in 2019 [18]. Combustion for cooking and heating is the main method for their management which has been slowly banned due to the air pollution concern. It has been reported that corncob could be used as solid carbon source, and supporters of biofilm in constructed wetland and treating low-carbon-nitrogen wastewater, as it could slowly release dissolved organic carbon [19,20,21]. A positive effect on nitrogen removal has been observed and the total nitrogen concentration was reduced to around 3 mg/L which meets the Class 1A of Integrated Wastewater Discharge Standard. The utilization of crop residual as a carbon source in wastewater treatment could be a sustainable way of handling solid waste management and treatment.
Crop residues have been attempted to be used for carbon supply in denitrification [20,22,23]; however, their utilization as carbon sources and biofilm carriers in mixotrophic denitrification has not been reported. It is still unknown if they would be potential carbon sources in mixotrophic denitrification for treating low C/N wastewater. Therefore, it is of great significance to study this aspect.
In this study, agriculture wastes including rice straw (RS), wheat straw (WS), and corncob (CC) were tested for their capacity as a carbon source in denitrification. A biofilter has been constructed with sulfur beads and corncob to form a mixotrophic denitrification system. The denitrification performance of different packing style has been investigated. The cooperation of the autotrophic denitrification and the heterotrophic denitrification has been revealed.
2. Materials and Methodology
2.1. Materials
Elemental sulfur (S0) beads were used as an energy source for autotrophic denitrification in this study which were purchased from Guoxing Huagong Co., Ltd. (Anqing city Anhui province of China). Rice straw (RS), wheat straw (WS), and corncob (CC) were obtained from Hengrui Material of Gongyi in China. The sizes of the S0 beads and the solid carbon source are in the range of 5 mm to 7 mm.
Seed sludge for denitrification was collected from the biological step of a wastewater treatment plant in Shenzhen of China. Synthetic wastewater was used to investigate the denitrification in this study. For the solo autotrophic and solo heterotrophic denitrification, the wastewater contains (per L): 45–55 mg NO3−-N, 13 mg TP, 10 mg Mg2+, and 5 mg Ca2+. While for the mixotrophic denitrification, the NO3−-N concentration was set at 30–35 mg/L, but others were kept the same.
2.2. The Carbon Release Column Experiment
The solid carbon sources including rice straw, wheat straw, and corncob were well washed before utilization. The water collected from washing was analyzed and it is considered to be acceptable once their COD concentration were less than 5 mg/L. Then the solid material was used for carbon releasing experiment. The experiment was conducted in a cylindrical polyvinyl chloride (PVC) column filled with 10 g of the solid carbon source. The distilled water was run through the reactor with a hydraulic retention time (HRT) of 1 h. Samples (10 mL) were taken at 1 h, 3 h, 6 h, 12 h, 24 h, 36 h, 48 h, 60 h, 72 h, 96 h, 120 h and 168 h. The samples were used to determine the BOD20, COD concentration, ammonia nitrogen (NH4+-N), nitrate (NO3−-N), total nitrogen concentration (TN), and total phosphorus concentration (TP).
2.3. The Denitrification Experiment
The denitrification experiments were carried out in continuous flow bioreactors (CFR) made of cylindrical polyvinyl chloride with a diameter of 25.6 mm and a working volume of 100 L. Sampling ports are located on the side of the reactor.
2.3.1. Heterotrophic Denitrification
For heterotrophic denitrification, the reactor was filled with RS, WS, and CC which were merged into wastewater sludge (suspended solid concentration of 2500~4000 mg/L) for 24 h before being placed into the reactors, respectively. The influent with a nitrite concentration of 40~50 mg/L was pumped by peristaltic pump continuously into the reactor from the bottom and the effluent was collected from the top of the reactor. The HRT was set at 4 h in the beginning and then reduced to 2 h once the removal efficiency was above 80% and kept stable.
2.3.2. Mixotrophic Denitrification
The mixotrophic denitrification system was formed by S0 to achieve autotrophic denitrification and corncob to achieve heterotrophic denitrification. Two types of packing were studied. One is that the reactors packed with the well mixed corncob and S0, and other one is that the reactors packed with corncob on the bottom and S0 on the top. The corncob and S0 were well mixed and then packed in the reactor in the former case. The mixing volume ratio of corncob and S0 was fixed at 1:1, 1:2, 2:1, and 3:2 for different reactor. The total packing volume was 500 mL. In the later cases, the volume ratio (corncob: S0) of the packing is the same as the mixed system, which includes 1:1, 1:2, 2:1, and 3:2, and the total packing volume was 500 mL.
The solid materials were treated similar way as described in heterotrophic denitrification before being packed in the columns. The NO3−-N feeding was in the range of 40 to 50 mg/L. The initial HRT was 4 h to develop the biofilm in the reactor and then the HRT was adjusted to 2 h when the denitrification rate of the reactor reached over 80%.
2.4. The Analytic Methods
The concentrations of COD, TN, NH3-N, NO3−, NO2− and TP were determined according to the standard methods reported by APHA [24]. Sulfate concentration was analyzed with ion chromatography. The pH and alkalinity were determined with pH meter and titration, respectively. The surface morphology of the biofilm on the thermoplastic synthetic filler and after biofilm stripping were characterized by scanning electron microscopy (SEM). The microorganisms presenting in the denitrification system were identified by Polymerase Chain Reaction-Denaturing Gradient Gel Electrophoresis (PCR-DGGE).
3. Results and Discussion
3.1. The Carbon and Nutrient Release from Solid Carbon Source
To investigate the potential of the three crop residues: RS, WS, and CC, as carbon source for heterotrophic denitrification, the BOD5, BOD20 and COD concentration were determined for the samples collected from 1 h, 3 h, and 6 h. It was found that the COD concentration was almost same as the BOD20 concentration for the same sample. For instance, the COD concentration was 70.3 ± 1.7 mg/L and the BOD20 concentration was 67.5 ± 3.3 mg/L for the sample collected at 3 h from the rector packed with WS, and others are similar trend. It suggests that the released carbon from the agriculture wastes is mainly organic and degradable carbon. It is known that agriculture wastes mainly contain organic materials. As it is known that COD analysis can be done in few hours, but BOD20 analysis takes 20 days, and the study has revealed that COD could be used to express the biodegradability of the agriculture wastes. Hence, the COD concentration was employed to represent the organic carbon concentration in this study.
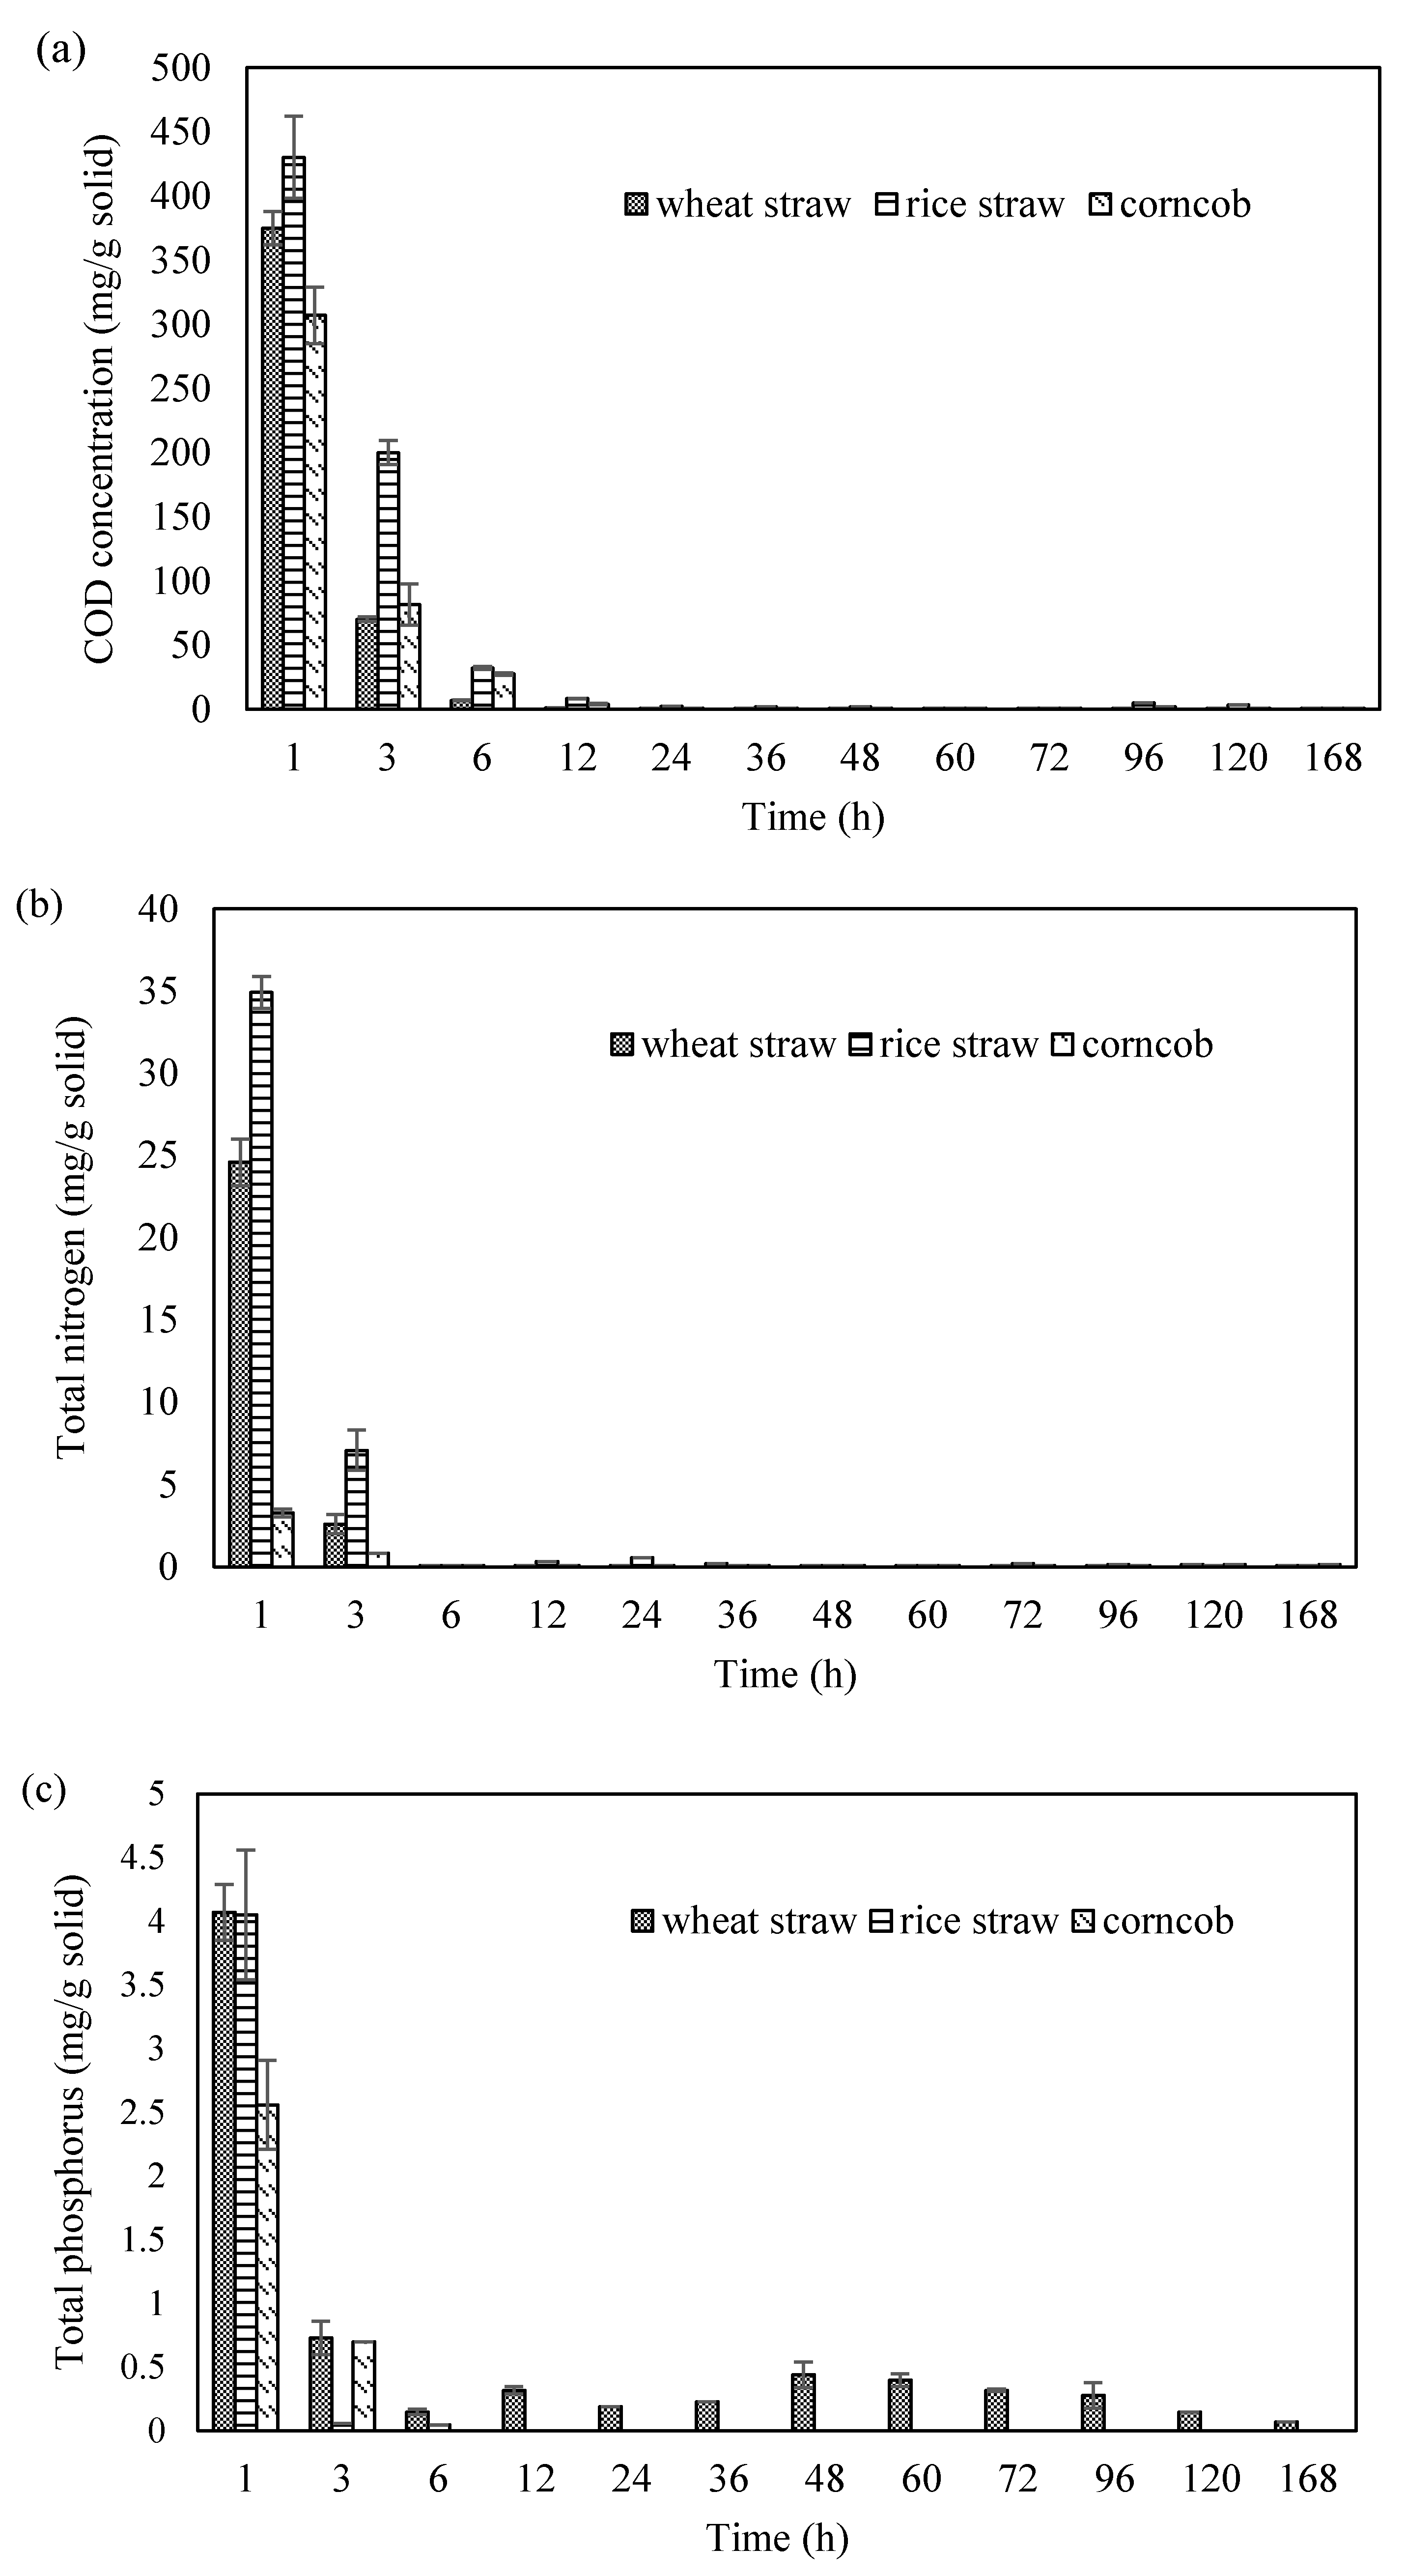
The COD variation was recorded during column experiment. The results showed that the carbon release mainly occurred at the first 12 h, and thereafter almost no further release was detected (Figure 1a). The maximum released COD concentrations were 375, 430, and 307 mg/g solid for wheat straw, rice straw and corncob. The nitrogen and phosphorus have also been found before the 6th h of the column experiment. Rice straw provided the highest nitrogen release which was up to 34.9 mg/g solid. Apart from wheat straw that phosphorus release still was observed, the concentrations of nitrogen and phosphorus were almost 0 g/L for other cases (Figure 1b,c). Different carbon and nutrient releasing patterns have been observed. This is mainly because of the composition difference of the three materials [25,26,27]. For instance, all these three materials contain hemicellulose, but it is mainly hyaluronic acid, arabinose, and xylose in wheat straw; and it is glucuronic acid and xylose in wheat straw in corncob. In addition, they have different contents of protein, phosphorus, and minerals.
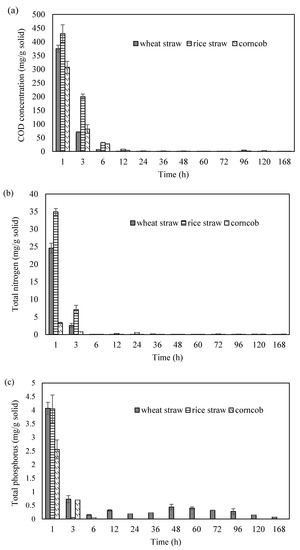
Figure 1.
The carbon and nutrient release pattern of wheat straw, rice straw and corncob ((a): the COD concentration variation; (b): the total nitrogen concentration variation; (c): the total phosphorus concentration variation).
It can be seen that the phosphorus concentration was higher than 0.5 mg/L at the first 6 h, which exceeds the limit of Class 1 A of Integrated Wastewater Discharge Standard. It suggests that phosphorus removal should be considered before discharging such as coagulation and sedimentation. During the column experiment, distilled water was used. It suggests that simple dissolution would not lead to the carbon or nutrient release from WS, RS, and CC.
3.2. The Denitrification Performance of the Solid Carbon Source
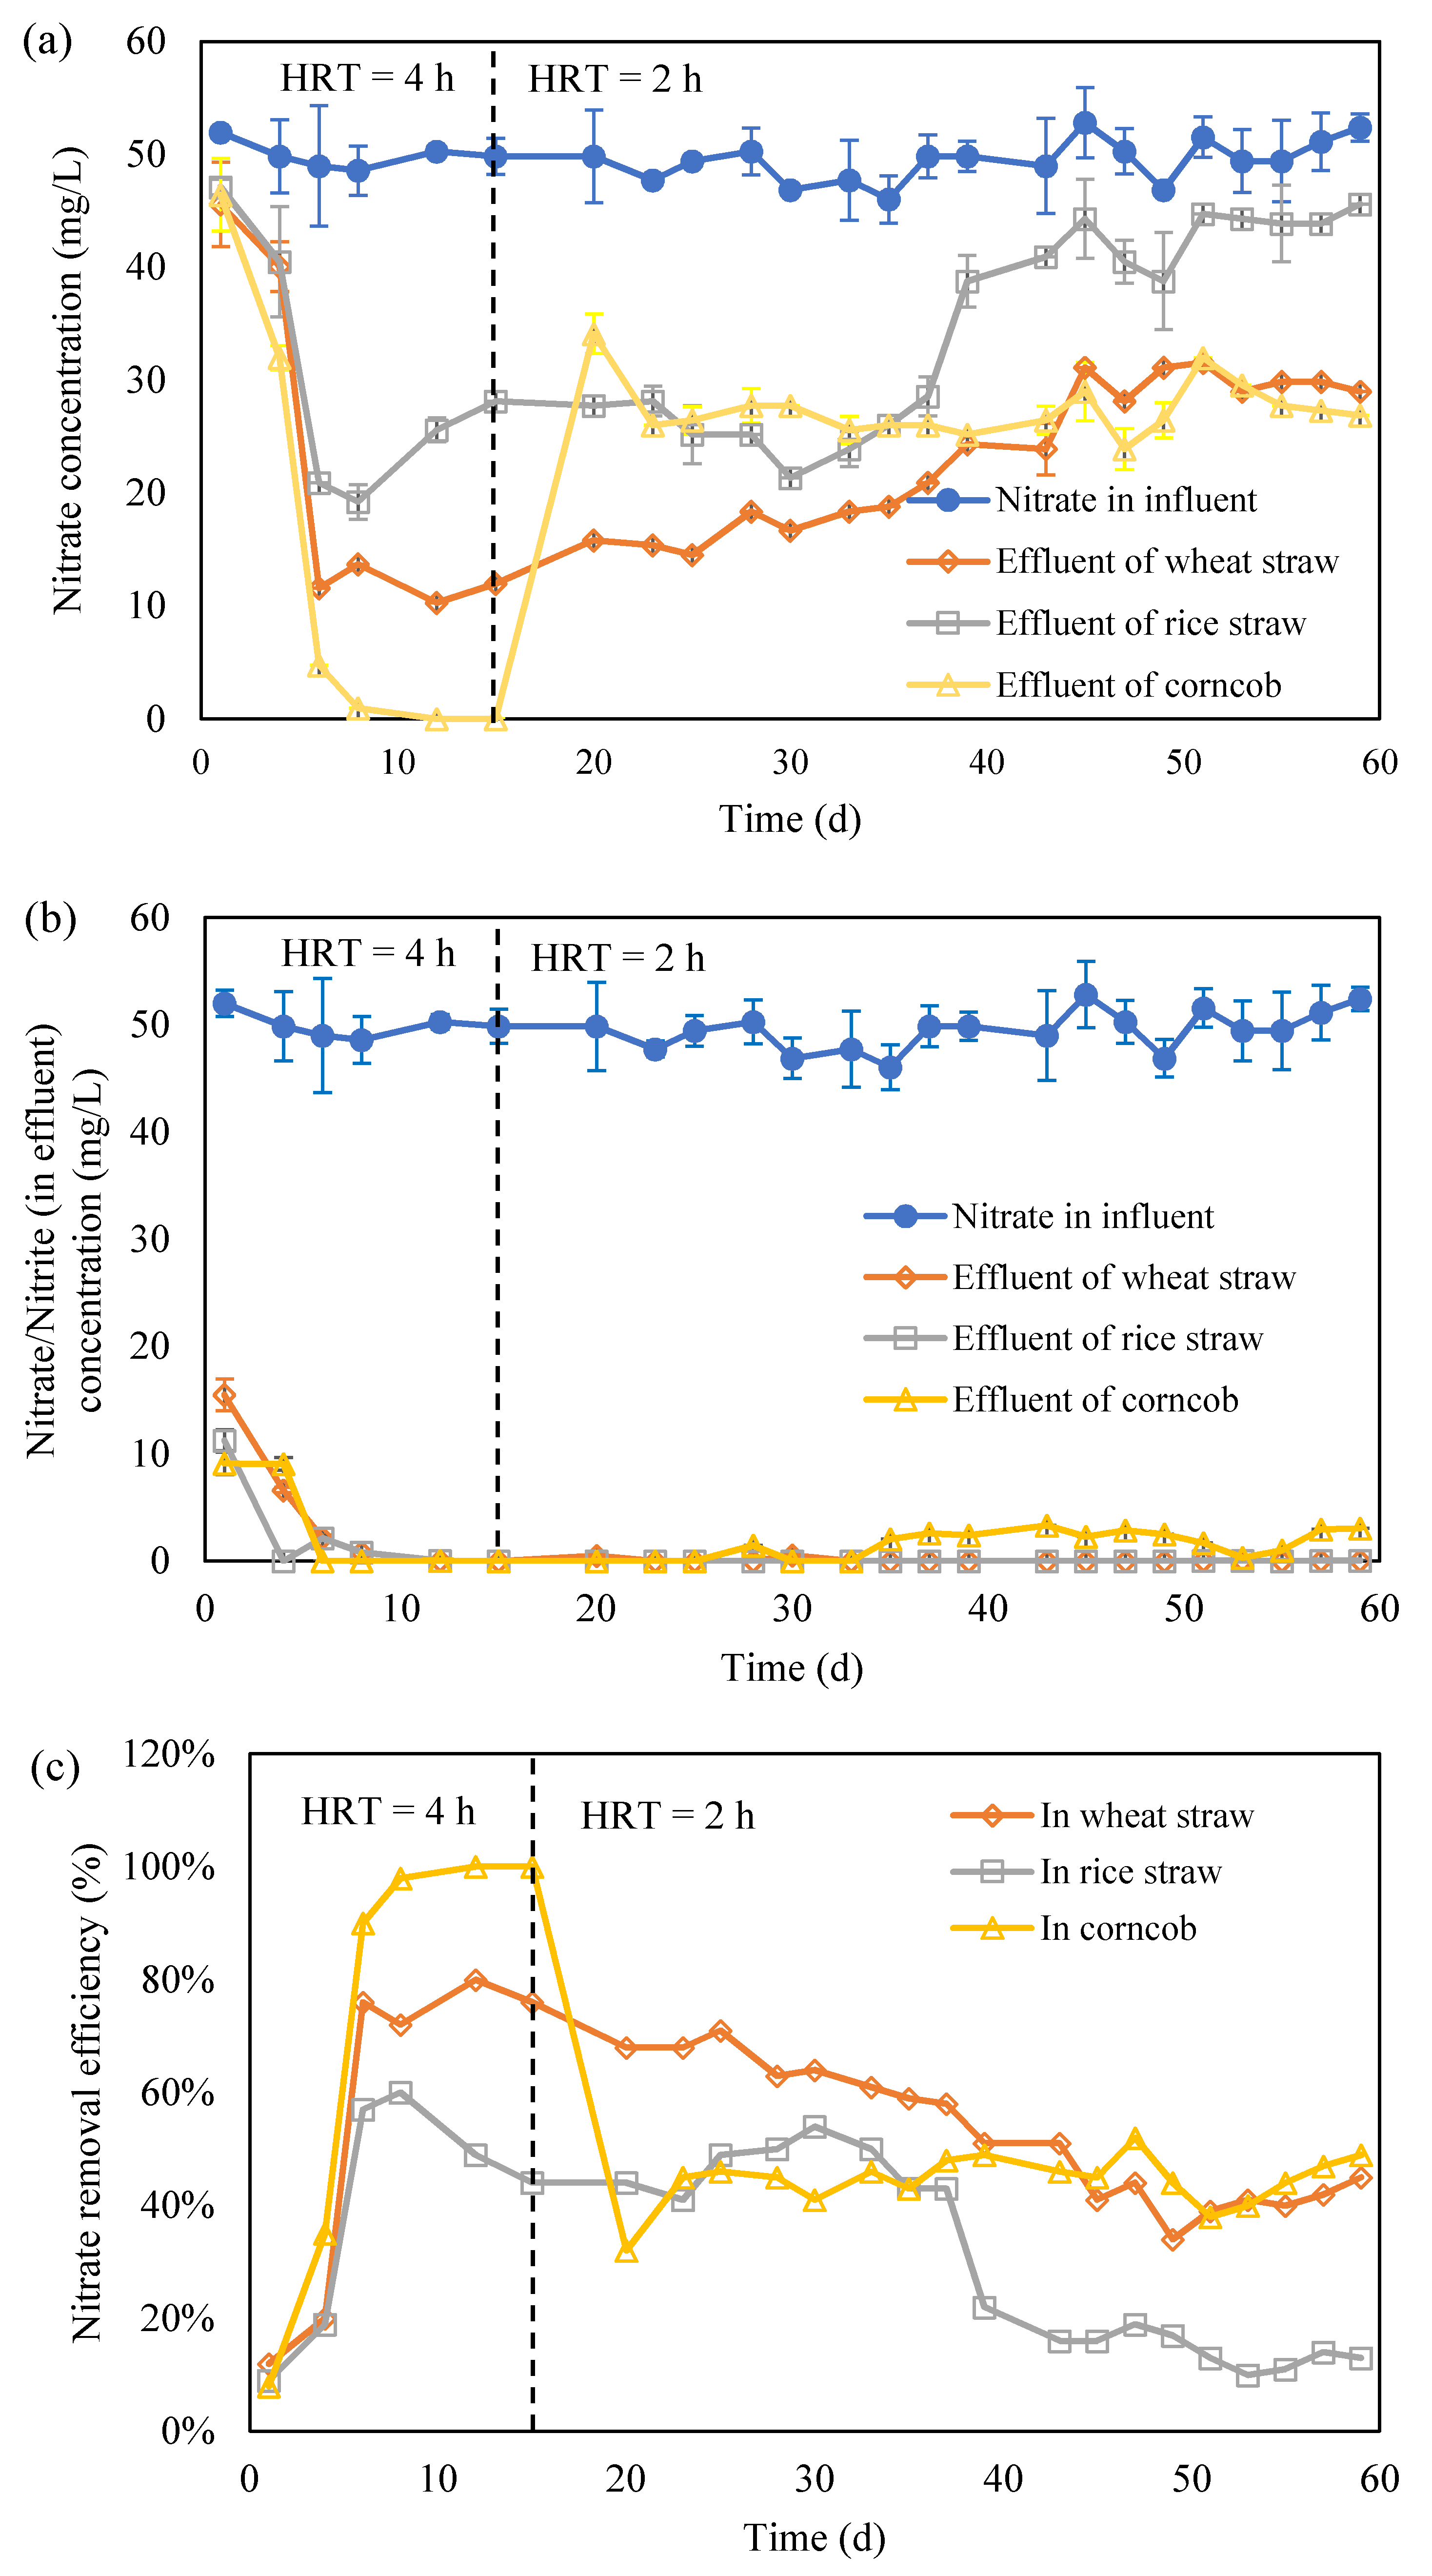
From the above experiment results, it is hard to determine if wheat straw, rice straw and corncob are suitable as carbon source for heterotrophic denitrification. The three solid carbon sources were used to construct a heterotrophic denitrification system. The denitrification performance of the bioreactor packed with wheat straw was shown in Figure 2a. At the first 15 h, the operation of HRT was 4 h. The highest NO2-N concentration in the effluent was 15.46 mg/L, which occurred in the beginning of the experiment, but disappeared after 6 h, which suggests the success of the denitrification. The maximum nitrogen removal efficiency was 80% which occurred on the 12th day. From the 15th day, the nitrogen removal efficiency was gradually reduced to 34% at 49 h. This would be because the degradation of wheat straw has become difficult, and thus the carbon source is limited for heterotrophic denitrification. A slight increase was observed thereafter. It is predicted that due to the difficultly, the degraded fiber was finally consumed after long-term operation.
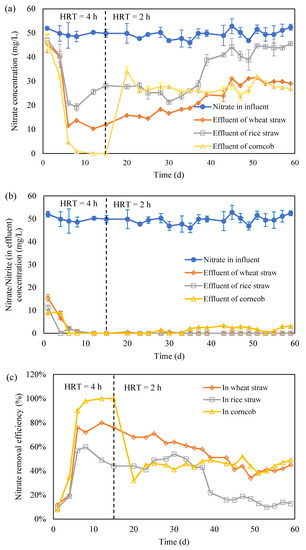
Figure 2.
The heterotrophic denitrification with the three crop residues (HRT presents the hydraulic retention time; (a): nitrate concentration variation; (b): nitrate and nitrite concentration variation; (c): nitrate removal efficiency).
The NO3−-N concentration in the effluent of the heterotrophic denitrification reactor filled rice straw fluctuated greatly during the whole experiment period (Figure 3a). The maximum nitrate removal efficiency was around 60% which occurred at 12 h and then kept increasing for some time. The removal efficiency of NO3−-N remained above 45% until the 37th day. Thereafter, the rapid increase of NO3−-N concentration in the effluent has been observed, the removal efficiency of NO3−-N declined to less than 10% after the 51th day, and the denitrification efficiency was lower than 0.06 kg N/(m3·d) after continuous operation for 60 d.
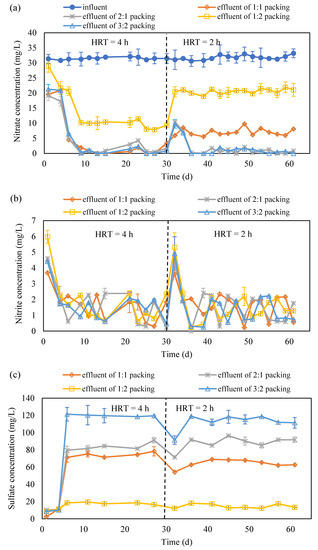
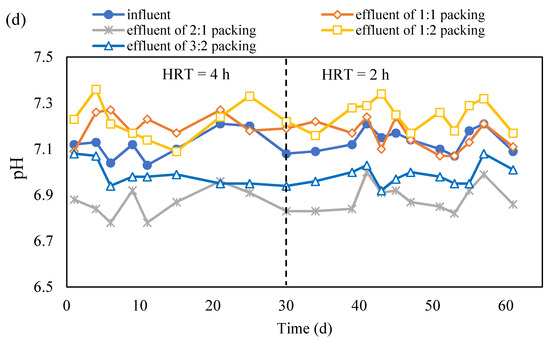
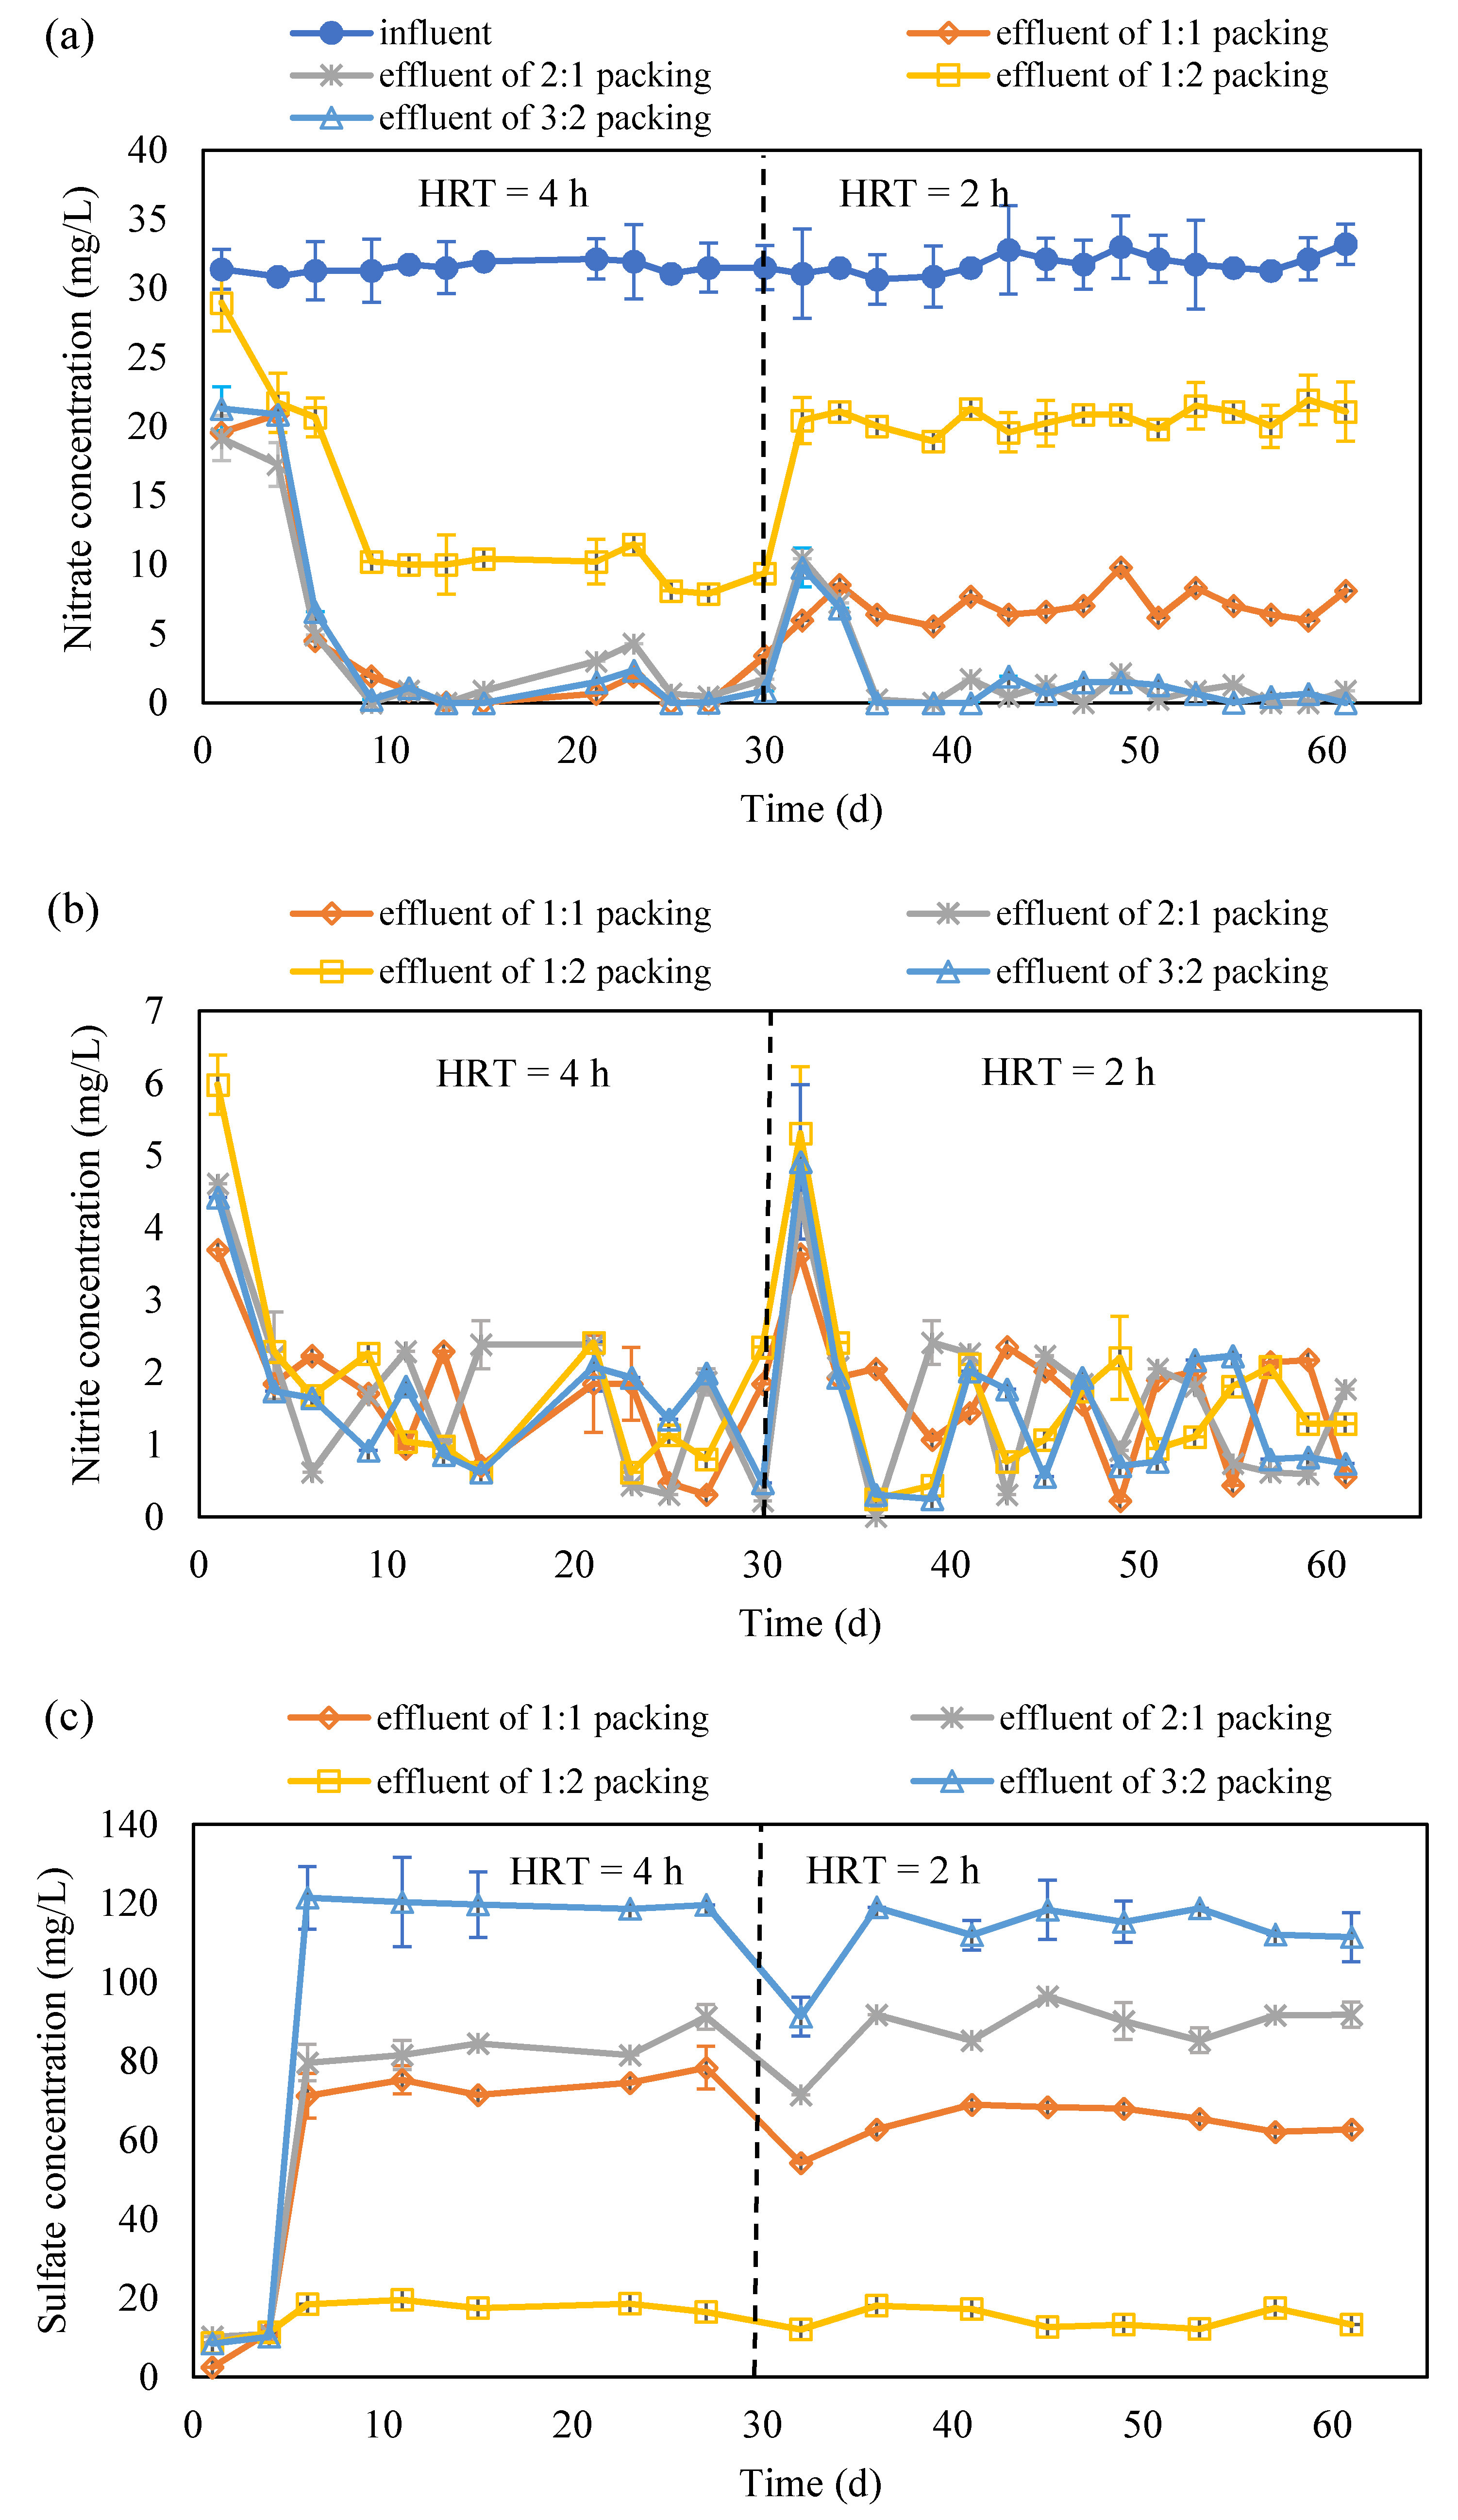
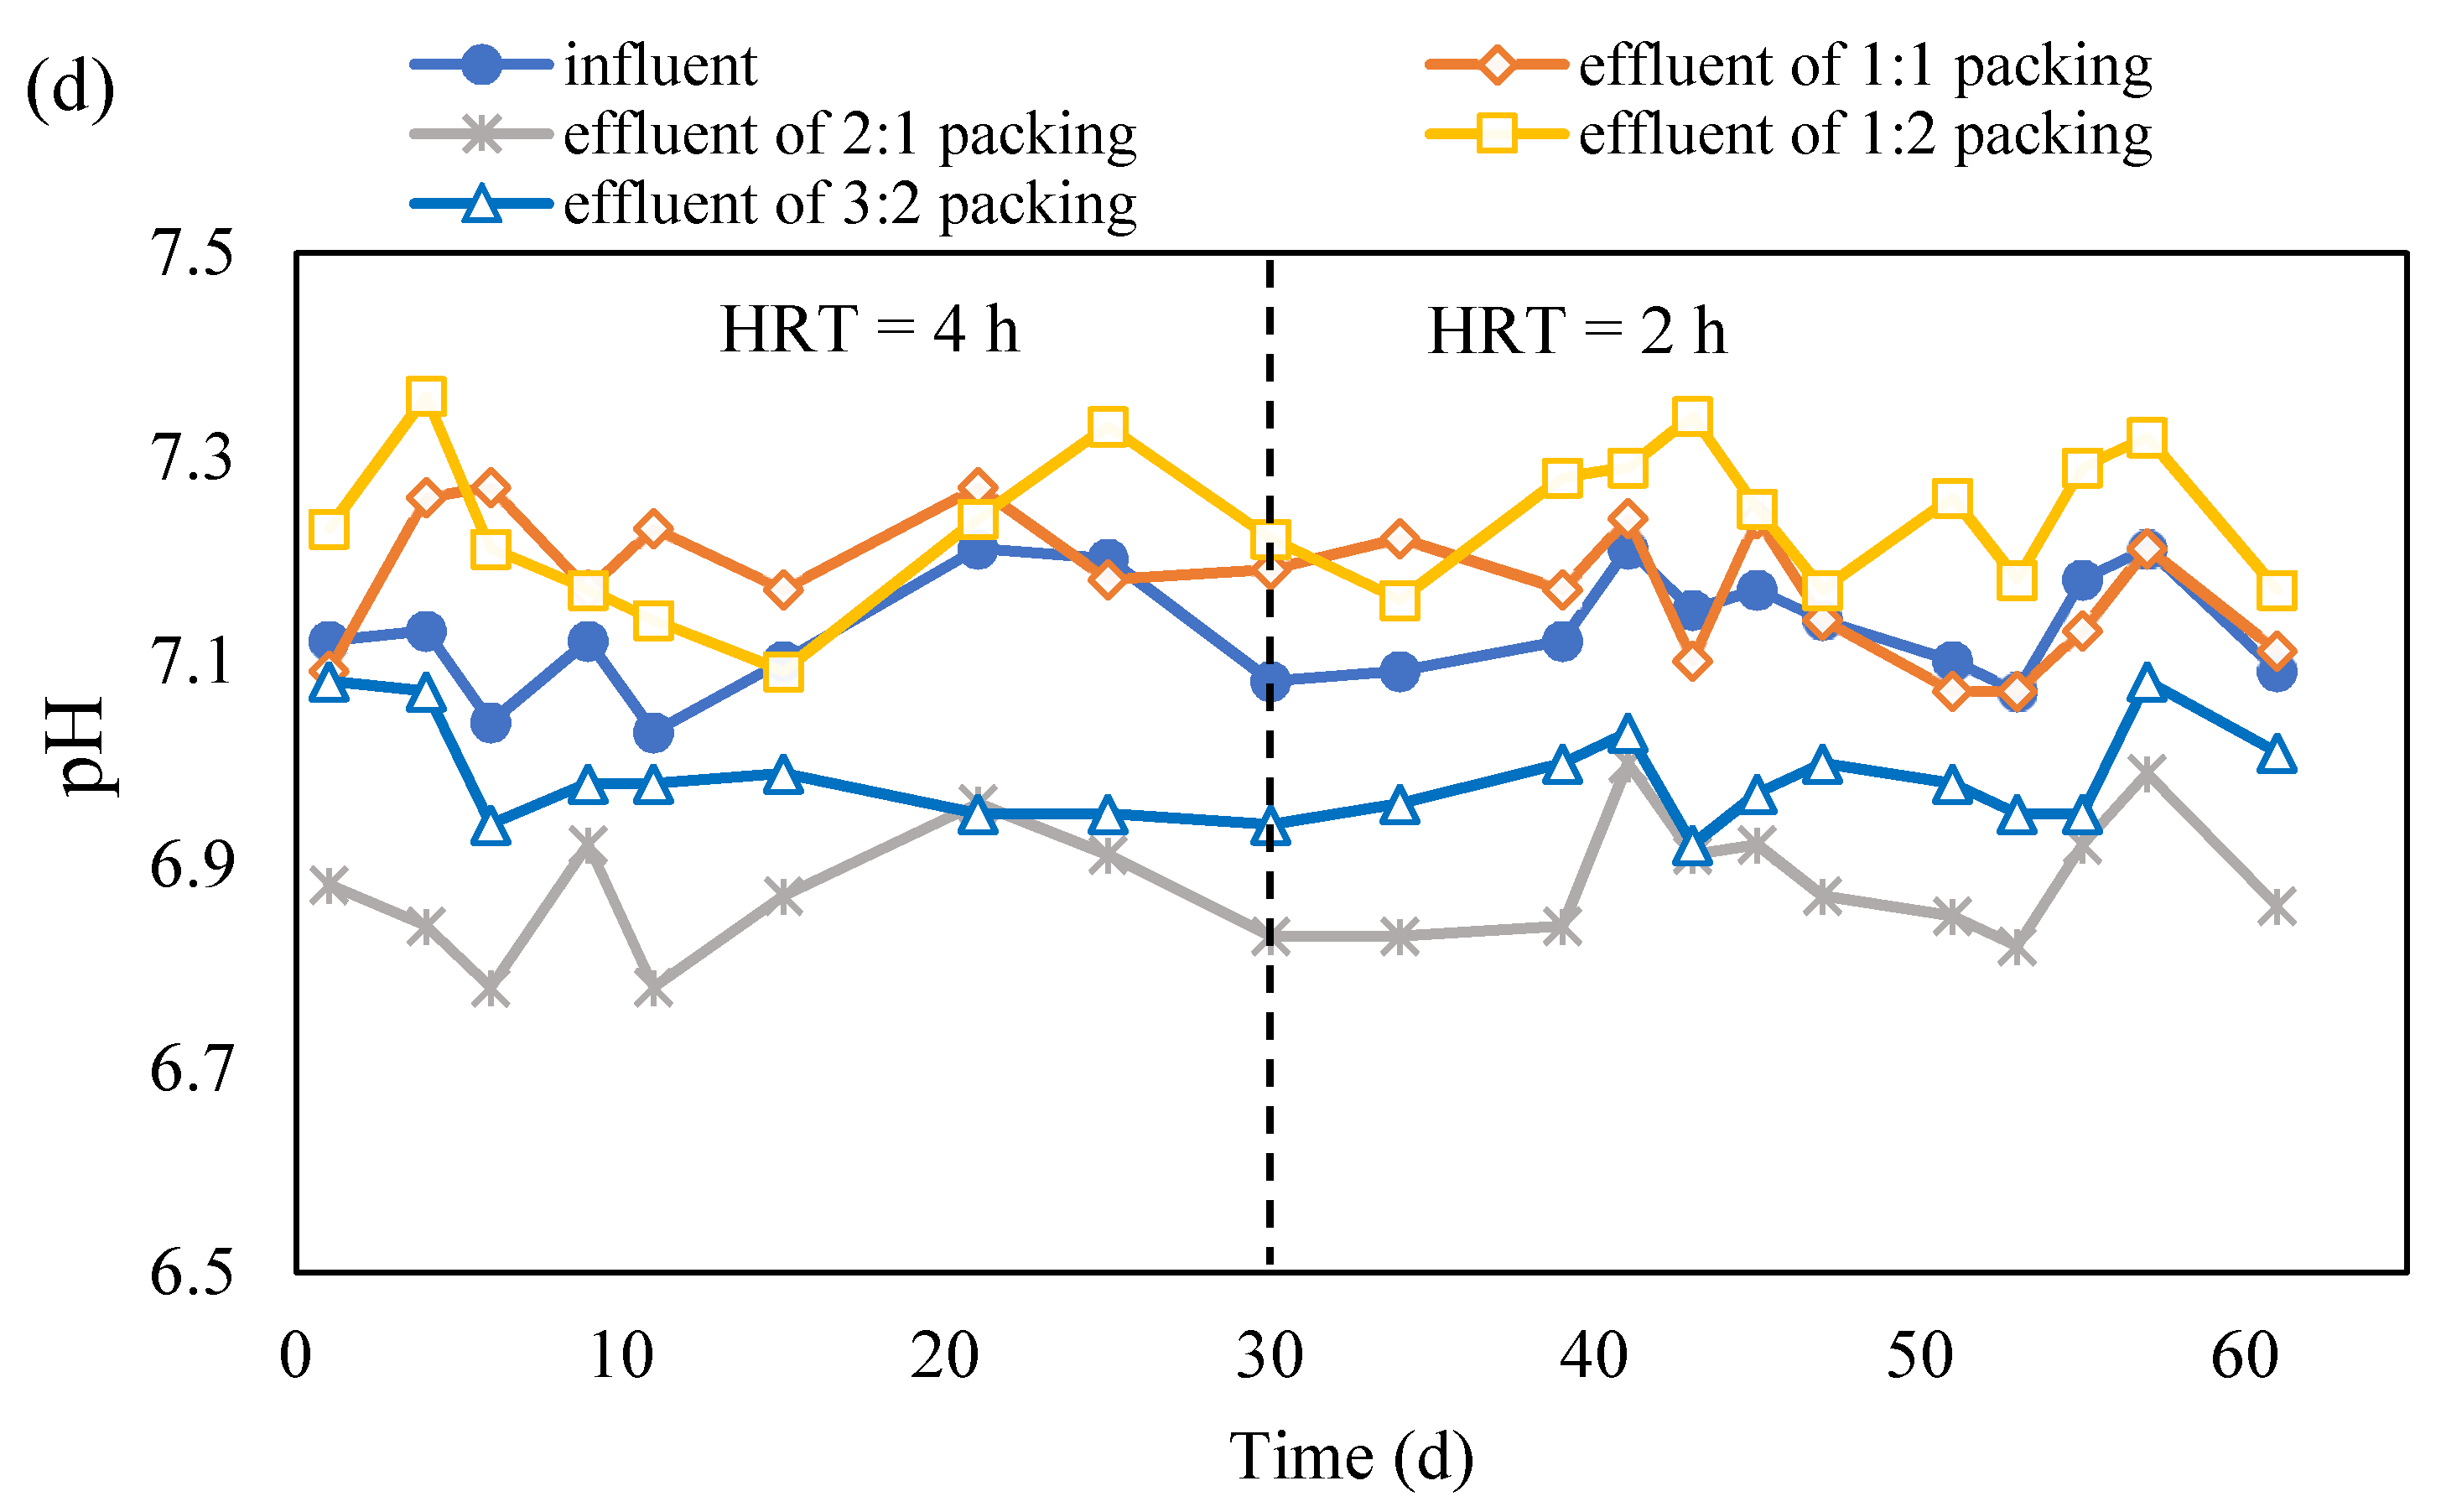
Figure 3.
The variation in NO3−-N (a), NO2−-N (b) and SO42− (c) concentration and pH (d) in the effluent of S0 and corncob mixing system (S0 presents the element sulfur; NO3−-N presents the nitrate nitrogen; NO2−-N presents the nitrite nitrogen; HRT presents the hydraulic retention time; ‘effluent of 1:1 packing’, ‘effluent of 2:1 packing’, ‘effluent of 1:2 packing’ and ‘effluent of 3:2 packing’ present the effluent collected from the reactor packed with corncob and S0 with a ratio of 1:1, 2:1, 1:2 and 3:2, respectively).
The Initial fluctuation of the NO3−-N concentration would be because the system is not stable and microbes are difficult to adapt. Thereafter, it became stable. However, after 37 d, the denitrification became worse. It suggests that carbon releasing supported the denitrification; however, it became insufficient thereafter. After 51 d, it can be observed that the denitrification has stopped, this would be due to the lack of a carbon source for heterotrophic denitrification in the system.
In the corncob denitrification reactor, NO2−-N accumulation was detected at the first 4 h of operation, and then turned to 0 mg/L (Figure 2b). Moreover, the NO3−-N removal efficiency reached 98% in the 8th day (Figure 2c). It is considered that the start-up is successful. The nitrate-nitrogen removal efficiency remained stable and kept above 95%. To further identify the denitrification capacity, the HRT was reduced from 4 h to 2 h at the 15th day. It can be seen that the concentration of NO3−-N in the effluent increased rapidly, and then was maintained at 28 mg/L. The removal efficiency of NO3−-N was kept around 36% thereafter. The denitrification efficiency reached a maximum of 0.34 kg N/(m3·d). After adjusting the residence time, the reactor was continuously run for another 45 d, and the corncob maintains a relatively stable denitrification ability.
By comparing the denitrification behavior of the three crop residues, it can be observed that corncob is more suitable as a slow releasing solid carbon source as it achieved a higher nitrate removal capacity. Hence, corncob was selected as the carbon source in the mixotrophic denitrification.
3.3. The Mixotrophic Denitrification
Compared with other types of sulfur, element sulfur (S0) is more suitable to be combined with a solid carbon source to build the mixotrophic denitrification system as they are all in solid phase and are easy to be packed in the column.
3.3.1. The Mixed Corncob and S0 for Mixotrophic Denitrification
In the beginning of the experiment, the HRT was set at 4 h. The HRT was reduced to 2 h after the system became stable (Figure 3a). The concentration variation of NO3−-N and NO2−-N are shown in Figure 3a,b.
In the four reactors, a similar trend of NO3−-N concentration in the effluent has been observed. It rapidly reduced from 4.12~5.98 mg/L to 1.93~2.54 mg/L along with the operation going on and almost kept constant after the 9th h (Figure 3a). From 9 h to 30 h, the nitrate removal was stable for all the cases as the nitrate concentration in the effluent was almost stable. Compared to the reactor packed with the mixture of corncob and S0 in the ratio of 1:2, other three achieved nearly 100% nitrate removal. This would be due to the carbon source being sufficient in these three packings compared to 1:2 ratio case. After the HRT was adjusted to 2 h from 4 h, an increase on NO3−-N concentration was occurred in each reactor. For the reactors packed with the mixture of corncob and S0 in the ratio of 1:2 and 1:1, NO3−-N concentration remained at around 20 mg/L and 8 mg/L, respectively, until the end of the operation. However, for the case with the ratio of 2:1 and 3:2, the NO3−-N concentration soon reduced to almost 0 mg/L. It suggests that the denitrification is completed in the reactors with 2:1 and 3:2 packing ratio; however, it is not the same for the reactors with 1:1 and 1:2 packing ratio. It would be due to the released carbon amount not being sufficient to support the heterotrophic denitrification in the reactors with 1:1 and 1:2 packing ratio, as the corncob amount in these two reactors was less than in the reactors with 2:1 and 3:2 packing ratio.
The COD concentration was also tracked and it was found that no COD presented in the effluent for the case of 1:1 and 1:2 packing ratio, and around 5–8 mg/L COD was detected in the effluent for the case of 2:1 and 3:2 packing ratio. It also suggests the carbon sufficiency of different reactors. Moreover, from the concentration variation of SO42−, which is the end product of S0 autotrophic denitrification, it can also be observed that the autotrophic denitrification ability in the reactors with 1:1 and 1:2 packing ratio was low, as the SO42− concentration was less in the reactors with 1:1 and 1:2 packing ratio that in the reactors with 2:1 and 3:2 packing ratio (Figure 3c).
For the four reactors, the accumulation of NO2−-N was high in the beginning of the experiment and the beginning of the HRT shifting from 4 h to 2 h. At other periods, there is little NO2−-N accumulation (Figure 3b). In addition, it was observed that the pH was kept between 6.8 and 7.4 (Figure 3d), which is considered suitable for denitrification. The NO2−-N accumulation indicates that the conversion of NO3−-N to NO2−-N and NO2−-N to N2 was balanced and there is no much residue of NO2−-N in the reactors. Overall, during long-term operation, the denitrification of the four reactors was stable but obviously the reactors with 2:1 and 3:2 packing ratio have better denitrification performance than the reactors with 1:1 and 1:2 packing ratio. It demonstrates that the suitable corncob to S0 volume ratio plays an important role in mixotrophic denitrification.
According to the reaction formula (Equation (1)) of elemental sulfur denitrification, 7.83 mg/L of SO42− would be generated for removal 1 mg/L of NO3−-N, and simultaneously consume 3.36 mg/L alkalinity (in terms of CaCO3).
1.1S0 + NO3− + 0.4CO2 + 0.76H2O + 0.08NH4+ → 0.08C2H7O2N + 0.5N2 + 1.1SO42− + 1.28H+
It suggests that the generation of SO42− can directly reflect the proportion of autotrophic denitrification in the mixotrophic denitrification system, while the remaining part is the heterotrophic denitrification part.
The NO3−-N removal efficiency in the reactors packed with the mixture of corncob and S0 in the ratio of 2:1 and 3:2 could maintain above 95% at 2 h HRT. The NO3−-N removal efficiency in the reactors with 1:1 and 1:2 packing ratio were 81% and 33%, respectively. The NO3−-N removal is from both the autotrophic and heterotrophic denitrification. As discussed, SO42− can be used to determine the autotrophic denitrification in the mixotrophic denitrification system. Therefore, to identify the contribution ratio of these two denitrifications, the overall change of SO42− concentration during the operation has been tracked (Figure 3c).
The SO42− generated in all four reactors gradually increased from 0 h to 6 h, and thereafter it became stable, except for the beginning in the HRT which changed from 4 h to 2 h. The SO42− concentration in the four reactors in the stable period was 12.20 (1:2 packing ratio), 65.40 (1:1 packing ratio), 118.77 (3:2 packing ratio) and 85.36 (2:1 packing ratio) mg/L, respectively. It thus can be calculated that the proportions of heterotrophic denitrification in the four reactors were 60.9% (2:1 packing ratio), 51.3% (3:2 packing ratio), 71.5% (1:1 packing ratio) and 93.7% (1:2 packing ratio), respectively, and the rest is due to autotrophic denitrification. It can be seen that with the decrease of the proportion of solid carbon sources, the proportion of autotrophic denitrification decreases. Heterotrophic denitrification can provide alkalinity for autotrophic denitrification. However, a low carbon source would not provide enough alkalinity for autotrophic denitrification and thus lower the autotrophic denitrification process.
3.3.2. The Separated Corncob and S0 for Mixotrophic Denitrification
Corncob and S0 may not be completely consumed at the same time and there would be residue, which is the inert fraction of the corncob (hard to be degraded by microorganisms), at the end. Therefore, separated packing of corncob on the bottom and S0 on the top has been adopted. The HRT was first set at 4 h and then reduced to 2 h after the system became stable (Figure 4a).

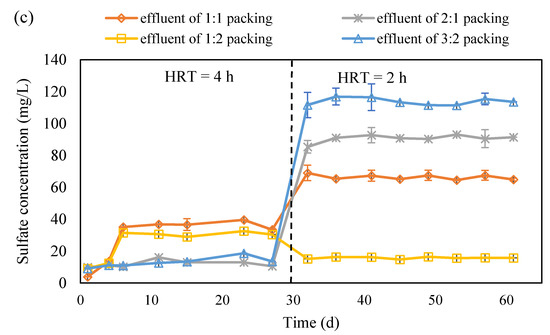
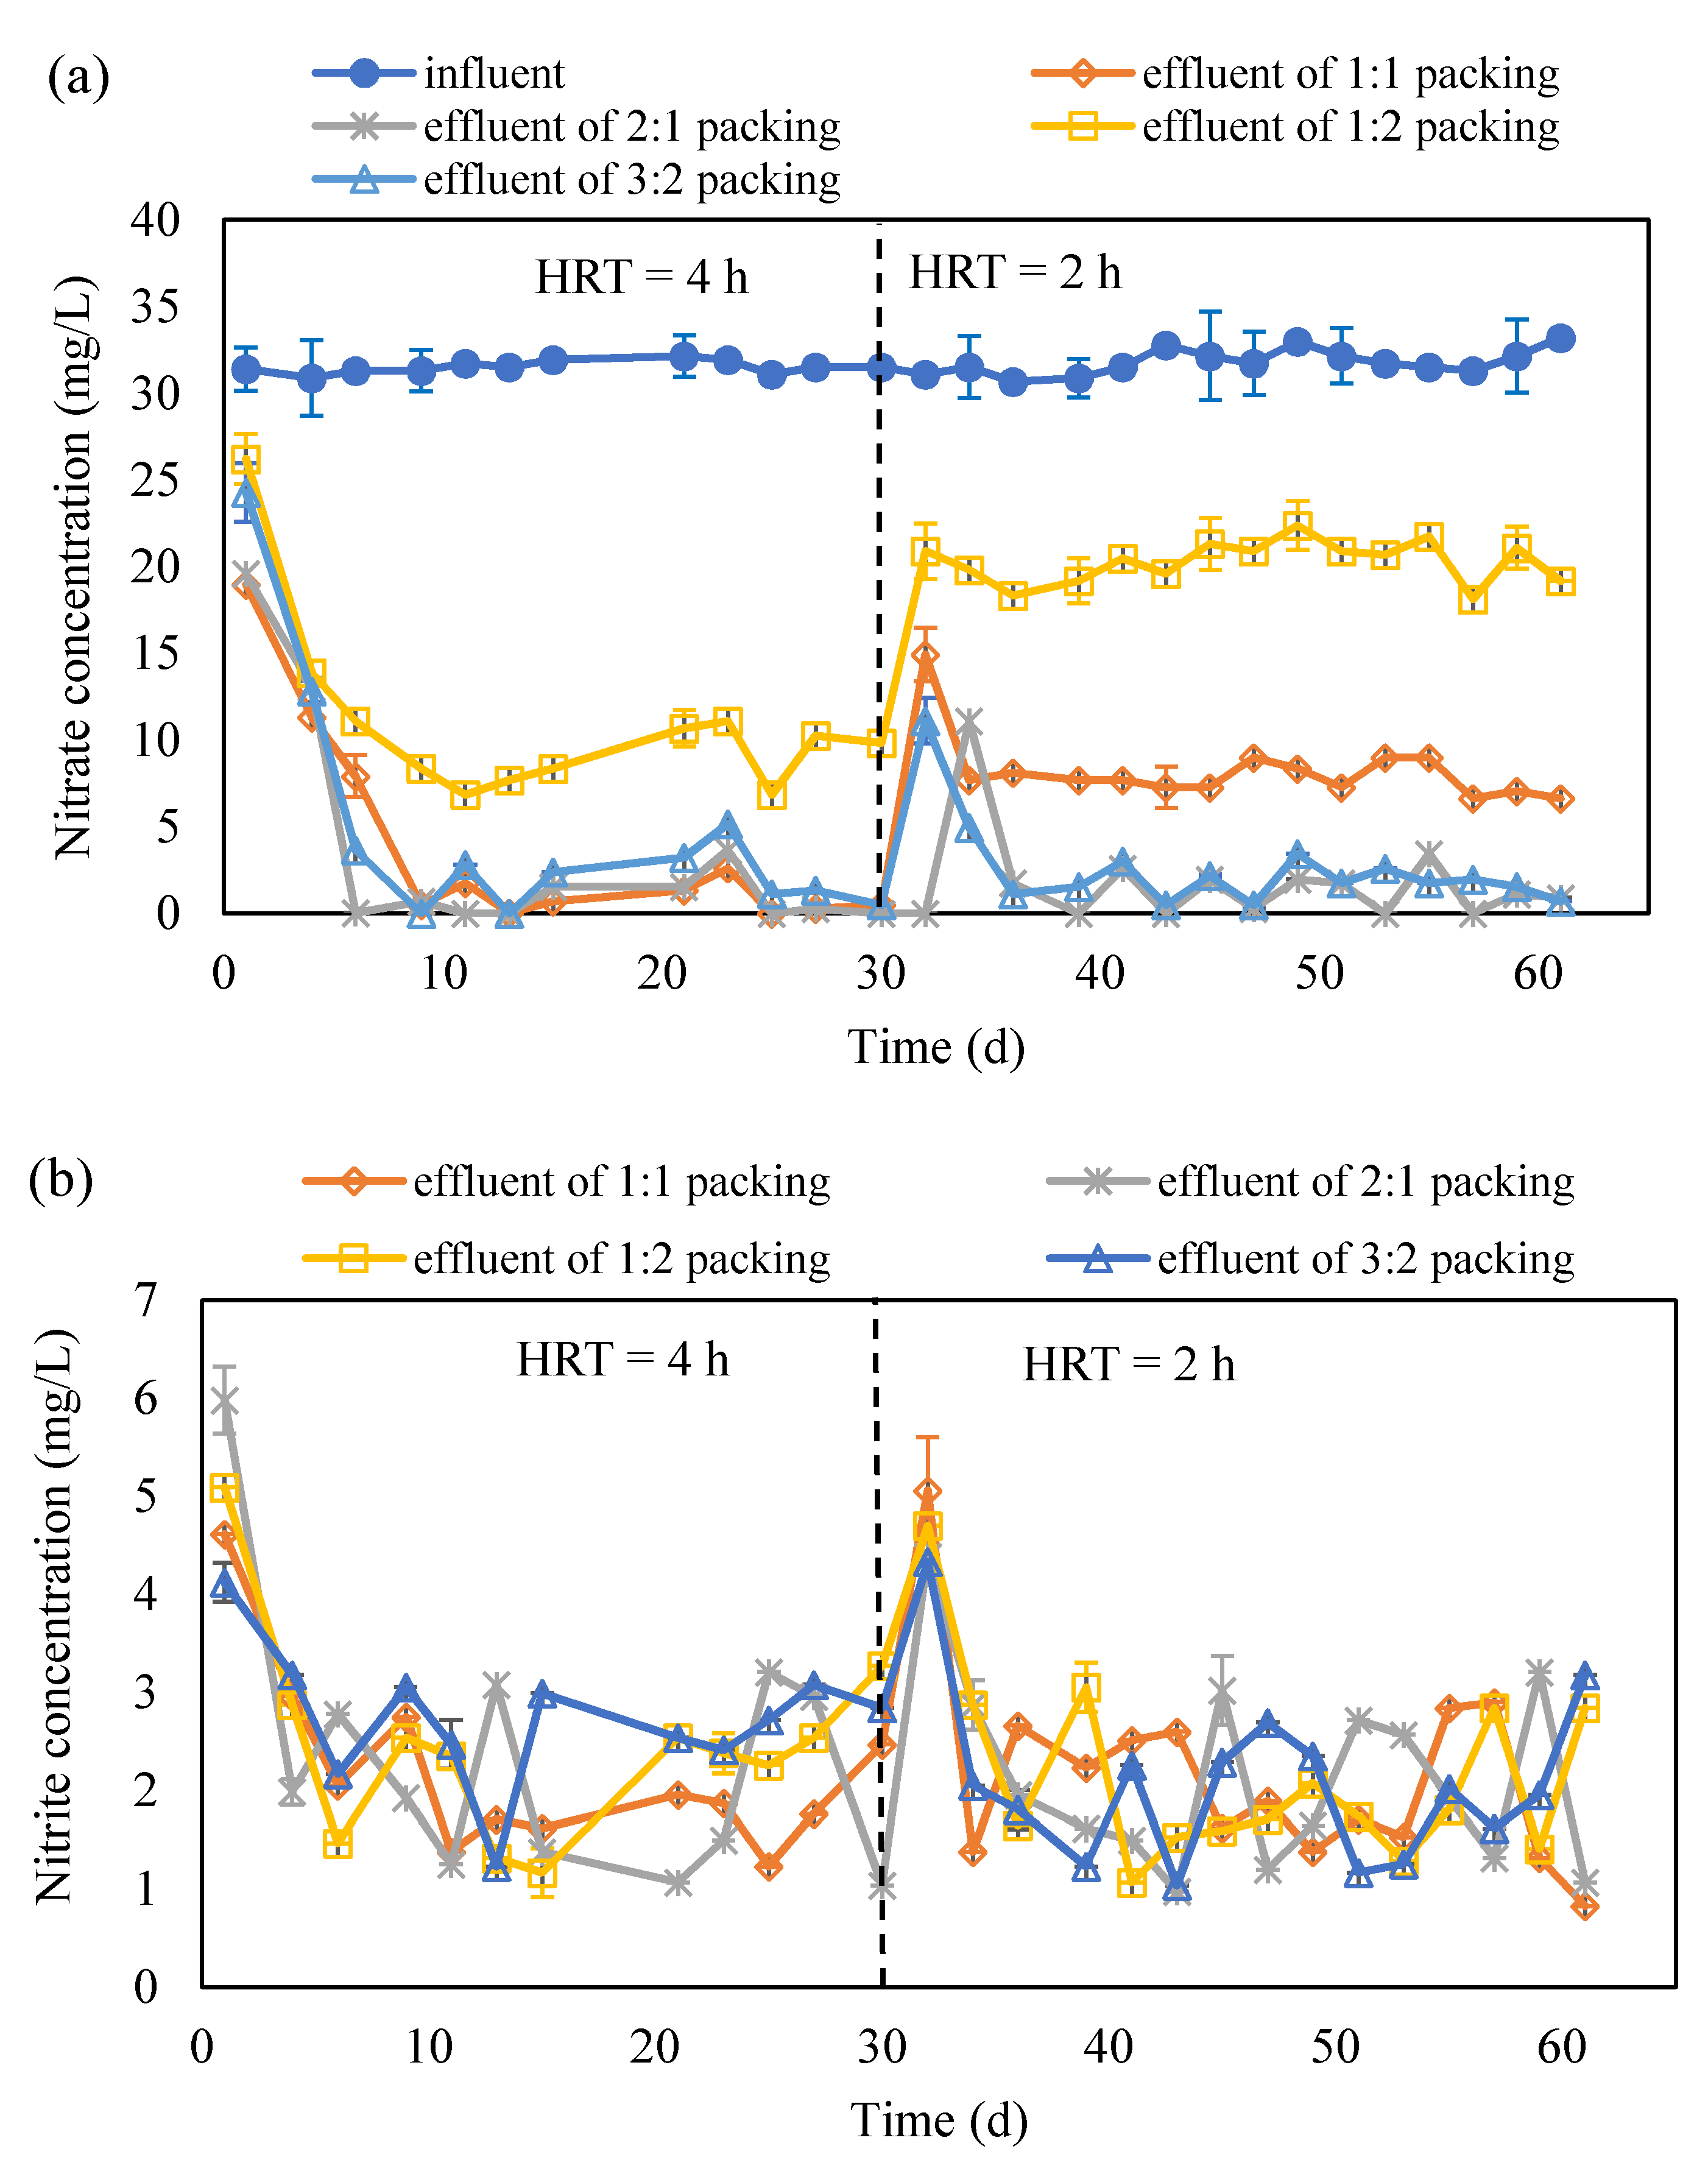
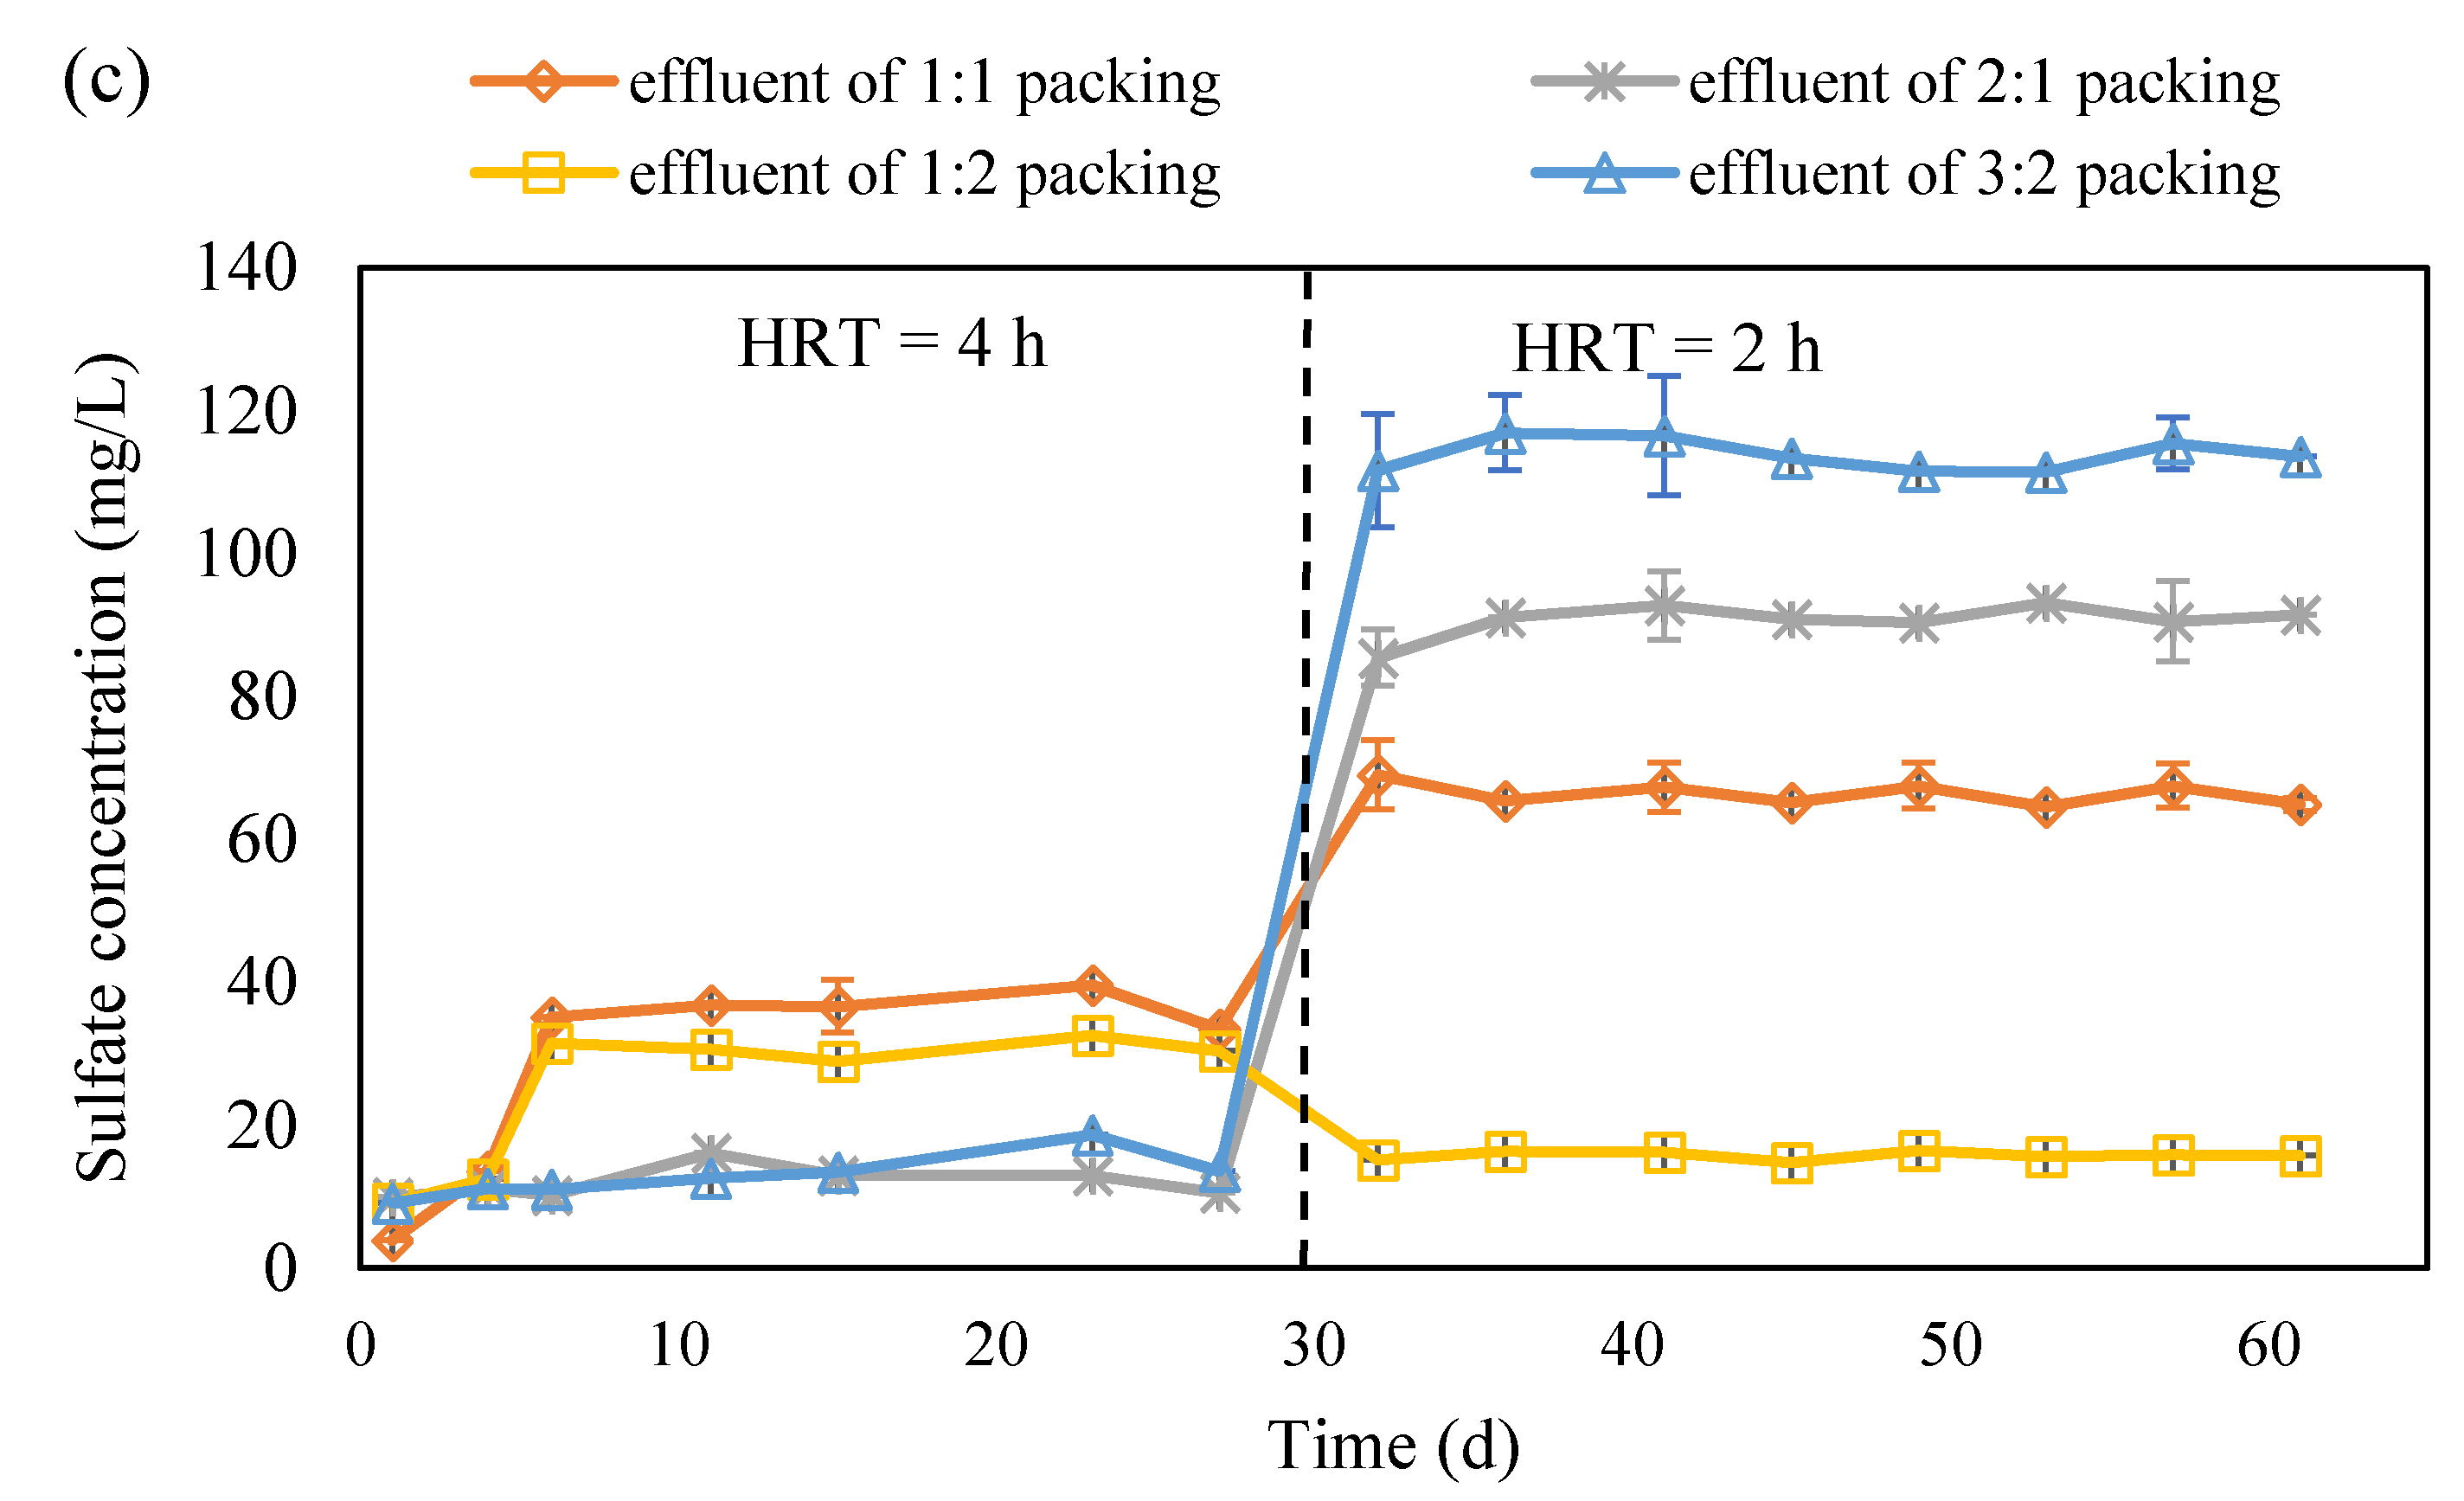
Figure 4.
The concentration variation in NO3−-N (a), NO2−-N (b) and SO42− (c) in the effluent of S0 and corncob separated packing system (S0 presents the element sulfur; NO3−-N presents the nitrate nitrogen; NO2−-N presents the nitrite nitrogen; HRT presents the hydraulic retention time; ‘effluent of 1:1 packing’, ‘effluent of 2:1 packing’, ‘effluent of 1:2 packing’ and ‘effluent of 3:2 packing’ present the effluent collected from the reactor packed with corncob and S0 with a ratio of 1:1, 2:1, 1:2 and 3:2, respectively).
The concentration variation in NO3−-N and NO2−-N are shown in Figure 4a,b. The NO3−-N concentration in the effluent rapidly decreased after the experiments were started, and it remained under 5 mg/L at 4 h HRT except for the case with 1:2 packing ratio. Once the HRT was shortened to 2 h, the NO3−-N concentration in the effluent increased in the beginning of the experiments and then declined to below 5 mg/L for the cases with 3:2 and 2:1 packing ratio. For the case with 1:2 and 1:1 packing ratio, the NO3−-N removal remained low, but the latter was better than the former (Figure 4a). The accumulation of NO2−-N was very little except in the beginning of experiments of the 4 h HRT and 2 h HRT for all the cases (Figure 4b). It indicates that the denitrification was completed and NO3−-N was transferred to N2. However, the cooperation between autotrophic denitrification and heterotrophic denitrification was better in the cases with 2:1 and 3:2 packing ratio than that with 1:2 and 1:1 packing ratio. According to the concentration variation of SO42− in the four cases, it can be seen that the autotrophic denitrification was higher in the cases with 2:1 and 3:2 packing ratio than that with 1:2 and 1:1 packing ratio (Figure 4c). Based on the calculation, the contribution of heterotrophic denitrification was 55.7% for 2:1 packing ratio, 57.9% for 3:2 packing ratio, 78.0% for 1:1 packing ratio, and 90.2% for 1:2 packing ratio. With a low carbon source ratio, the alkalinity generated would be low and thus it cannot provide enough alkalinity for autotrophic denitrification, which thus causes the low autotrophic denitrification and consequently low NO3−-N removal.
From the above study, it can be seen that the packing pattern, thoroughly mixing the S0 and corncob or separated packed S0 and corncob, did not impact on the denitrification much. However, the packing ratio of S0 and corncob has very obviously influenced the nitrate removal. It can be seen that corncob to S0 packing ratios of 2:1 and 3:2 provided more than 95% nitrate removal and kept the total nitrogen in the effluent lower than 10 mg/L. It is comparable with the denitrification which performed with polycaprolactone, methanol, and sodium carboxymethyl cellulose as a carbon source in the mixotrophic denitrification [9,15,28]. It was found that corncob as a carbon source showed great potential for nitrate removal, as it kept it removal efficiency for 60 d, which is similar as the results reported by using commercially carbon source including polycaprolactone and methanol.
3.4. The Microorganism in the Denitrification
The presence of denitrification microorganisms in the system are the main reason for NO3−-N removal. The biofilm on the S0 and corncob has been observed with SEM (Figure S1). The surface of the original corncobs is rough, in a fish scale-like structure, and with few pores (Figure S1a). After the experiment went on for 45 d, the porosity of the corncob increased significantly, which would be due to the utilization of corncob by microorganisms. The specific surface area of the used corncob was larger compared to the original one, which helps the attachment of the biofilm. Due to the rough surface of the corncob and the large porosity, the biofilm was not connected to a large area on its surface, and the biofilm structure of the different layers is mainly connected together by filamentous bacteria (Figure S1b,c).
The surface morphology of the original sulfur particles was smooth with obvious hemispherical concave and convex spots (Figure S1e). After denitrification was carried out for 45 d, the hemispherical concave and convex spots on the surface of sulfur particles disappeared, and a large number of voids and cavity structures appeared (Figure S1e). After zooming to 2000 times, it can be seen that the S0 surface has formed a more obvious biofilm structure, and the biofilm structure is mainly based on filamentous bacteria as the skeleton. In addition, a large number of microorganisms were connected to each other through extracellular polymers (Figure S1e). After zooming to 5000 times, rod-shaped microorganisms are observed as they have been found in the corncob surface (Figure S1c,f). This is the typical shape as reported in other denitrification systems [8].
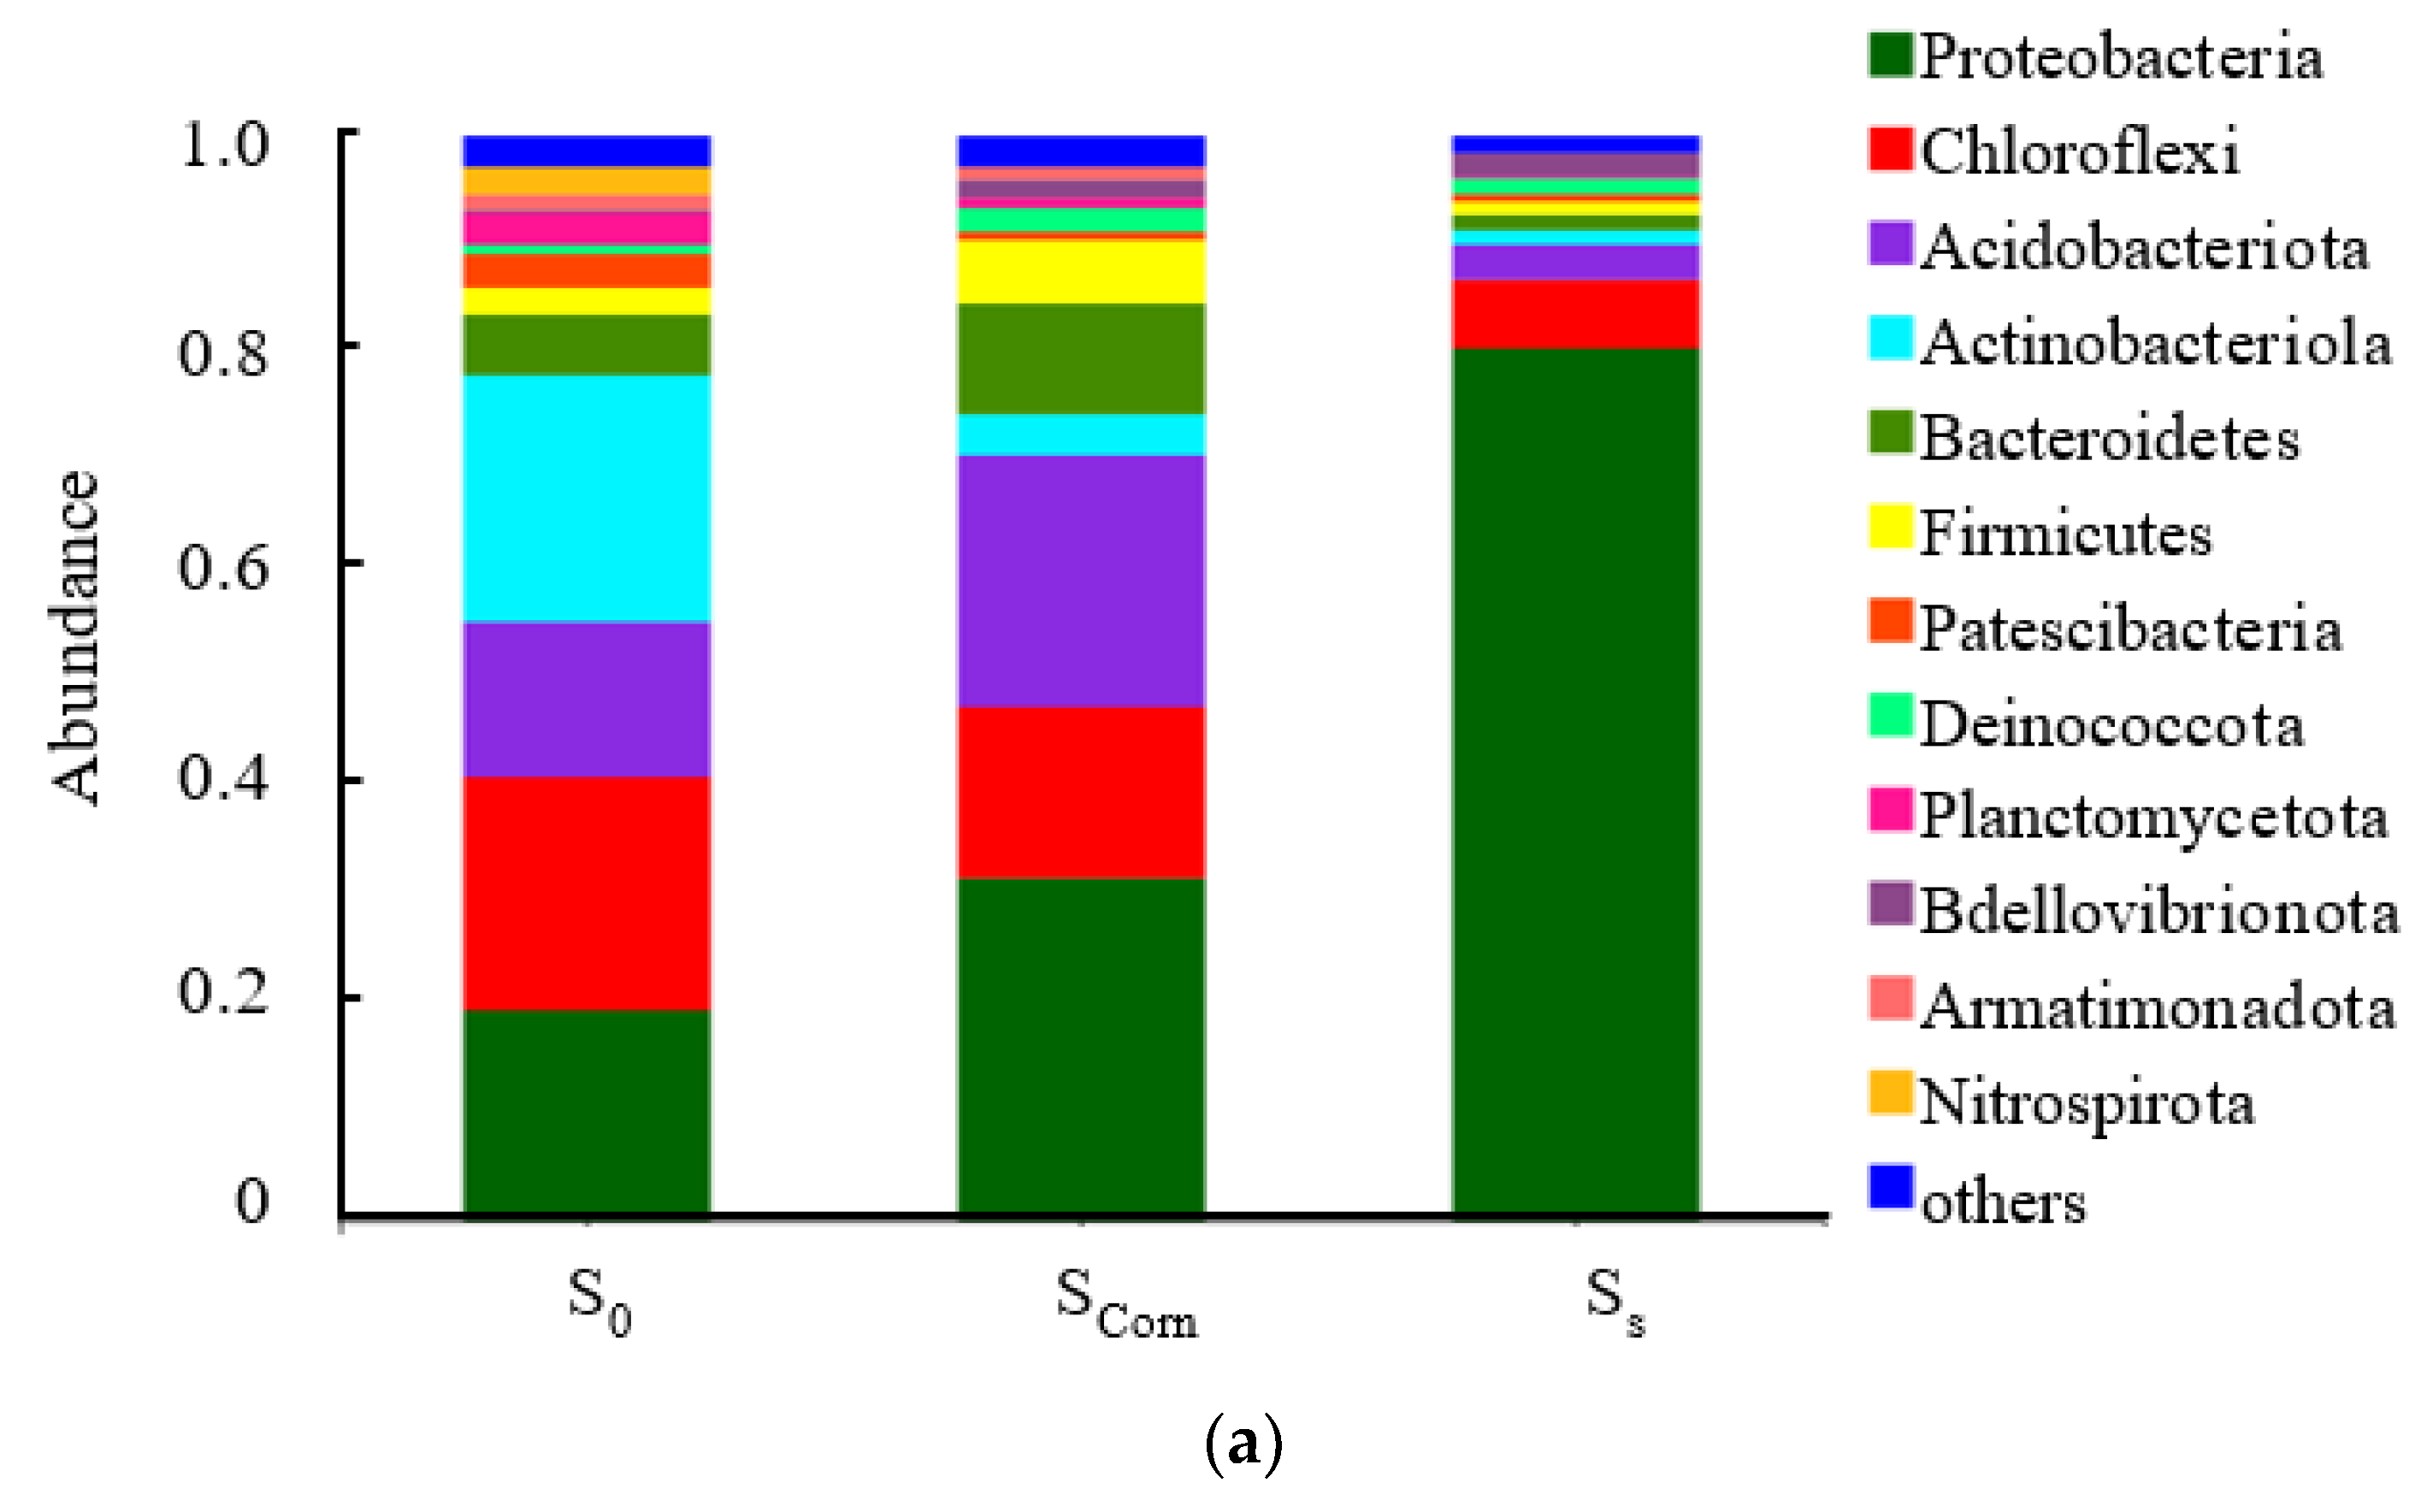
Figure 5a shows the relative distribution of species of sludge samples from corncobs and S0 particles at the phylum level. The dominant phylum for both samples is Proteobacteria (Proteobacteria). Compared with activated sludge, the dominant population of S0 surface sludge does not vary much, and the proportion of proteus phylum reached 78%; however, the microbial community structure of sludge on the surface of corncobs is similar to that of activated sludge, and the dominant population is diverse. Apart from Proteobacteria, Chloroflexi was also a relatively abundant flora in the sludge on the surface of corncobs. As suggested, Chloroflexi has the ability to reduce nitrate to nitrite [8] and can achieve heterotrophic denitrification in the presence of a carbon source [29].

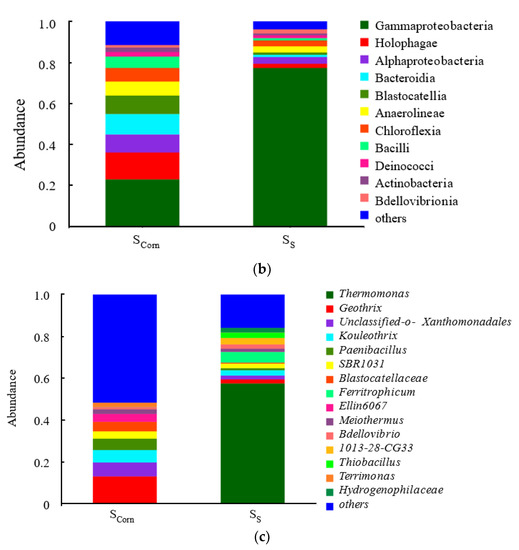
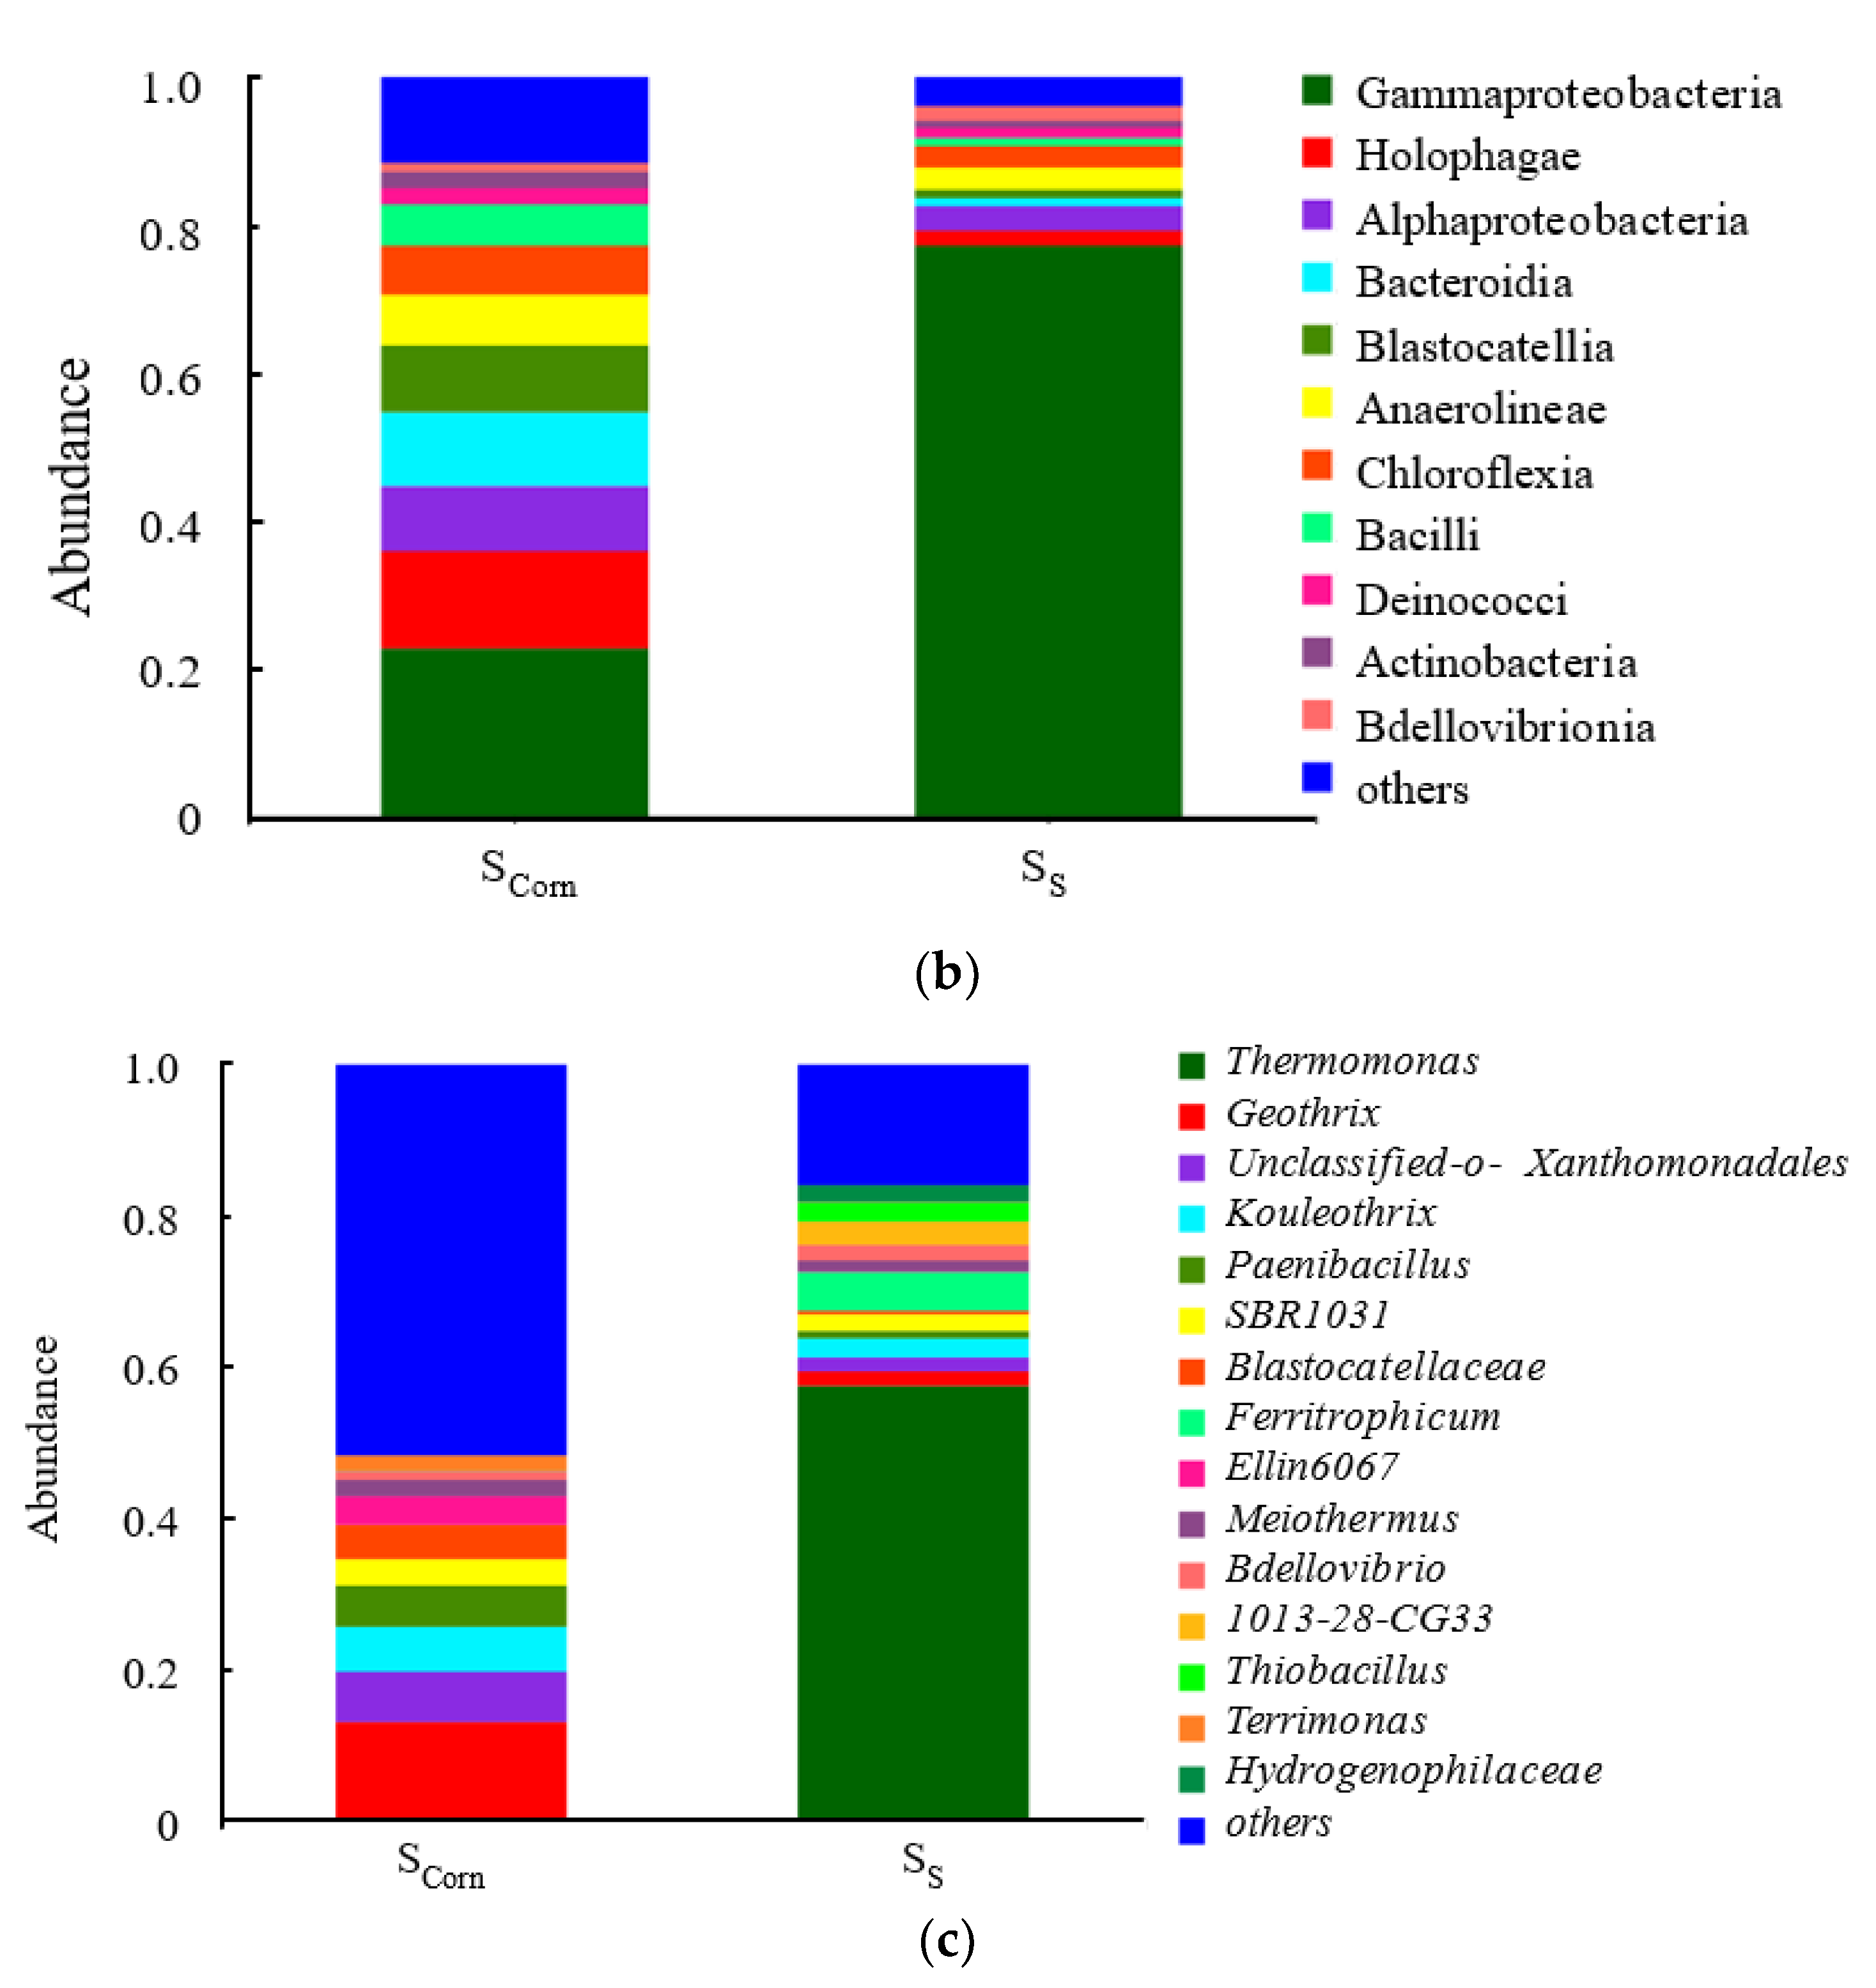
Figure 5.
The species of sludge samples from corncobs and S0 particles (a) at phylum level, (b) at class level, (c) at genus level (Scorn presents sludge obtained from corncob surface, Ss presents sludge obtained from sulfur surface, S0 presents activated sludge).
To further analyze the species abundance at the class level, it was found that the Proteobacteria family is still the dominant microbiota (Figure 5b). The γ-Proteobacteria accounts for the largest proportion, and about 21% was in the corncob microbial samples, and another 77% was in the surface of sulfur. In addition, the abundance of other dominant flora on the surface of the corncob is similar, namely Holophagae (whole phage), Alphaproteobacteria (α-Proteus), Bacteroidia (Bacteroides), Blastocatellia, Anaerolineae (Anaeroxic Jolia), Chloroflexia (Phylum Aerobicia), and Bacilli (Bacillus).
Species abundance at the genus level is analyzed and results are provided in Figure 5c. Thermomonas on the surface of sulfur is the dominant genus. Studies have revealed that Thermomonas is a typical autotrophic denitrifying bacterium, and that its genus have the functions of hydrogen autotrophic denitrification, iron autotrophic denitrification, and sulfur autotrophic denitrification [30,31]. There are also small amounts of the obligate iron autotrophic denitrifying bacterium Ferritrophicum and the obligate sulfur autotrophic bacterium Thiobacillus in the sludge samples on the surface of the sulfur particles [32].
On the surface of the corncob, the abundance of each functional flora is relatively average. Xanthomonadales belongs to the nutrient-poor microorganisms. It has strong self-coagulation capacity, is easy to grow on the solid surface of the film, and is usually in the form of biofilms [33], the presence of such microorganisms, can make the biofilm structure stable. It has been noted in the literature that Kouleothrix can use lignocellulosic materials for denitrification [34]. It also has been observed in a larger portion in the biofilm than in activated sludge in this study (Figure 5c).
The microbial community analysis reveals that the denitrification in the system was accomplished by autotrophic denitrification and heterotrophic denitrification. Denitrifying functional bacteria are domain in the surface of sulfur and corncob. This is why good denitrification performance has been obtained.
4. Conclusions
Mixotrophic denitrification has achieved by employing S0 and corncob. The packing ratio of S0 and corncob has a great impact on the final denitrification efficiency in both the well mixed packing mode and separated packing mode. This is because of the corncob being the carbon source of the heterotrophic denitrification, and it would not have enough alkalinity generated when the quantity of corncob is lower. The best denitrification performance was obtained at corncob to S0 packing ratio of 2:1 and 3:2 regardless the packing pattern (well mixing or separated packing). With a higher corncob presence in the packing material, the NO3−-N concentration in the effluent was lower than 5 mg/L and the total nitrogen concentration was lower than 10 mg/L. It suggests that agriculture waste corncob has great potential to be used as a carbon source to complete denitrification in wastewater treatment. Phosphorus and suspended solids are also released during the utilization of agriculture wastes, hence, coagulation and sedimentation might be required in the following treatment before the effluent is discharged to receiving water bodies.
Supplementary Materials
The following supporting information can be downloaded at: https://www.mdpi.com/article/10.3390/separations9100323/s1, Figure S1: The surface SEM image of corncob and S0.
Author Contributions
X.H. (Xiaohong Hong): conceptualization, methodology, writing—original draft preparation. L.T.: methodology, data curation, visualization, investigation. H.F.: conceptualization, data curation, writing—original draft preparation. X.Z.: conceptualization, methodology, writing—reviewing and editing, supervision. X.H. (Xianqiong Hu): data curation, validation. All authors have read and agreed to the published version of the manuscript.
Funding
This research received no external funding.
Institutional Review Board Statement
Not applicable.
Informed Consent Statement
Not applicable.
Data Availability Statement
Data is contained within the article or supplementary material.
Conflicts of Interest
The authors declare no conflict of interest.
References
- Mishra, S.; Singh, V.; Cheng, L.; Hussain, A.; Ormeci, B. Nitrogen removal from wastewater: A comprehensive review of biological nitrogen removal processes, critical operation parameters and bioreactor design. J. Environ. Chem. Eng. 2022, 10, 107387. [Google Scholar] [CrossRef]
- Chang, M.; Liang, B.; Zhang, K.; Wang, Y.; Jin, D.; Zhang, Q.; Hao, L.; Zhu, T. Simultaneous shortcut nitrification and denitrification in a hybrid membrane aerated biofilms reactor (H-MBfR) for nitrogen removal from low COD/N wastewater. Water Res. 2022, 211, 118027. [Google Scholar] [CrossRef] [PubMed]
- Zou, L.; Zhou, M.; Luo, Z.; Zhang, H.; Yang, Z.; Cheng, H.; Li, R.; He, Q.; Ai, H. Selection and synthesization of multi–carbon source composites to enhance simultaneous nitrification–denitrification in treating low C/N wastewater. Chemosphere 2022, 288, 132567. [Google Scholar] [CrossRef] [PubMed]
- Sahinkaya, E.; Dursun, N.; Kilic, A.; Demirel, S.; Uyanik, S.; Cinar, O. Simultaneous heterotrophic and sulfur-oxidizing autotrophic denitrification process for drinking water treatment: Control of sulfate production. Water Res. 2011, 45, 6661–6667. [Google Scholar] [CrossRef]
- Sun, S.; Liu, J.; Zhang, M.; He, S. Thiosulfate-driven autotrophic and mixotrophic denitrification processes for secondary effluent treatment: Reducing sulfate production and nitrous oxide emission. Bioresour. Technol. 2020, 300, 122651. [Google Scholar] [CrossRef]
- Chu, Y.; Liu, W.; Tan, Q.; Yang, L.; Chen, J.; Ma, L.; Zhang, Y.; Wu, Z.; He, F. Vertical-flow constructed wetland based on pyrite intensification: Mixotrophic denitrification performance and mechanism. Bioresour. Technol. 2022, 347, 126710. [Google Scholar] [CrossRef]
- Liu, Q.; Huang, C.; Chen, X.; Wu, Y.; Lv, S.; Wang, A. Succession of functional bacteria in a denitrification desulphurisation system under mixotrophic conditions. Environ. Res. 2020, 188, 109708. [Google Scholar] [CrossRef]
- Huang, C.; Liu, Q.; Li, Z.-L.; Ma, X.-D.; Hou, Y.-N.; Ren, N.-Q.; Wang, A.-J. Relationship between functional bacteria in a denitrification desulfurization system under autotrophic, heterotrophic, and mixotrophic conditions. Water Res. 2021, 188, 116526. [Google Scholar] [CrossRef]
- Li, Y.; Liu, L.; Wang, H. Mixotrophic denitrification for enhancing nitrogen removal of municipal tailwater: Contribution of heterotrophic/sulfur autotrophic denitrification and bacterial community. Sci. Total Environ. 2022, 814, 151940. [Google Scholar] [CrossRef]
- Ai, T.; Zhan, H.; Zou, L.; Fu, J.; Fu, Q.; He, Q.; Ai, H. Potential applications of endogenous sulfide for enhanced denitrification of low C/N domestic wastewater in anodic mixotrophic denitrification microbial fuel cell: The mechanism of electrons transfer and microbial community. Sci. Total Environ. 2020, 722, 137830. [Google Scholar] [CrossRef]
- Zhang, L.; Zhang, C.; Hu, C.; Liu, H.; Bai, Y.; Qu, J. Sulfur-based mixotrophic denitrification corresponding to different electron donors and microbial profiling in anoxic fluidized-bed membrane bioreactors. Water Res. 2015, 85, 422–431. [Google Scholar] [CrossRef] [PubMed]
- Peng, C.; Huang, H.; Gao, Y.; Fan, X.; Peng, P.; Zhang, X.; Ren, H. A novel start-up strategy for mixotrophic denitrification biofilters by rhamnolipid and its performance on denitrification of low C/N wastewater. Chemosphere 2020, 239, 124726. [Google Scholar] [CrossRef]
- Ji, C.; Meng, L.; Wang, H. Enhanced reductive dechlorination of 1,1,1-trichloroethane using zero-valent iron-biochar-carrageenan microspheres: Preparation and microcosm study. Environ. Sci. Pollut. Res. 2019, 26, 30584–30595. [Google Scholar] [CrossRef] [PubMed]
- Xiong, R.; Yu, X.; Zhang, Y.; Peng, Z.; Yu, L.; Cheng, L.; Li, T. Comparison of agricultural wastes and synthetic macromolecules as solid carbon source in treating low carbon nitrogen wastewater. Sci. Total Environ. 2020, 739, 139885. [Google Scholar] [CrossRef] [PubMed]
- Tang, L.; Li, J.; Li, Y.; Zhang, X.; Shi, X. Mixotrophic denitrification processes based on composite filler for low carbon/nitrogen wastewater treatment. Chemosphere 2022, 286, 131781. [Google Scholar] [CrossRef]
- Yang, M.; Wang, X.; Liu, S.; Wu, C.; Wang, Q. Carbon release behaviour of polylactic acid/starch-based solid carbon and its influence on biodenitrification. Biochem. Eng. J. 2020, 155, 107468. [Google Scholar] [CrossRef]
- Zhang, S.; Xiao, L.; Tang, Z.; Zhang, X.; Wang, Z. Microbial explanation to performance stratification along up-flow solid-phase denitrification column packed with polycaprolactone. Bioresour. Technol. 2022, 343, 126066. [Google Scholar] [CrossRef] [PubMed]
- Sun, H.; Wang, E.; Li, X.; Cui, X.; Guo, J.; Dong, R. Potential biomethane production from crop residues in China: Contributions to carbon neutrality. Renew. Sustain. Energy Rev. 2021, 148, 111360. [Google Scholar] [CrossRef]
- Chen, Y.; Zhang, J.; Guo, Z.; Li, M.; Wu, H. Optimizing agricultural biomass application to enhance nitrogen removal in vertical flow constructed wetlands for treating low-carbon wastewater. Environ. Res. 2022, 209, 112867. [Google Scholar] [CrossRef]
- Wang, Z.; Zheng, M.; He, C.; Hu, Z.; Yu, Y.; Wang, W. Enhanced treatment of low-temperature and low carbon/nitrogen ratio wastewater by corncob-based fixed bed bioreactor coupled sequencing batch reactor. Bioresour. Technol. 2022, 351, 126975. [Google Scholar] [CrossRef]
- Wang, X.; Xing, L.; Qiu, T.; Han, M. Simultaneous removal of nitrate and pentachlorophenol from simulated groundwater using a biodenitrification reactor packed with corncob. Environ. Sci. Pollut. Res. 2013, 20, 2236–2243. [Google Scholar] [CrossRef] [PubMed]
- Shen, Q.; Wei, J.; Jiang, L.; Zhang, Q.; Mao, Y.; Liu, C.; Liao, Y.; Ji, F. Denitrification performance and characteristics of untreated corncob for enhanced nitrogen removal of municipal sewage with low C/N ratio. Environ. Res. 2022, 213, 113673. [Google Scholar] [CrossRef]
- Liu, J.; Fu, X.; Yuan, R.; Chen, Z.; Zhou, B.; Chen, H. Carbon sources derived from corncobs enhanced nitrogen removal in SBBR treating low C/N domestic sewage. Process Saf. Environ. Prot. 2022, 166, 628–637. [Google Scholar] [CrossRef]
- APHA (American Public Health Association). Standard Methods for the Examination of Water and Wastewater, 21st ed.; American Public Health Association: Washington, DC, USA, 2005. [Google Scholar]
- Peng, L.; Ma, R.; Jiang, S.; Luo, W.; Li, Y.; Wang, G.; Xu, Z.; Wang, Y.; Qi, C.; Li, Y.; et al. Co-composting of kitchen waste with agriculture and forestry residues and characteristics of compost with different particle size: An industrial scale case study. Waste Manag. 2022, 149, 313–322. [Google Scholar] [CrossRef] [PubMed]
- Rowan, M.; Umenweke, G.C.; Epelle, E.I.; Afolabi, I.C.; Okoye, P.U.; Gunes, B.; Okolie, J.A. Anaerobic co-digestion of food waste and agricultural residues: An overview of feedstock properties and the impact of biochar addition. Digit. Chem. Eng. 2022, 4, 100046. [Google Scholar] [CrossRef]
- Rahimi, Z.; Anand, A.; Gautam, S. An overview on thermochemical conversion and potential evaluation of biofuels derived from agricultural wastes. Energy Nexus 2022, 7, 100125. [Google Scholar] [CrossRef]
- Li, T.; Gao, Y.; Tang, Y.; Xu, Y.; Ren, H.; Huang, H. A new LDH based sustained-release carbon source filter media to achieve advanced denitrogenation of low C/N wastewater at low temperature. Sci. Total Environ. 2022, 838, 156488. [Google Scholar] [CrossRef] [PubMed]
- Ye, L.; Shao, M.-F.; Zhang, T.; Tong, A.H.Y.; Lok, S. Analysis of the bacterial community in a laboratory-scale nitrification reactor and a wastewater treatment plant by 454-pyrosequencing. Water Res. 2011, 45, 4390–4398. [Google Scholar] [CrossRef] [PubMed]
- Kostrytsia, A.; Papirio, S.; Morrison, L.; Ijaz, U.Z.; Collins, G.; Lens, P.N.L.; Esposito, G. Biokinetics of microbial consortia using biogenic sulfur as a novel electron donor for sustainable denitrification. Bioresour. Technol. 2018, 270, 359–367. [Google Scholar] [CrossRef]
- Xing, W.; Li, D.; Li, J.; Hu, Q.; Deng, S. Nitrate removal and microbial analysis by combined micro-electrolysis and autotrophic denitrification. Bioresour. Technol. 2016, 211, 240–247. [Google Scholar] [CrossRef] [PubMed]
- Nisola, G.M.; Redillas, M.C.F.R.; Cho, E.; Han, M.; Yoo, N.; Chung, W.-J. Comparison of reactive porous media for sulfur-oxidizing denitrification of high nitrate strength wastewater. Biochem. Eng. J. 2011, 58–59, 79–86. [Google Scholar] [CrossRef]
- Qin, S.; Liu, H.; Meng, Q.; Zhou, Y.; Xu, S.; Lichtfouse, E.; Chen, Z. Enhanced nutrient removal from mixed black water by a microbial ultra-low weak electrical stimulated anaerobic-two stage anoxic/aerobic process. Chem. Eng. J. 2022, 434, 134615. [Google Scholar] [CrossRef]
- Zhao, J.; Feng, L.; Dai, J.; Yang, G.; Mu, J. Characteristics of nitrogen removal and microbial community in biofilm system via combination of pretreated lignocellulosic carriers and various conventional fillers. Biodegradation 2017, 28, 337–349. [Google Scholar] [CrossRef] [PubMed]
Publisher’s Note: MDPI stays neutral with regard to jurisdictional claims in published maps and institutional affiliations. |
© 2022 by the authors. Licensee MDPI, Basel, Switzerland. This article is an open access article distributed under the terms and conditions of the Creative Commons Attribution (CC BY) license (https://creativecommons.org/licenses/by/4.0/).