Article

Disposable Pipette Extraction (DPX) Coupled to HPLC-DAD as an Alternative for the Determination of Phthalic Monoesters in Urine Samples

Departamento de Química, Universidade Federal de Santa Catarina, Florianópolis 88040900, Brazil
*
Author to whom correspondence should be addressed.
Separations 2022, 9(10), 294; https://doi.org/10.3390/separations9100294
Submission received: 22 August 2022 / Revised: 12 September 2022 / Accepted: 1 October 2022 / Published: 7 October 2022

Abstract

:
Phthalates are widely used in industry, but adverse effects on human health have been reported due to exposure to these chemicals. In the human body, they are metabolized into phthalic monoesters, which are used to monitor human exposure and assess risk. Urine is one of the main biological samples used, due to its easy access and collection, and also being the main elimination pathway for phthalates. Urine samples are complex; therefore, sample preparation is a critical step. Disposable pipette extraction (DPX) has not previously been reported for quantifying phthalates in urine and is here presented as a fast and low sample consumption method. A fully optimized RP-DPX method was developed for determination of free monomethyl phthalate, monobutyl phthalate, monobenzyl phthalate, and monoethylhexyl phthalate from urine samples. Analytical parameters of merit were obtained. The values of R2 were ≥0.9832, and the LOD and LOQ varied from 3.0 to 7.6 μg L−1 and 10 to 25 μg L−1, respectively. Intraday (n = 3) and interday (n = 9) precision were ≤13.6 and 15.6%. The accuracy, as relative recovery, presented a range from 83 to 120%. The method was robust after performing the Youden test. Compared to other methods, this work stands out due to its short extraction time and sample consumption.

1. Introduction

Phthalates (PA) are a class of chemical compounds that are widely used in industry and that present endocrine disrupting activities [1,2,3]. The structure of PA is based on alkyl esters of 1,2-benzenedicarboxylic acidTABLE [4], and they are used as plasticizers in different products, to improve some plastic properties such as flexibility, transparency, and durability [2,4,5]. Human exposure to these chemicals can occur through different pathways. Since these chemicals are not chemically bonded to the plastic structure, they can leach into different matrices that are in contact with these materials, such as water and foodstuffs [3,6,7]. Therefore, humans can be exposed to these chemicals, mainly through ingestion, inhalation, and dermal contact [2,3,7,8]. Exposure to these chemicals can represent a serious risk, since it is related to some health problems such as disorders of the reproductive and development systems [3,5,7,8].
In the human body, PAs are rapidly metabolized through hydrolysis, forming monoesters, such as mono methyl phthalate and mono butyl phthalate, among others. There have been reports of the biomonitoring of these compounds and their metabolites in different biological matrices, such as urine, semen, breast milk, saliva, and others [3,8]. Although different samples can be used to determine human exposure, urinary excretion is considered one of the major elimination pathways. In a recent review [3], the authors reported that urinary levels can be 5- to 20-times higher than in other samples [3,8]. Besides, urine is one the most widely used matrices for bioanalysis, since it is easily available and can be collected in a non-invasive way [9,10]. Despite its advantages, working with a urine sample is also a challenge, due to its high content of dissolved inorganic salts and sample variability, depending on the individual’s diet and dehydration level. Due to its composition and analyte concentration, a sample preparation step is also required before instrumental analysis [9,10].
Different sample preparation methods can be used for extraction and clean-up [9]. Among the classic methods, solid phase extraction (SPE) and liquid-liquid extraction (LLE) present some problems related to waste generation, the use of large amounts of toxic organic solvents, and time-consuming procedures. To overcome these issues, the development of microextraction techniques has been proposed [11,12,13], starting with solid-phase microextraction (SPME) [14]. For the pretreatment of samples for the analysis of PAs and their metabolites, SPE is commonly used [8], although other techniques have also been explored, such as LLE [15], magnetic solid phase extraction (MSPE) using magnetic carbon nanotubes [16], dispersive liquid–liquid microextraction (DLLME) [17,18], hollow fiber liquid-phase microextraction (HF-LPME) [19], and SPME [20,21]. However, direct analysis of urine samples has also been proposed [22]. Despite these advances in the determination of PAs in urine, different techniques can still be explored, such as disposable pipette extraction (DPX).
DPX was developed by Dr. William Brewer in 2003 [23] as one of the many modifications of SPE. It consists of a sorbent phase contained between two filters in a pipette tip. This phase is free inside the tip, and extraction occurs in a dynamic way when the sample and air are aspired. This technique allows a reduction of sample and solvent volume, as well as the sorbent quantity and extraction time. DPX is an unexplored and promising technique, due to its many advantages, such as easy manipulation and a fast and simple extraction procedure [6,24].
The analysis of PAs and their metabolites demands accurate and precise analytical methodologies. Sample preparation can be a critical step in the analytical procedure, representing a source of error, and is time and reagent consuming [11,12]. Therefore, the development of new, faster, simpler, and miniaturized techniques is very important, especially for bioanalysis. DPX represents an interesting and promising technique, and there are no reports in the literature of its use for the determination of phthalate metabolites. The objective of this study was to develop a method based on the commercial DPX-RP, a phase containing styrene-divinylbenzene for the fast determination of four phthalic monoesters in urine samples.

2. Materials and Methods

2.1. Reagents and Samples

Analytical standards of mono methyl phthalate (MMP), mono benzyl phthalate (MBzP), mono butyl phthalate (MBP), and mono 2-ethylhexyl phthalate (MEHP) with high purity (>97%) were purchased from Sigma-Aldrich (St. Louis, MO, USA). Stock solutions of 2 g L−1 of MMP, MBzP, and MBP were prepared by diluting appropriate amounts of analyte in methanol, and a stock solution of MEHP was prepared at 1 gL−1 in acetonitrile (ACN). A working solution of 10 mg L−1 was prepared by diluting appropriate amounts of stock solutions with ACN. MMP, MBzP, and MBP were used for the optimization procedure and MEHP was added to the study for the method validation step. This was possible because these analytes have similar physicochemical properties, such as log P and pKa, as we can see in Table S1; thus, their behavior due to changes in experimental conditions can be considered similar. Acetonitrile (ACN) and methanol (MeOH) HPLC grade, used as mobile phases for high performance liquid chromatography (HPLC), were obtained from J.T. Baker (Mallinckrodt, NJ, USA). Ortho-phosphoric acid (85%) was purchased from Neon. Ultrapure water (18.2 MΩ cm) was obtained from a water purification system (Mega Purity, Billerica, MA, USA). Hydrochloric acid (HCl) and sodium hydroxide (NaOH) of 1 mol L−1 and 0.1 mol L−1, respectively, were used for pH adjustment. DPX pipette tips of 1 mL, containing 20 mg of styrene-divinylbenzene (DPX-RP) were purchased from DPX technologies (Columbia, SC, USA).
Urine samples from different volunteers were collected in 40-mL amber glass flasks and were maintained under refrigeration until the sample preparation procedure. Sample pH was adjusted and then the samples were centrifuged at 3000 rpm for 5 min. Samples were spiked before pH adjustment. This study was approved by the Ethics Committee of the Universidade Federal de Santa Catarina with the number 00913718.3.0000.0121.

2.2. Instrumentation

A Shimadzu Prominence LC 20AT series HPLC system (Kyoto, Japan) equipped with a diode array detector (RF 20A series) with a manual injector containing a loop of 20 μL, model Rheodyne 7725i (Rohnert Park, CA, USA), was used for chromatographic analysis. Separation was performed in a reverse phase column C18 Phenomenex (5.0 μm, 4.6 mm, 250 mm) with a flow rate of 1 mL min−1. The gradient mode was carried out initially with 65% of ultrapure water containing 0.05% of ortho-phosphoric acid (B), and 35% of ACN containing 0.05% of ortho-phosphoric acid (A), and this condition was maintained until reaching 3.00 min, then from 3.00 min to 11.50 min, the concentration of B was linearly decreased to 20%, and again from 11.50 to 12.00 min to 0%, and this was maintained until 14.70 min. Finally, from 14.70 to 15.00 min, the initial condition was restored and maintained until 20.00 min. The monitored wavelength for analyte detection and quantification was 210 nm.

2.3. Sample Preparation Procedure

Before the extraction procedure, urine samples were diluted using ultrapure water and the pH was adjusted to 2.0, followed by centrifugation at 3000 rpm for 5 min. Before the extraction procedure, the commercial 1 mL DPX-RP pipette was conditioned using 2 cycles of aspiration/dispensing of MeOH. For the extraction procedure, 7 aspiration/dispensing cycles of 700 μL of sample each were performed (totalizing 4.9 mL of sample), then 2 aspiration/dispensing cycles of 300 μL of ultrapure water using new aliquots were performed as a clean-up stage. Finally, 1 cycle of aspiration/dispensing of 225 μL of ACN was used as desorption solvent. Then, 20 μL of this extract was injected into the HPLC system. To ensure the reuse of the DPX pipette tips, a cleaning procedure was selected using 5 cycles of aspiration/dispensing cycles with 300 μL of ACN, and new aliquots were used for every cycle.

2.4. Optimization of DPX Procedure

The optimizations were performed using urine samples spiked at 300 μg L−1. The extractor phase selected was a commercial DPX-RP (styrene divinylbenzene), as it has been established as an efficient adsorbent of nonpolar and low polar substances, as the phthalates are able to interact through π-π bonds between the aromatic rings of the analytes. The extraction procedure was optimized using univariate and multivariate approaches. The results for the univariate approach were evaluated using the normalized mean peak areas of the analytes. The results of multivariate approaches were evaluated using the geometric mean of the peak areas obtained for the analytes using the software Statsoft Statistica 7, and the results were evaluated through a response surface methodology. First, a clean-up procedure between the extraction and desorption steps was evaluated with a univariate approach using 2, 5, and 8 cycles of 300 μL of ultrapure water (with new aliquots for each cycle) performed in triplicate. Then a simplex lattice design with 9 experiments, presented in Table S2, was performed to evaluate ACN, MeOH, and ultrapure water at pH 8.0 and with a mixture of these solvents as desorption solvent. Following that, a Doehlert design with 9 experiments, presented in Table S3, was used to evaluate the volume of desorption solvent, from 150 to 300 μL, and desorption cycles, from 1 to 9 cycles using the same aliquot. Then, the extraction step was evaluated using a Doehlert design, with the experiments presented in Table S4, to evaluate sample volume, from 300 to 700 μL, and extraction cycles, from 3 to 7, using new aliquots for each cycle. These analytes have pKa of 3.08; therefore, sample pH can significantly affect the extraction efficiency, and the next step was the evaluation of sample pH using a univariate approach at pH 2.0, 3.0, and 4.0, with experiments performed in triplicate. In addition, a cleaning step after the extraction procedure was evaluated, to ensure the reuse of DPX-RP tips. Therefore, a univariate approach was used for experiments using 1 to 6 cycles of 300 μL of the desorption solvent chosen, using new aliquots performed in triplicate. Finally, the influence of urine dilution was evaluated using urine dilution rates of 5, 10, and 20 (all samples with the same final concentration) performed in triplicate. The procedure performed is shown in Figure S1, with the respective steps involved.

2.5. Determination of Analytical Parameters of Merit and Method Application

Diluted urine samples were spiked at six concentration levels, and extraction was performed using an optimized method to obtain the analytical calibration curves for each analyte and other important parameters, such as the determination coefficient (R2), limit of detection (LOD) and quantification (LOQ), and the linear working range. LOQ was considered the lowest concentration of the linear range that obtained adequate values of precision and accuracy, and LOD was considered LOQ/3.33. Precision was evaluated through the relative standard deviation (RSD). Intraday precision was evaluated in three levels of concentration (25, 150, and 300 μg L−1) in triplicate (n = 3), and inter day precision was evaluated with diluted urine samples spiked at 150 μg L−1 performed in triplicate over three days (n = 9). The relative recovery was used to ensure the method’s accuracy. The experiments were performed using samples from two volunteers, the diluted samples were spiked at three concentration levels (25, 150, and 300 μg L−1) and experiments were performed in triplicate. Finally, the method’s robustness was evaluated using the Youden method. Seven experimental parameters that can affect extraction efficiency were selected; small variations were applied to these parameters, and they were combined in eight experiments, as seen in Table S5. The results were evaluated using the geometric mean of peak area for the analytes in each experiment and a Lenth plot.

3. Results and Discussion

3.1. Method Optimization

3.1.1. Evaluation of the Washing Step

After the extraction cycle, it is possible to establish a washing step before desorption, to remove possible interferents [24]. Preliminary tests were carried out using ultrapure water and up to five cycles of new aliquots. The results were evaluated qualitatively, due to the improvement of the analytical signal for MMP observed when this step was performed, probably because of the elimination of some interferents. Then, experiments performed in triplicate were carried out for further investigation using two, five, and eight cycles of the washing step. The results are presented in Figure S2, with a bar graph using the normalized mean peak areas for each analyte. As seen in this figure, there was no significant difference between the use of different washing cycles, and therefore two cycles were selected as optimum. The influence of the washing cycles can be better observed in the chromatogram presented in Figure S3, where it is possible to see a significant difference in the signal for MMP, leading to a more accurate analysis, due to the mitigation of some matrix effects.

3.1.2. Selection of Desorption Solvent

A simplex lattice design was used to select the best solvent or mixture of solvents to perform liquid desorption of the analytes, while ensuring good extraction efficiencies. For this purpose, MeOH, ACN, water at pH 8.0, and mixtures of these solvents were tested. The results are presented as a response surface in Figure 1, based on the geometric mean of the peak areas for the analytes in each experiment. The surface was constructed with a quadratic model with a determination coefficient of 0.9971, which shows the good correlation between the experimental data and the mathematical model. As can be seen in Figure 1, there was a tendency for better results when ACN was used, and this may have been related to the polarity of the analytes and the solvents, since analytes present a low polarity, with log p values varying from 1.13 to 4.66, as seen in Table S1. Thus, it was selected as desorption solvent and used in the subsequent experiments.

3.1.3. Number of Desorption Cycles and Volume

In order to obtain the best desorption conditions, a Doehlert design was used to evaluate the number of desorption cycles (1 to 9) and the volume of solvent used (150 to 300 μL). The results are presented by the response surface in Figure S4. This surface was obtained using a quadratic model, with a determination coefficient of 0.84944, which represents a good correlation between the model obtained and the experimental data. As can be seen in Figure S4, there was a tendency to achieve better extraction efficiencies when fewer desorption cycles were used; thus one desorption cycle was selected as optimum. It can also be observed that the volume of the desorption solvent did not significantly affect the results, and thus, to accurately select this value, a univariate approach was proposed. The experiments were carried out using the previous selected conditions using three volumes of desorption solvent, 150, 225, and 300 μL. The results of these experiments performed in triplicate are presented in Figure S5 as the normalized mean peak areas for each analyte. As seen in Figure S5, due to the error bars, there was no significant difference between the different volumes for MMP and MBP. For MBzP, 150 μL presented the lowest extraction efficiency. To utilize a compromise condition, 225 μL was selected, since it has good extraction efficiency values and lower error bars, which could affect the method’s precision.

3.1.4. Number of Desorption Cycles and Volume

The influence of the number of extraction cycles and volume of sample in the efficiency of the DPX procedure was evaluated with a Doehlert design. The results are presented as a response surface in Figure 2, constructed using the geometric mean of the peak areas of the analytes for each experiment and a quadratic function with determination coefficient of 0.86368, showing a good correlation between the experimental data and the mathematical model proposed. As seen in Figure 2, the maximum values of both variables resulted in better extraction efficiencies; this could have been related to the increase of analyte available for extraction when a greater volume and more cycles were used, without saturating the extractor phase [25,26]. Thus, seven cycles using new aliquots of 700 μL of sample each, totalizing 4.9 mL of sample for the procedure, were selected as the optimum extraction condition.

3.1.5. Adjustment of Sample pH

As stated before, these analytes have pKa values of 3.08, which means that they have different chemical species depending on the pH, neutral or ionized. Generally, better extraction efficiencies are obtained with neutral analytes [27], and therefore the analysis of pH adjustment is of extreme importance. A univariate approach was used to evaluate pH adjustments of 2.0, 3.0, and 4.0, performed in triplicate, and the results are presented as a bar graph in Figure S6, using the normalized mean peak areas for each analyte. Better extraction efficiencies were expected when using pH 2, since the pKa of the analytes is 3.08. Thus, better extraction efficiencies were obtained for pH 2, and a decrease in extraction efficiency was observed when the pH was increased, due to the increased quantity of ionized species (Figure S6). Thus, as the optimum condition, adjustment of the sample at pH 2.0 was used in the subsequent experiments.

3.1.6. Evaluation of the Clean-Up Step

To avoid the carry-over effect, a clean-up step was evaluated, in order to ensure the reuse of the DPX. For that, cycles of 300 μL of ACN were added after the extraction procedure, evaluating 1 to 6 cycles of new aliquots, and these experiments were performed in triplicate. The objective was to ascertain how many cycles were necessary for there to be no chromatographic response of the analytes. To better understand the results, the graph presented in Figure S7 was constructed using the average of the sum of the chromatographic peak areas of the analytes in each experiment. As seen in Figure S6, a significant decrease was observed from one to two cycles, and efficient clean-up was obtained with five cycles, thus being added to the experimental procedure after extraction and desorption.

3.1.7. Evaluation of Sample Dilution

The use of urine samples for biological monitoring presents some difficulties related to their composition. Urine samples present high contents of inorganic salts and differences in properties such as ionic strength and pH, due to the individual’s diet and dehydration level [9,10]. Therefore, urine dilution was studied, to avoid possible matrix effects and interferences. A univariate approach was used to evaluate dilution factors of 5, 10, and 20 times. These experiments were performed in triplicate, and all samples presented the same final concentration (300 μg L−1). The results are presented as a bar graph in Figure S8, using the normalized mean area of the chromatographic peak for each analyte. As seen in this figure, except for MMP, there was no significant difference between these three dilution ratios, due to the error bar. However, the dilution ratio of 10 stands out as the best result for all analytes and, thus, was selected as a compromise condition and used in the subsequent experiments.

3.2. Analytical Parameters of Merit

Using the optimized conditions, calibration curves were constructed using diluted urine sample from a volunteer, spiked at six levels of concentration and performed in triplicate (n = 3). Table 1 presents the analytical parameters of merit obtained with these curves, such as LOD, LOQ, and R2. The values of LOD and LOQ varied from 3.0 to 7.6 μg L−1 and 10 to 25 μg L−1, respectively. The values of R2 were all higher than 0.9832, showing a good linear correlation between the analytical response and the concentration of the analytes.
To ensure the accuracy and precision, other studies were carried out. Precision was evaluated through intraday and interday precision, as seen in Table 2. The results are presented as relative standard deviation (RSD), and the results varied from 0.3 to 13.6% for intraday precision and to lower than 15.6% for interday precision. These results are adequate for this concentration range; indeed, according to Rambla-Alegre et al. (2012) in an article that summarizes the values accepted by AOAC [28], for analytes at 100 ppb, the acceptable values of RSD are lower than 15%. Accuracy was evaluated through relative recovery, performed in two different samples spiked at three concentration levels, also presented in Table 2. Values varied from 83 to 108% for sample A, and 90 to 120% for sample B. These results are also adequate to ensure the method‘s accuracy; according to Rambla-Alegre et al. (2012) [28], for analytes at 100 ppb, recovery can vary from 80 to 110%, although some values are outside this range, this may be related to the matrix complexity. Moreover, the methodology was performed manually, and this can lead to errors and contamination during the execution of the method. For this, properly clean glassware and material were used, as well as gloves to avoid contact with skin, and the experiments were always carryied out in environments at a distance from the reagents and other materials.
Finally, the robustness of the method was evaluated with the Youden test, where seven parameters that can affect the response were selected and small variations were tested, and the response was verified. The Lenth method allows the development of a graphical response to evaluate the method‘s robustness, as presented in Figure 3. According to this figure, there are two error margins, the margin error (ME) and the simultaneous margin error (SME), and when multiple factors are analyzed, the SME must be taken into account. When a parameter crosses one of these lines, it significantly affects the response. Since none of the parameters selected were significant, the method was considered robust [29,30].

3.3. Application of the Method

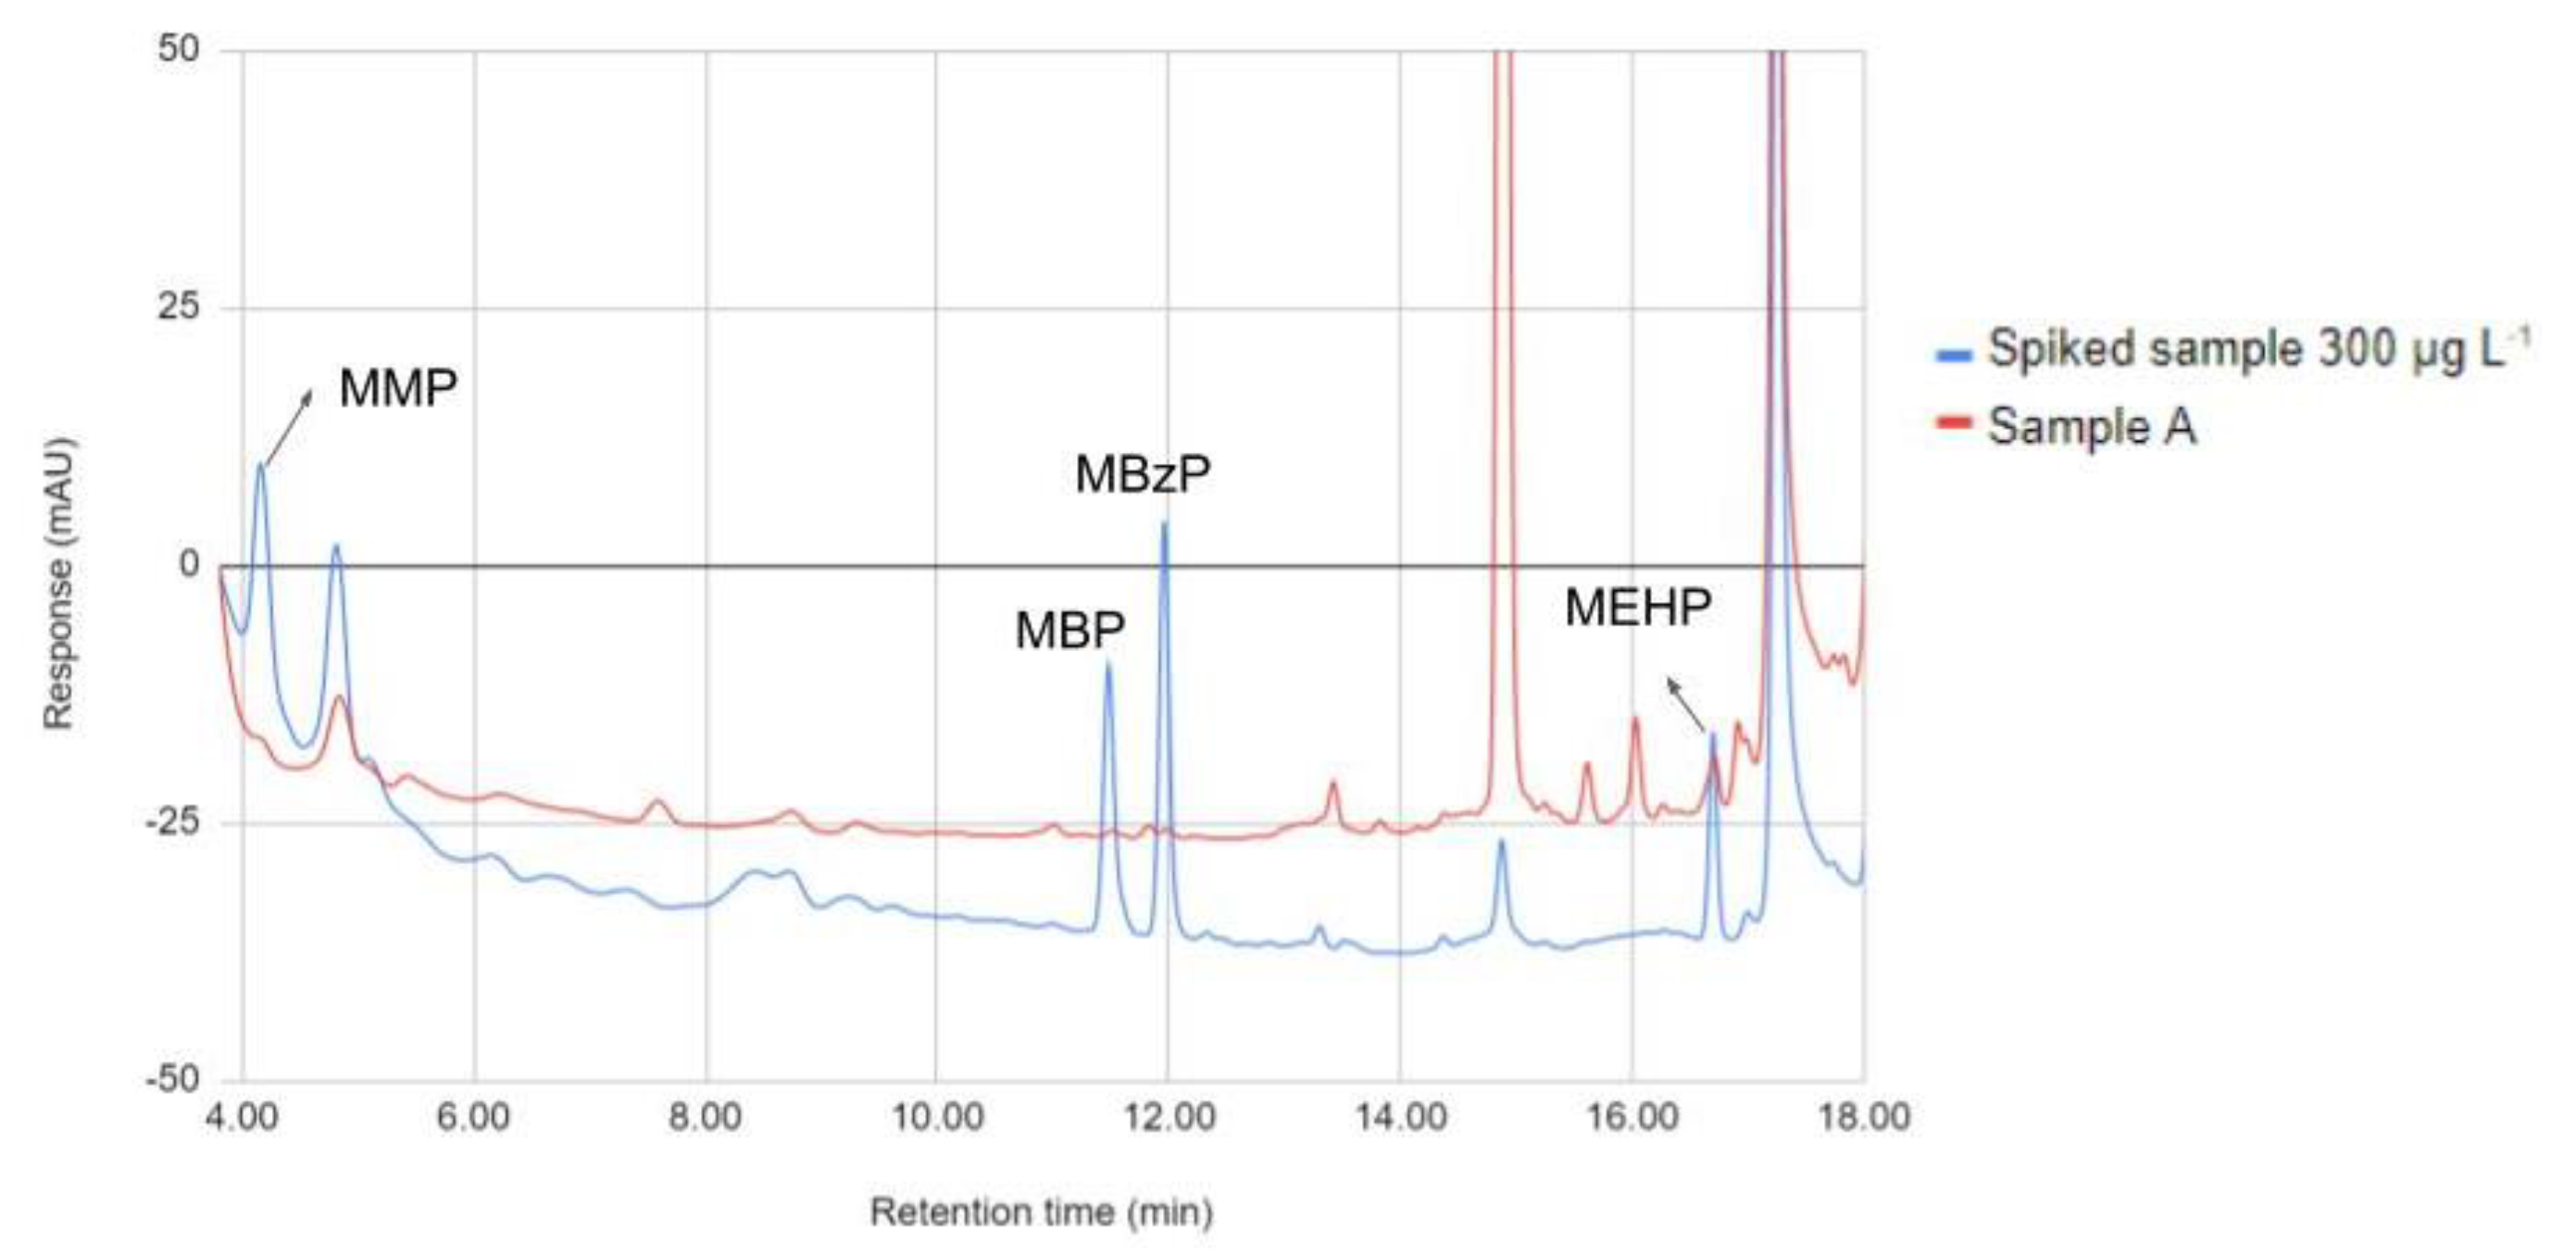
The optimized method was applied to four samples, and the results are presented in Table 3. Only sample A presented a MEHP lower than the LOQ, as can be seen in Table 3. A chromatogram of this sample is shown in Figure 4. In addition, a chromatogram of a blank sample is provided in Figure S9.

3.4. Comparison with Other Methods from the Literature

The main characteristics of the present method were compared to others from the literature and are presented in Table 4. This method stands out due to the low consumption of sample and the lower total time of the methodology (including the DPX procedure and instrumental analyses). Furthermore, the values for the linear working range are very similar to other methods presented in the literature and using a higher sample volume than this work.

4. Conclusions

A DPX method was successfully optimized for the determination of four phthalic monoesters in urine samples. The analytical parameters of merit were obtained by the construction of calibration curves for the extraction of diluted urine samples. Adequate values for curve linearity were observed by R2 values higher than 0.9832 with LOD and LOQ varying from 3.0 to 7.6 μg L−1 and 10 to 25 μg L−1, respectively. Furthermore, satisfactory values for accuracy, obtained with relative recovery studies, and precision, through intraday and interday precision, were obtained, while the robustness of the method was ensured using the Youden method. Finally, DPX proved to be a promising alternative for the determination of phthalic monoesters, with a linear working range very similar to other methods from the literature, as well as showing an improvement due to the low sample consumption and the short duration of the methodology.

Supplementary Materials

The following supporting information can be downloaded at: https://www.mdpi.com/article/10.3390/separations9100294/s1, Figure S1: A figure of the steps performed for the DPX procedure; Figure S2: Bar graph obtained for the optimization of the washing cycles (2, 5 and 8). (Experimental conditions: 3.5 mL of urine adjusted to pH 3.0 and spiked at 300 μg L-1. Extraction was performed with 5 cycles of 700 μL of sample using new aliquots, using variable washing cycles of 300 μL of ultrapure water and desorption using 5 cycles of 200 μL of ACN:MeOH (50:50, v:v)).; Figure S3: Comparative Chromatogram with detection wavelength of 210 nm using different washing cycles of ultrapure water between extraction and desorption, 2 cycles (pink), 5 cycles (blue) and 8 (green) and none (black); Figure S4: Response surface obtained for the Doehlert design used to evaluate desorption cycles and ACN volume. (Conditions: 3.5 mL of urine adjusted at pH 3.0 and spiked at 300 μg L-1. Extraction was performed with 5 cycles of 700 μL of sample using new aliquots, followed by 2 cycles of 300 μL of ultrapure water and desorption using variable number of cycles and ACN volume); Figure S5: Bar graph obtained for the evaluation of ACN volume. (Conditions: 3.5 mL of urine adjusted at pH 3.0 and spiked at 300 μg L-1. Extraction was performed with 5 cycles of 700 μL of sample using new aliquots, followed by 2 cycles of 300 μL of ultrapure water and desorption using 1 cycle of different volumes of ACN); Figure S6: Bar graph obtained for the optimization of sample pH. (Experimental conditions: 4.9 mL of urine sample adjusted at variable pH and spiked at 300 μg L-1. Extraction was performed with 7 cycles of 700 μL of sample for each cycle using new aliquots, followed by 2 cycles of 300 μL of ultrapure water and desorption using 1 cycle of 225 μL of ACN); Figure S7: Graph obtained for the study of the clean-up step. (Experimental conditions: 4.9 mL of urine sample adjusted at pH 2.0 and spiked at 300 μg L-1. Extraction was performed with 7 cycles of 700 μL of sample for each cycle using new aliquots, followed by 2 cycles of 300 μL of ultrapure water and desorption using 1 cycle of 225 μL of ACN); Figure S8: Bar graph obtained for urine dilution evaluation. (Experimental conditions: 4.9 mL of diluted urine sample adjusted at pH 2.0 and spiked at 300 μg L-1. Extraction was performed with 7 cycles of 700 μL of sample for each cycle using new aliquots, followed by 2 cycles of 300 μL of ultrapure water and desorption using 1 cycle of 225 μL of ACN); Figure S9: Chromatogram of a blank sample treated with the optimized procedure; Table S1: Physicochemical properties of the analytes selected for this study; Table S2; Experiments of the simplex lattice design performed to evaluate desorption solvent; Table S3: Experiments performed for the evaluation of desorption step with a Doehlert design; Table S4: Experiments performed for the evaluation of the extraction step with a Doehlert design; Table S5: Experiments performed in the Youden method.

Author Contributions

H.C.: Conceptualization, Experimental, Validation, Analysis, Writing, and reviewing. C.W.: Conceptualization, Analysis, Supervision, Writing—Original draft preparation. L.M.: Supervision, Writing and Reviewing. G.B.: Supervision, Writing and Reviewing. E.C.: Conceptualization, Supervision, Writing, and Reviewing. All authors have read and agreed to the published version of the manuscript.

Funding

Coordenação de Aperfeiçoamento de Pessoal de Nível Superior—Brasil (CAPES) and Conselho Nacional de Desenvolvimento Científico e Tecnológico (CNPq).

Conflicts of Interest

The authors declare no conflict of interest.

References

  1. Mínguez-Alarcón, L.; Bellavia, A.; Gaskins, A.J.; Chavarro, J.E.; Ford, J.B.; Souter, I.; Calafat, A.M.; Hauser, R.; Williams, P.L. Paternal mixtures of urinary concentrations of phthalate metabolites, bisphenol A and parabens in relation to pregnancy outcomes among couples attending a fertility center. Environ. Int. 2021, 146, 106171. [Google Scholar] [CrossRef]
  2. Martínez, M.A.; Rovira, J.; Sharma, R.P.; Schuhmacher, M.; Kumar, V. Reconstruction of phthalate exposure and DINCH metabolites from biomonitoring data from the EXHES cohort of Tarragona, Spain: A case study on estimated vs reconstructed DEHP using the PBPK model. Environ. Res. 2020, 186, 109534. [Google Scholar] [CrossRef]
  3. Wang, Y.; Zhu, H.; Kannan, K. A Review of Biomonitoring of Phthalate Exposures. Toxics 2019, 7, 21. [Google Scholar] [CrossRef] [Green Version]
  4. Latini, G. Monitoring phthalate exposure in humans. Clin. Chim. Acta 2005, 361, 20–29. [Google Scholar] [CrossRef] [PubMed]
  5. Mok, S.; Jeong, Y.; Park, M.; Kim, S.; Lee, I.; Park, J.; Kim, S.; Choi, K.; Moon, H.B. Exposure to phthalates and bisphenol analogues among childbearing-aged women in Korea: Influencing factors and potential health risks. Chemosphere 2021, 264, 128425. [Google Scholar] [CrossRef]
  6. Huelsmann, R.D.; Will, C.; Carasek, E. Novel strategy for disposable pipette extraction (DPX): Low-cost Parallel-DPX for determination of phthalate migration from common plastic materials to saliva simulant with GC-MS. Talanta 2021, 221, 121443. [Google Scholar] [CrossRef] [PubMed]
  7. Mankidy, R.; Wiseman, S.; Ma, H.; Giesy, J.P. Biological impact of phthalates. Toxicol. Lett. 2013, 217, 50–58. [Google Scholar] [CrossRef] [PubMed]
  8. Tsochatzis, E.D.; Tzimou-Tsitouridou, R.; Gika, H.G. Analytical Methodologies for the Assessment of Phthalate Exposure in Humans. Crit. Rev. Anal. Chem. 2017, 57, 279–297. [Google Scholar] [CrossRef] [PubMed]
  9. Souza-Silva, E.A.; Reyes-Garcés, N.; Gómez-Ríos, G.A.; Boyacı, E.; Bojko, B.; Pawliszyn, J. A critical review of the state of the art of solid-phase microextraction of complex matrices III. Bioanalytical and clinical applications. TrAC Trends Anal. Chem. 2015, 71, 249–264. [Google Scholar] [CrossRef]
  10. Mafra, G.; Spudeit, D.; Brognoli, R.; Merib, J.; Carasek, E. Expanding the applicability of cork as extraction phase for disposable pipette extraction in multiresidue analysis of pharmaceuticals in urine samples. J. Chromatogr. B 2018, 1102–1103, 159–166. [Google Scholar] [CrossRef]
  11. Carasek, E.; Morés, L.; Merib, J. Basic principles, recent trends and future directions of microextraction techniques for the analysis of aqueous environmental samples. Trends Environ. Anal. Chem. 2018, 19, e00060. [Google Scholar] [CrossRef]
  12. Carasek, E.; Merib, J. Membrane-based microextraction techniques in analytical chemistry: A review. Anal. Chim. Acta 2015, 880, 8–25. [Google Scholar] [CrossRef] [PubMed]
  13. Maciel, E.V.S.; de Toffoli, A.L.; Neto, E.S.; Nazario, C.E.D.; Lanças, F.M. New materials in sample preparation: Recent advances and future trends. TrAC Trends Anal. Chem. 2019, 119, 115633. [Google Scholar] [CrossRef]
  14. Arthur, C.L.; Pawliszyn, P. Solid phase microextraction with thermal desorption using fused silica optical fibers. Anal. Chem. 1990, 62, 2145–2148. [Google Scholar] [CrossRef]
  15. Jeong, S.H.; Jang, J.H.; Cho, H.Y.; Lee, Y.B. Toxicokinetics of diisobutyl phthalate and its major metabolite, monoisobutyl phthalate, in rats: UPLC-ESIMS/MS method development for the simultaneous determination of diisobutyl phthalate and its major metabolite, monoisobutyl phthalate, in rat plasma, urine, feces, and 11 various tissues collected from a toxicokinetic study. Food Chem. Toxicol. 2020, 145, 111747. [Google Scholar]
  16. Rastkari, N.; Ahmadkhaniha, R. Magnetic solid-phase extraction based on magnetic multi-walled carbon nanotubes for the determination of phthalate monoesters in urine samples. J. Chromatogr. A 2013, 1286, 22–28. [Google Scholar] [CrossRef]
  17. Sun, J.N.; Shi, Y.P.; Chen, J. Simultaneous determination of plasticizer di(2-ethylhexyl)phthalate and its metabolite in human urine by temperature controlled ionic liquid dispersive liquid–liquid microextraction combined with high performance liquid chromatography. Anal. Methods 2013, 5, 1427–1434. [Google Scholar] [CrossRef]
  18. Wu, J.; Ye, Z.; Li, X.; Wang, X.; Luo, F.; Sheng, B.; Li, Y.; Lyu, J. Optimization of a NH4PF6-enhanced, non-organic solvent, dual microextraction method for determination of phthalate metabolites in urine by high performance liquid chromatography. J. Chromatogr. B 2016, 1014, 1–9. [Google Scholar] [CrossRef] [PubMed]
  19. Fernandez, M.A.M.; André, L.C.; de LourdesCardeal, Z. Hollow fiber liquid-phase microextraction-gas chromatography-mass spectrometry method to analyze bisphenol A and other plasticizer metabolites. J. Chromatogr. A 2017, 1481, 31–36. [Google Scholar] [CrossRef] [PubMed]
  20. Elliani, R.; Naccarato, A.; Malacaria, L.; Tagarelli, A. A rapid method for the quantification of urinary phthalate monoesters: A new strategy for the assessment of the exposure to phthalate ester by solid-phase microextraction with gas chromatography and tandem mass spectrometry. J. Sep. Sci. 2020, 43, 3061–3073. [Google Scholar] [CrossRef]
  21. Alzaga, R.; Peña, A.; Bayona, J.M. Determination of phthalic monoesters in aqueous and urine samples by solid-phase microextraction–diazomethane on-fibre derivatization–gas chromatography–mass spectrometry. J. Sep. Sci. 2003, 26, 87–96. [Google Scholar] [CrossRef]
  22. Servaes, K.; Voorspoels, S.; Lievens, J.; Noten, B.; Allaerts, K.; Van De Weghe, H.; Vanermen, G. Direct analysis of phthalate ester biomarkers in urine without preconcentration: Method validation and monitoring. J. Chromatogr. A 2013, 1294, 25–32. [Google Scholar] [CrossRef] [PubMed]
  23. Brewer, W.E. Disposable Pipette Extraction. U.S. Patent 6566145B2, 20 May 2003. [Google Scholar]
  24. Bordin, D.C.M.; Alves, M.N.R.; de Campos, E.G.; Martinis, B.S.D. Disposable pipette tips extraction: Fundamentals, applications and state of the art. J. Sep. Sci. 2016, 39, 1168–1172. [Google Scholar] [CrossRef] [PubMed]
  25. Corazza, G.; Merib, J.; Magosso, H.A.; Bittencourt, O.O.; Carasek, E. A hybrid material as a sorbent phase for the disposable pipette extraction technique enhances efficiency in the determination of phenolic endocrine-disrupting compounds. J. Chromatogr. A 2017, 1513, 42–50. [Google Scholar] [CrossRef]
  26. Corazza, G.; Merib, J.; do Carmo, S.N.; Mendes, L.D.; Carasek, E. Assessment of a Fully Optimized DPX-Based Procedure for the Multiclass Determination of Pesticides in Drinking Water Using High-Performance Liquid Chromatography with Diode Array Detection. J. Braz. Chem. Soc. 2019, 30, 1211–1221. [Google Scholar] [CrossRef]
  27. Merib, J.; Spudeit, D.A.; Corazza, G.; Carasek, E.; Anderson, J.L. Magnetic ionic liquids as versatile extraction phases for the rapid determination of estrogens in human urine by dispersive liquid-liquid microextraction coupled with high performance liquid chromatography-diode array detection. Anal. Bioanal. Chem. 2018, 410, 4689–4699. [Google Scholar] [CrossRef]
  28. Rambla-Alegre, M.; Esteve-Romero, J.; Carda-Broch, S. Is it really necessary to validate an analytical method or not? That is the question. J. Chromatogr. A 2012, 1232, 101–109. [Google Scholar] [CrossRef]
  29. Leonardi, F.; Veschetti, M.; Tonnarini, S.; Cardellini, F.; Trevisi, R. A step towards accreditation: A robustness test of etching process. Appl. Radiat. Isot. 2015, 102, 93–97. [Google Scholar] [CrossRef]
  30. Karageorgou, E.; Samanidou, V. Youden test application in robustness assays during method validation. J. Chromatogr. A 2014, 1353, 131–139. [Google Scholar] [CrossRef]
  31. Sargazi, S.; Mirzaei, R.; Rahmani, M.; Mohammadi, M.; Khammari, A.; Sheikh, M. One-step in-syringe dispersive liquid–liquid microextraction and GC-FID determination of trace amounts of di(2-ethylhexyl) phthalate and its metabolite in human urine samples. J. Anal. Chem. 2017, 72, 557–561. [Google Scholar] [CrossRef]
  32. Ye, Z.; Ma, M.; Guo, Y.; Zong, M.; Ding, M.; Fan, L. Determination of Phthalate and Metabolites in Human Urine by Lithium Bis(trifluoromethanesulfonyl)imide-Enhanced Dual Microextraction Method Optimized by Central Composite Design. Chromatographia 2020, 83, 397–408. [Google Scholar] [CrossRef]
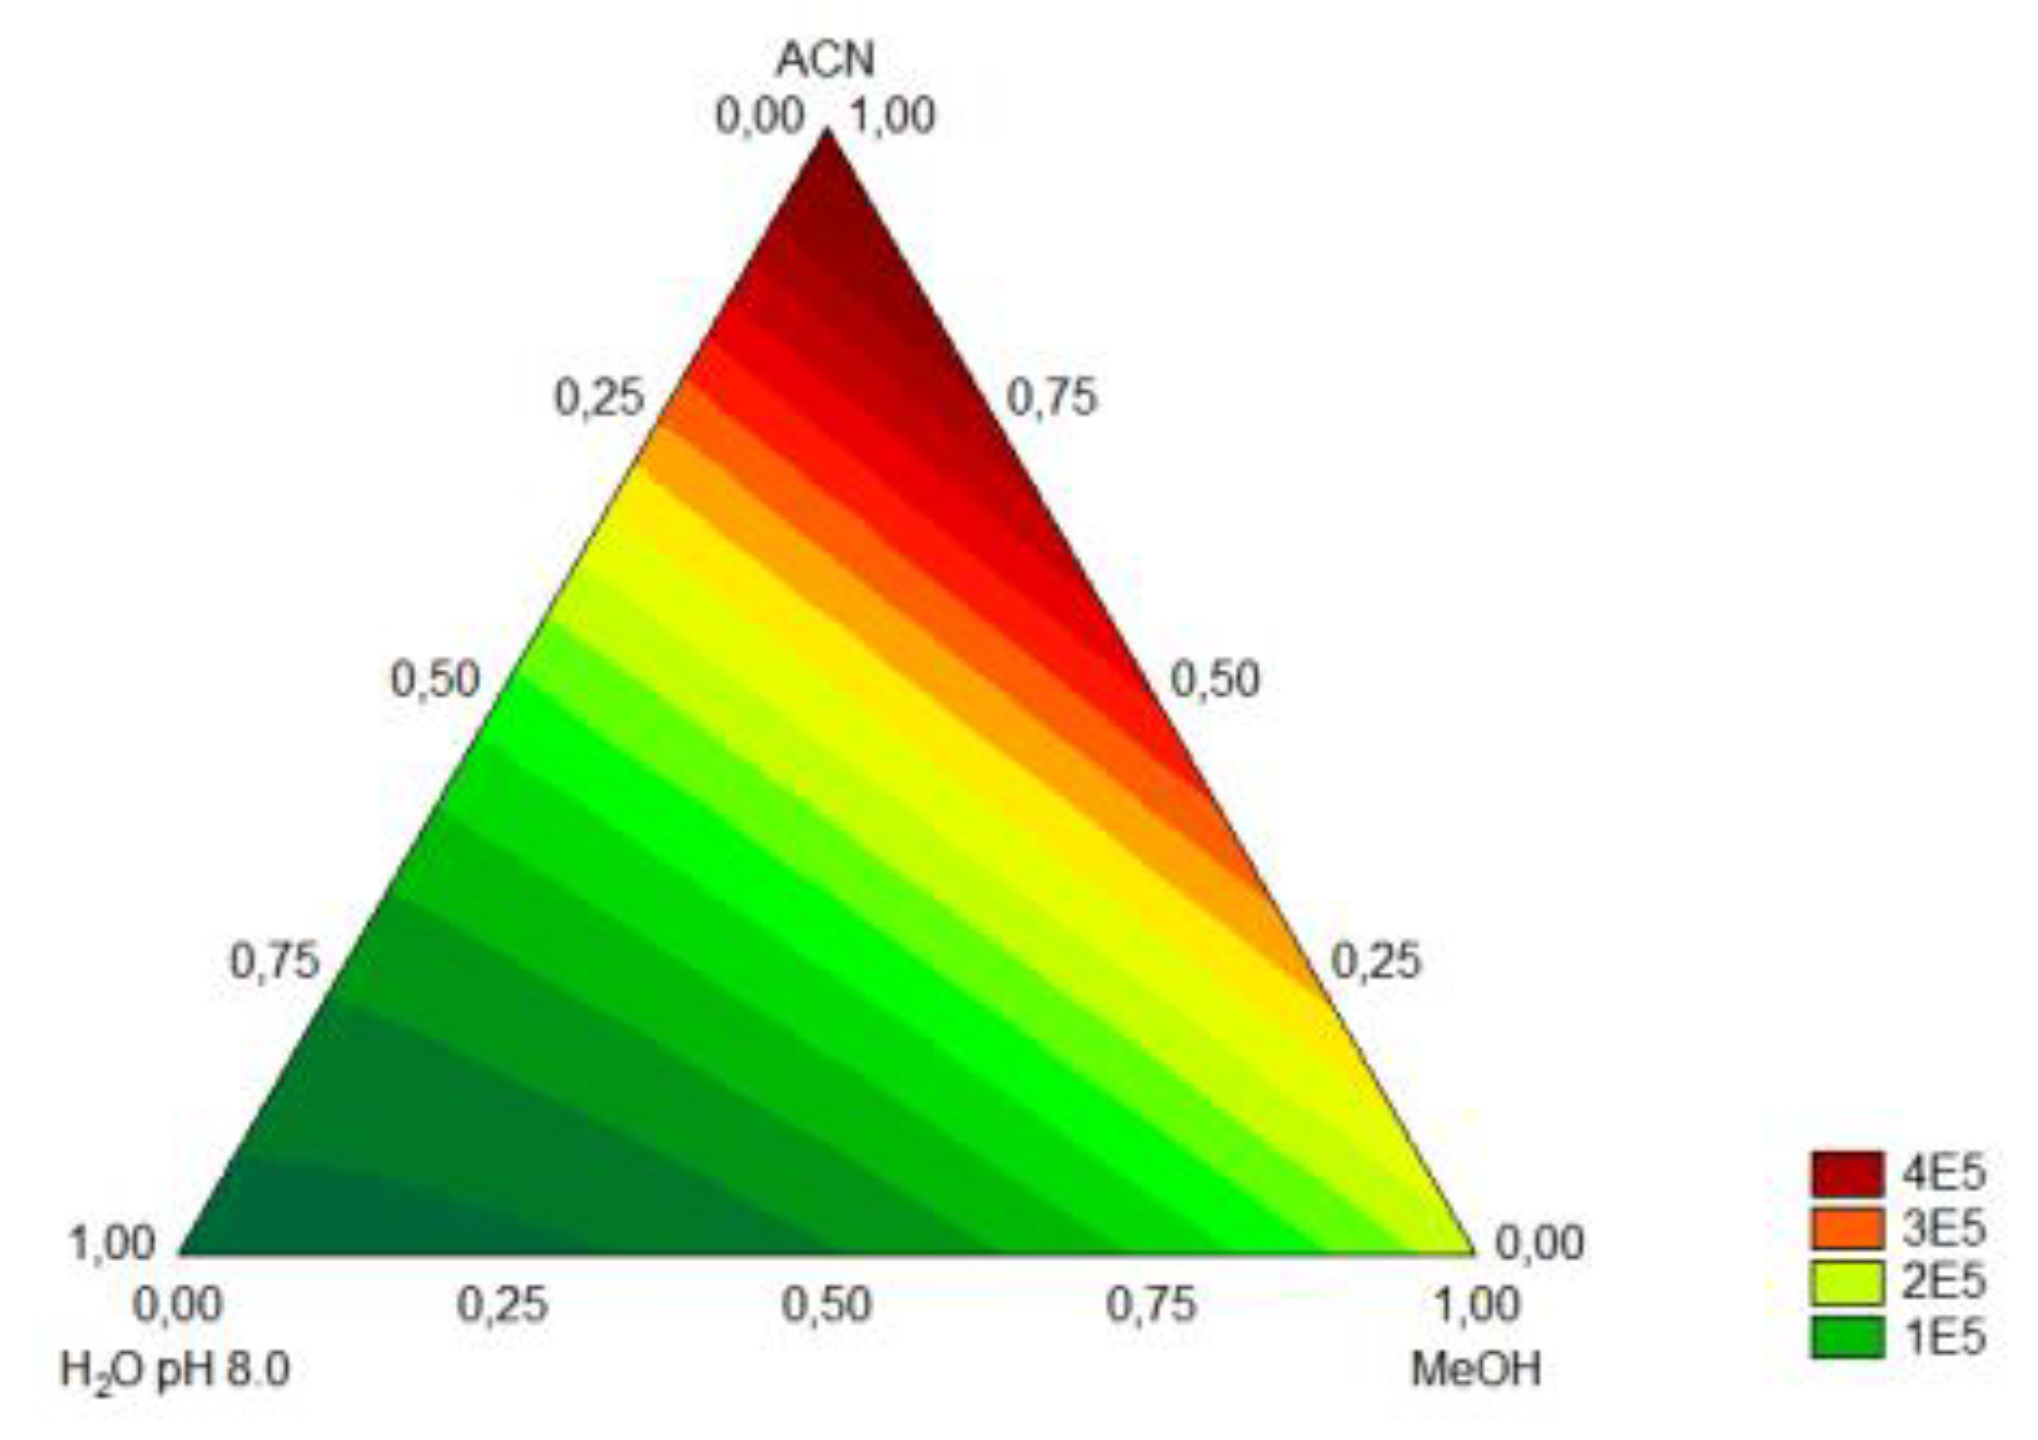
Figure 1. Response surface obtained for the selection of desorption solvent with simplex lattice design (Conditions: 3.5 mL of urine adjusted to pH 3.0 and spiked at 300 μg L−1. Extraction was performed with five cycles of 700 μL of sample using new aliquots, followed by two cycles of 300 μL of ultrapure water and desorption using five cycles of 200 μL of the solvent or mixture chosen for the experiment).
Separations 09 00294 g001
Figure 2. Response surface obtained for the optimization of number of extraction cycles and sample volume using a Doehlert design. (Condition: urine sample adjusted to pH 3.0 and spiked at 300 μg L−1. Extraction was performed with a different number of cycles and sample volume using new aliquots for each cycle, followed by 2 cycles of 300 μL of ultrapure water and desorption using 1 cycle of 225 μL of ACN).
Separations 09 00294 g002
Figure 3. Bar graph obtained with the Lenth method. (Factors represented for each bar from left to right: urine volume, sample pH, desorption cycles, extraction cycle volume, extraction cycles, washing cycles, and ACN volume).
Separations 09 00294 g003
Figure 4. Chromatogram obtained for the analysis of urine, with a blue line for a spiked sample (300 µg L−1) and a red line for sample A.
Separations 09 00294 g004
Table 1. Analytical parameters of merit for calibration curves using diluted urine samples.
AnalyteLOD (μg L−1)LOQ (μg L−1)Linear Range
(μg L−1)
R2Linear Equation
MMP7.62525–3000.9832y = 630.5x − 509.6
MBP7.62525–3000.9980y = 557.6x + 1331.7
MBzP3.01010–3000.9989y = 800.3x − 143.0
MEHP7.62525–3000.9919y = 330.7x − 1173.3
Table 2. Results obtained for the accuracy and precision of the method, with relative recovery 364 (%RR) studies and intraday and interday precision, respectively.
AnalyteSpiked Concentration (μg L−1)Relative Recovery (%)Precision (%RSD)
Sample ASample BIntraday (n = 3)Interday (n = 9)
MMP2595909.4
15083949.215.6
300921023.5
MBP251041064.8
15010211810.511.2
3001021098.8
MBzP251041050.3
150981167.010.4
300981089.0
MEHP259811913.6
1509812010.19.9
30010811010.8
Table 3. Results for the analyzed samples using the developed method.
SampleAgeMMPMBPMBzPMEHP
A23NDNDND<LOQ
B56NDNDNDND
C56NDNDNDND
D23NDNDNDND
ND: not detected.
Table 4. Comparison of the main characteristics of the developed method with others from the literature, for the analysis of phthalic monoesters in urine samples.
AnalytesSample Preparation TechniquesInstrumentationUrine Volume (mL)Linear Range (μg L−1)Total Time of MethodologyRef.
MMP, MBP, MBzP and MEHPDPXHPLC-DAD0.4910–300 and 25–300 >25 minThis work
MEHPTC-IL-DLLMEHPLC-DAD 20–1920 >50 min[17]
MBzP and MEHPANSDMHPLC-DAD12.0–1000>30.7 min[18]
MEHPIn-syringe DLLMEGC-FID120–3000 >30 min[31]
MMP, MBP, MBzP and MEHPHF-LPMEGC-MS1620–100, 20–500, 10–200 and 20–1000 3.2 h[19]
MBzP and MEHPIL-DLLMEHPLC-DAD12–500>1 h[32]
MBP and MEHPSPMEGC-MS/MS0.51–250 and 5–250 >4 h[20]
MMP, MBP, MBzP and MEHPMSPEGC-MS2.00.25–250>3 h[16]
C-IL-DLLME: Temperature controlled ionic liquid dispersive liquid-liquid microextraction ANSDM: NH4PF6-enhanced, non-organic solvent, dual microextraction.
Publisher’s Note: MDPI stays neutral with regard to jurisdictional claims in published maps and institutional affiliations.