
Efficient Removal of Eriochrome Black T Dye Using Activated Carbon of Waste Hemp (Cannabis sativa L.) Grown in Northern Morocco Enhanced by New Mathematical Models

 ,
,  ,
,  ,
,  ,
,  ,
,  ,
,  , and
, and
Abstract
Highlights
- The use of inexpensive, easily obtained, and ecological adsorbents.
- New bio-adsorbents were made for Colorant adsorption from an aqueous solution.
- EBT dye adsorption capacities ranged from 1.8 to 2.8 mg.g−1.
- Adsorptions of EBT dye by the activated carbon of cannabis.
- This study provides cost-effective and sustainable production of activated carbon.
- Application of mathematical modeling to develop new relevant mathematical models based on experimental results.
Abstract
1. Introduction
2. Materials and Methods
2.1. Preparation of Waste Hemp Activated Carbon (WHAC)
2.2. Characterization of the Activated Carbon
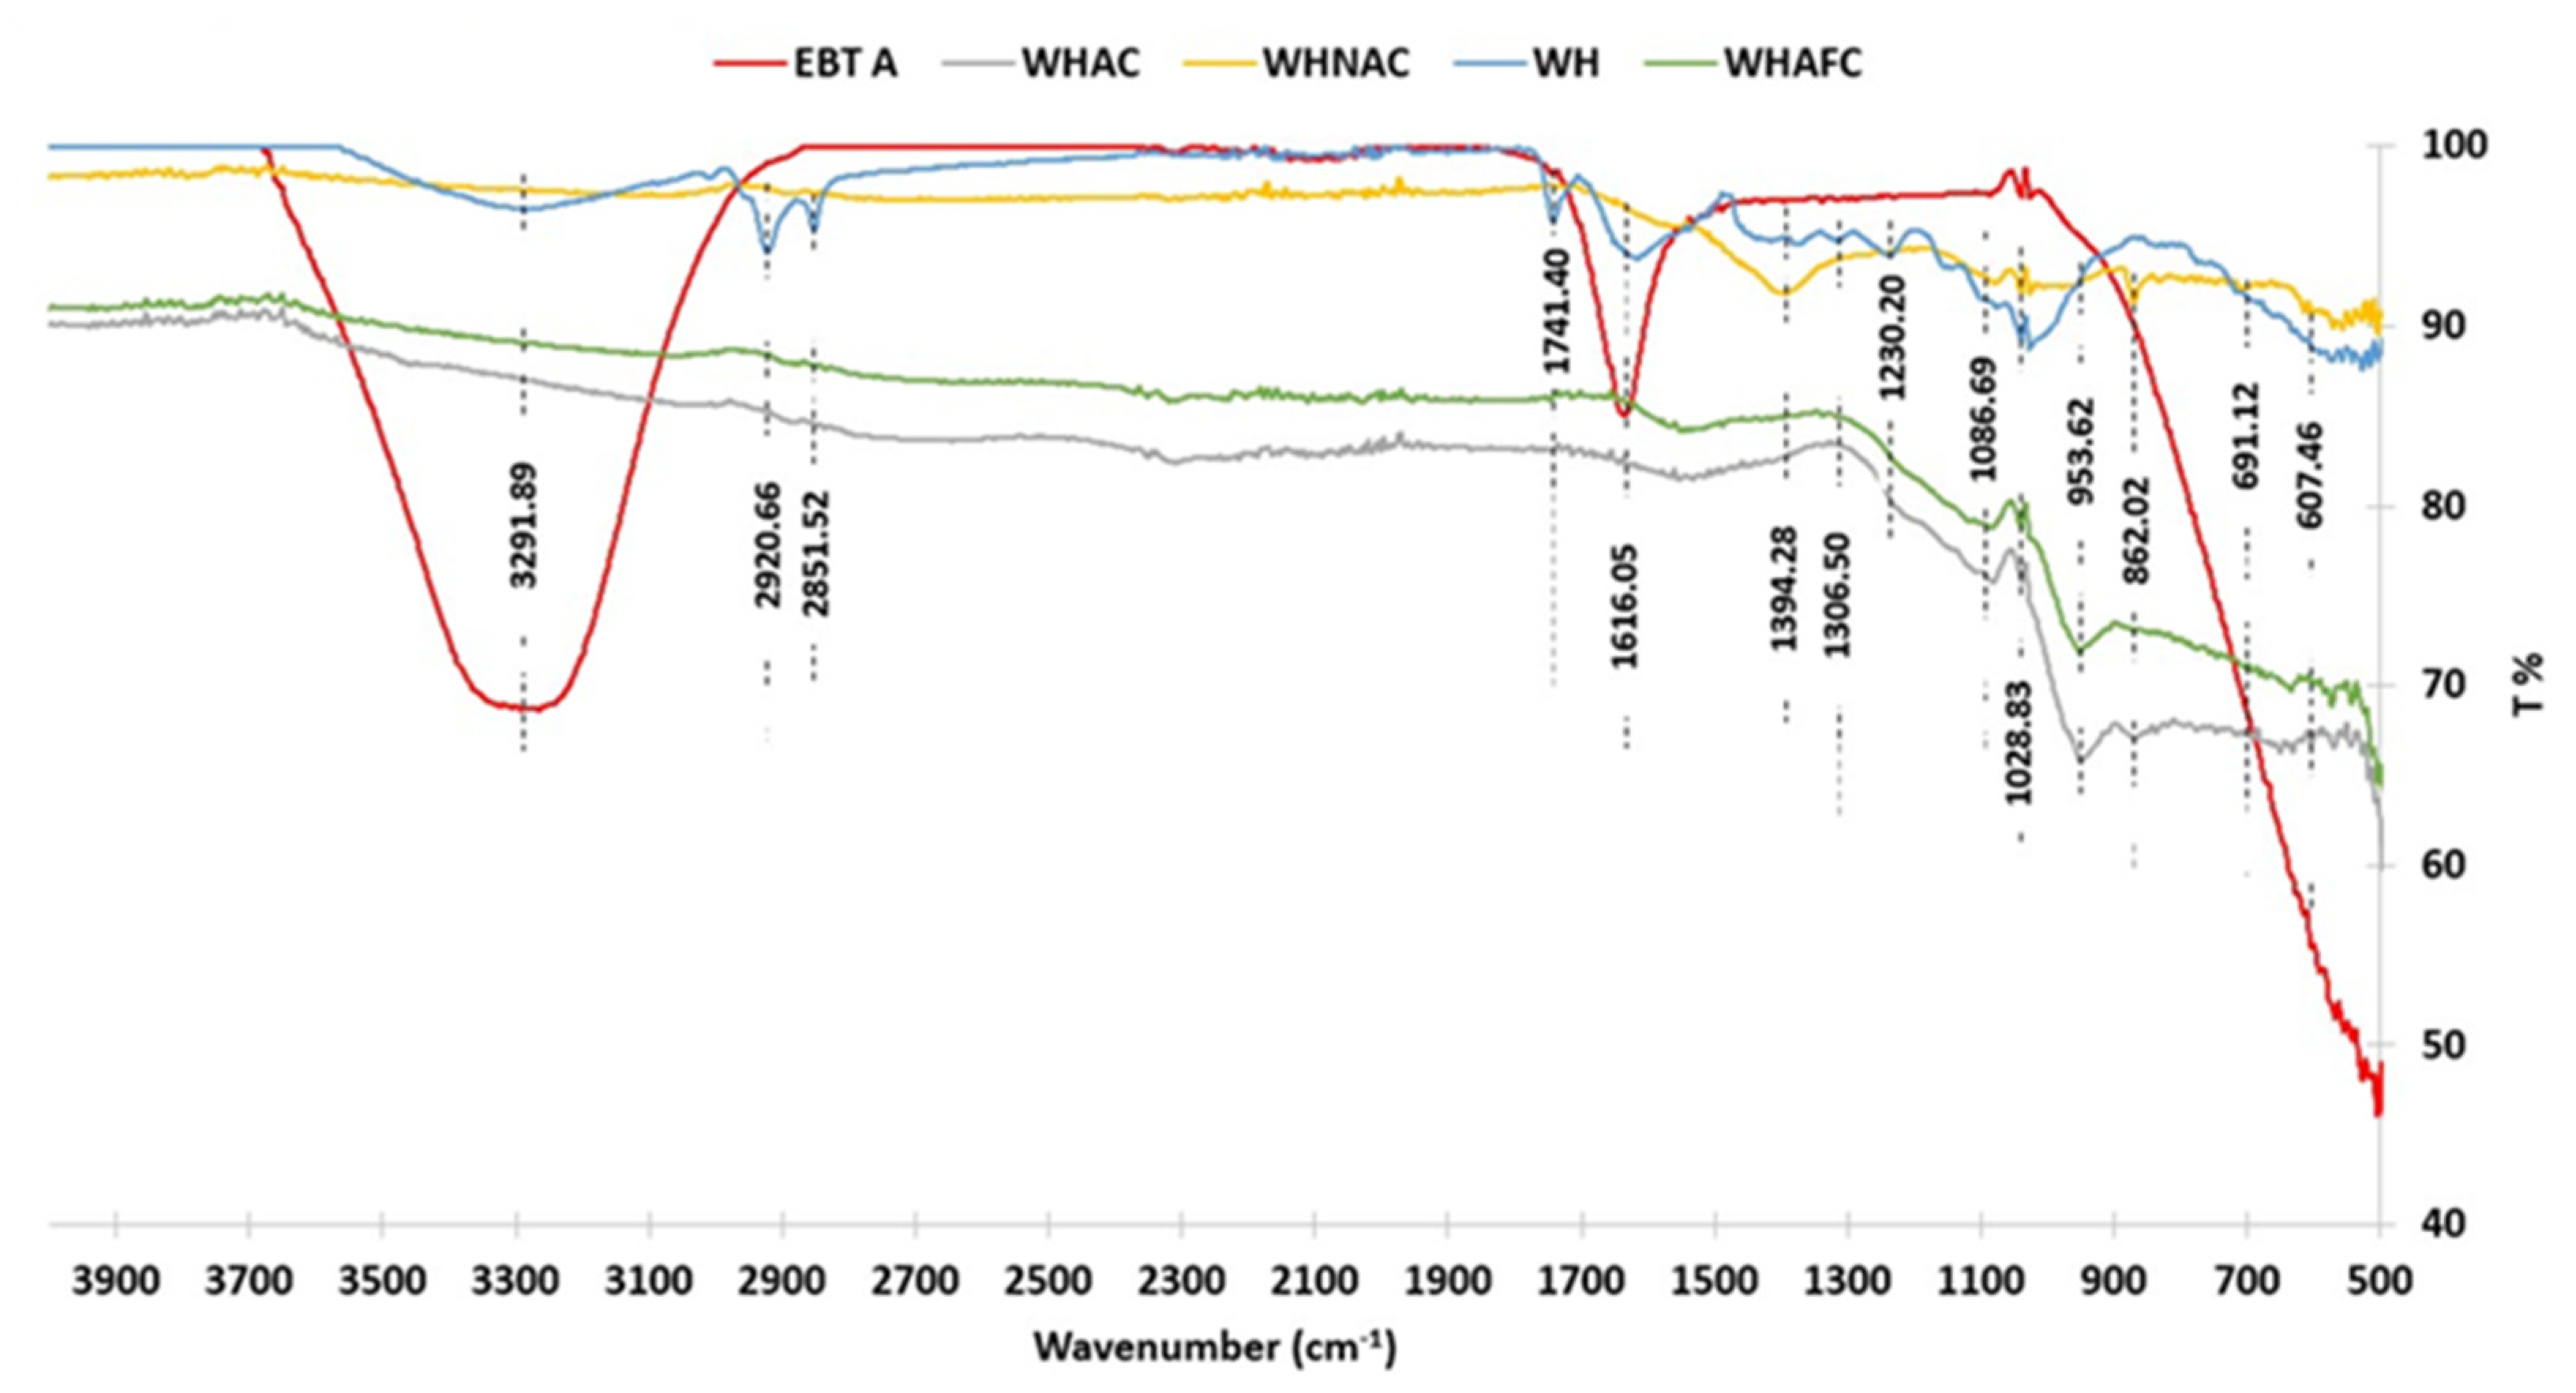
2.3. Functional Group Analysis by FTIR
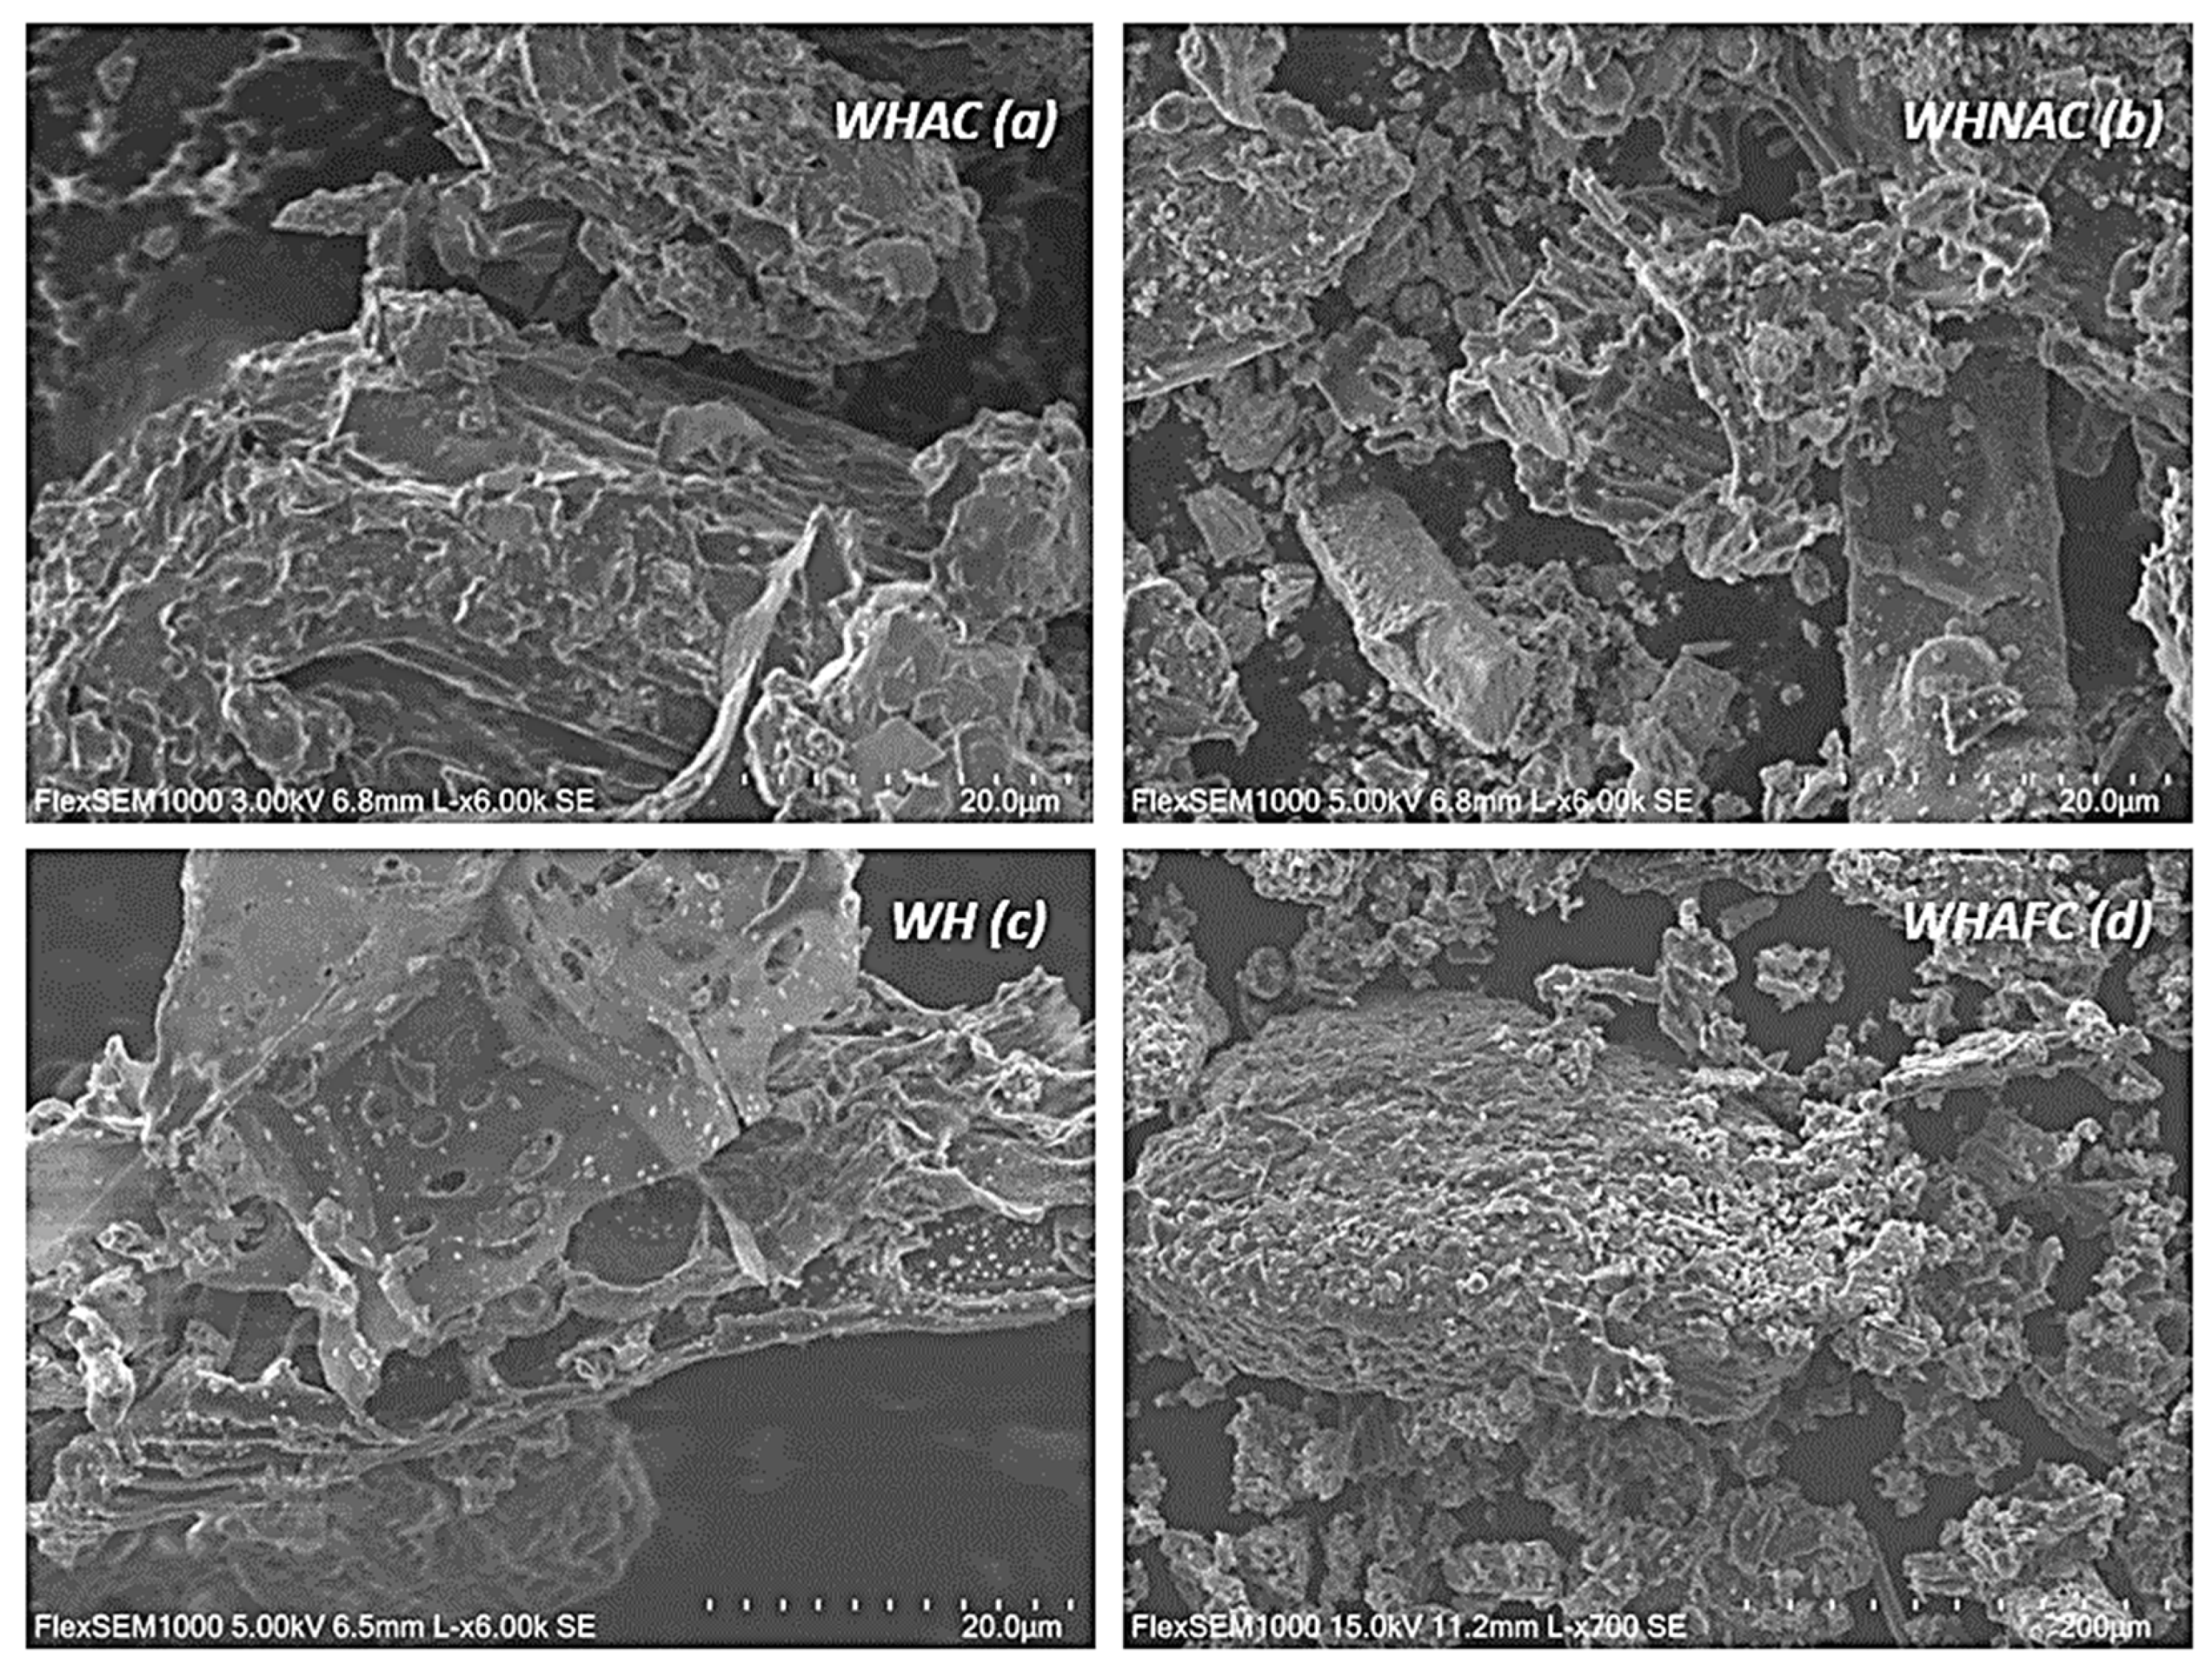
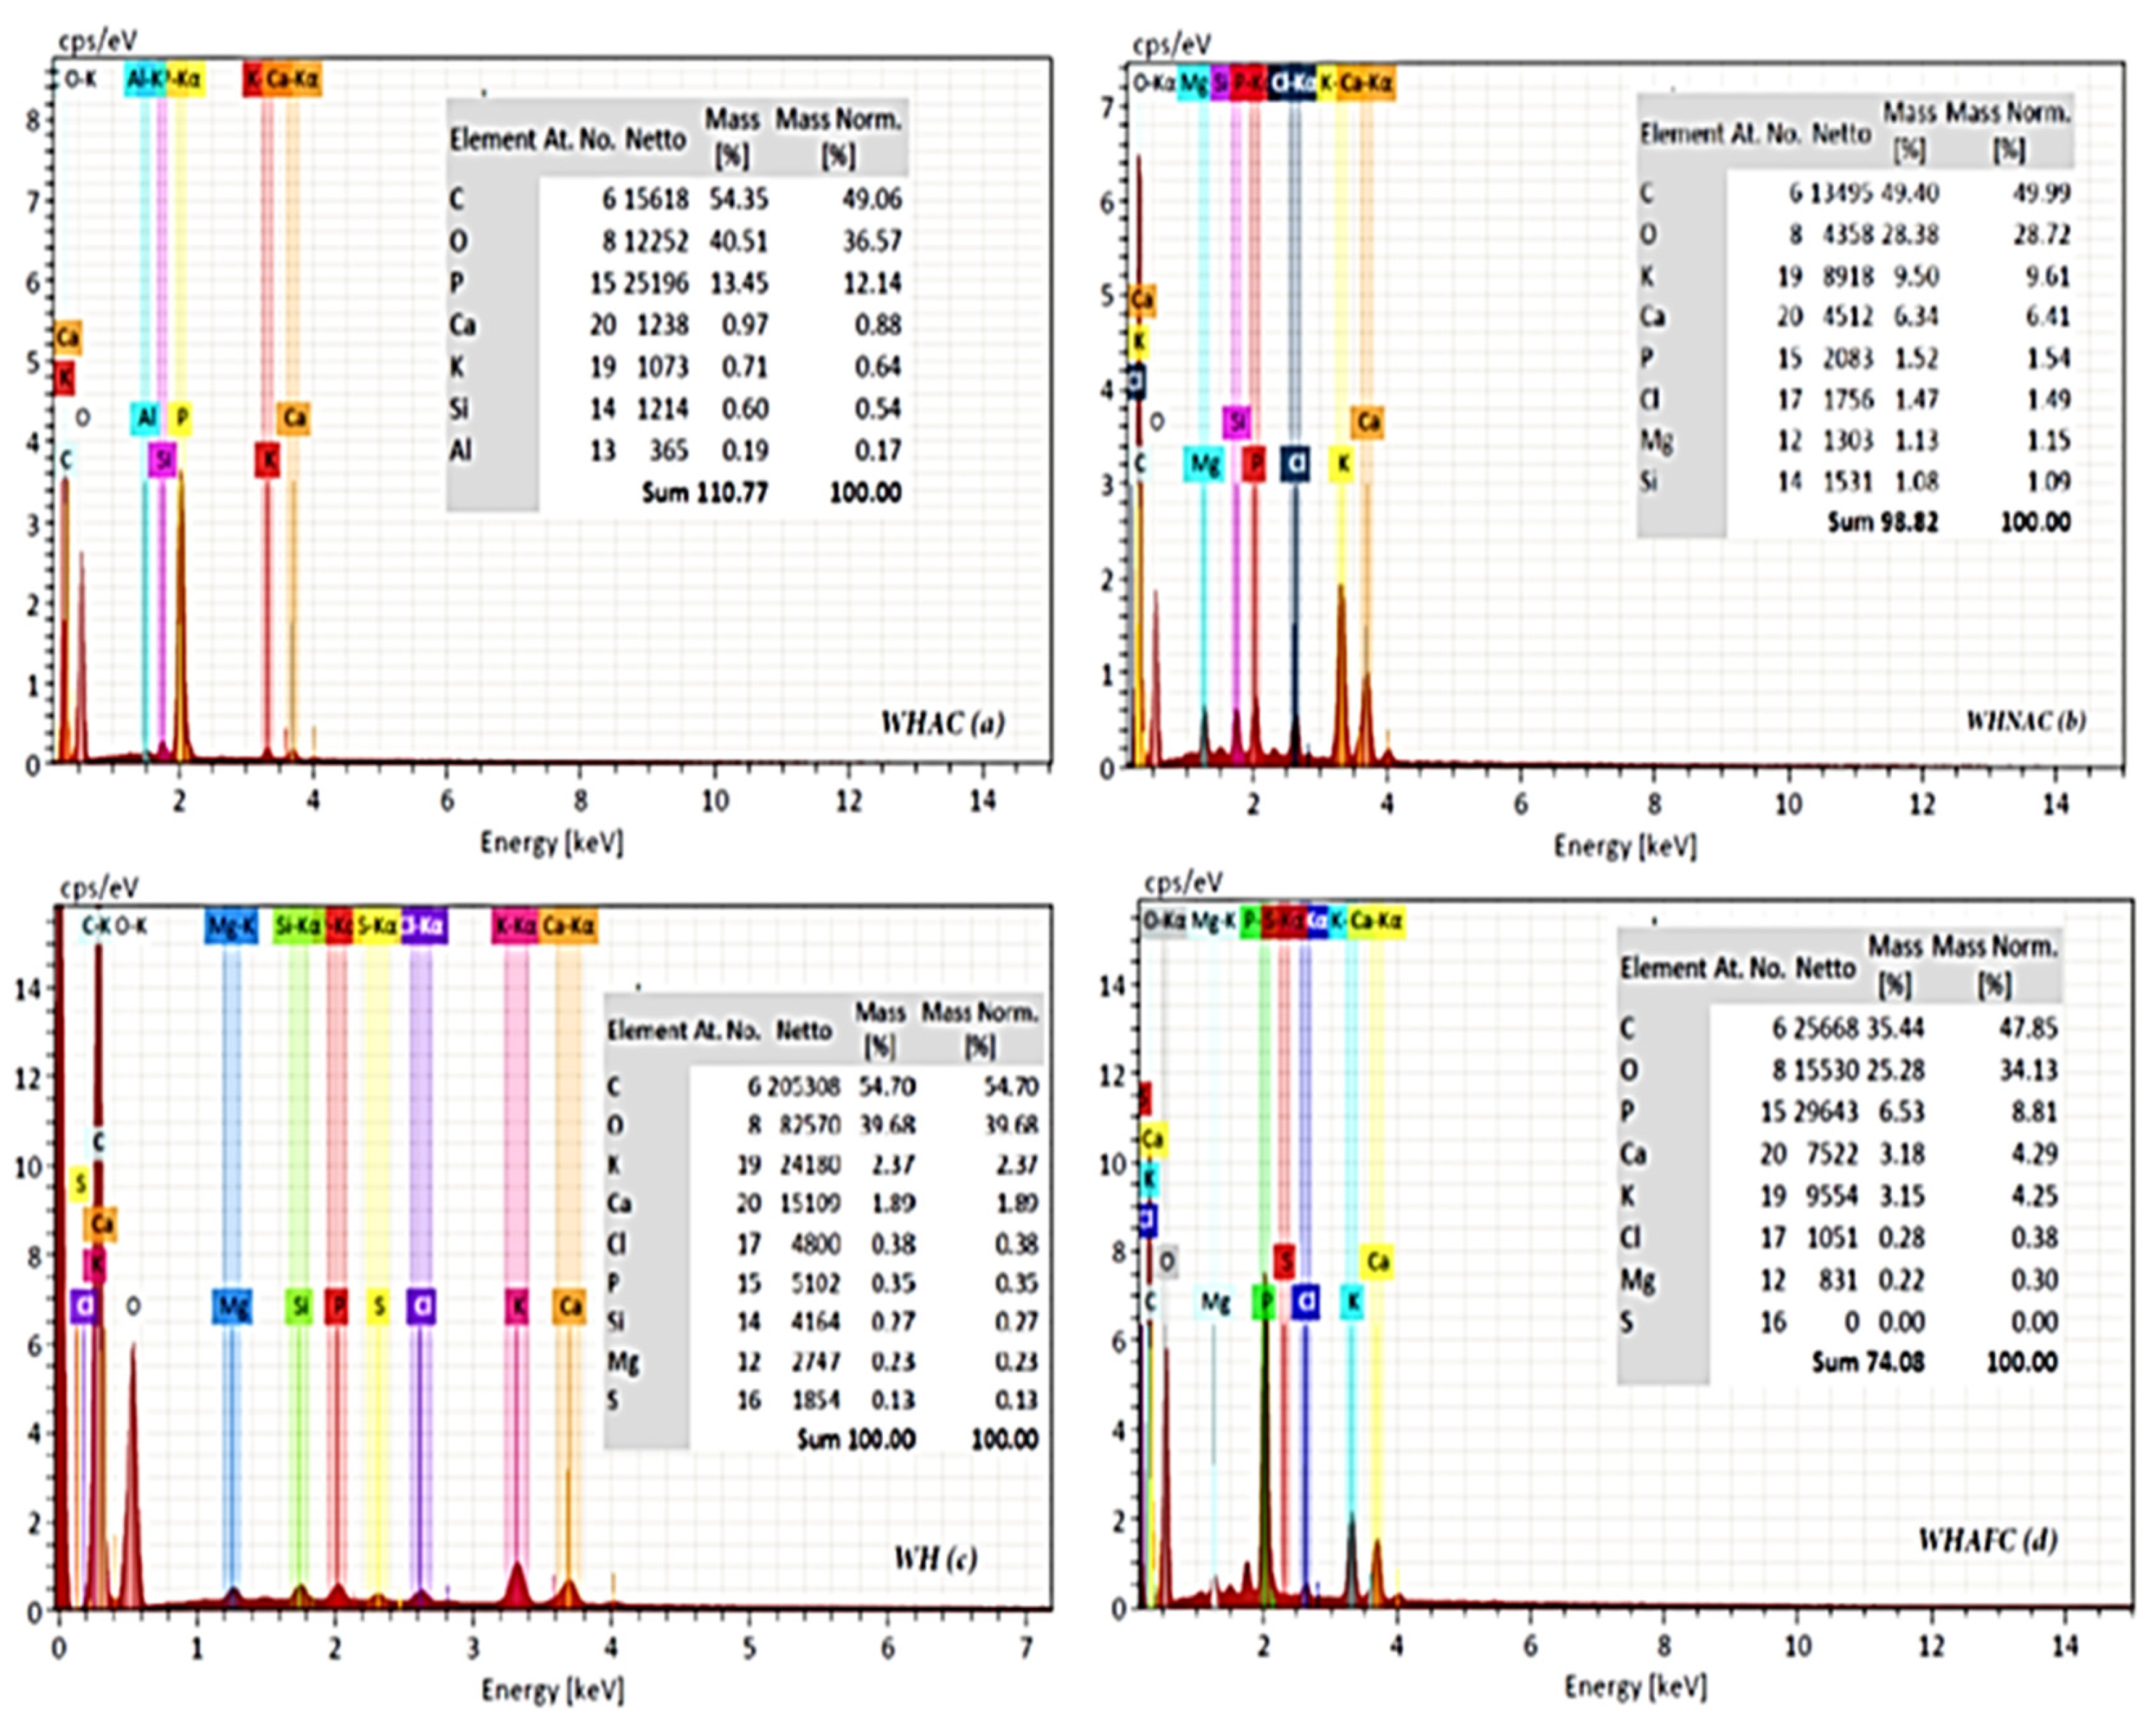
2.4. SEM/EDX
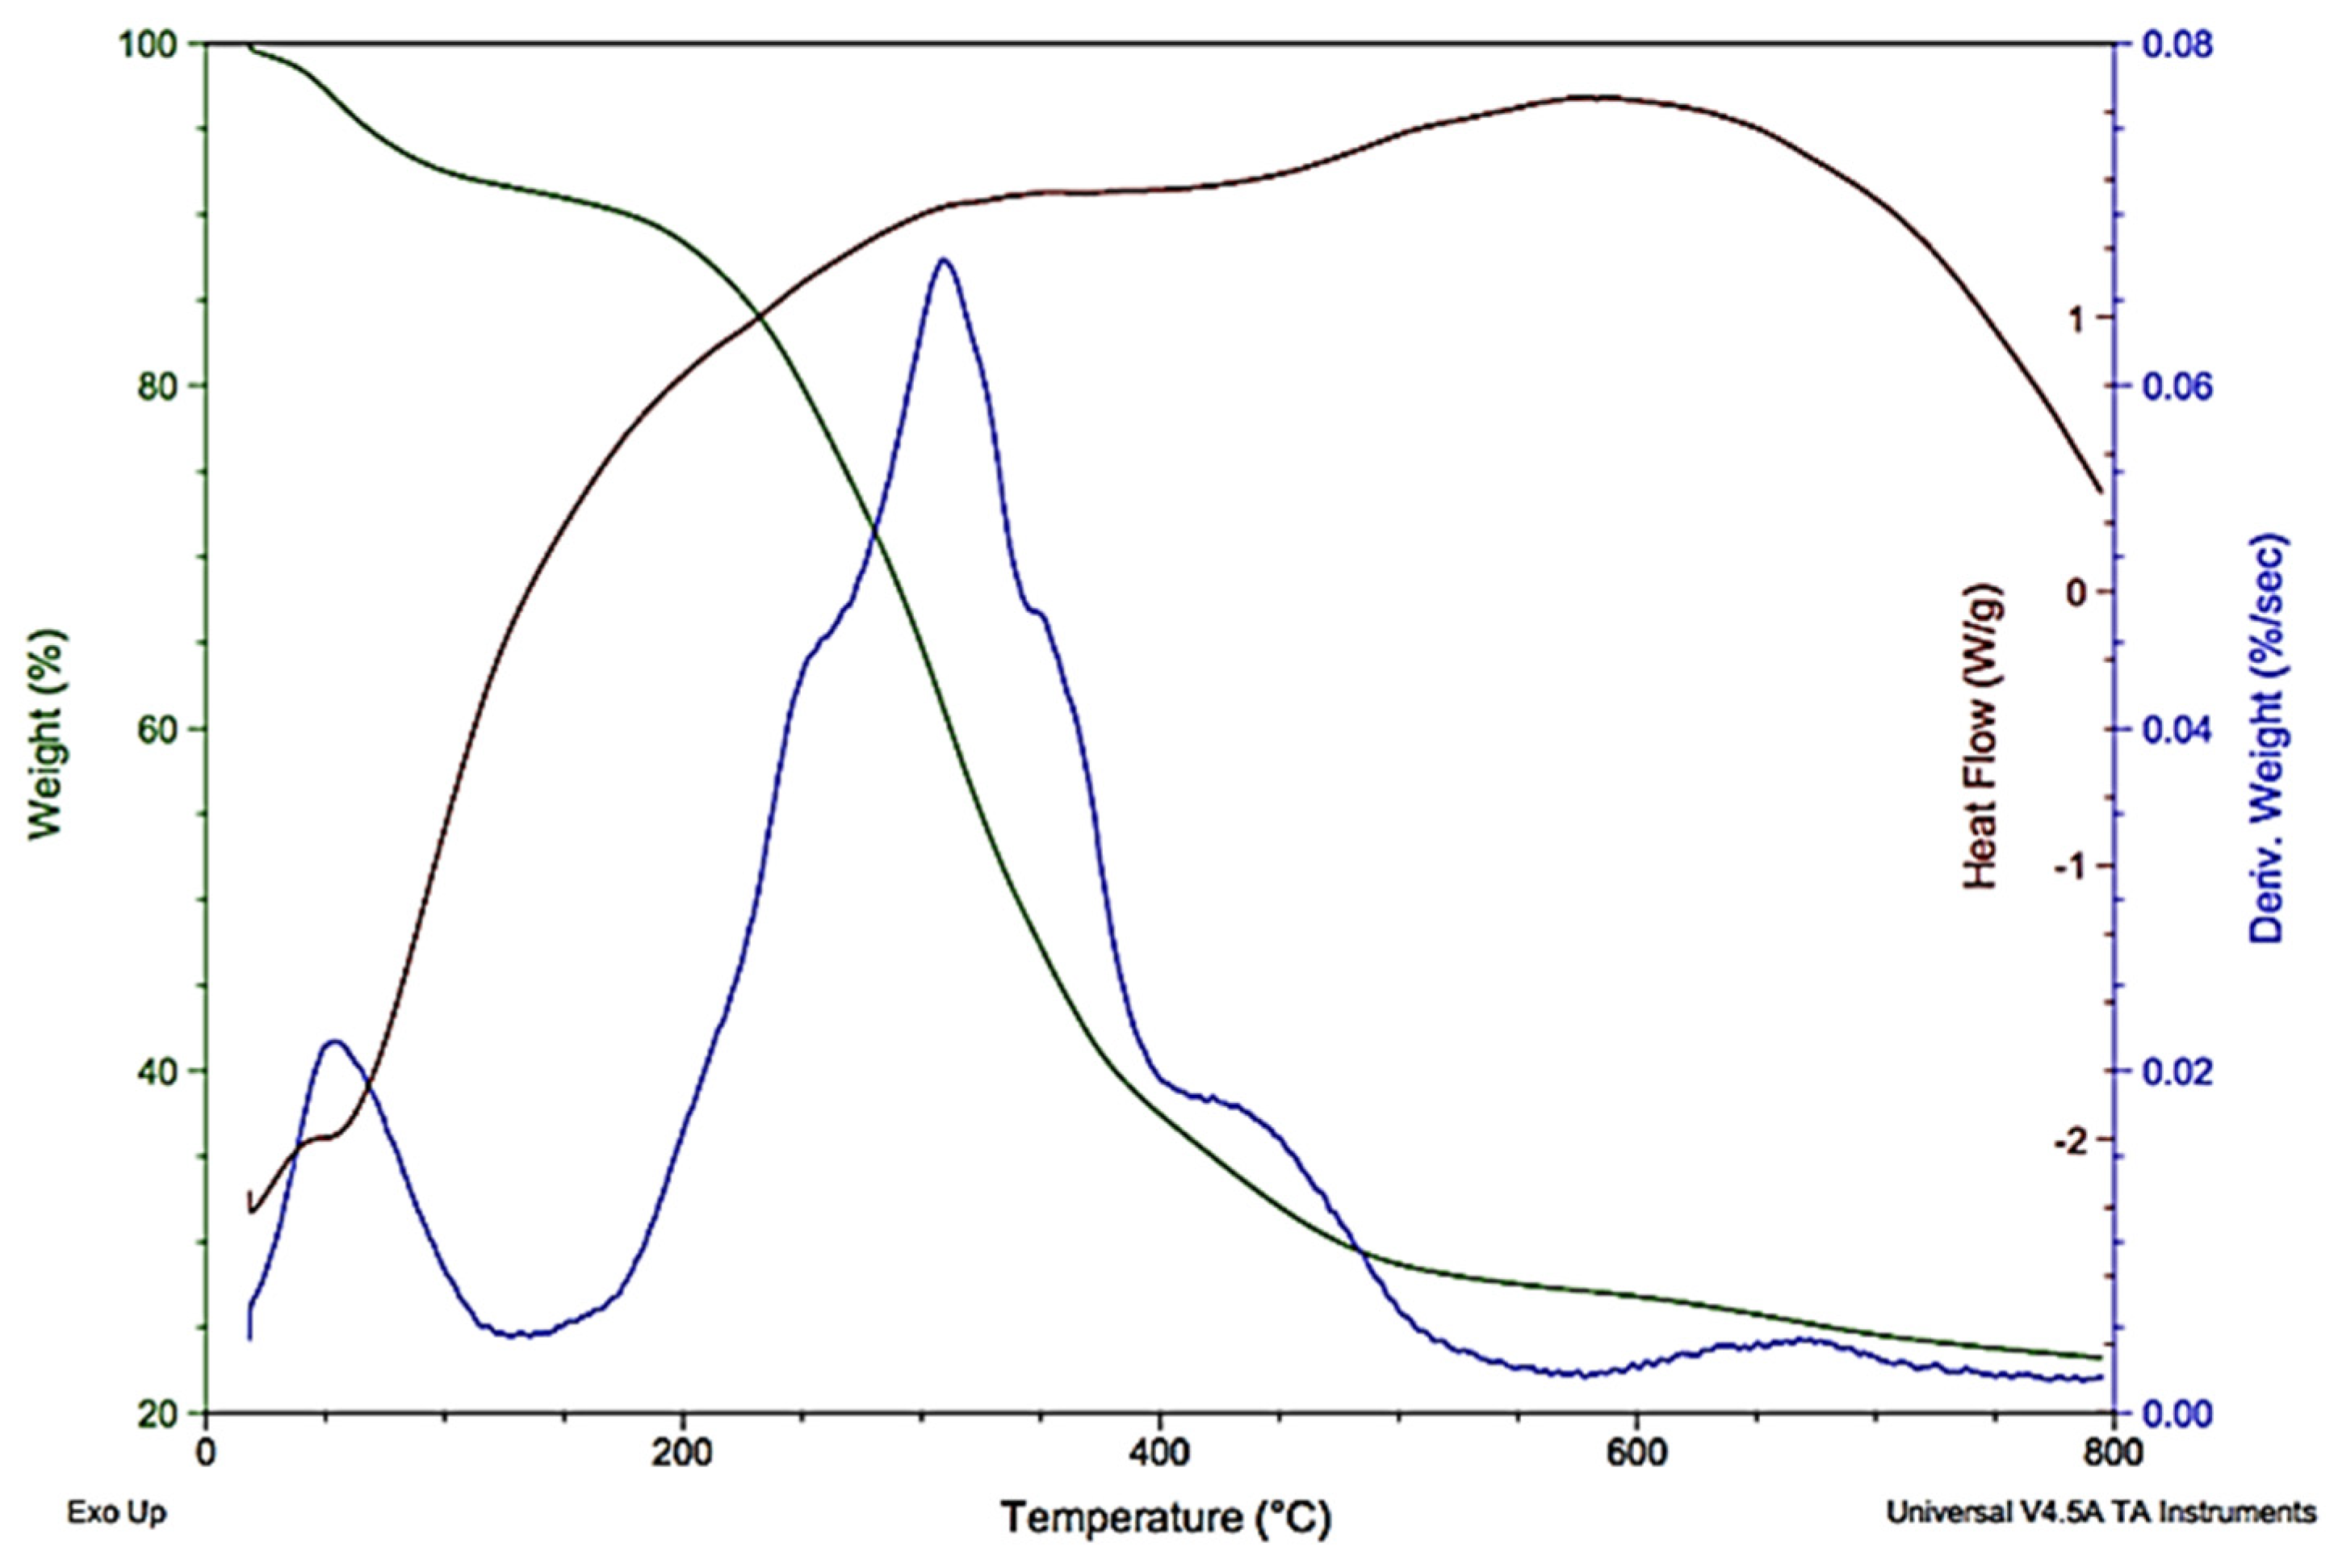
2.5. TGA/DTA Analysis
3. Experimental Procedure
4. Results and Discussion
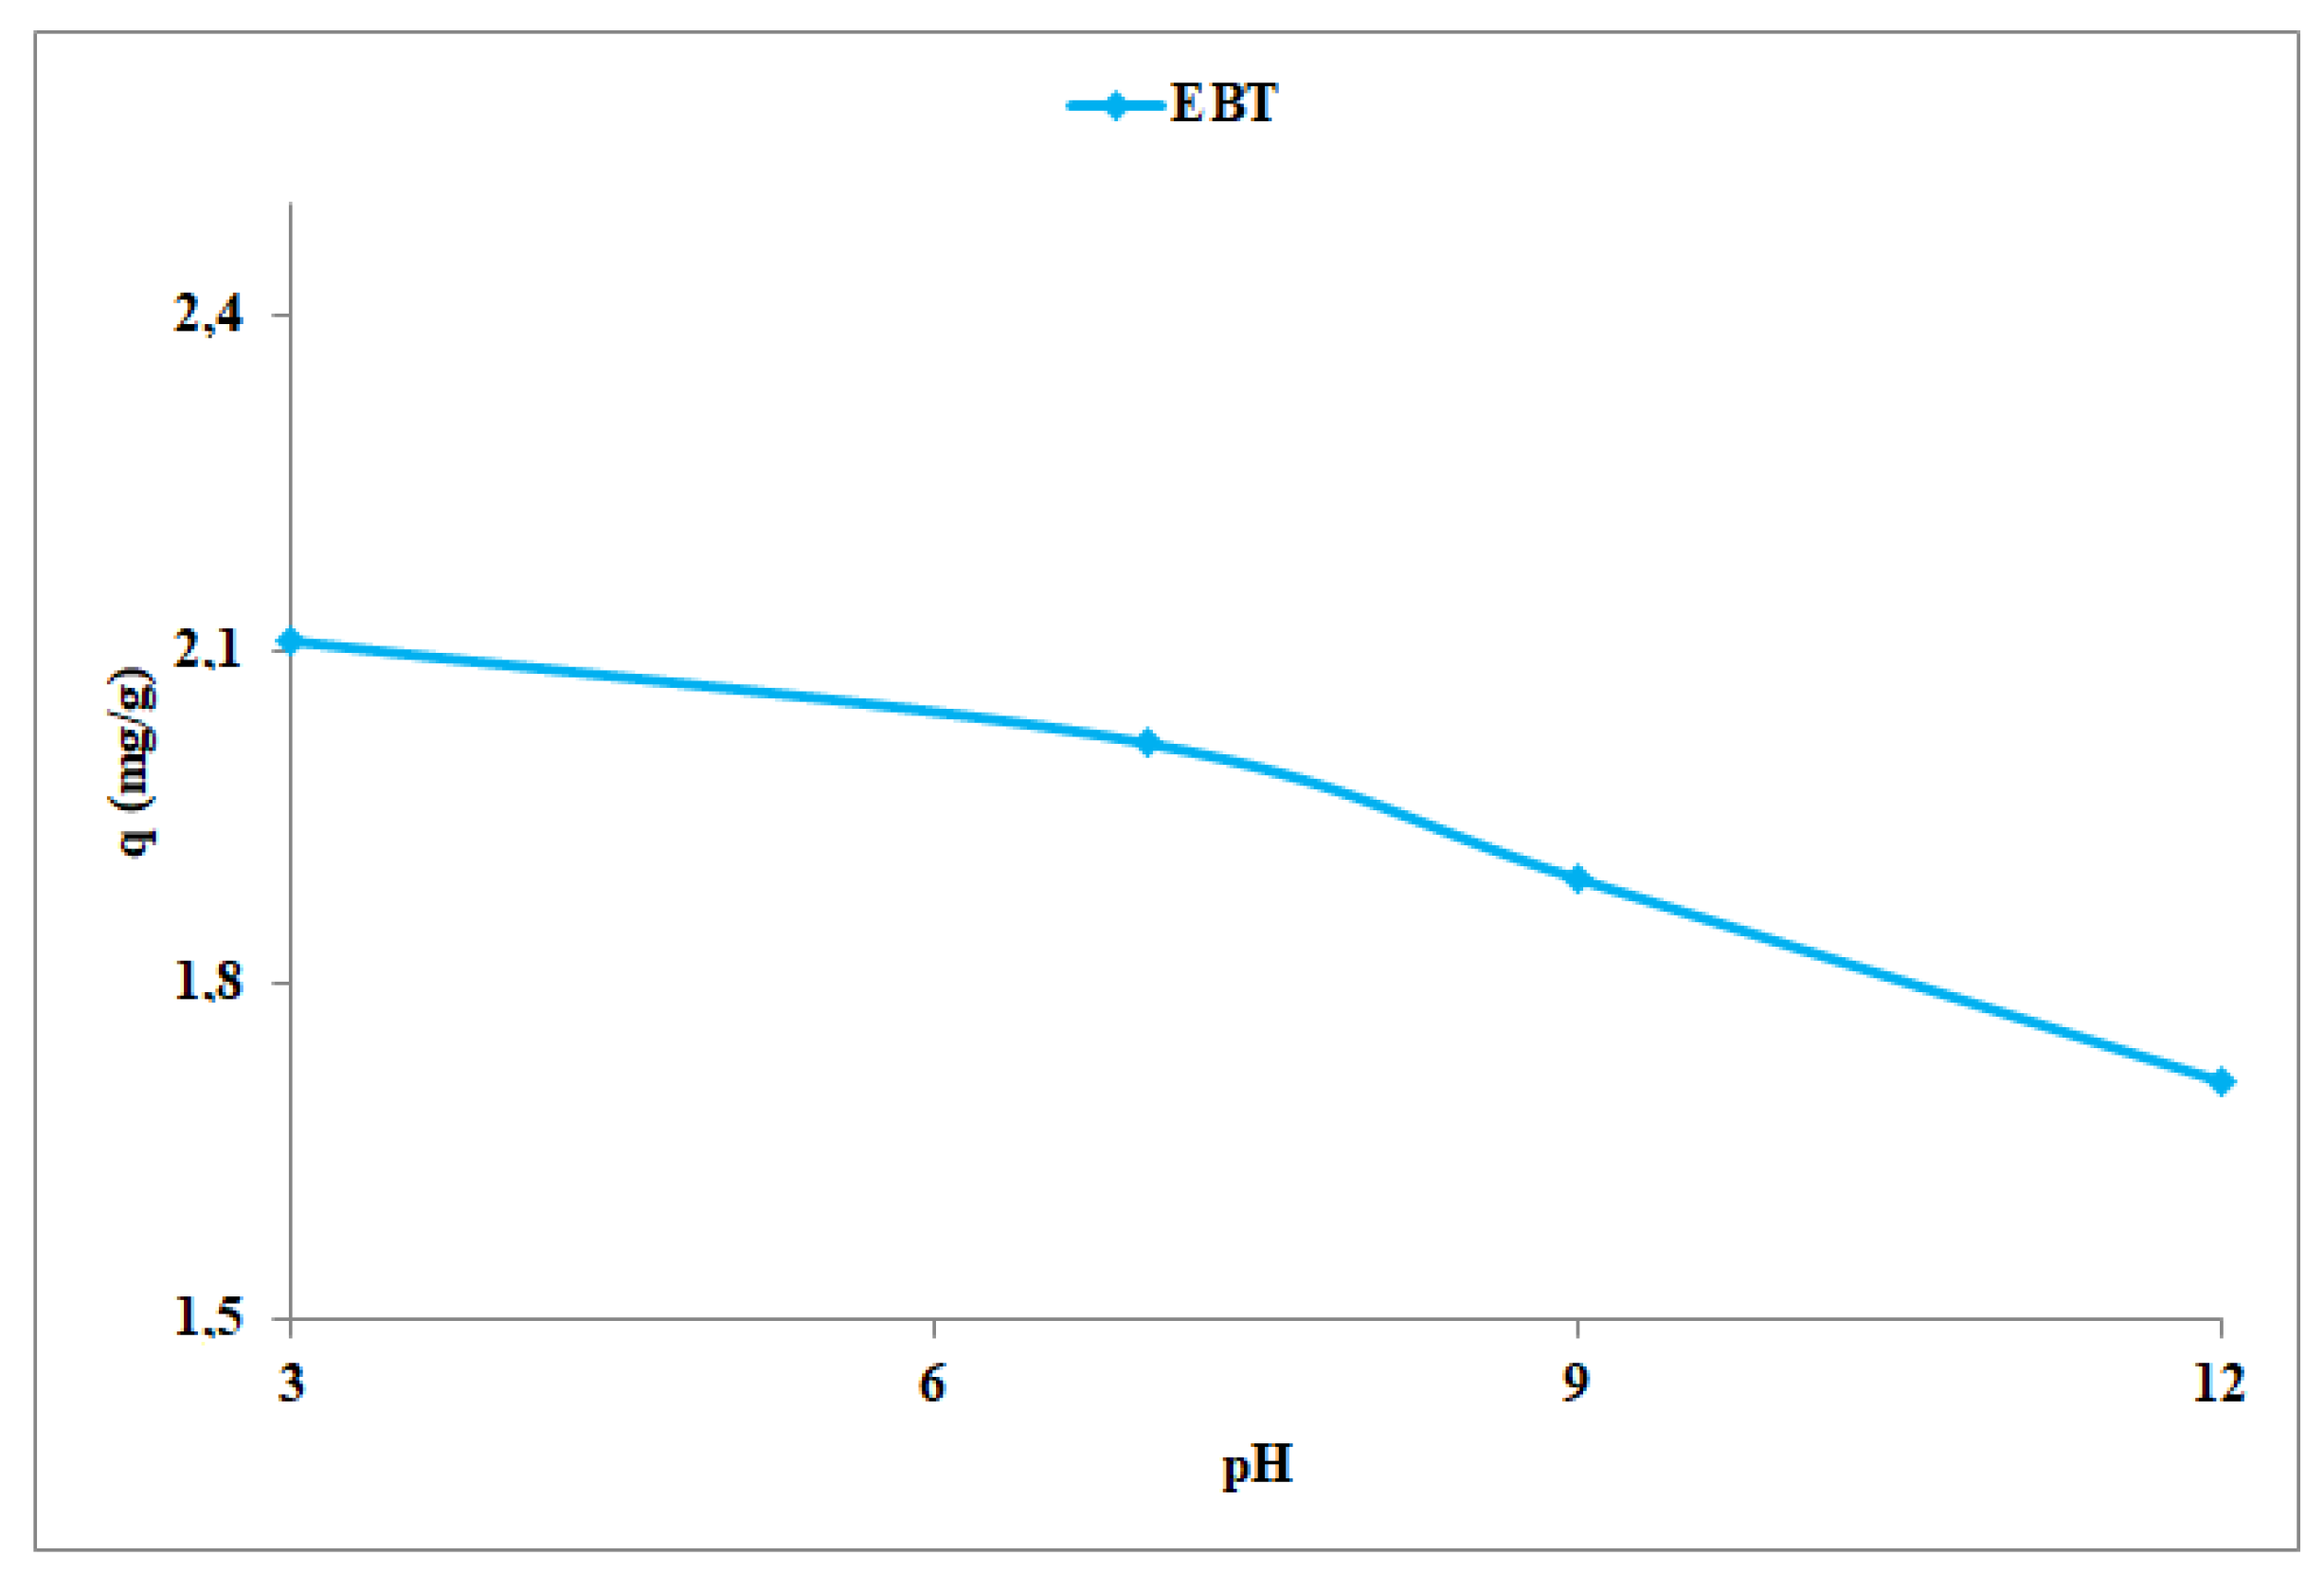
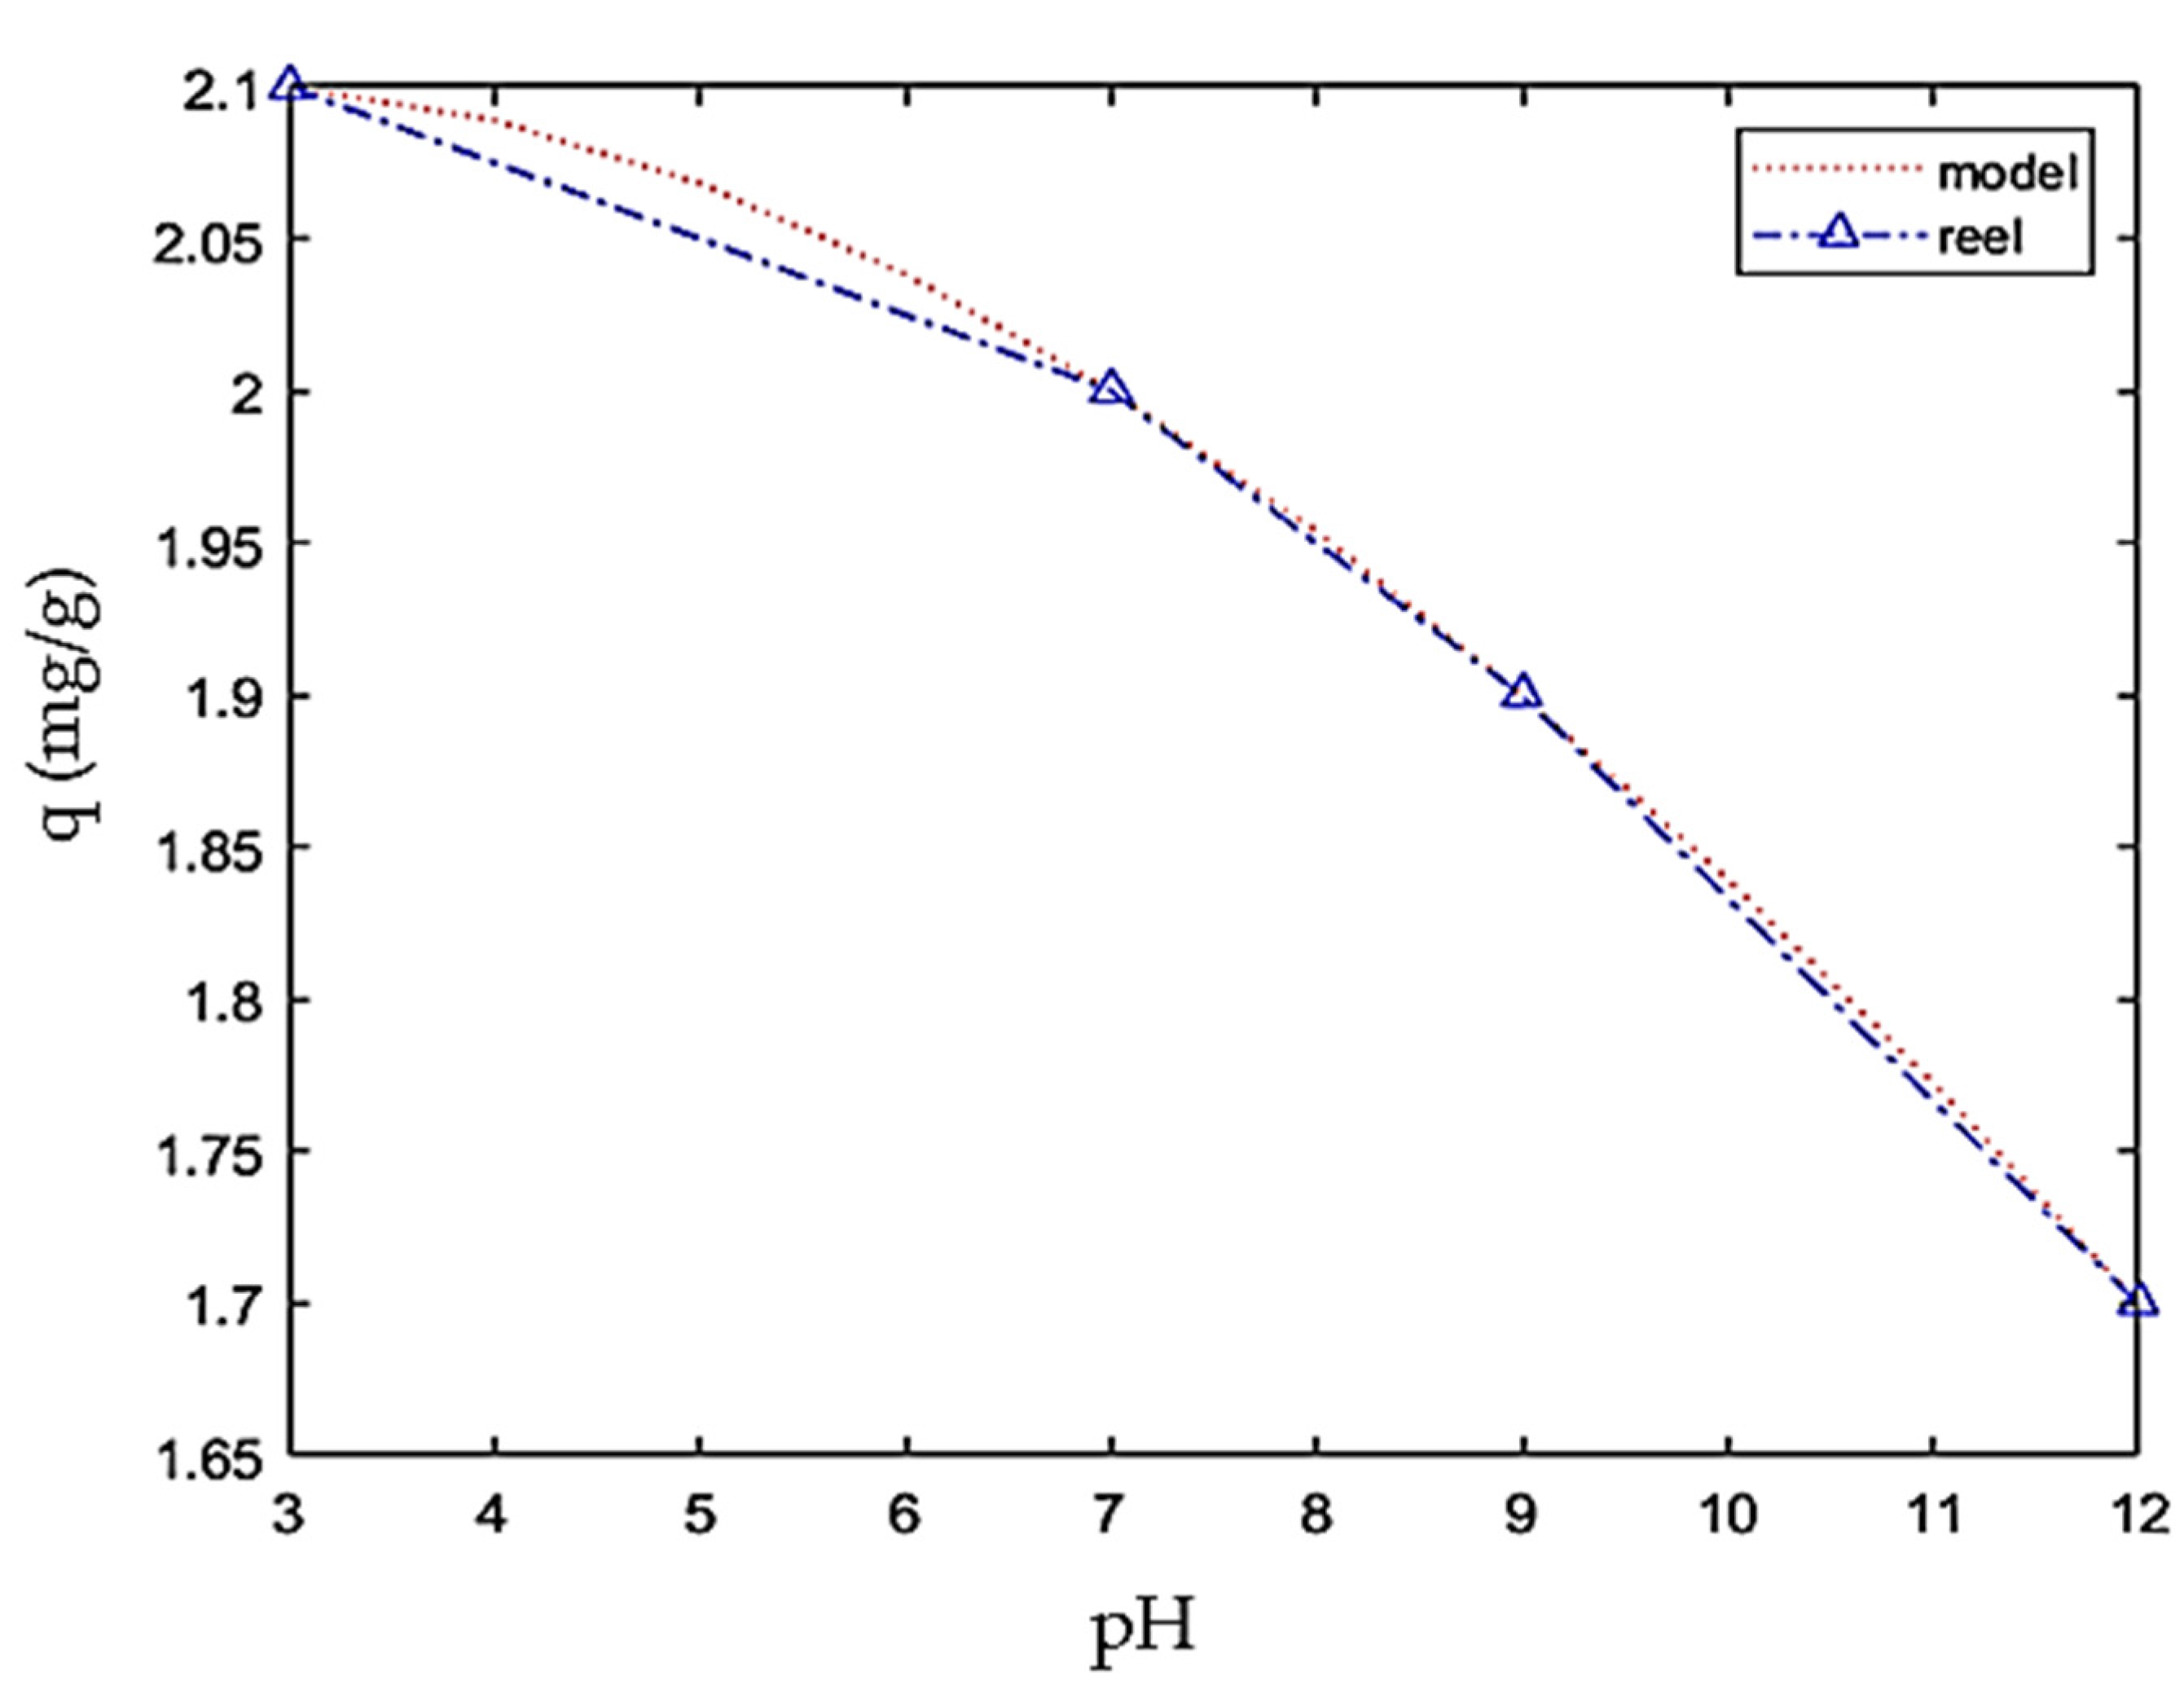
4.1. pH Effect
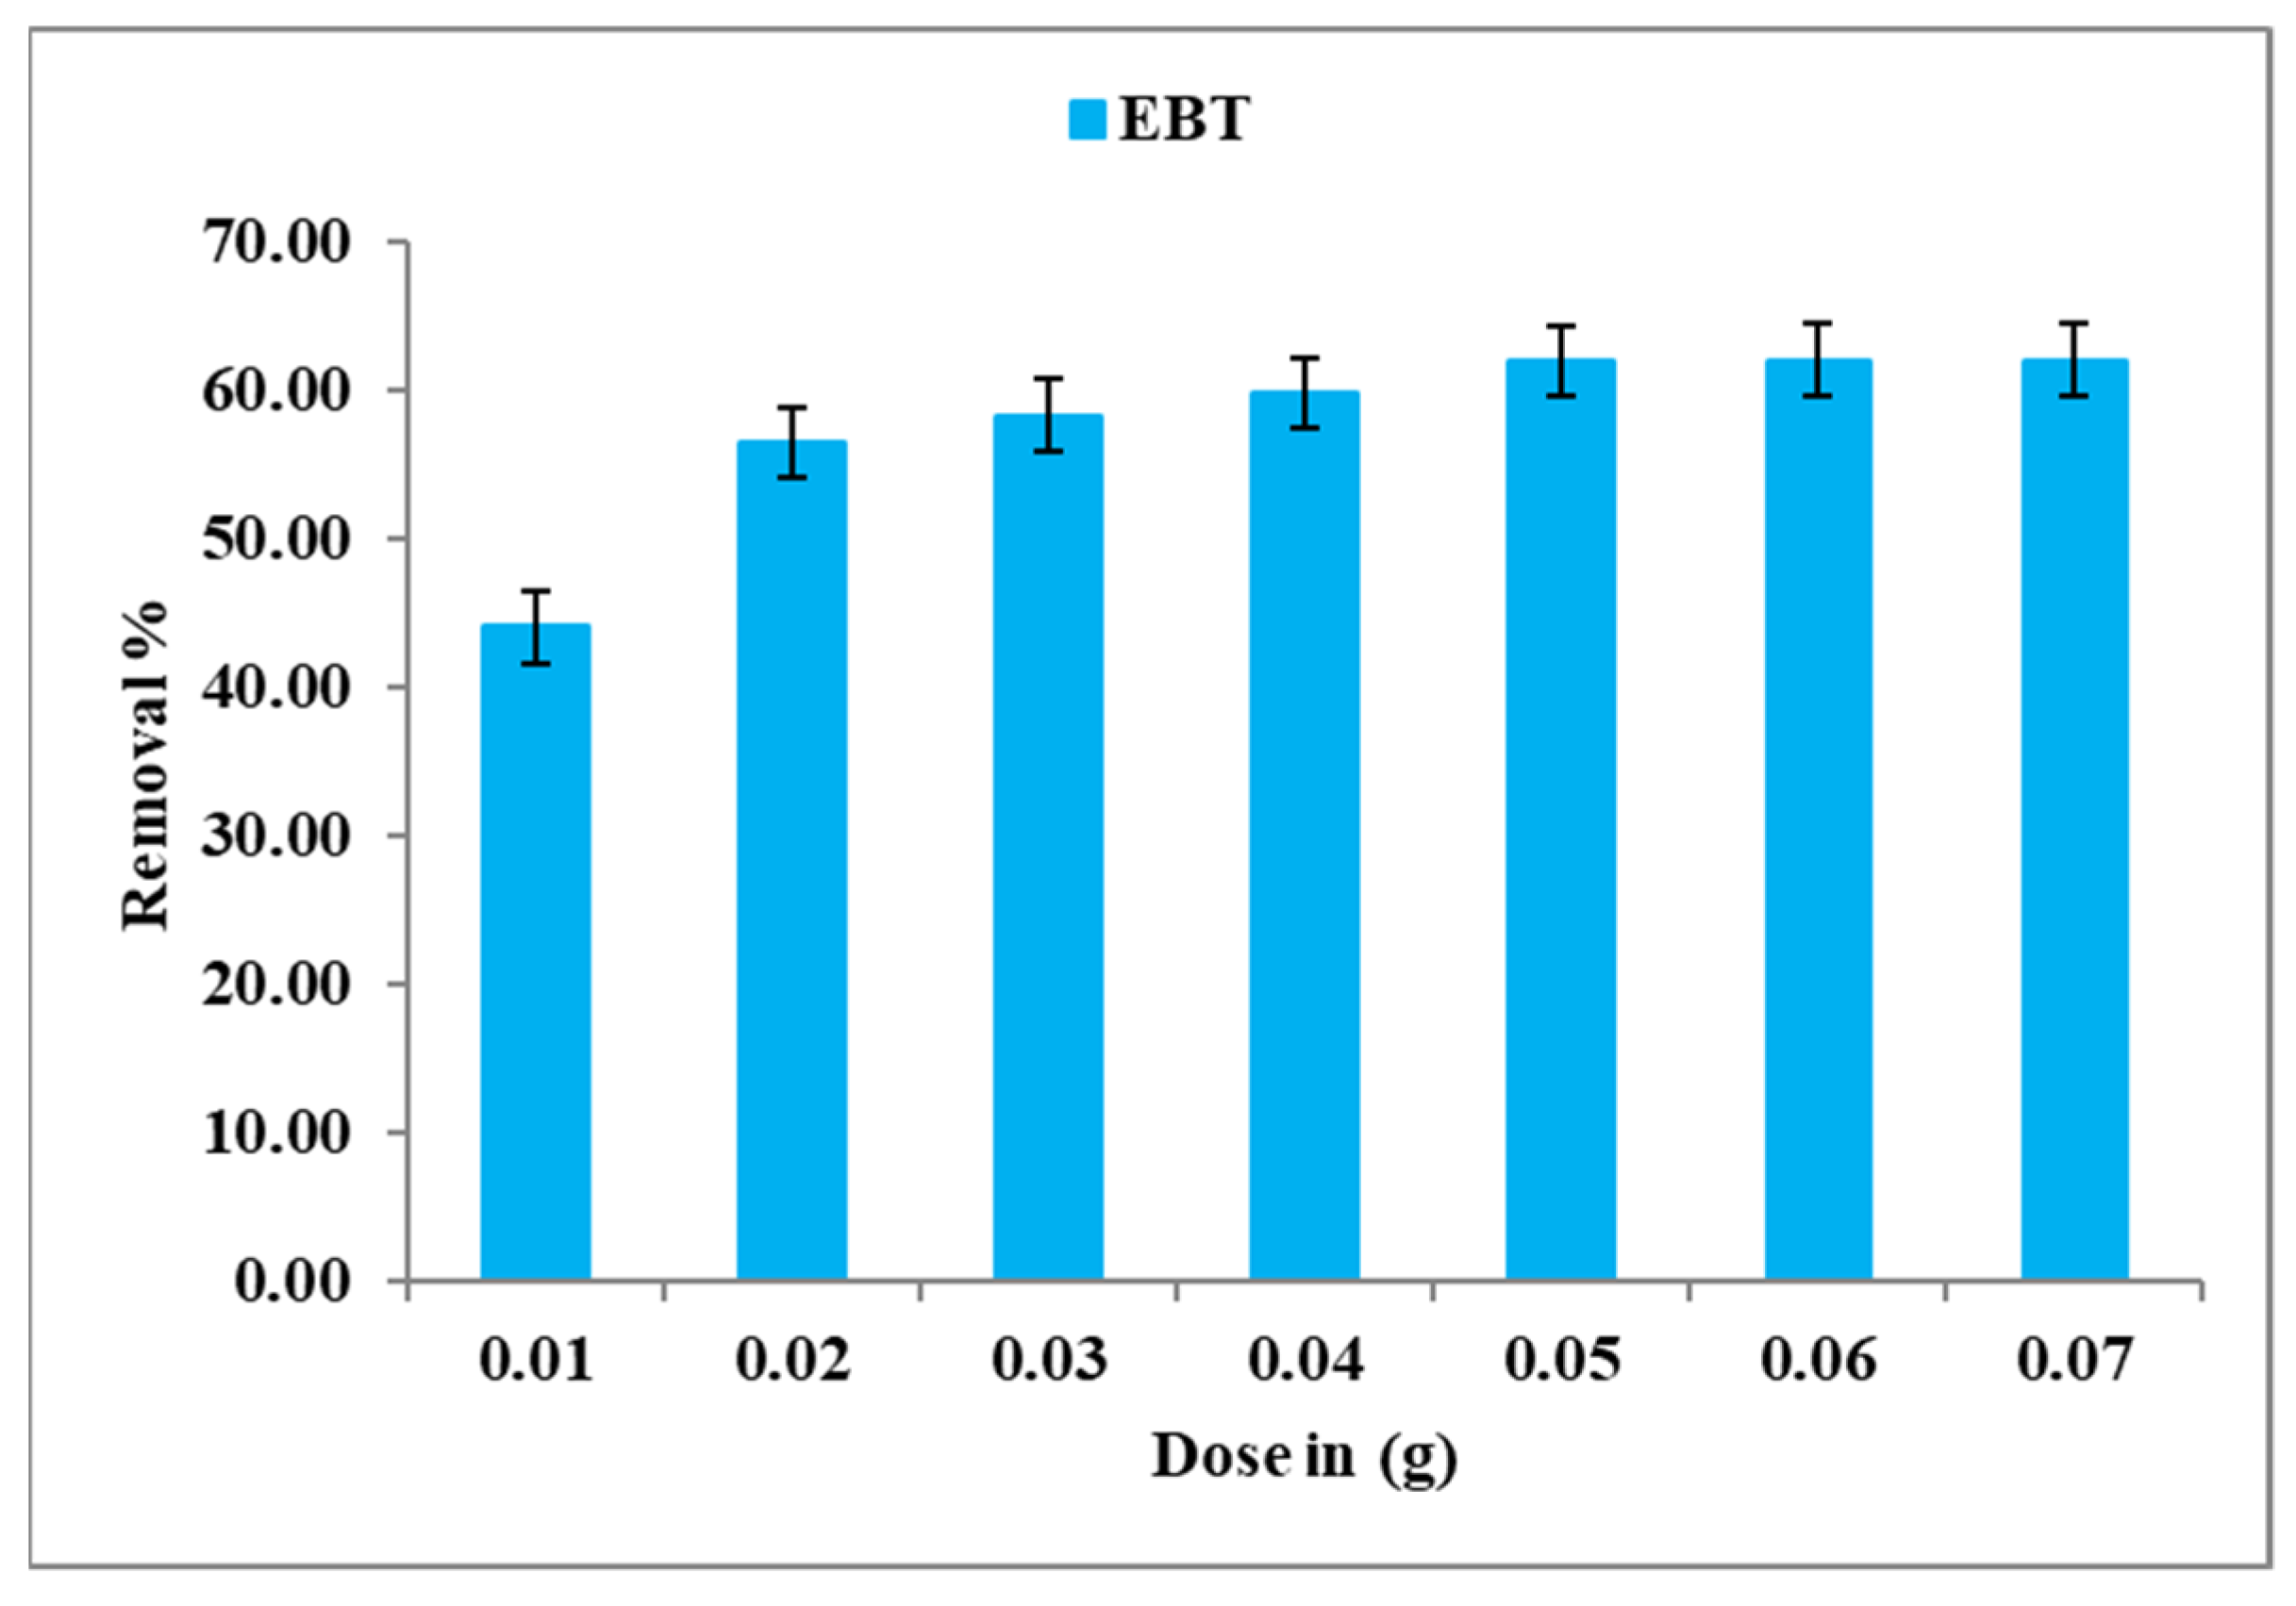
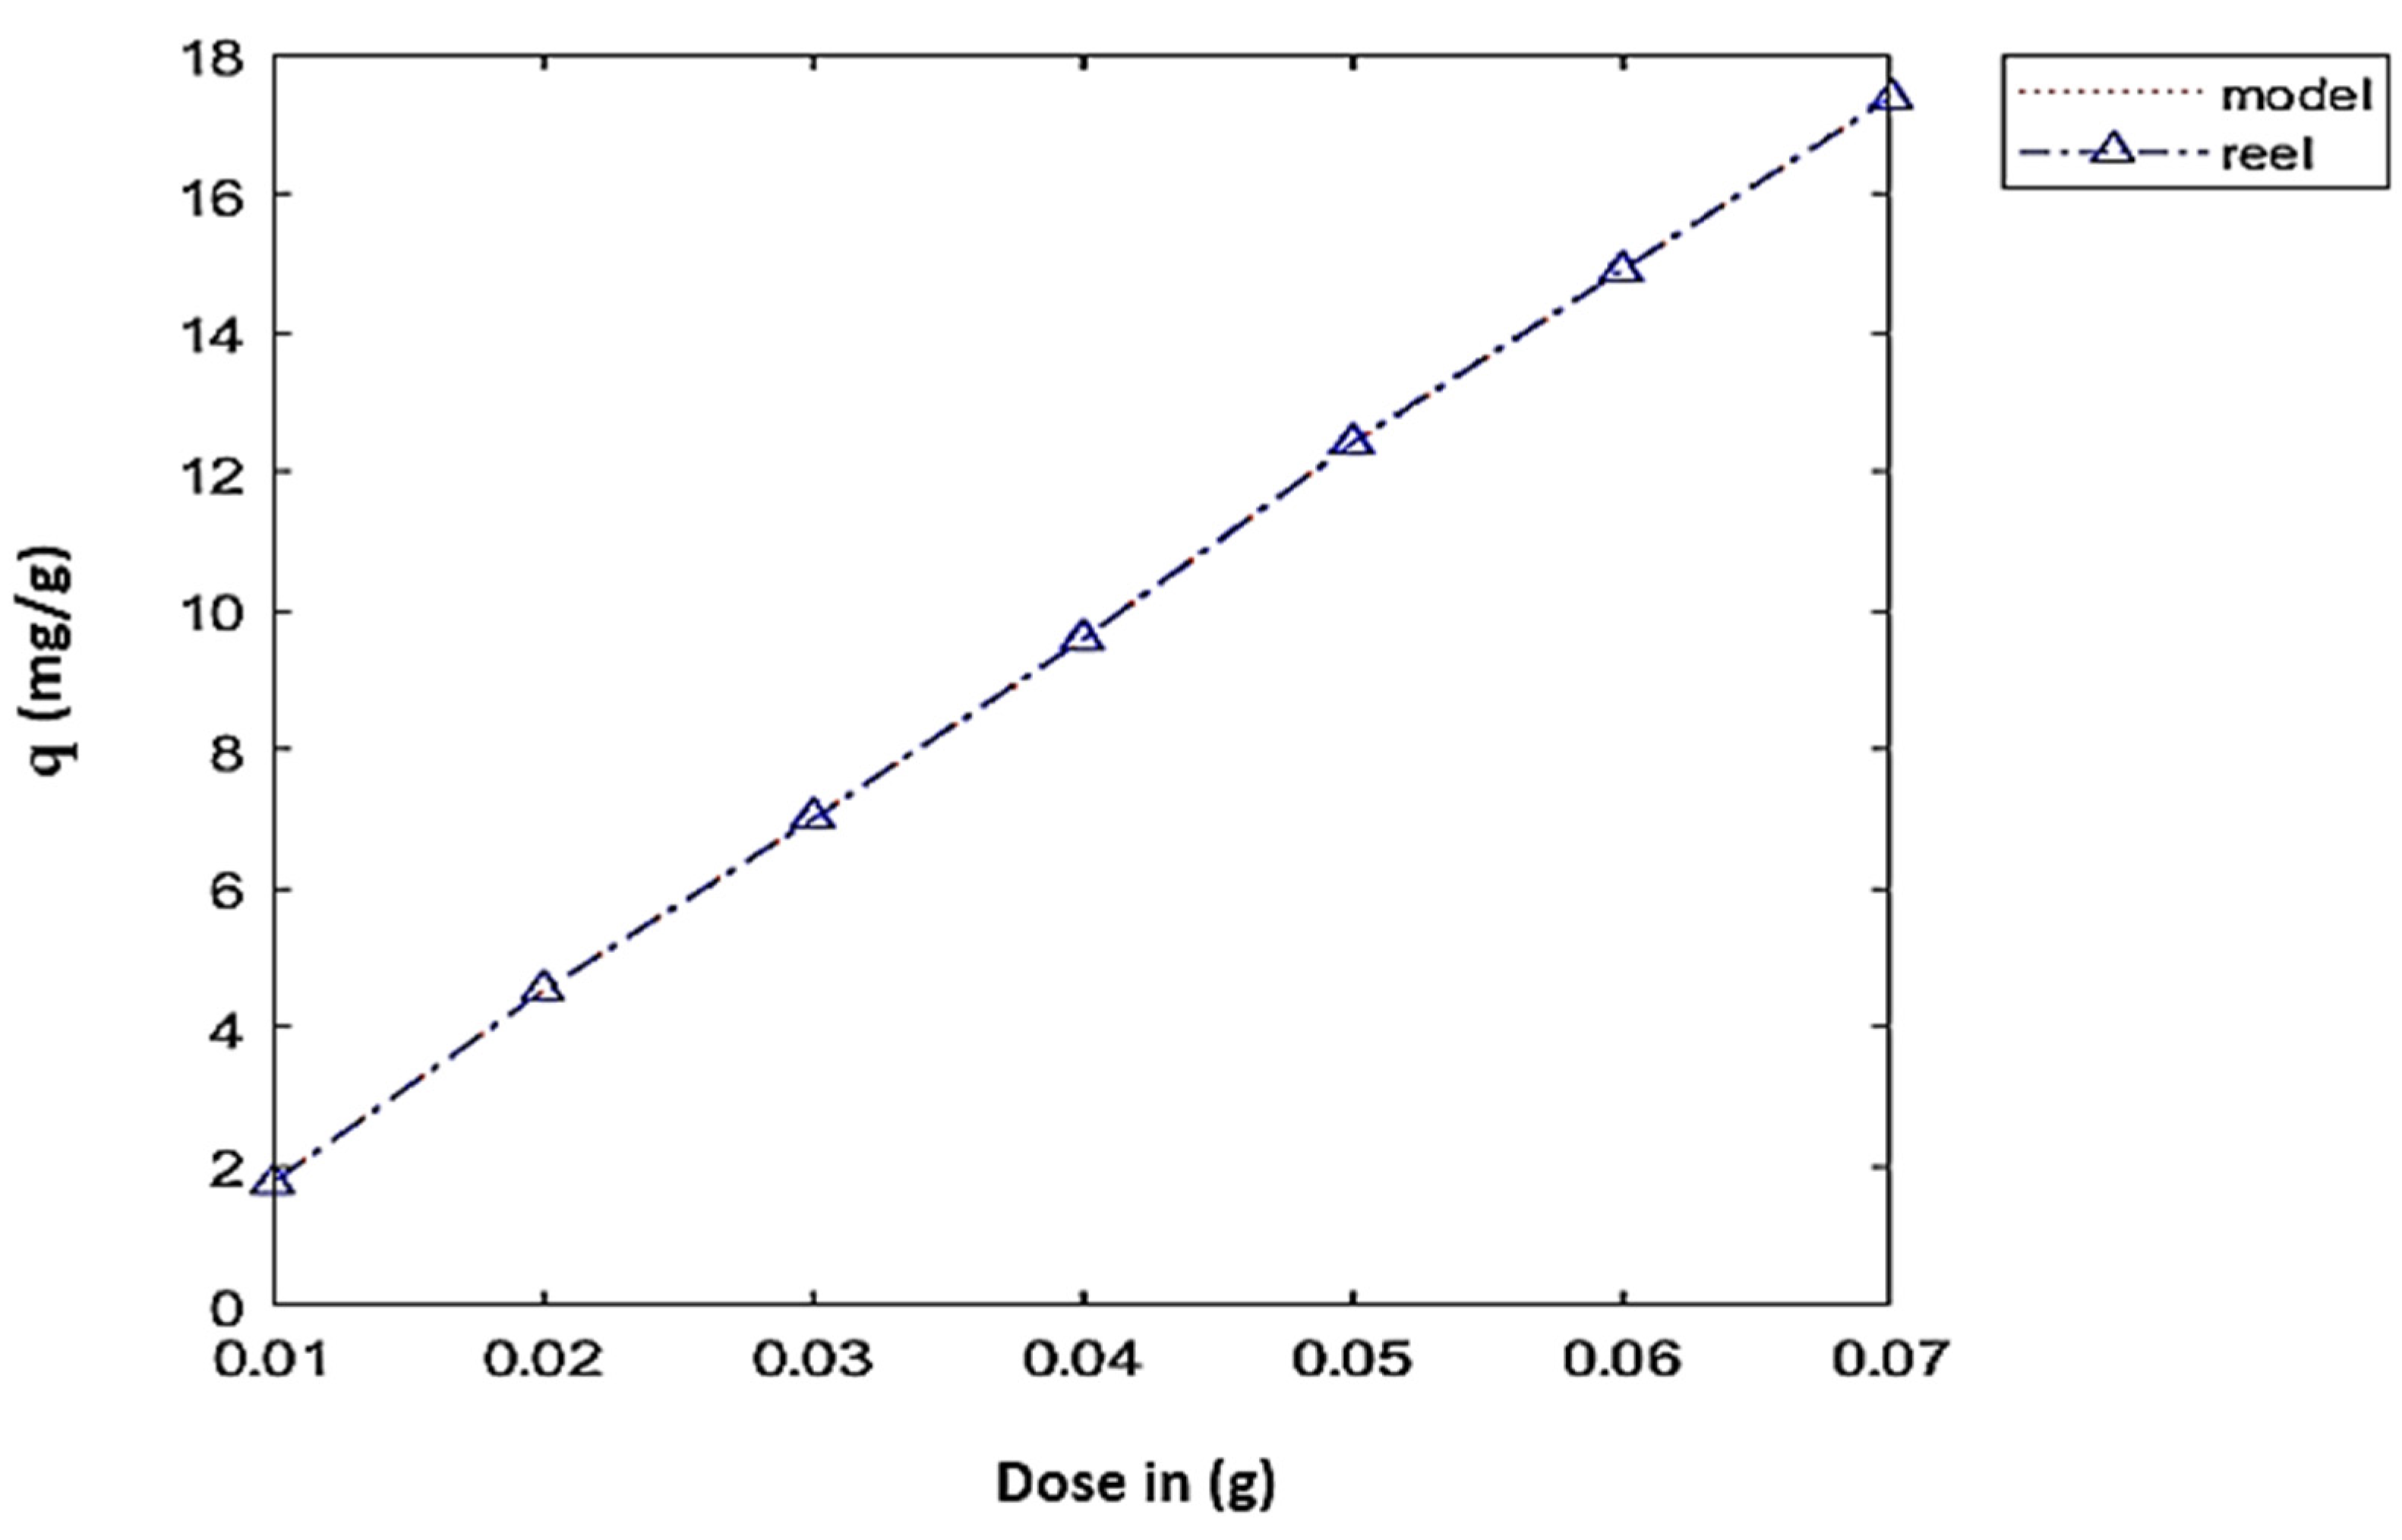
4.2. Dose Effect
—2.31604 × 10⁶ × d3 + 47473.1 × d2 − 183.715 × d + 0.673
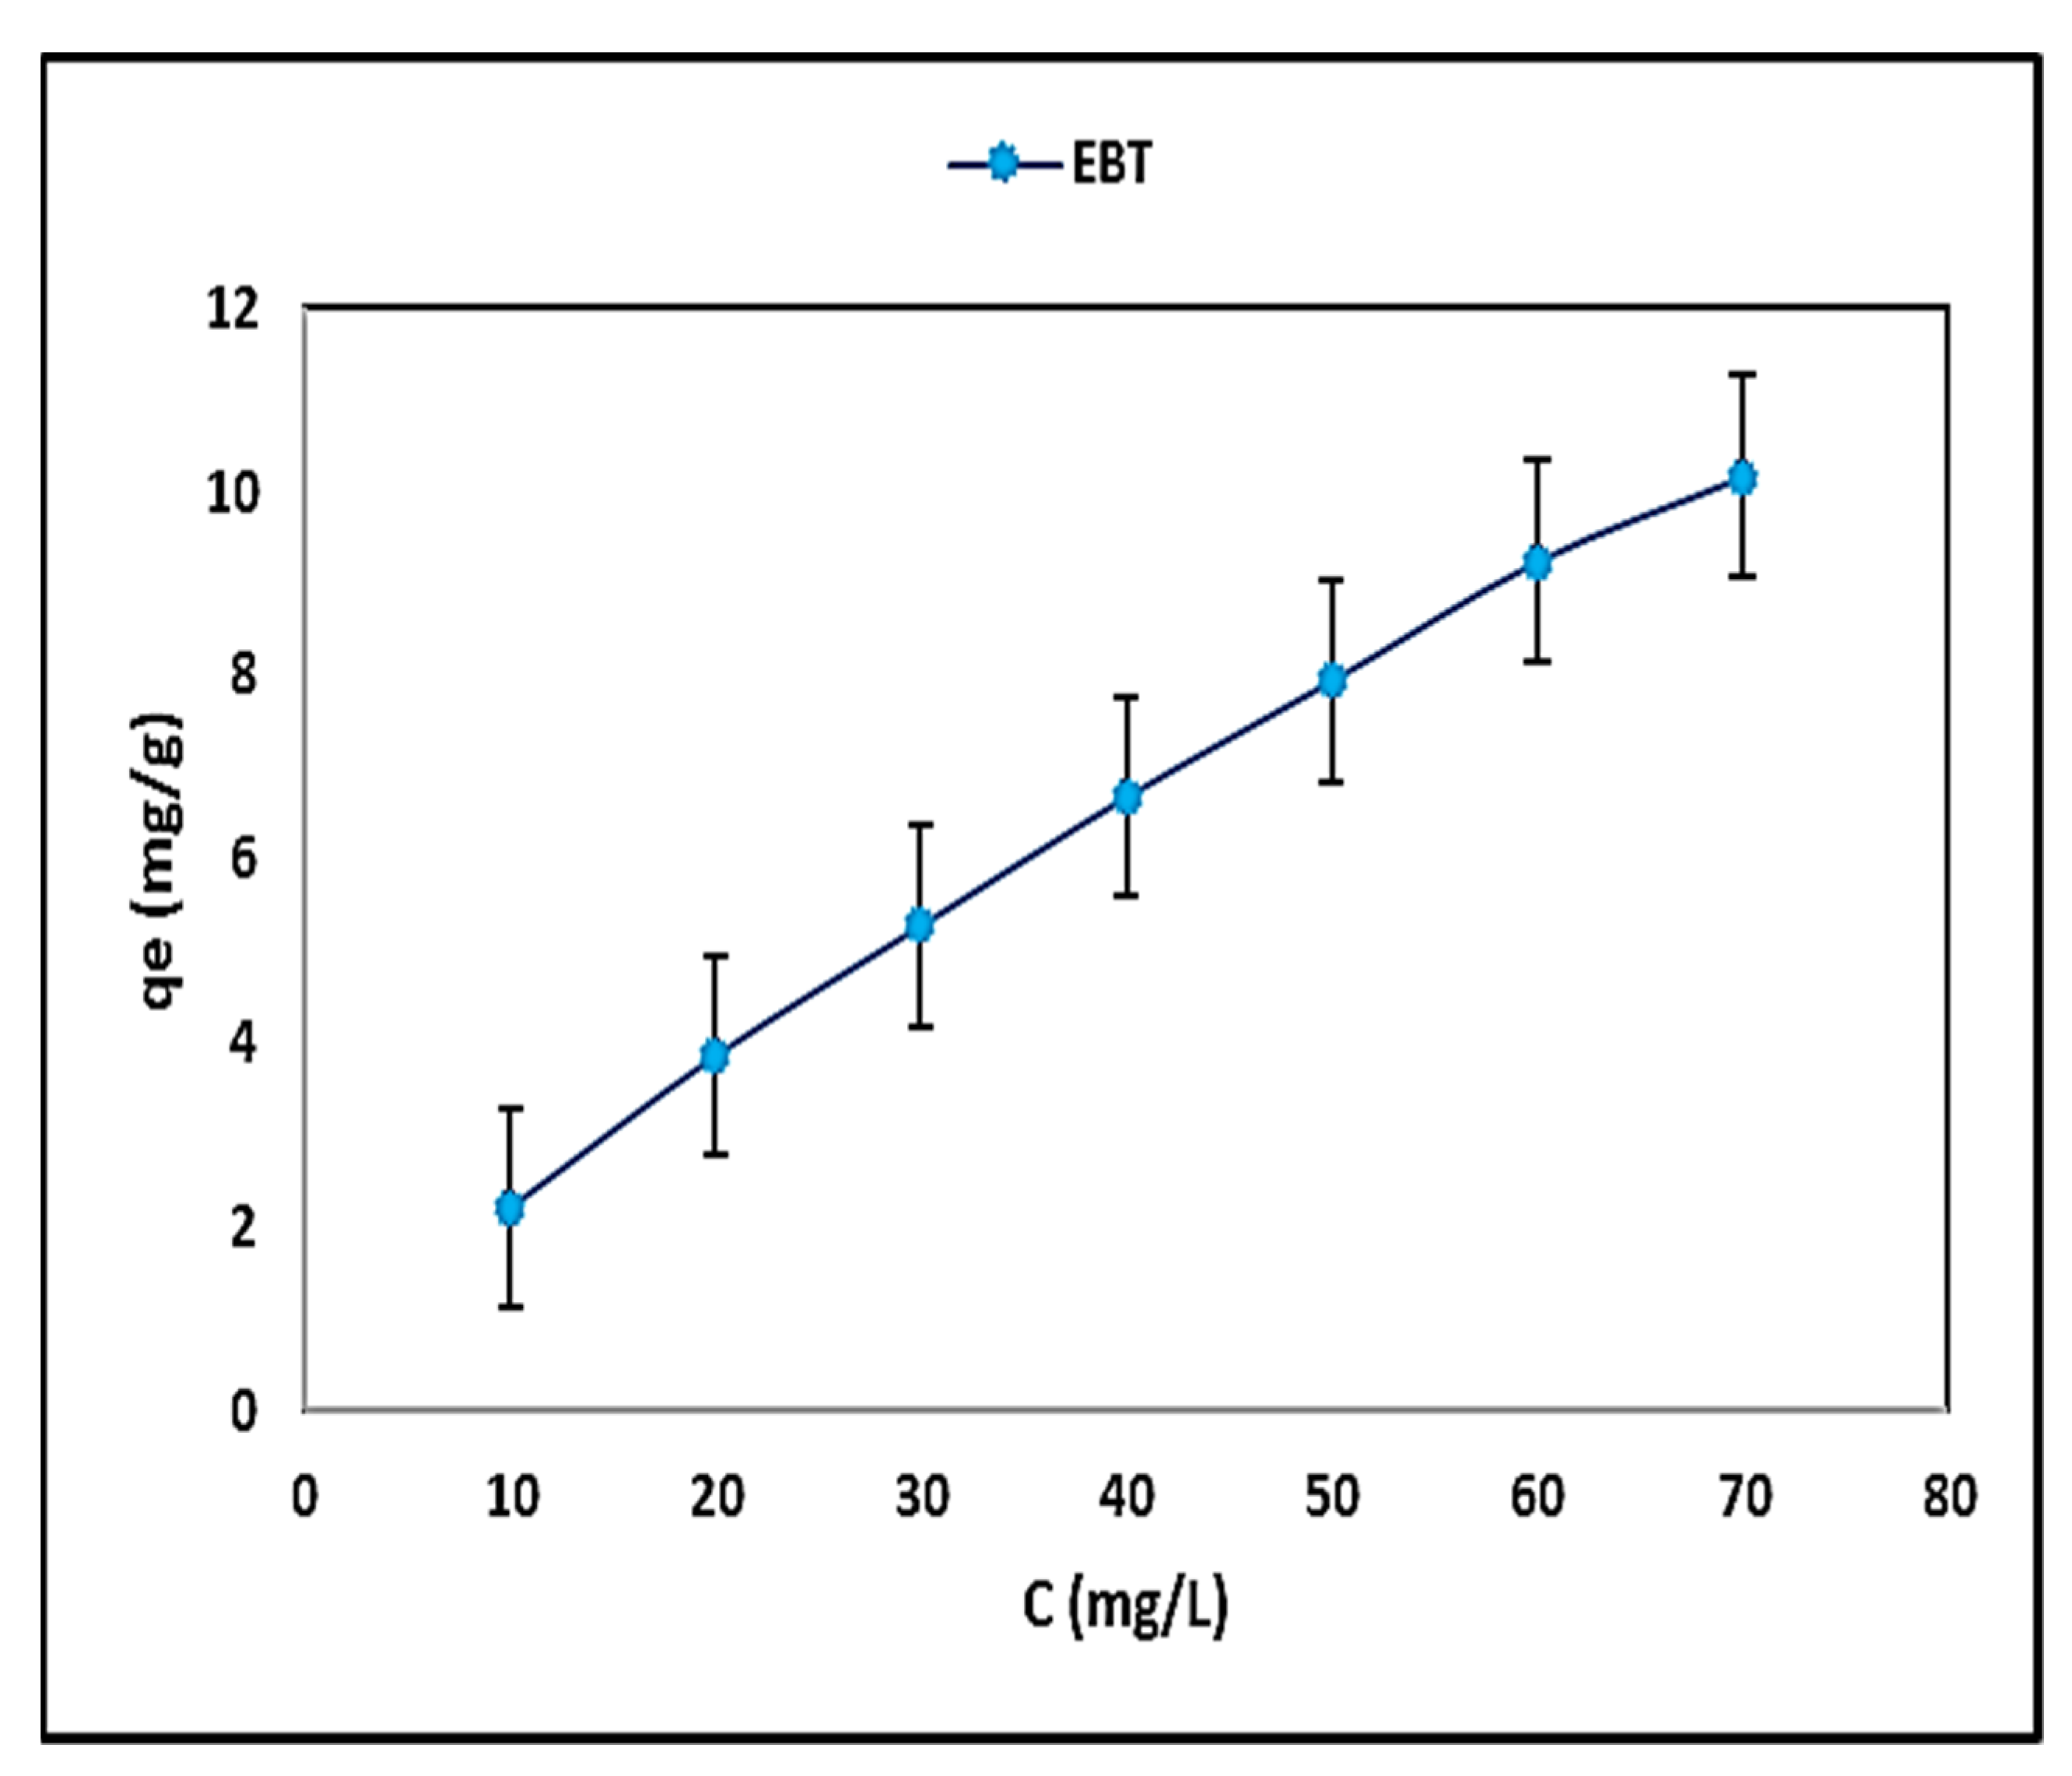
4.3. Effect of the Initial Concentration
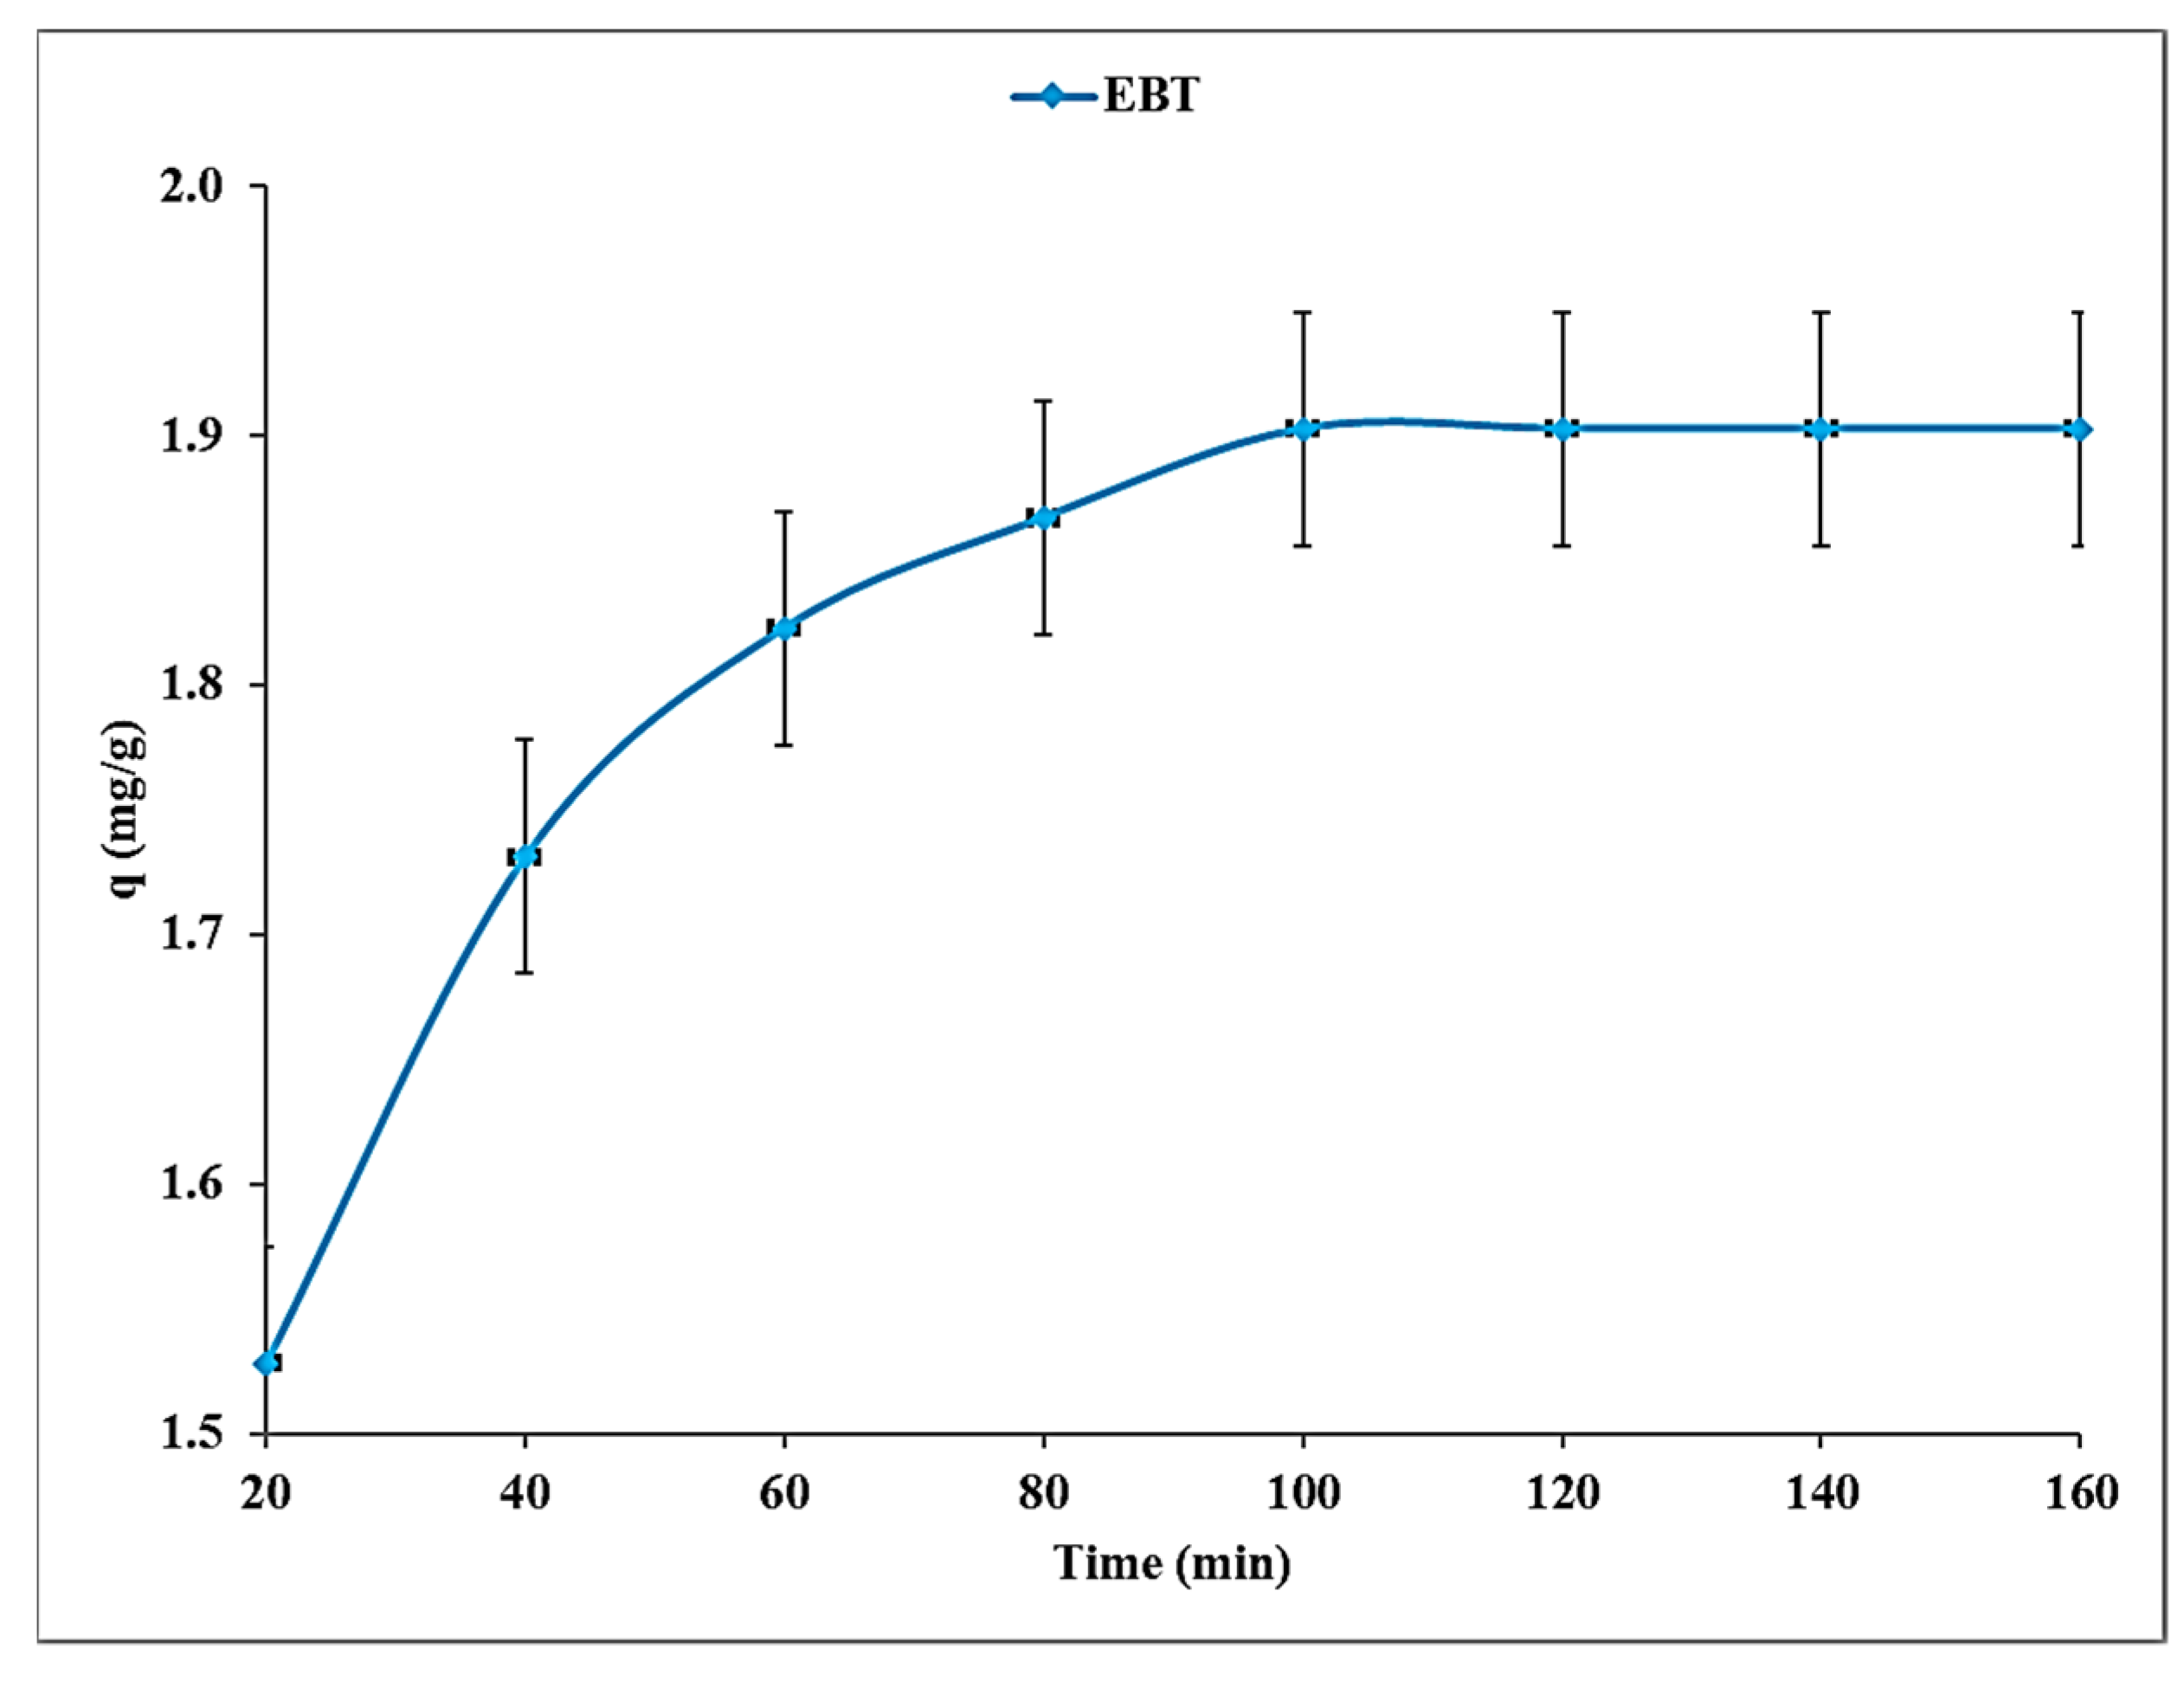
4.4. Effect of Contact Time
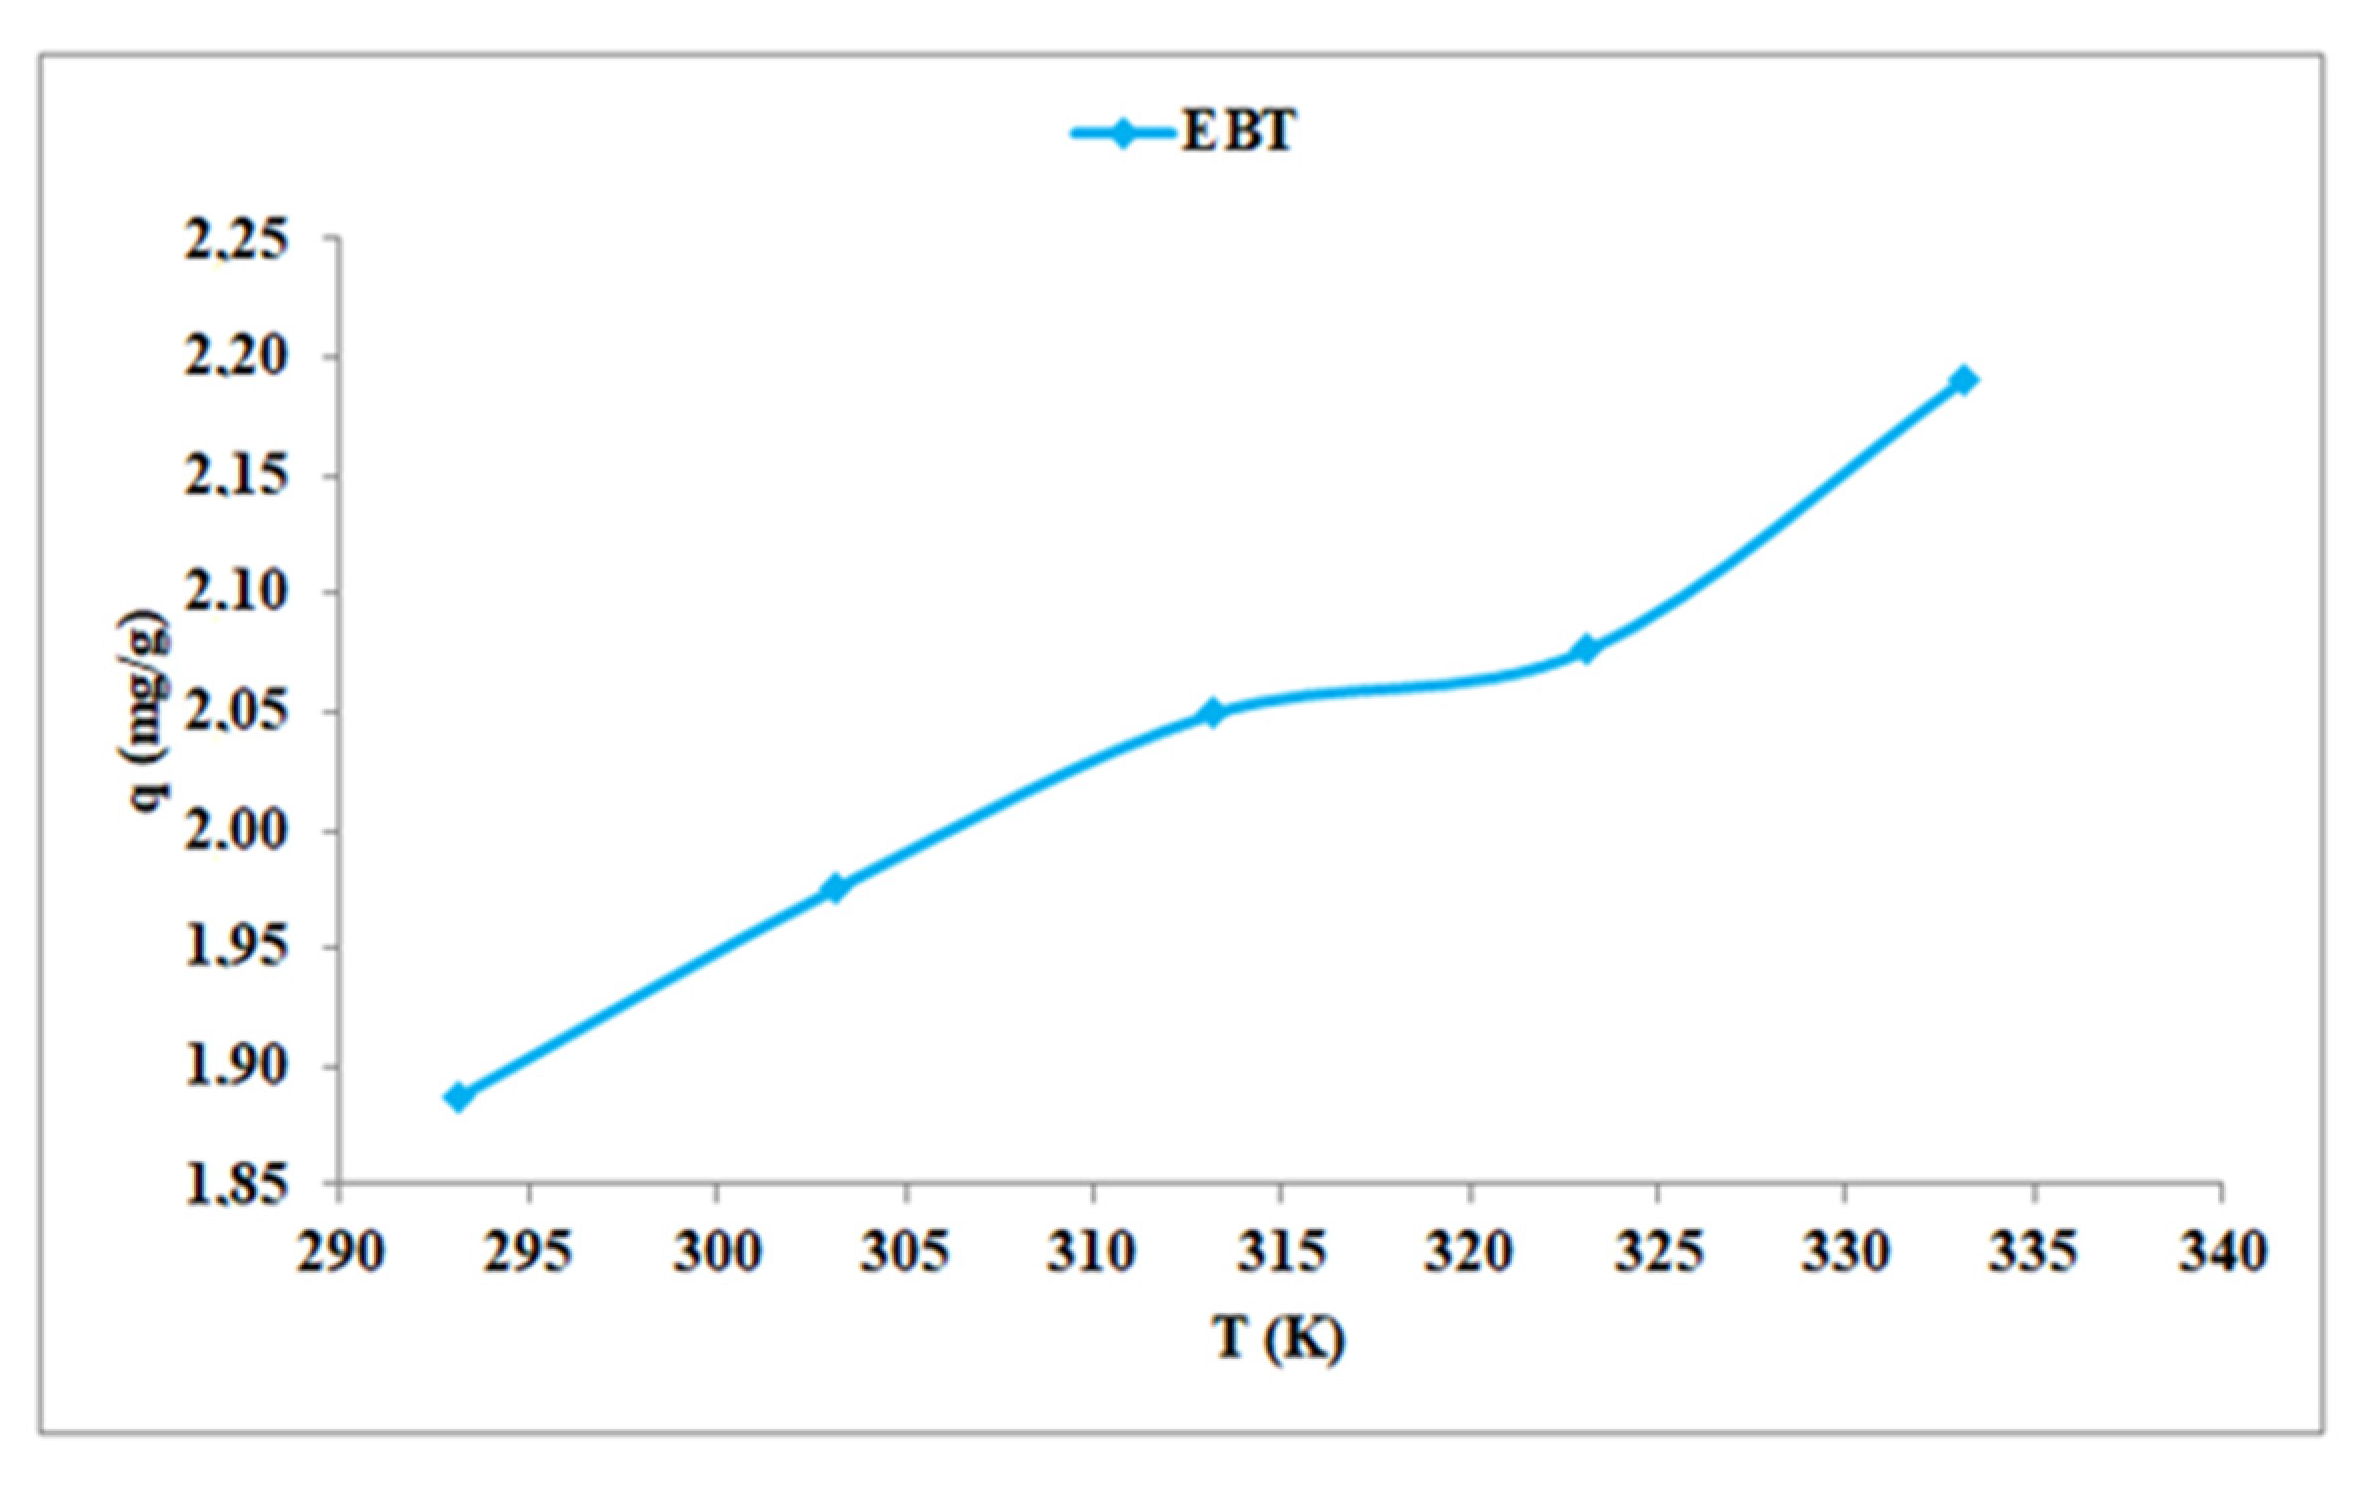
4.5. Effect of Temperature
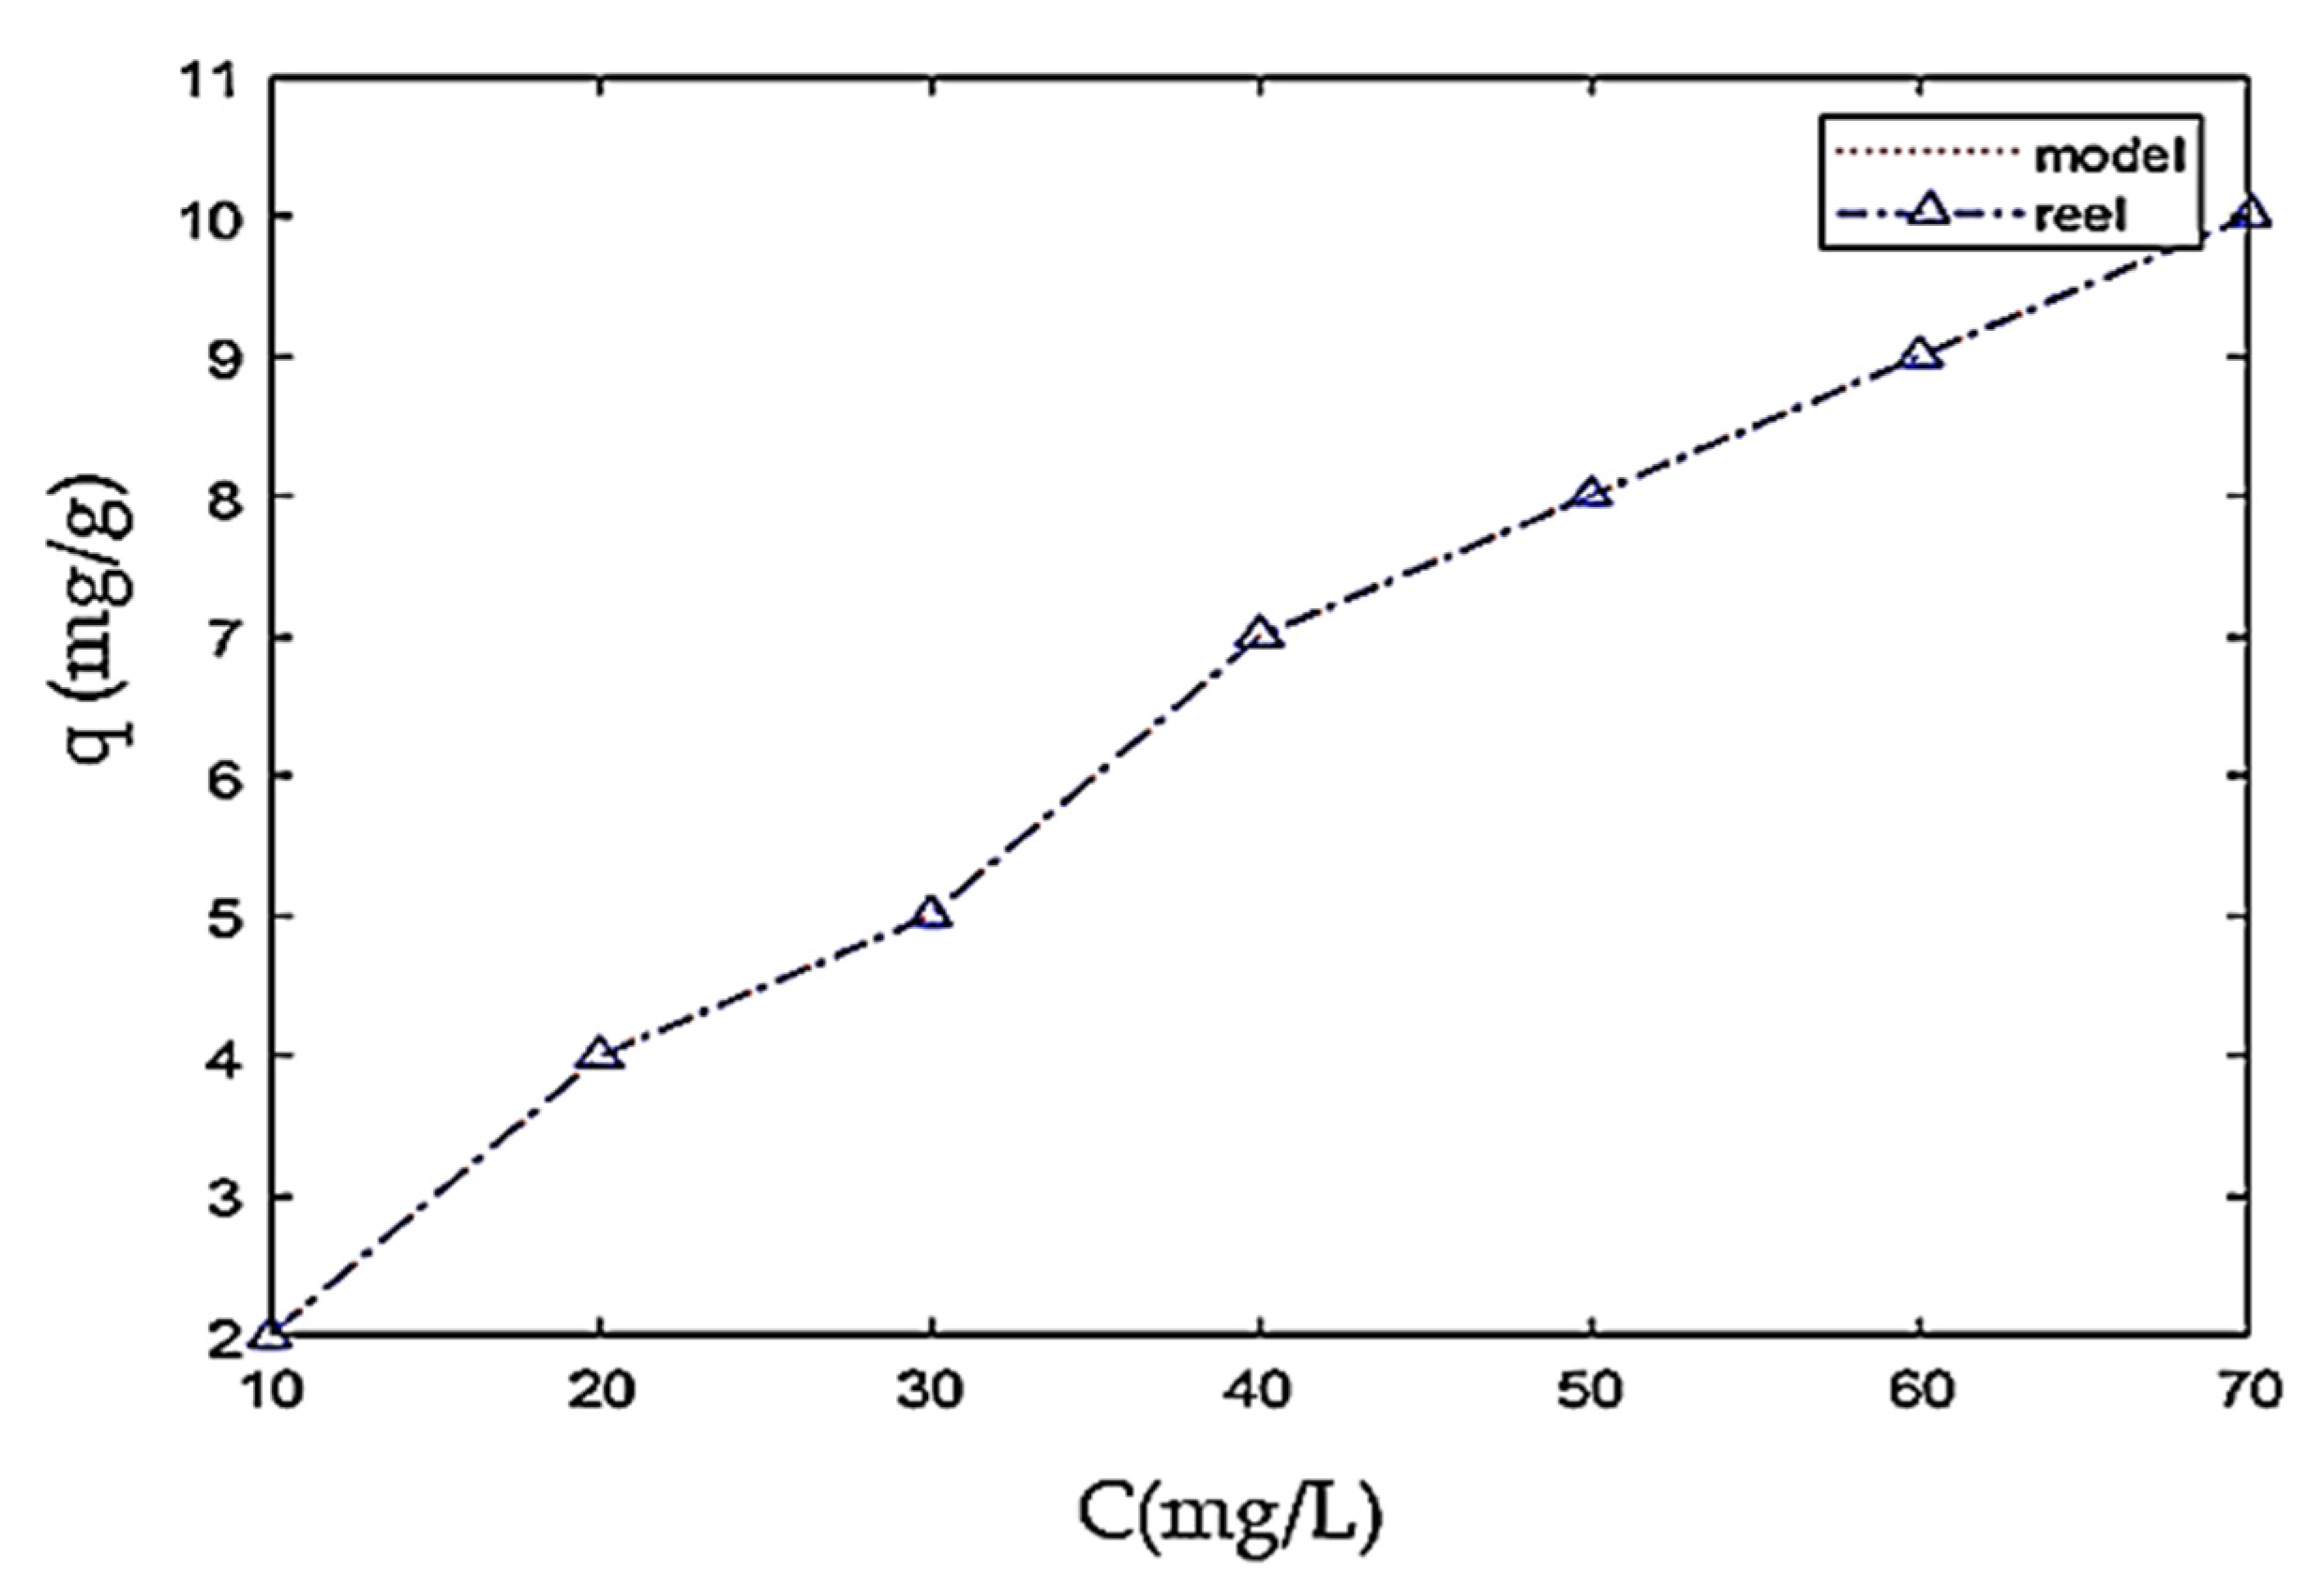
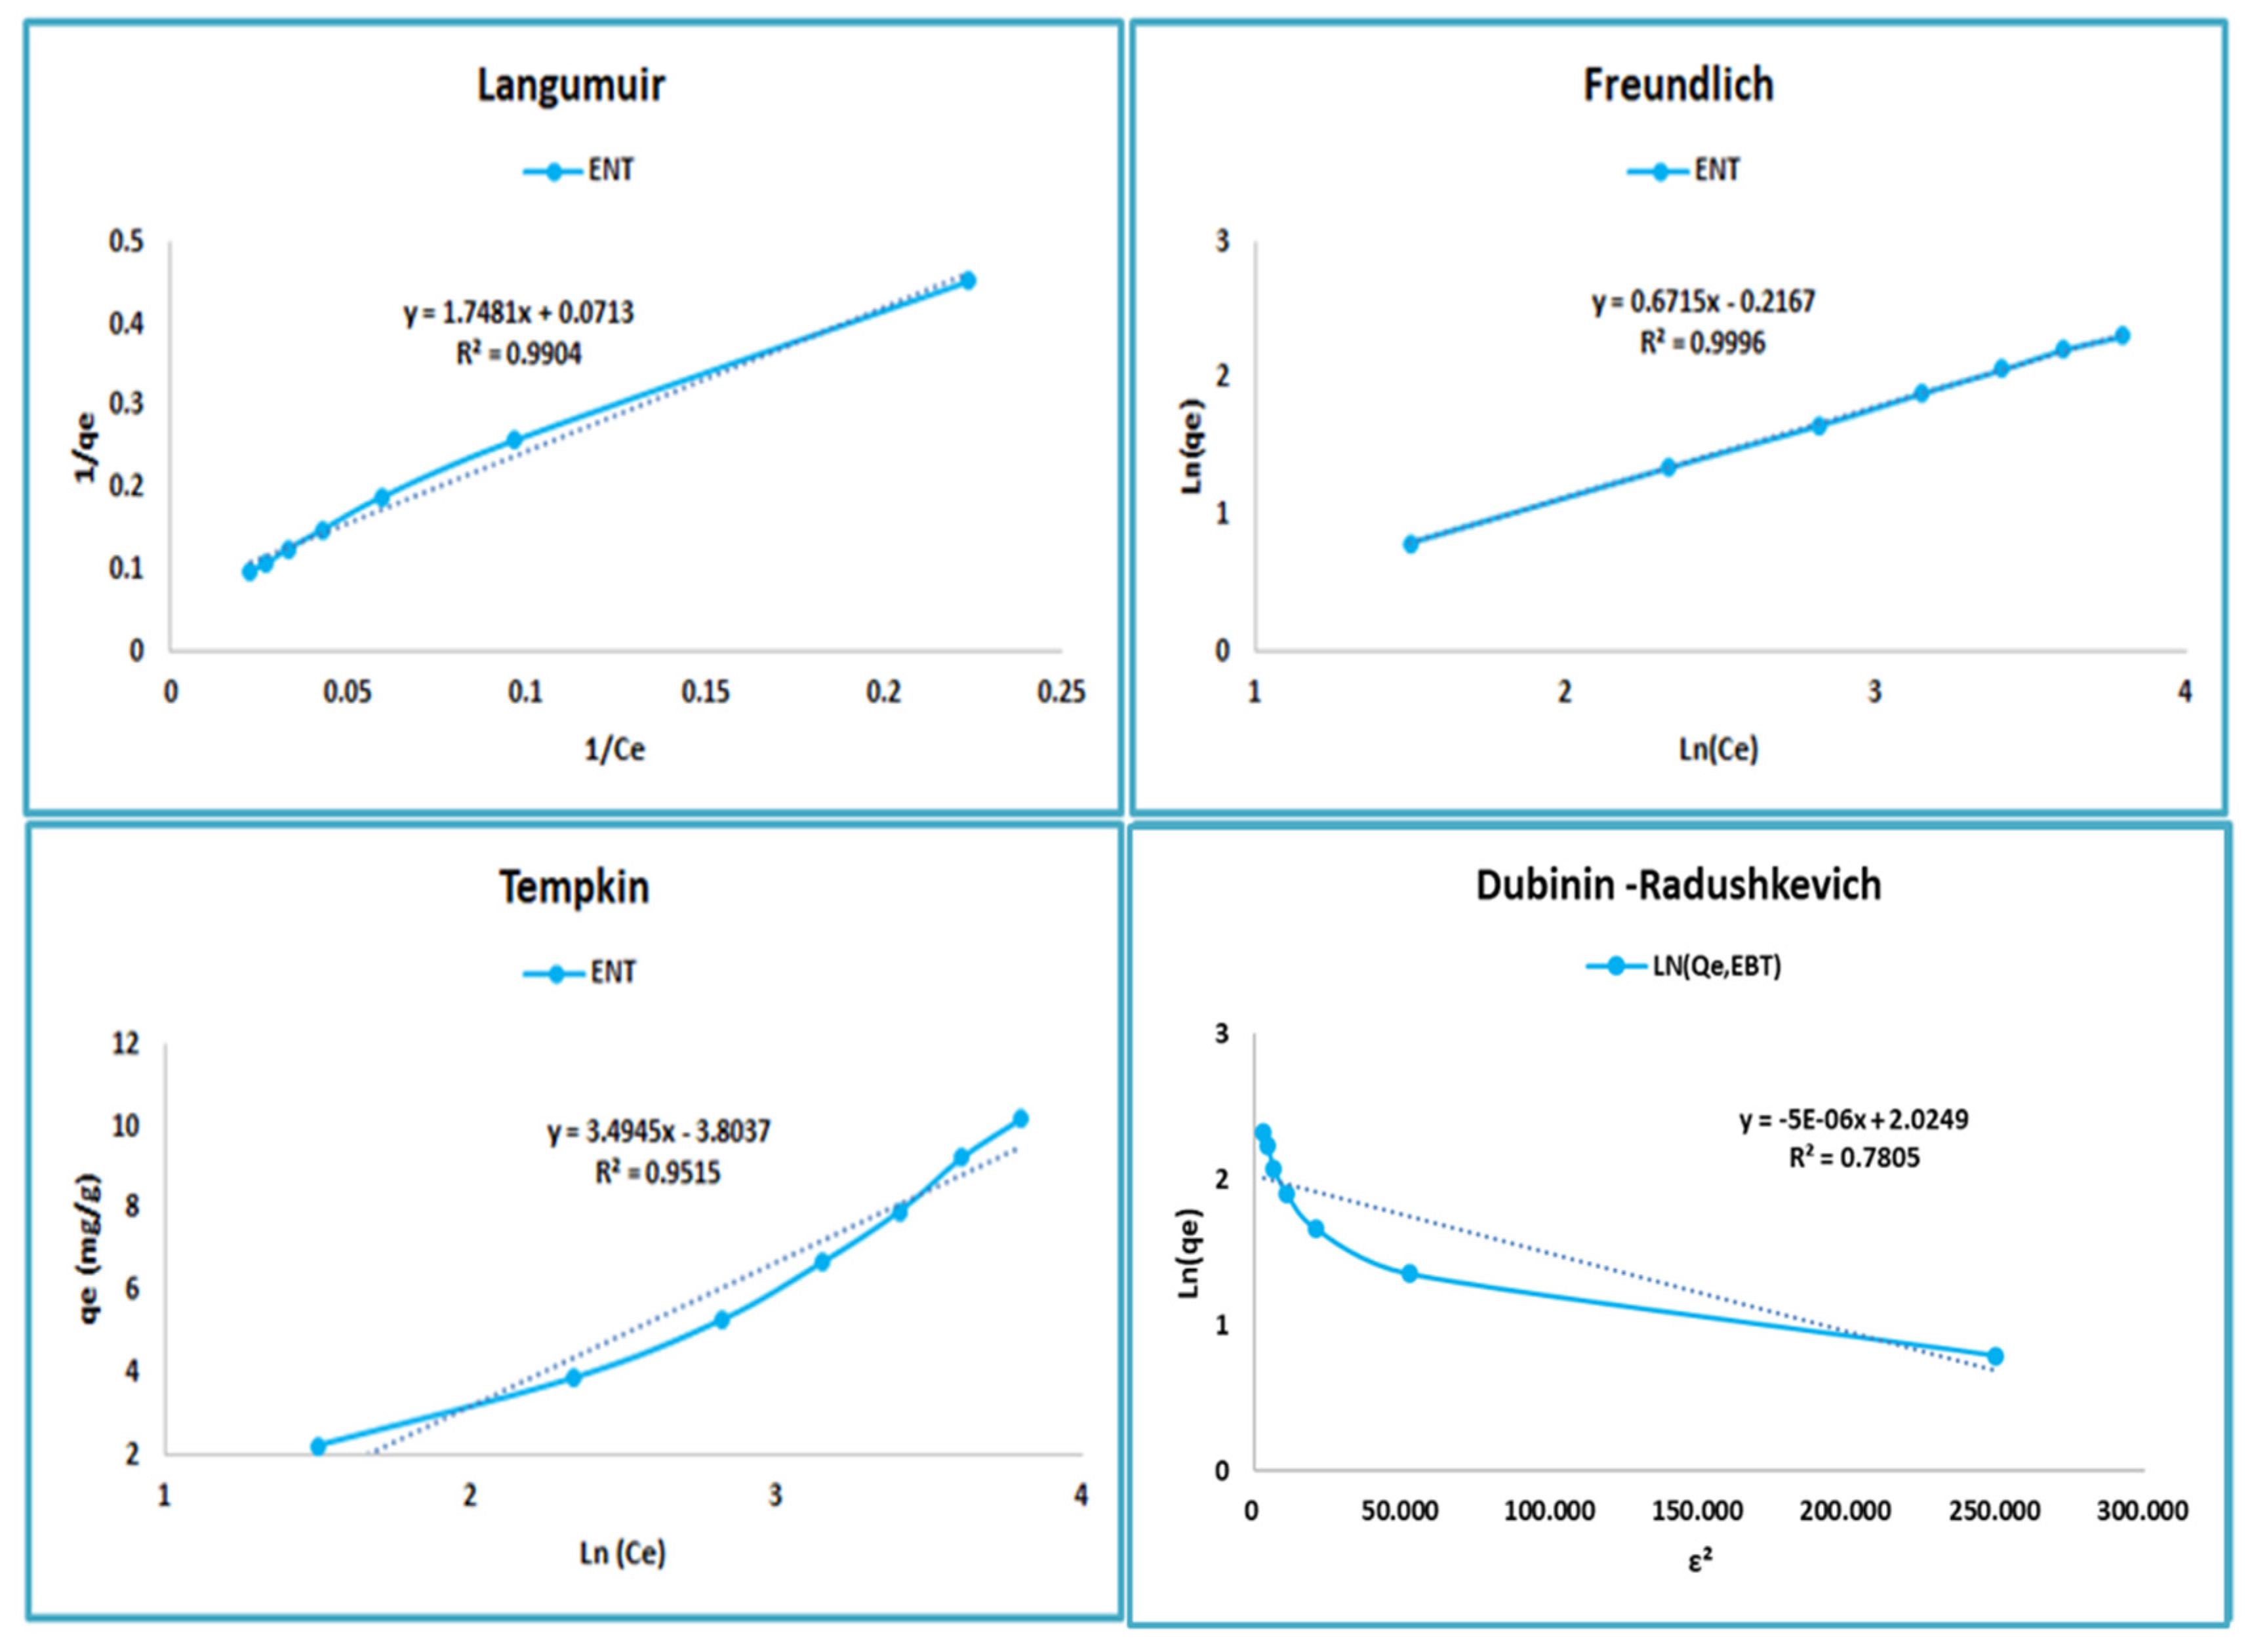
4.6. Modeling of Adsorption Isotherms
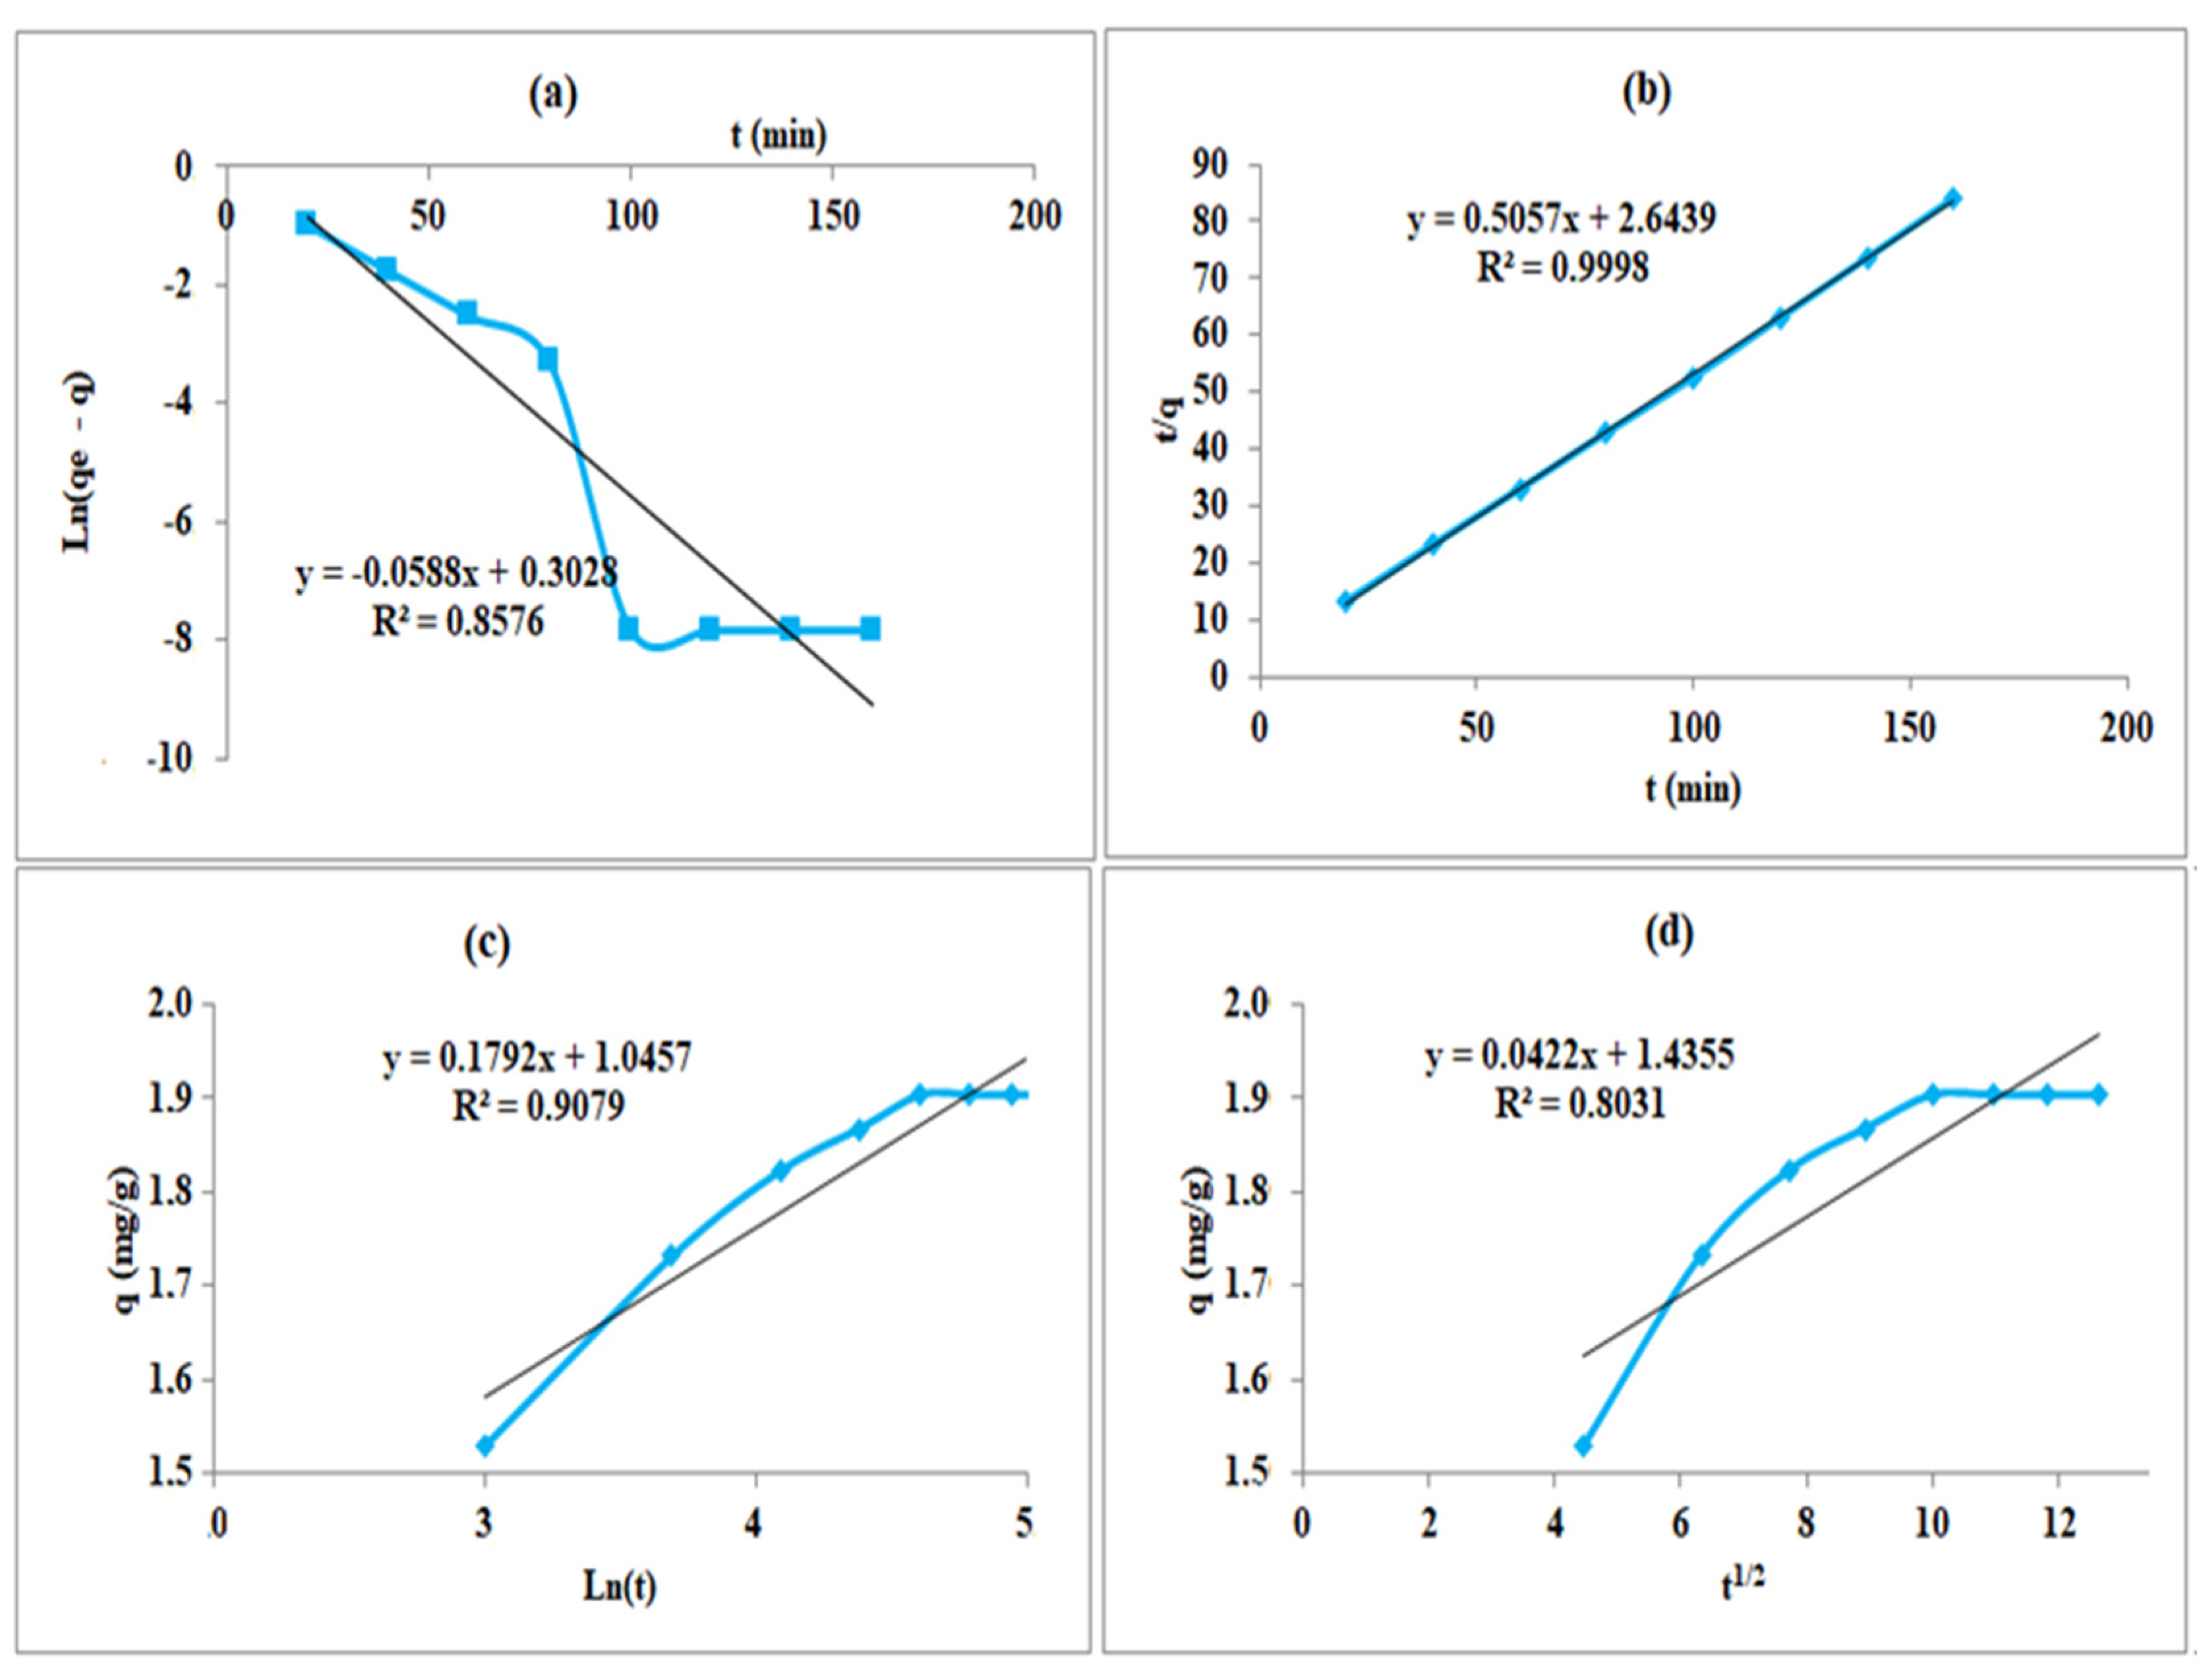
4.7. Modeling of Adsorption Kinetics
4.8. Thermodynamic Study
5. Conclusions
Author Contributions
Funding
Institutional Review Board Statement
Informed Consent Statement
Data Availability Statement
Acknowledgments
Conflicts of Interest
References
- Farinon, B.; Molinari, R.; Costantini, L.; Merendino, N. The seed of industrial hemp (Cannabis sativa L.): Nutritional quality and potential functionality for human health and nutrition. Nutrients 2020, 12, 1935. [Google Scholar] [CrossRef] [PubMed]
- Russo, E.B.; Jiang, H.E.; Li, X.; Sutton, A.; Carboni, A.; del Bianco, F.; Mandolino, G.; Potter, D.J.; Zhao, Y.X.; Bera, S.; et al. Phytochemical and genetic analyses of ancient cannabis from Central Asia. J. Exp. Bot. 2008, 59, 4171–4182. [Google Scholar] [CrossRef] [PubMed]
- Andre, C.M.; Hausman, J.-F.; Guerriero, G. Cannabis sativa: The plant of the thousand and one molecules. Front. Plant Sci. 2016, 7, 19. [Google Scholar] [CrossRef] [PubMed]
- De Petrocellis, L.; Ligresti, A.; Moriello, A.S.; Allarà, M.; Bisogno, T.; Petrosino, S.; Stott, C.G.; Di Marzo, V. Effects of cannabinoids and cannabinoid-enriched Cannabis extracts on TRP channels and endocannabinoid metabolic enzymes. Br. J. Pharmacol. 2011, 163, 1479–1494. [Google Scholar] [CrossRef]
- Zhang, J.; Mao, L.; Nithya, K.; Loh, K.C.; Dai, Y.; He, Y.; Tong, Y.W. Optimizing mixing strategy to improve the performance of an anaerobic digestion waste-to-energy system for energy recovery from food waste. Appl. Energy 2019, 249, 28–36. [Google Scholar] [CrossRef]
- Wang, B.; Dong, F.; Chen, M.; Zhu, J.; Tan, J.; Fu, X.; Wang, Y.; Chen, S. Advances in recycling and utilization of agricultural wastes in China: Based on environmental risk, crucial pathways, influencing factors, Policy Mechanism. Procedia Environ. Sci. 2016, 31, 12–17. [Google Scholar] [CrossRef]
- Sulyman, M.; Namiesnik, J.; Gierak, A. Low-cost Adsorbents Derived from Agricultural By-products/Wastes for Enhancing Contaminant Uptakes from wastewater: A Review. Polish J. Environ. Stud. 2017, 26, 479–510. [Google Scholar] [CrossRef]
- Crini, G.; Badot, P.M. Traitement et Epuration des Eaux Industrielles Polluées; Presses Universitaires de Franche-Comté: Besançon, France, 2007; p. 353. [Google Scholar]
- Sidi Zhu, Mingzhu Xia, Yuting Chu, Muhammad Asim Khan, Wu Lei, Fengyun Wang, Tahir Muhmood, Along Wang, Adsorption and Desorption of Pb(II) on l-Lysine Modified Montmorillonite and the simulation of Interlayer Structure. Appl. Clay Sci. 2019, 169, 40–47. [CrossRef]
- Zhu, Sidi and Chen, Yexiang and Khan, Muhammad Asim and Xu, Haihua and Wang, Fengyun and Xia, Mingzhu, In-Depth Study of Heavy Metal Removal by an Etidronic Acid-Functionalized Layered Double Hydroxide. ACS Appl. Mater. Interfaces 2022, 14, 7450–7463. [CrossRef]
- Chen, Y.; Zhu, Y.; Wang, Z.; Li, Y.; Wang, L.; Ding, L. Application of studies of activated carbon derived from rice husks produced by chemical–thermal process—A review. Adv. Colloid Interface Sci. 2011, 163, 39–52. [Google Scholar] [CrossRef]
- Iqbal, M.J.; Ashiq, M.N. Adsorption of dyes from aqueous solutions on activated charcoal. J. Hazard Mater. 2007, 139, 57–66. [Google Scholar] [CrossRef] [PubMed]
- Monvisade, P.; Siriphanon, P. Chitosan intercalated montmorillonite: Preparation, characterization and cationic dye adsorption. Appl. Clay Sci. 2009, 42, 427–431. [Google Scholar] [CrossRef]
- Tan, I.A.; Ahmad, A.L.; Hameed, B.H. Adsorption of basic dye using activated carbon prepared from oil palm shell: Batch and fixed bed studies. Desalin 2008, 225, 13–28. [Google Scholar] [CrossRef]
- Amin, N.K. Removal of direct blue-106 dye from aqueous solution using new activated carbons developed from pomegranate peel: Adsorption equilibrium and kinetics. J. Hazard Mater. 2009, 165, 52–62. [Google Scholar] [CrossRef]
- da Silva, L.G.; Ruggiero, R.; Gontijo, P.M.; Pinto, R.B.; Royer, B.; Lima, E.C.; Fernandes, T.H.M.; Calvete, T.A. Adsorption of Brilliant Red 2BE dye from water solutions by a chemically modified sugarcane bagasse lignin. Chem. Eng. J. 2011, 168, 620–628. [Google Scholar] [CrossRef]
- Mansouri, F.E.; Farissi, H.E.; Zerrouk, M.H.; Cacciola, F.; Bakkali, C.; Brigui, J.; Lovillo, M.P.; Esteves da Silva, J.C.G. Dye Removal from Colored Textile Wastewater Using Seeds and Biochar of Barley (Hordeum vulgare L.). Appl. Sci. 2021, 11, 5125. [Google Scholar] [CrossRef]
- Rajeshwarisivaraj, C.; Namasivayam, K.; Kadirvelu, K. Orange peel as an adsorbent in the removal of Acid violet 17 (acid dye) from aqueous solutions. Waste Manag. 2001, 21, 105–110. [Google Scholar]
- Sudaryanto, Y.; Hartono, S.; Irawata, W.; Hidarso, H.; Ismadji, S. High surface area activated carbons prepared from cassava peel by chemical activation. Bioresour Technol. 2006, 97, 734–739. [Google Scholar] [CrossRef]
- Patnukao, P.; Pavasant, P. Activated carbon from eucalyptus camaldulensis dehn barkusing phosphoric acid activation. Bioresour. Technol. 2008, 99, 8540–8543. [Google Scholar] [CrossRef]
- Gratuito, M.; Panyathanmaporn, T.; Chumnanklong, R.; Sirinuntawittaya, N.; Dutta, A. Production of activated carbon from coconut shell: Optimization using response surface methodology. Bioresour Technol 2008, 99, 4887–4895. [Google Scholar] [CrossRef]
- Ozer, C.; Imamoglu, M.; Turhan, Y.; Boyan, F. Removal of methylene blue from aqueous solutions using phosphoric acid activated carbon produced from hazelnut husks. Toxic Environ. Chem. 2012, 94, 1283–1293. [Google Scholar] [CrossRef]
- Li, W.; Zhang, L.; Peng, J.; Li, N.; Zhu, X. Preparation of high surface activated carbons from tobacco stems with K2CO3 activation using microwave irradiation. Ind. Crop. Prod. 2008, 27, 341–347. [Google Scholar] [CrossRef]
- Rim, B.A.; Sarra, K.; Karine, M.; Achraf, G. Adsorptive removal of cationic and anionic dyes from aqueous solution by utilizing almond shell as bioadsorbent. Euro-Mediterr. J. Environ. Integr. 2017, 2, 20. [Google Scholar] [CrossRef]
- Ghader, Z.; Mahsa, K.; Yusef, O.K.; Heshmatollah, N.; Shirin, E.; Mohammad, J.M.; Rajab, R. Eriochrme black-T removal from aqueous environment by surfactant modified clay: Equilibrium, kinetic, isotherm, and thermodynamic studies. Toxin Rev. 2018, 38, 307–317. [Google Scholar] [CrossRef]
- el Farissi, H.; Lakhmiri, R.; Albourine, A.; Safi, M.; Cherkaoui, O. Adsorption study of charcoal of cistus ladaniferus shell modified by H3PO4 and NaOH used as a low-cost adsorbent for the removal of toxic reactive red 23 dye: Kinetics and thermodynamics. Mater. Today Proc. 2020, 43, 1740–1748. [Google Scholar] [CrossRef]
- El Mansouri, F.; El Farissi, H.; Cacciola, F.; Talhaoui, A.; El Bachiri, A.; Tahani, A.; Esteves da Silva, J.C.G.; Brigui, J. Rapid elimination of copper (II), nickel (II) and chromium (VI) ions from aqueous solutions by charcoal modified with phosphoric acid used as a green biosorbent. Polym. Adv. Technol. 2022, 33, 2254–2264. [Google Scholar] [CrossRef]
- Molina-Sabio, M.; Rodríguez-Reinoso, F. Role of chemical activation in the development of carbon porosity. Colloids Surf. A Physicochem. Eng. Asp. 2004, 241, 15–25. [Google Scholar] [CrossRef]
- Foong, S.Y.; Liew, R.K.; Yang, Y.; Cheng, Y.W.; Yek, P.N.Y.; Mahari, W.A.W.; Lee, X.Y.; Han, C.S.; Vo, N.D.-V.; Le, Q.V.; et al. Valorization of biomass waste to engineered activated biochar by microwave pyrolysis: Progress, challenges, and future directions. Chem. Eng. J. 2020, 389, 124401. [Google Scholar] [CrossRef]
- Zięzio, M.; Charmas, B.; Jedynak, K.; Hawryluk, M.; Kucio, K. Preparation and characterization of activated carbons obtained from the waste materials impregnated with phosphoric acid(V). Appl. Nanosci. 2020, 10, 4703–4716. [Google Scholar] [CrossRef]
- Haykiri-Acma, H.; Yaman, S.; Alkan, M.; Kucukbayrak, S. Mineralogical characterization of chemically isolated ingredients from biomass. Energy Convers. Manag. 2014, 77, 221–226. [Google Scholar] [CrossRef]
- Protásio, T.D.P.; Guimarães, M.; Mirmehdi, S.; Trugilho, P.F.; Napoli, A.; Knovack, K.M. Combustion of biomass and charcoal made from babassu nutshell. Cerne 2017, 23, 1–10. [Google Scholar] [CrossRef]
- Park, D.; Yun, Y.S.; Park, J.M. Use of dead fungal biomass for the detoxification of hexavalent chromium: Screening and kinetics. Process Biochem. 2005, 40, 2559–2565. [Google Scholar] [CrossRef]
- Begum, S.A.S.; Tharakeswar, Y.; Kalyan, Y.; Naidu, G.R. Biosorption of Cd (II), Cr (VI) Pb (II) from Aqueous Solution Using Mirabilis jalapa as Adsorbent. J. Encapsulation Adsorpt. Sci. 2015, 5, 93–104. [Google Scholar] [CrossRef]
- Kondapalli, S.; Mohanty, K. Influence of Temperature on Equilibrium, Kinetic and Thermodynamic Parameters of Biosorption of Cr(VI) onto Fish Scales as Suitable Biosorbent. J. Water Resour. Prot. 2011, 3, 429–439. [Google Scholar] [CrossRef][Green Version]
- Dula, T.; Siraj, K.; Kitte, S.A. Adsorption of Hexavalent Chromium from Aqueous Solution Using Chemically Activated Carbon Prepared from Locally Available Waste of Bamboo (Oxytenanthera abyssinica). ISRN Environ. Chem. 2014, 2014, 4382452014. [Google Scholar] [CrossRef]
- Langmuir, I. The Adsorption Of Gases On Plane Surfaces Of Glass, Mica And Platinum. J. Am. Chem. Soc. 1918, 40, 1361–1403. [Google Scholar] [CrossRef]
- Freundlich, H. Colloid and Capilary Chemistry, english translation of 3rd German ed.; Methuen: London, UK, 1926. [Google Scholar]
- Freundlich, H.; Heller, W. The Adsorption of cis- and trans-Azobenzene. J. Am. Chem. Soc. 2002, 61, 2228–2230. [Google Scholar] [CrossRef]
- Mahmoodi, N.M.; Salehi, R.; Arami, M.; Bahrami, H. Dye removal from colored textile wastewater using chitosan in binary systems. Desalination 2011, 267, 64–72. [Google Scholar] [CrossRef]
- Ghasemi, M.; Javadian, H.; Ghasemi, N.; Agarwal, S.; Gupta, V.K. Microporous nanocrystalline NaA zeolite prepared by microwave assisted hydrothermal method and determination of kinetic, isotherm and thermodynamic parameters of the batch sorption of Ni (II). J. Mol. Liq. 2016, 215, 161–169. [Google Scholar] [CrossRef]
- Wang, X.; Jiang, C.; Hou, B.; Wang, Y.; Hao, C.; Wu, J. Carbon composite lignin-based adsorbents for the adsorption of dyes. Chemosphere 2018, 206, 587–596. [Google Scholar] [CrossRef] [PubMed]
- Shi, T.; Xie, Z.; Zhu, Z.; Shi, W.; Liu, Y.; Liu, M. Highly efficient and selective adsorption of heavy metal ions by hydrazide-modified sodium alginate. Carbohydr. Polym. 2022, 276, 118797. [Google Scholar] [CrossRef] [PubMed]
- Maneechakr, P.; Mongkollertlop, S. Investigation on adsorption behaviors of heavy metal ions (Cd2+, Cr3+, Hg2+ and Pb2+) through low-cost/active manganese dioxide-modified magnetic biochar derived from palm kernel cake residue. J. Environ. Chem. Eng. 2020, 8, 104467. [Google Scholar] [CrossRef]
- Tao, Y.; Yang, B.; Wang, F.; Yan, Y.; Hong, X.; Xu, H.; Xia, M.; Wang, F. Green synthesis of MOF-808 with modulation of particle sizes and defects for efficient phosphate sequestration. Sep. Purif. Technol. 2022, 300, 121825. [Google Scholar] [CrossRef]
- Saini, J.; Garg, V.K.; Gupta, R.K.; Kataria, N. Removal of Orange G and Rhodamine B dyes from aqueous system using hydrothermally synthesized zinc oxide loaded activated carbon (ZnO-AC). J. Environ. Chem. Eng. 2017, 5, 884–892. [Google Scholar] [CrossRef]
- Sewu, D.D.; Boakye, P.; Woo, S.H. Highly efficient adsorption of cationic dye by biochar produced with Korean cabbage waste. Bioresour. Technol. 2017, 224, 206–213. [Google Scholar] [CrossRef]
- Popa, N.; Visa, M. The synthesis, activation and characterization of charcoal powder for the removal of methylene blue and cadmium from wastewater. Adv. Powder Technol. 2017, 28, 1866–1876. [Google Scholar] [CrossRef]
- Islam, M.T.; Hyder, A.G.; Saenz-Arana, R.; Hernandez, C.; Guinto, T.; Ahsan, M.A.; Alvarado-Tenorio, B.; Noveron, J.C. Removal of methylene blue and tetracycline from water using peanut shell derived adsorbent prepared by sulfuric acid reflux. J. Environ.Chem. Eng. 2019, 7, 102816. [Google Scholar] [CrossRef]
- Isa, K.M.; Daud, S.; Hamidin, N.; Ismail, K.; Saad, S.A.; Kasim, F.H. Thermogravimetric analysis and the optimisation of bio-oil yield from fixed-bed pyrolysis of rice husk using response surface methodology (RSM). Ind. Crops Prod. 2011, 33, 481–487. [Google Scholar] [CrossRef]
- Núñez-gómez, D.; Rodrigues, C.; Rubens, F. Adsorption of heavy metals from coal acid mine drainage by shrimp shell waste: Isotherm and continuous-flow studies. J. Environ. Chem. Eng. 2019, 7, 102787. [Google Scholar] [CrossRef]
- Ho, Y.S.; McKay, G. Pseudo-second order model for sorption processes. Process Biochem. 1999, 34, 451–465. [Google Scholar] [CrossRef]
- Urano, K.; Hirotaka, T. Process development for removal and recovery of phosphorus from wastewater by a new adsorbent. II. Adsorption rates and breakthrough curves. Ind. Eng. Chem. Res. 1991, 30, 1897–1899. [Google Scholar] [CrossRef]
- Venkat, P.V.V.B.; Mane, S. Studies on the adsorption of Brilliant Green dye from aqueous solution onto low-cost NaOH treated saw dust. Desalination 2011, 273, 321–329. [Google Scholar] [CrossRef]
- Jin, G.P.; Wang, X.L.; Fu, Y.; Do, Y. Preparation of tetraoxalyl ethylenediamine melamine resin grafted-carbon fibers for nano-nickel recovery from spent electroless nickel plating baths. Chem. Eng. J. 2012, 203, 440–446. [Google Scholar] [CrossRef]
- Mahjoub, B.; Ncibi, M.C.; Seffen, M. Adsorption d’un Colorant Textile Réactif sur un Biosorbant Non-Conventionnel: Les Fibres de Posidonia oceanica (L.) Delile. Can. J. Chem. Eng. 2008, 86, 23–29. [Google Scholar] [CrossRef]


| Bond Type | Functional Group | Wave Numbers Range (cm−1) | |
|---|---|---|---|
| σth | σexp | ||
| C-H | Alkane | 2850–2925 | 2920.66 |
| 2851.52 | |||
| C=O | Aliphatic Ketone | 1710–1735 | 1741.40 |
| C-H | Aldehyde | 1370–1390 | 1394.28 |
| C-OH | Third Alcohol | 1110–1250 | 1230.20 |
| 1146.47 | |||
| C-H | Cycloalkane | 1012–1031 | 1028.83 |
| =C-H (E) | Alkene | 950–1010 | 953.62 |
| Ar-C | Aromatic | 850–890 | 862.02 |
| =C-H (Z) | Alkene | 650–750 | 691.12 |
| Isotherm Models | Constants | Activated Carbon of Cannabis |
|---|---|---|
| Langmuir | R² | 0.9904 |
| RL | 0.2636–0.7143 | |
| KL (L.mg−1) | 0.0399 | |
| qm (mg.g−1) | 14.025 | |
| Freundlich | R² | 0.9996 |
| KF | 0.8052 | |
| n | 1.4892 | |
| Temkin | R² | 0.9545 |
| KT (L.g−1) | 0.00012 | |
| B1 (J.mol−1) | 3.4945 | |
| b | 697.096 | |
| Dubinin–Radushkevich | R² | 0.7805 |
| Kad (mol2.Kj−2) × 10−5 | 0.5 | |
| E (Kj.mol−1) | 316.2277 | |
| qm (mg.g−1) | 7.5754 |
| Adsorbate | Adsorbent Pollutants | Dose (mg) | C0 (mg L−1) | pH | Kinetic | Isotherm | qm (mg g−1) | Ref. |
|---|---|---|---|---|---|---|---|---|
| Zinc oxide-loaded activated char (ZnO-AC ) | OG Rh-b | 8–30 | 50 | 7 | Pseudo- second-order | Langmuir | 153.8 128.2 | [46] |
| Rice straw (RS) biochar Wood chip (WC) biochar | CV-CR | 01 | 500 | 7 | Pseudo- second-order | Langmuir | 620.3 195.6 | [47] |
| Charcoal (tree branches) (BCA-TiO2) | MB Cd2+ | ** ** | 0.4 600 | 7 8 | Pseudo- second-order | ** | 200 250 | [48] |
| Sulfonated peanut shell (PNS-SO3H) | MB TC | 20 | 900 ppm | 10 | Pseudo- second-order | Langmuir | 1250 303 | [49,50] |
| Shrimp shell (SS) Coal acid mine drainage (AMD) | Mn Fe | ** | ≤1 ≤15 | 6–9 5–9 | Pseudo- second-order | Frendlich | 17.43 3.87 | [51] |
| Waste hemp activated carbon (WHAC) | EBT | 10 | 10 | 7 | Pseudo- second-order | Langmuir | 14.025 | This work |
| Models | The Constants | Cannabis |
|---|---|---|
| Pseudo-first-order | R² | 0.8576 |
| K1 (mL.min−1) | 0.0588 | |
| qe,cal (mg.g−1) | 1.353 | |
| qe,exp (mg.g−1) | 1.903 | |
| Pseudo-second-order | R² | 0.9998 |
| K2(g.mg−1.min−1) | 0.0968 | |
| qe,cal (mg.g−1) | 1.9774 | |
| qe,exp (mg.g−1) | 1.903 | |
| R² | 0.9079 | |
| Elovich | α (mg.g−1.min−1) | 45.4475 |
| β (g.mg−1) | 5.5803 | |
| Intraparticle diffusion | R² | 0.8031 |
| Ki (mg.g−1.min0.5 | 0.0422 | |
| C (mg.g−1) | 1.4355 |
| Parameters | Cannabis | |
|---|---|---|
| ΔH° (KJ.mol−1) | 16.8467 | |
| ΔS° (J.mol−1.K−1) | 11.0808 | |
| ΔG° (kJ.mol−1) | T = 293°K | 13.5999 |
| T = 303°K | 13.48917 | |
| T = 313°K | 13.37838 | |
| T = 323°K | 13.26756 | |
| T = 333°K | 13.15675 | |
Publisher’s Note: MDPI stays neutral with regard to jurisdictional claims in published maps and institutional affiliations. |
© 2022 by the authors. Licensee MDPI, Basel, Switzerland. This article is an open access article distributed under the terms and conditions of the Creative Commons Attribution (CC BY) license (https://creativecommons.org/licenses/by/4.0/).
Share and Cite
El Mansouri, F.; Pelaz, G.; Morán, A.; Da Silva, J.C.G.E.; Cacciola, F.; El Farissi, H.; Tayeq, H.; Zerrouk, M.H.; Brigui, J. Efficient Removal of Eriochrome Black T Dye Using Activated Carbon of Waste Hemp (Cannabis sativa L.) Grown in Northern Morocco Enhanced by New Mathematical Models. Separations 2022, 9, 283. https://doi.org/10.3390/separations9100283
El Mansouri F, Pelaz G, Morán A, Da Silva JCGE, Cacciola F, El Farissi H, Tayeq H, Zerrouk MH, Brigui J. Efficient Removal of Eriochrome Black T Dye Using Activated Carbon of Waste Hemp (Cannabis sativa L.) Grown in Northern Morocco Enhanced by New Mathematical Models. Separations. 2022; 9(10):283. https://doi.org/10.3390/separations9100283
Chicago/Turabian StyleEl Mansouri, Fouad, Guillermo Pelaz, Antonio Morán, Joaquim C. G. Esteves Da Silva, Francesco Cacciola, Hammadi El Farissi, Hatim Tayeq, Mohammed Hassani Zerrouk, and Jamal Brigui. 2022. "Efficient Removal of Eriochrome Black T Dye Using Activated Carbon of Waste Hemp (Cannabis sativa L.) Grown in Northern Morocco Enhanced by New Mathematical Models" Separations 9, no. 10: 283. https://doi.org/10.3390/separations9100283
APA StyleEl Mansouri, F., Pelaz, G., Morán, A., Da Silva, J. C. G. E., Cacciola, F., El Farissi, H., Tayeq, H., Zerrouk, M. H., & Brigui, J. (2022). Efficient Removal of Eriochrome Black T Dye Using Activated Carbon of Waste Hemp (Cannabis sativa L.) Grown in Northern Morocco Enhanced by New Mathematical Models. Separations, 9(10), 283. https://doi.org/10.3390/separations9100283