Article

The Effect of Molecular Mass of Hydroxyethyl Cellulose on the Performance of Capillary Electrophoretic Separation of Proteins

1
Engineering Research Center of Optical Instrument and System, School of Optoelectronic Information and Computer Engineering, University of Shanghai for Science and Technology, Shanghai 200093, China
2
Key Lab of Optical Instruments and Equipment for Medical Engineering, School of Optoelectronic Information and Computer Engineering, University of Shanghai for Science and Technology, Shanghai 200093, China
3
Shanghai Key Lab of Modern Optical System, School of Optoelectronic Information and Computer Engineering, University of Shanghai for Science and Technology, Shanghai 200093, China
4
Graduate School of Engineering, Osaka University, Osaka 565-0871, Japan
5
Department of Pediatric Dentistry, Shanghai Ninth People’s Hospital, Shanghai 200011, China
6
National Center for Stomatology, Shanghai Ninth People’s Hospital, Shanghai 200011, China
7
Shanghai Key Laboratory of Stomatology, College of Stomatology, Shanghai Jiao Tong University, Shanghai 200030, China
8
National Clinical Research Center for Oral Diseases, Shanghai Jiao Tong University School of Medicine, Shanghai 200025, China
*
Authors to whom correspondence should be addressed.
Separations 2022, 9(10), 284; https://doi.org/10.3390/separations9100284
Submission received: 5 August 2022 / Revised: 29 August 2022 / Accepted: 15 September 2022 / Published: 3 October 2022
(This article belongs to the Section Chromatographic Separations)

Abstract

:
Capillary electrophoresis (CE) is a versatile analytical separation method in the field of biochemistry. Although it has been proved that the relative molecular mass (Mr) of the polymers determines the threshold concentration of the entangled polymer solution, which will affect the separation performance of DNA molecules, there is still no report on the effect of Mr on the separation performance of proteins. Herein, we have thoroughly performed the CE of proteins ranged from 14.3 kDa to 116 kDa in a mixed hydroxyethyl cellulose (HEC) solution. The mixed solution was obtained with various Mr including 90,000, 250,000, 720,000, and 1,300,000. Then, we found that the mixed polymer provided a high resolution for small protein molecules while increasing the efficiency of large ones. Results demonstrated that the migration time decreased if HEC (1,300,000) was mixed with the lower Mr one, and the mixed solution (1,300,000/250,000) offered the highest resolution. The resolution was negatively correlated with the electric field strength. Finally, we have employed the optimal electrophoretic conditions to separate proteins in human tears, and it showed that lysozyme, lipocalin, and lactoferrin from human tears were successfully resolved in the mixed HEC. Such work indicates that CE has the potential to be developed as a tool for the diagnosis of xerophthalmia, meibomian gland dysfunction, or other eye diseases.

1. Introduction

Proteins perform generous organism functions such as catalyzing metabolic reactions, responding to stimuli and transporting molecules. Research shows that the variation of protein levels can reveal medical disorders. The electrophoresis of proteins, such as serum or tear proteins, has great value for clinical diagnosis and disease screening [1,2,3,4,5], toxicological analysis [6,7]. Among various electrophoresis technologies, capillary electrophoresis (CE) is the most popular tool for protein analysis due to its numerous advantages (e.g., high separation efficiency, and low reagent consumption) [8,9,10,11].
There are numerous studies about improving the separation performance of proteins by CE. For example, Leclercq et al. evaluated the protein adsorption on the inner surface of the capillary, and offered a method to rank the coating effect on protein adsorption [12]. Sumitomo and coworkers investigated the relationship between the resolution and the homogeneity of the polymer. Results demonstrated that the best resolution was achieved for proteins ranging from 14.3 kDa to 97.2 kDa when the mesh size of the polymer was less than 10 nm [13]. Deyanova fabricated a fast and robust microfluidic CE device compatible with mass spectrometry. Moreover, they realized the effective separation of multiple sialylated glycoforms, which is quite important for product control in therapeutic protein drug development [14]. The nanoparticles exhibit unique chemical and physical properties caused by the environment [15]. Zhao’s group carried out gold nanoparticle-amplified CE chemiluminescence determination of carcinoembryonic antigen [16].
The sieving polymer plays a major role in affecting the separation performance of biomolecules [17,18]. Compared with cross-linked gels [19], entangled and uncross-linked water-soluble polymers (e.g., polyethylene oxide, polyvinylpyrrolidone, hydroxyethyl cellulose (HEC) [20,21,22]) can easier flush into capillaries. New biomaterials (e.g., hydrogel) are also employed in capillary electrophoresis. Wang synthesized a pore-size-controllable hydrogel, and realized separation of dsDNA for single base [23], but it took one week to synthesize the hydrogel in the capillary. Since HEC solution exhibits excellent cross-linking between molecules and is easy to prepare, it is thus suitable to be employed for separation of proteins. What is more, the low concentration oligoHEC is able to extract the protein’s molecules effectively [24]. The separation performance partly depends on the mesh size [25] of the sieving polymer networks, and the mesh size is dominated by the concentration and relative molecular mass (Mr) of the polymer. It takes a long time for large protein molecules to be separated in high-concentration polymer solutions with high Mr, while small fragments usually show poorer resolution in dilute solutions of lower Mr polymers.
To overcome the above-mentioned drawbacks, the practicable alternative is to employ the mixture of polymers with different Mr as the sieving matrix. In this work, we analyzed the electrophoresis performance of proteins ranged from 6.5 kDa to 200 kDa in HEC with different Mr and their mixed solutions. Such a study may offer a new way for the effective separation of proteins with a wide range.

2. Materials and Methods

2.1. Reagents and Chemicals

Dithiothreitol (DTT) was bought from Aladdin (Beijing Solarbio Science & Technology Co., Ltd., Beijing, China). 10× Tris/Glycine/SDS buffer and 10× flamingo were bought from BIORAD (Hercules, CA, USA). Additionally, 1× Tris/Glycine/SDS buffer (25 mM Tris, 192 mM glycine and 0.1% (m/v) SDS, pH 8.3) was obtained by diluting 10× Tris/Glycine/SDS buffer. HEC with Mr of 1,300,000, 720,000, 250,000 and 90,000 was obtained from Sigma (St Louis, MO, USA). To prepare the HEC polymer solution, we weighed HEC powder according to the concentration, then added the powder, 10× Tris/Glycine/SDS buffer and 10× flamingo into ultrapure water. We needed to make sure the final HEC polymer solution contained 2× flamingo and 1× SDS.
Protein markers (Code No. 3452Q) were from Takara (Shiga, Japan), consisting of aprotinin bovine pancreas (6.5 kDa) lysozyme (14.3 kDa), trypsin inhibitor (20.1 kDa), carbonic anhydrase (29.0 kDa), ovalbumin (44.3 kDa), serum albumin (66.4 kDa), phosphorylase B (97.2 kDa), β-galactosidase (116.0 kDa), and Myosin Pig (200 kDa). The protein marker was diluted to 0.1 mg/mL with 1386 μL 1× Tris/Glycine/SDS buffer containing 5 mM DTT. Then it was denatured at 95 °C for 5 min. The prepared samples were kept at −20 °C prior to use.

2.2. Apparatus

The self-built CE system [26,27] for the experiments consisted of a high-voltage power supply (MODEL 610E, TREK, Medina, NY, USA), a mercury lamp, a R928 photomultiplier tube (PMT) (Hamamatsu Photonics, Shizuoka, Japan) and a BX51 microscope (Olympus, Tokyo, Japan). Mercury lamp with an optical filter (U-WMIBA3, Olympus, Tokyo, Japan) offered 460–495 nm excitation wavelength, the conjugate of proteins and flamingo produced the emission, which was collected by a 50× objective (PlanApo/IR, Olympus, Tokyo, Japan), and then detected by PMT. The injection and separation of samples were carried out with high-voltage power supply which was controlled by a locally programmed LabVIEW 2016 software (National Instruments, TX, USA). The capillary was coated according to the method we described in our previous work, Ref. [28]. First, the HEC solutions were introduced into the fused-silica capillary (ID/OD = 75/365, μm/μm) (Polymicro Technologies, Phoenix, AZ, USA) by a vacuum pump. Then, the samples were loaded into the capillary for 30 s by electric field strength of 100 V/cm. Finally, proteins were separated by inputting the appropriate voltage in Lab-VIEW software. The experiment was carried out in a darkroom.

3. Results and Discussion

3.1. Separation of Proteins in HEC with Different Relative Molecular Mass

Protein molecules were firstly separated in 1.4% (m/v) HEC (1,300,000) with various Mr. The electric field strength was 100 V/cm. The peak corresponding to aprotinin bovine pancreas (6.5 kDa) or Myosin Pig (200 kDa) sometimes cannot be observed because of its concentration and diffusion in the HEC solution, so they were analyzed in the following part. Data in Figure S1A (see it in Supplementary Materials) revealed that the migration time of proteins was longer if the concentration or Mr (see Figure S1B in Supplementary Materials) of HEC was higher, although the resolution was relatively higher. Meanwhile, proteins moved faster in HEC solutions with lower Mr, but smaller proteins cannot be well resolved in HEC solutions (90,000 and 250,000) if the concentration was low. However, it should be noted that the HEC solutions (720,000 and 1,300,000) over 1.4% (m/v) were difficult to introduce into the capillary because of their high viscosity. This phenomenon inspired to mix the HEC with different Mr with the hope of obtaining a better separation performance.

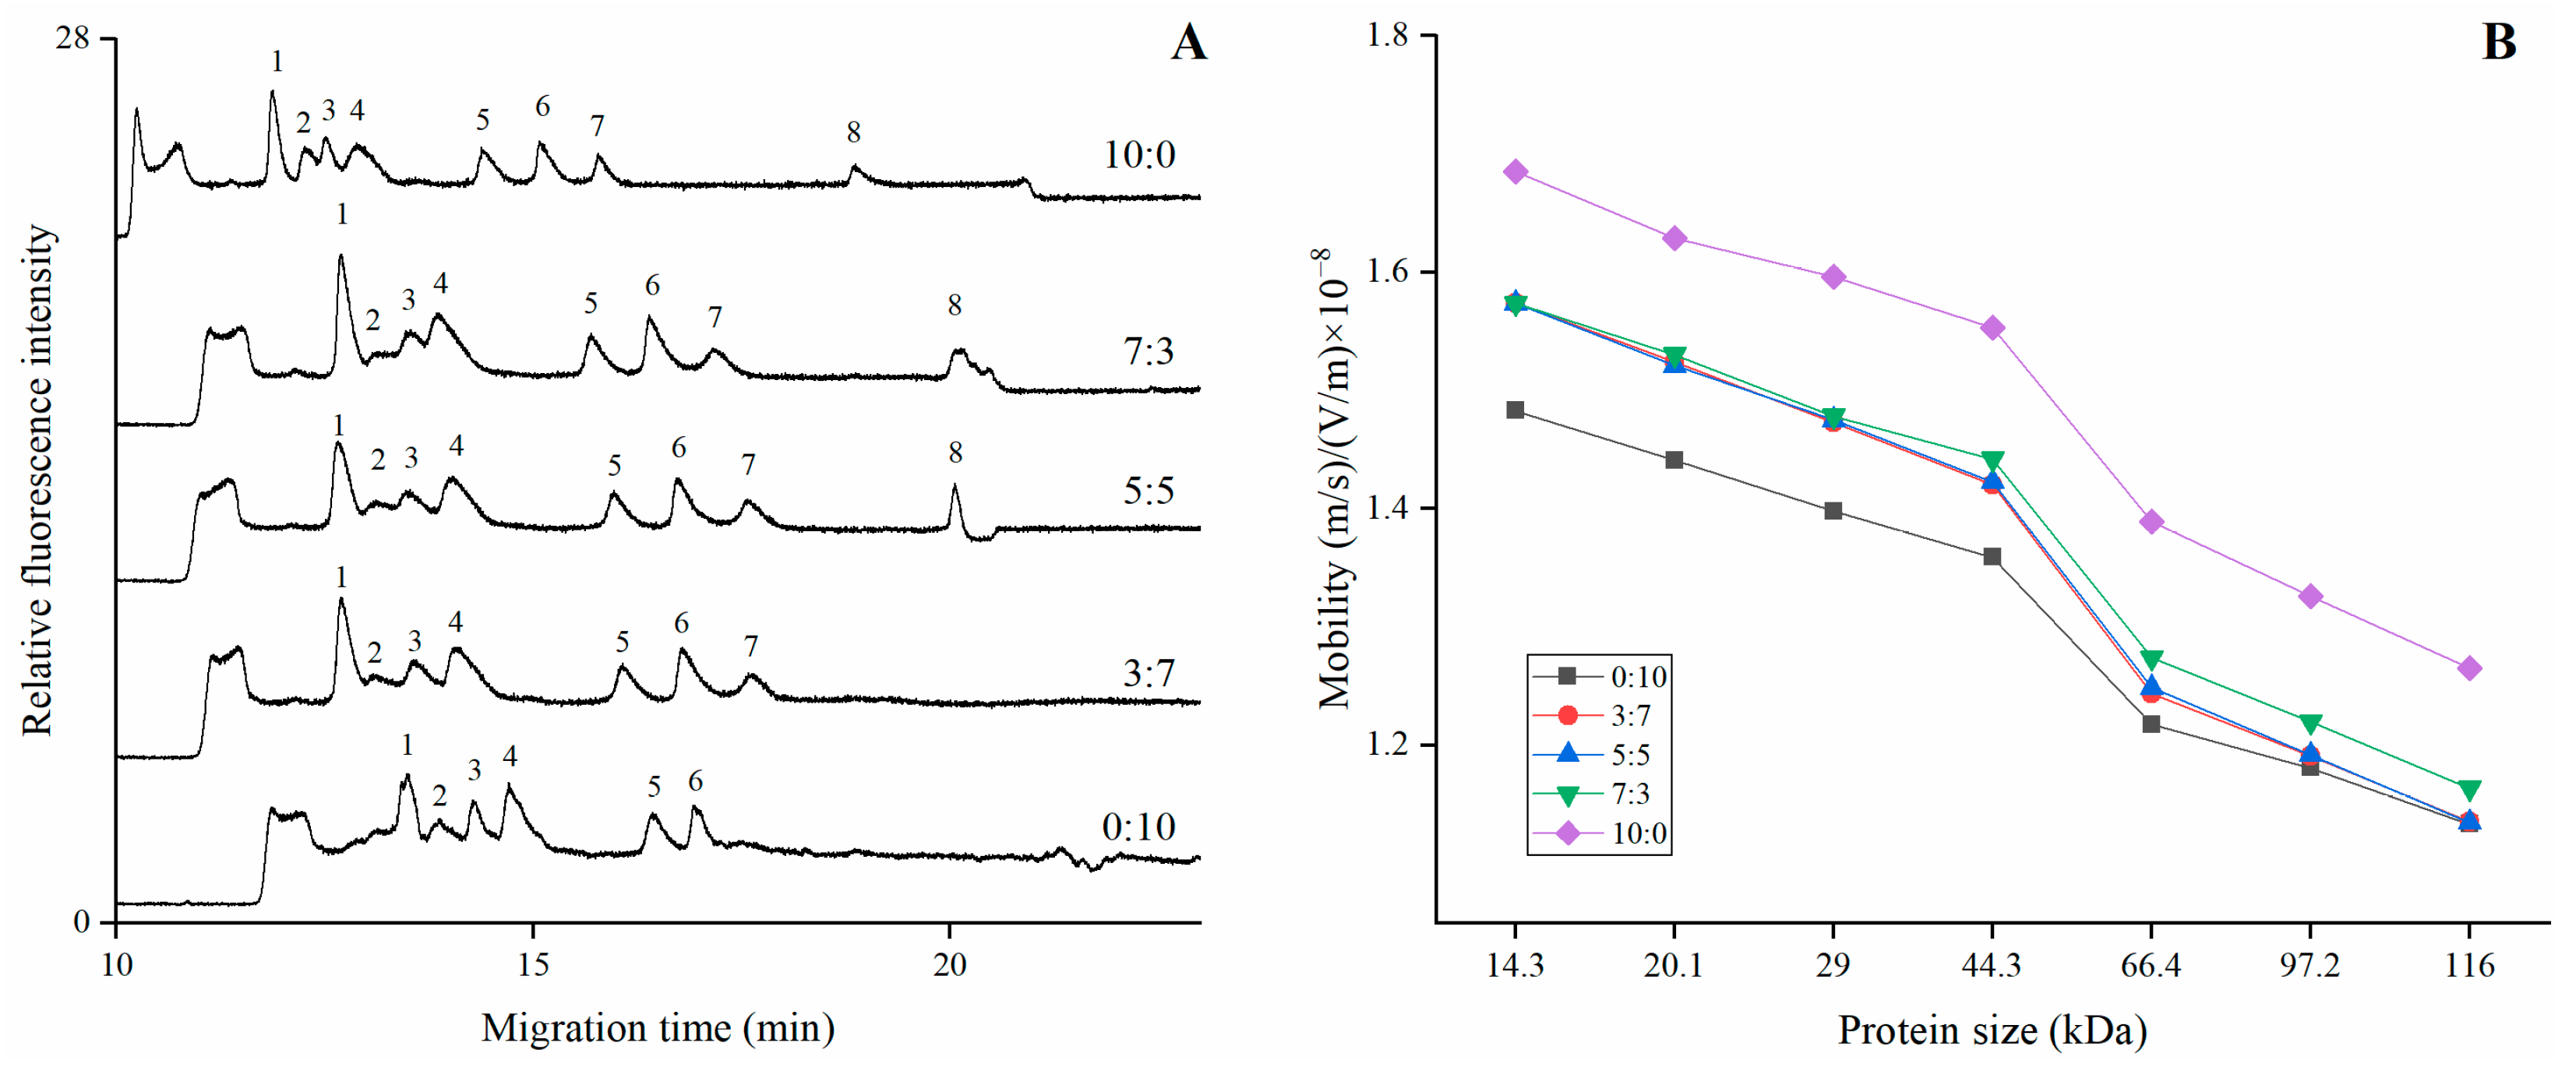
3.2. Separation of Proteins in Mixed HEC with Different Relative Molecular Mass

We prepared the sieving polymer by mixing the equal volume of HEC with different Mr. For example, 250,000/1,300,000 denotes the mixed solution containing 250,000 and 1,300,000 HEC with equal volume. Figure 1A depicted the electropherogram of proteins in 1.4% (m/v) HEC solution with Mr of 1,300,000, 720,000/1,300,000, 250,000/1,300,000, 90,000/1,300,000, respectively. The electric field strength was 100 V/cm. The total length and the effective length of the capillary were 15 cm and 12 cm, respectively. The first peak was caused by the fluorescence of dye/Glycine complex. All the proteins moved faster when the HEC (1,300,000) was mixed with the lower Mr one. Moreover, the resolution of smaller fragments (14.3–44.3 kDa) did not deteriorate, indicating that the effective separation of short proteins was mainly dependent on HEC with high Mr. Results also demonstrated that the peak corresponding to β-galactosidase was obviously lower in HEC (1,300,000) or HEC (720,000/1,300,000). In contrast, the peak was higher when it was mixed with HEC (250,000) or HEC (90,000). Figure 1B showed the effect of mixed polymers on the migration time and it was found that the 250,000/1,300,000 HEC solution offered the optimal resolution for larger proteins (66.4 kDa, 97.2 kDa, 116.0 kDa) with relatively shorter separation time, which was selected for the subsequent analysis.

3.3. The Ratio of the Components in Mixed HEC Polymer

We investigated separation performance with the varying ratios of mixed polymer composition according to the migration times and the resolution for the adjacent peaks in the electropherogram. The resolution R is described as
R = Δt/1/2(W1 + W2)
where △t is the time duration between two adjacent peaks, W is the peak width for each peak. We separated the proteins in the various mixed HEC (250,000/1,300,000) polymers with different ratios: 0/10, 3/7, 5/5, 7/3, and 10/0. Other electrophoretic conditions were the same as that of Figure 1. Figure 2A showed that the migration time relatively reduced with the increase of HEC (250,000) in the mixed solution. The peak corresponding to 200 kDa protein was prone to being diffused; thus, it could not be observed if the mixed solution contained more HEC (1,300,000). Figure 2B demonstrated that the mobility of the proteins in the mixed HEC solution was smaller than it in HEC (1,300,000), and higher than it in HEC (250,000). Moreover, no obvious difference was observed in the mixed solution with ratio of 3/7, 5/5, and 7/3, although mixed solution with a ratio of 5/5 offered the best separation performance.

3.4. Optimal Electrophoretic Conditions for Protein Separation in Mixed Polymer

We have separated the proteins with different mixed polymer concentrations and varied electric field strengths. The concentration of HEC (250,000/1,300,000) was varied from 0.5% to 1.4% (m/v). The polymer was mixed in a ratio of 5/5. Other electrophoretic conditions were the same as that of Figure 1. It showed that the migration time was increased and the resolution between the adjacent proteins improved if the concentration of HEC was high (Figure 3A). This is because a high concentration of HEC induced a smaller mesh size in the polymer. Figure 3B demonstrated the separation of protein markers in 1.4% (m/v) HEC (250,000/1,300,000) with electric field strength from 50 V/cm to 150 V/cm. It depicted that the migration time was negatively correlated to the electric field strength, and the resolution was slightly deteriorated because of the adjacent protein molecule nearly migrated together. However, it took a long time for proteins to be separated by 50 V/cm, while 150 V/cm induced worse resolution. Therefore, 100 V/cm of electric field strength offered best separation performance because all the protein markers were baseline resolved within 22 min.

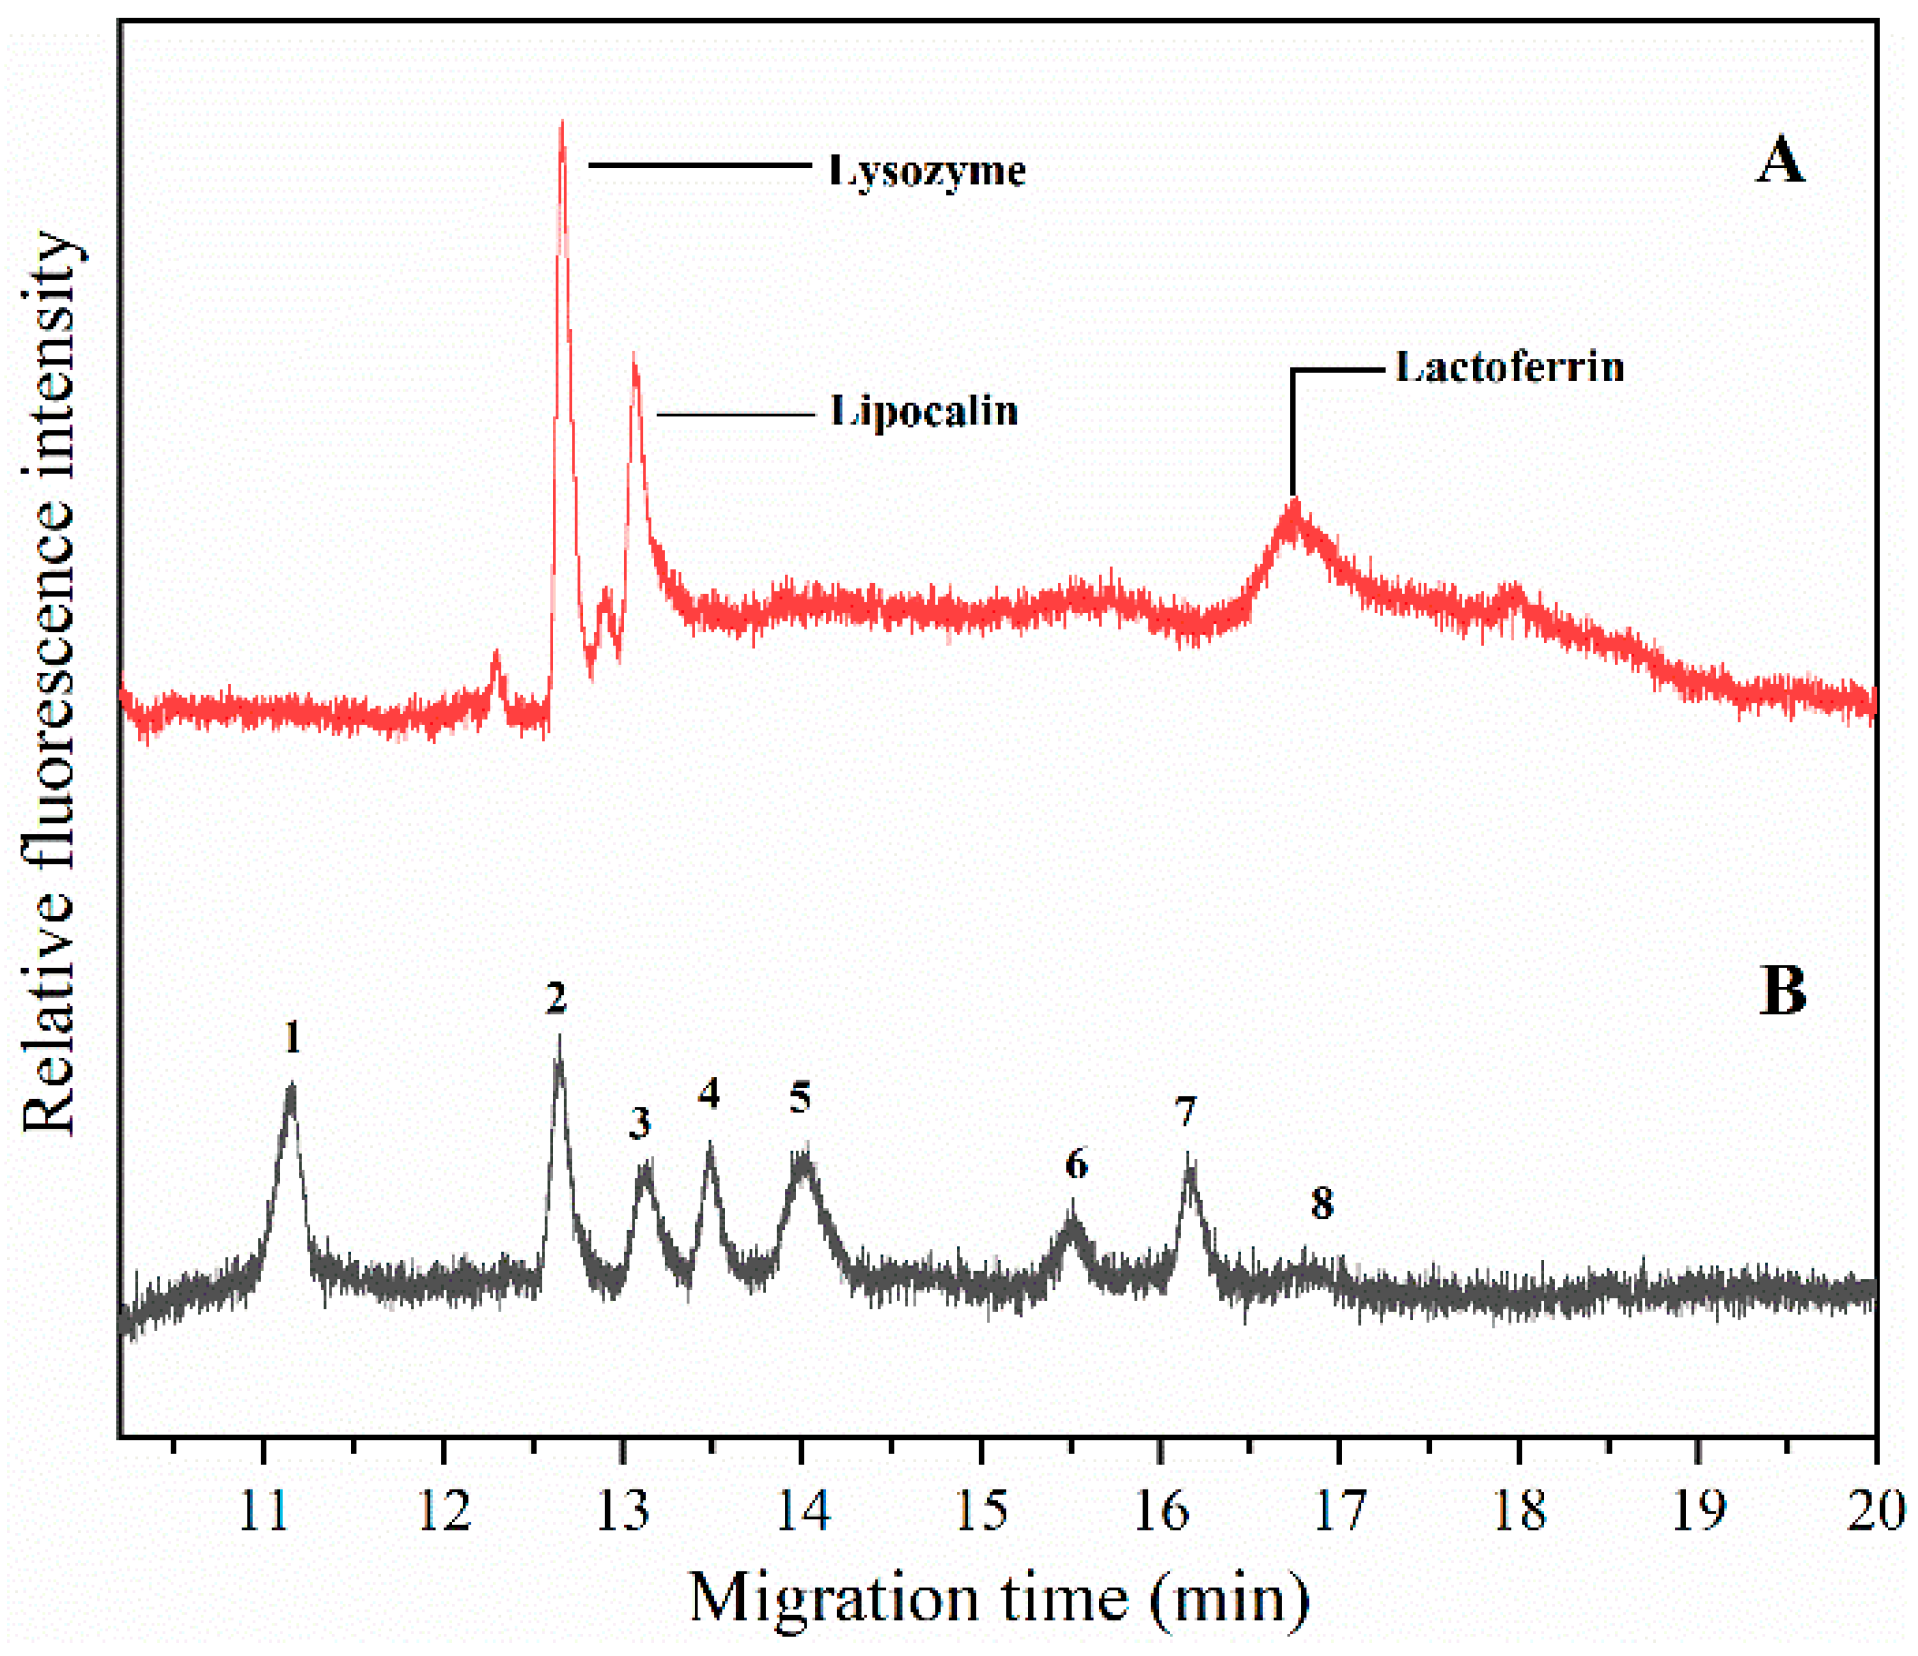
3.5. Application of Mixed Polymer for Separation of Proteins in Tears

The level of tear lipocalin in patients with meibomian gland dysfunction was examined and these data were correlated with the severity of their clinical disorder; also, a low level of lactoferrin means keratitis sicca [29,30]. To validate the practicability of the method, we analyzed the proteins from human tears in mixed polymer based on the optimized electrophoretic conditions (Figure 4). The tears collected from a volunteer were added into 1× Tris/Glycine/SDS buffer containing 5 mM DTT, and the mixture was denatured at 95 °C for 5 min. The electrophoresis was carried out with 100 V/cm electric field strength in 1.4% (m/v) HEC (250,000/1,300,000). According to the protein markers resolved under the same electrophoretic conditions, the migration time of the first peak (Figure 4A) is close to that of lysozyme (Mr, 14.3 kDa) (Figure 4B), and the second peak is near that of trypsin inhibitor (20.1 kDa). The last peak is between that of phosphorylase B (97.2 kDa) and β-galactosidase (116.0 kDa). Therefore, we supposed that those peaks were corresponding to lysozyme (Mr, 14.3–15.0 kDa), lipocalin (Mr, 18.1–19.9 kDa), and lactoferrin (Mr, 93.7–99.3 kDa) in human tears. The volume of different proteins in tears reveal the different medical disorders. The successful separation of proteins from human tears in the mixed HEC polymer is beneficial to eye disease diagnosis.

4. Conclusions

In summary, we have investigated the effect of the molecular mass of HEC on the capillary electrophoretic separation of proteins sized from 6.5 kDa to 200 kDa. Our experiments showed that the Mr of the sieving polymer played a nonignorable role in CE. In a certain concentration of HEC, the proteins migrated slower and exhibited better resolution in polymer with higher Mr. One mixed solution of HEC (1,300,000/250,000) offered better separation performance than 1,300,000/720,000, 1,300,000/90,000 mixed solutions. The resolution was improved if the electric field was reduced and the concentration of the mixed polymer was increased. Research has demonstrated that it is quite sensitive in detecting the biomarkers by CE with fluorescent dye. Although we have also successfully separated the proteins in human tears based on the optimal mixed polymer solutions, the relationship between the volume of those proteins and the severity of the corresponding eye disease still needs to be further studied, and such work is still under way in our lab.

Supplementary Materials

The following supporting information can be downloaded at: https://www.mdpi.com/article/10.3390/separations9100284/s1, Figure S1: (A) The migration times of proteins separation in HEC (1,300,000) solution with concentrations varied from 1.0% (m/v) to 1.4% (m/v). (B) The migration times of proteins separation in HEC solution with different relative molecular masses (90,000, 250,000, 720,000, 1,300,000). Experimental conditions: the samples were loaded at 100 V/cm (90 s); the electric field strength was 100 V/cm. The total length and the effective length of the capillary are 15.0 cm and 12.0 cm, respectively. The peaks were characterized as follows: 1. lysozyme (14.3 kDa), 2. trypsin inhibitor (20.1 kDa), 3. carbonic anhydrase (29.0 kDa), 4. ovalbumin (44.3 kDa), 5. serum albumin (66.4 kDa), 6. phosphorylase B (97.2 kDa), and 7. β-galactosidase (116.0 kDa).

Author Contributions

Z.L. and Y.Y. designed the research. J.H., E.M. and Q.Y. finished the data collection. J.H. and C.T. drafted the manuscript. D.Z. and W.X. helped in writing and analyzing the results. Y.Y. and Z.L. revised the draft and contributed new reagents and analytic tools. All authors have read and agreed to the published version of the manuscript.

Funding

This work was supported by Science and Technology Commission of Shanghai Municipality, China (No.19ZR1477500), the National Natural Science Foundation of China (No.81830052) and Construction project of Shanghai Key Laboratory of Molecular Imaging (18DZ2260400). We also gratefully acknowledge financial support from University of Shanghai for Science and Technology (No.2017KJFZ049).

Institutional Review Board Statement

Not applicable.

Informed Consent Statement

Not applicable.

Data Availability Statement

All data related to the manuscript are available in the manuscript and the Supplementary Material.

Conflicts of Interest

The authors declare no conflict of interest.

References

  1. Chrostek, L.; Gindzienska-Sieskiewicz, E.; Gruszewska, E.; Kowal-Bielecka, O.; Cylwik, B. Transferrin isoforms analysis by capillary electrophoresis in systemic lupus erythematosus and systemic sclerosis. Scand. J. Clin. Lab. Investig. 2020, 80, 567–570. [Google Scholar] [CrossRef] [PubMed]
  2. Michalcova, L.; Nevidalova, H.; Glatz, Z. Toward an automated workflow for the study of plasma protein-drug interactions based on capillary electrophoresis-frontal analysis combined with in-capillary mixing of interacting partners. J. Chromatogr. A 2021, 1635, 461734. [Google Scholar] [CrossRef]
  3. Zajec, M.; Jacobs, J.F.M.; de Kat Angelino, C.M.; Dekker, L.J.M.; Stingl, C.; Luider, T.M.; De Rijke, Y.B.; VanDuijn, M.M. Integrating Serum Protein Electrophoresis with Mass Spectrometry, A New Workflow for M-Protein Detection and Quantification. J. Proteome Res. 2020, 19, 2845–2853. [Google Scholar] [CrossRef]
  4. Li, W.; Peng, M.; Pan, Y.; Wu, Y.; Long, M.; Lei, L. Online Column Extraction Coupled with Double-Trap Column System for HPLC Determination of Valproic Acid in Human Plasma Without Derivatization. Chromatographia 2021, 84, 1049–1056. [Google Scholar] [CrossRef]
  5. Avataneo, V.; Antonucci, M.; De Vivo, E.D.; Briozzo, A.; Cusato, J.; Bermond, F.; Vitale, C.; Vitale, F.; Manca, A.; Palermiti, A. Validation and Clinical Application of a New Liquid Chromatography Coupled to Mass Spectrometry (HPLC-MS) Method for Dalbavancin Quantification in Human Plasma. Separations 2021, 8, 189. [Google Scholar] [CrossRef]
  6. Zomer, S.; Guillo, C.; Brereton, R.G.; Hanna-Brown, M. Toxicological classification of urine samples using pattern recognition techniques and capillary electrophoresis. Anal. Bioanal. Chem. 2004, 378, 2008–2020. [Google Scholar] [CrossRef] [PubMed]
  7. Ahmadian, E.; Eftekhari, A.; Babaei, H.; Nayebi, A.M.; Eghbal, M.A. Anti-Cancer Effects of Citalopram on Hepatocellular Carcinoma Cells Occur via Cytochrome C Release and the Activation of NF-kB. Anticancer Agents Med. Chem. 2017, 17, 1570–1577. [Google Scholar] [CrossRef] [PubMed]
  8. Dawod, M.; Arvin, N.E.; Kennedy, R.T. Recent advances in protein analysis by capillary and microchip electrophoresis. Analyst 2017, 142, 1847–1866. [Google Scholar] [CrossRef] [Green Version]
  9. Štěpánová, S.; Kašička, V. Recent developments and applications of capillary and microchip electrophoresis in proteomics and peptidomics (2015–mid 2018). J. Sep. Ence 2018, 42, 398–414. [Google Scholar] [CrossRef] [Green Version]
  10. Štěpánová, S.; Kašička, V. Applications of capillary electromigration methods for separation and analysis of proteins (2017–mid 2021)—A review. Anal. Chim. Acta 2022, 1209, 339447. [Google Scholar] [CrossRef]
  11. Meyer, S.; Clases, D.; Vega, R.; Padula, M.P.; Doble, P.A. Separation of intact proteins by capillary electrophoresis. Analyst 2022, 147, 2988–2996. [Google Scholar] [CrossRef] [PubMed]
  12. Leclercq, L.; Renard, C.; Martin, M.; Cottet, H. Quantification of Adsorption and Optimization of Separation of Proteins in Capillary Electrophoresis. Anal. Chem. 2020, 92, 10743–10750. [Google Scholar] [CrossRef] [PubMed]
  13. Sumitomo, K.; Mayumi, K.; Yokoyama, H.; Sakai, Y.; Minamikawa, H.; Masuda, M.; Shimizu, T.; Ito, K.; Yamaguchi, Y. Dynamic light-scattering measurement of sieving polymer solutions for protein separation on SDS CE. Electrophoresis 2009, 30, 3607–3612. [Google Scholar] [CrossRef] [PubMed]
  14. Deyanova, E.G.; Huang, R.Y.; Madia, P.A.; Nandi, P.; Gudmundsson, O.; Chen, G. Rapid fingerprinting of a highly glycosylated fusion protein by microfluidic chip-based capillary electrophoresis-mass spectrometry. Electrophoresis 2021, 42, 460–464. [Google Scholar] [CrossRef]
  15. Zhang, Y.; Kang, S.; Lin, H.; Chen, M.; Li, Y.; Cui, L.; Fan, Y.; Wang, B.; Wang, Y.; Yang, Z. Regulation of zeolite-derived upconversion photocatalytic system for near infrared light/ultrasound dual-triggered multimodal melanoma therapy under a boosted hypoxia relief tumor microenvironment via autophagy. Chem. Eng. J. 2022, 429, 132484. [Google Scholar] [CrossRef]
  16. Jiang, J.; Zhao, S.; Huang, Y.; Qin, G.; Ye, F. Highly sensitive immunoassay of carcinoembryonic antigen by capillary electrophoresis with gold nanoparticles amplified chemiluminescence detection. J. Chromatogr. A 2013, 1282, 161–166. [Google Scholar] [CrossRef] [PubMed]
  17. Heller, C. Principles of DNA separation with capillary electrophoresis. Electrophoresis 2001, 22, 629–643. [Google Scholar] [CrossRef]
  18. Durney, B.C.; Crihfield, C.L.; Holland, L.A. Capillary electrophoresis applied to DNA: Determining and harnessing sequence and structure to advance bioanalyses (2009-2014). Anal. Bioanal. Chem. 2015, 407, 6923–6938. [Google Scholar] [CrossRef] [Green Version]
  19. Guttman, A.; Filep, C.; Karger, B.L. Fundamentals of Capillary Electrophoretic Migration and Separation of SDS Proteins in Borate Cross-Linked Dextran Gels. Anal. Chem. 2021, 93, 9267–9276. [Google Scholar] [CrossRef]
  20. Gornushkin, I.B.; Amponsah-Manager, K.; Smith, B.W.; Omenetto, N.; Winefordner, J.D. Microchip laser-induced breakdown spectroscopy: A preliminary feasibility investigation. Appl. Spectrosc. 2004, 58, 762–769. [Google Scholar] [CrossRef]
  21. Huang, Y.F.; Hsieh, M.M.; Tseng, W.L.; Chang, H.T. On-line concentration of microheterogeneous proteins by capillary electrophoresis using SDS and PEO as additives. J. Proteome Res. 2006, 5, 429–436. [Google Scholar] [CrossRef] [PubMed]
  22. Tseng, W.L.; Lin, Y.W.; Chang, H.T. Improved separation of microheterogeneities and isoforms of proteins by capillary electrophoresis using segmental filling with SDS and PEO in the background electrolyte. Anal. Chem. 2002, 74, 4828–4834. [Google Scholar] [CrossRef] [PubMed]
  23. Wang, Z.; Wang, P.; Tao, C.; Zhang, D.; Li, Z.; Yamaguchi, Y. Capillary electrophoresis of DNA with high resolution based on copoly(pentaerythritoltetra succinimidylcarboxypentyl/aminopropyl polyoxyethylene) hydrogel. Anal. Chim. Acta 2021, 1178, 338811. [Google Scholar] [CrossRef] [PubMed]
  24. Dung, L.T.K.; Du, B.D. Low molecular weight of hydroxyethyl cellulose to extract proteins in natural rubber latex. Vietnam J. Sci. Technol. 2021, 59, 552–559. [Google Scholar] [CrossRef]
  25. Kan, C.W.; Doherty, E.A.; Buchholz, B.A.; Barron, A.E. Thermoresponsive N,N-dialkylacrylamide copolymer blends as DNA sieving matrices with a thermally tunable mesh size. Electrophoresis 2004, 25, 1007–1015. [Google Scholar] [CrossRef]
  26. Li, Z.; Ju, R.; Sekine, S.; Zhang, D.; Zhuang, S.; Yamaguchi, Y. All-in-one microfluidic device for on-site diagnosis of pathogens based on an integrated continuous flow PCR and electrophoresis biochip. Lab. Chip. 2019, 19, 2663–2668. [Google Scholar] [CrossRef]
  27. Li, Z.; Yang, R.; Wang, Q.; Zhang, D.; Zhuang, S.; Yamaguchi, Y. Electrophoresis of periodontal pathogens in poly(ethyleneoxide) solutions with uncoated capillary. Anal. Biochem. 2015, 471, 70–72. [Google Scholar] [CrossRef]
  28. Zhu, Y.; Li, Z.; Wang, P.; Shen, L.; Zhang, D.; Yamaguchi, Y. Factors affecting the separation performance of proteins in capillary electrophoresis. J. Chromatogr. B 2018, 1083, 63–67. [Google Scholar] [CrossRef]
  29. Yamada, M.; Mochizuki, H.; Kawai, M.; Tsubota, K.; Bryce, T.J. Decreased tear lipocalin concentration in patients with meibomian gland dysfunction. Br. J. Ophthalmol. 2005, 89, 803–805. [Google Scholar] [CrossRef] [Green Version]
  30. Glasgow, B.J.; Abduragimov, A.R. Lipocalin-1 is the acceptor protein for phospholipid transfer protein in tears. Biochem. Biophys. Res. Commun. 2021, 548, 35–38. [Google Scholar] [CrossRef]
Figure 1. (A) The electropherogram of proteins separation in HEC (1,300,000) mixed with other Mr of HEC; (B) The migration times varied with the mixed solution. Experimental conditions: the samples were loaded at 100 V/cm (90 s); the electric field strength was 100 V/cm. The total length and the effective length of the capillary are 15.0 cm and 12.0 cm, respectively. The solutions were mixed with a ratio of 5/5. The peaks were characterized as follows: 1. lysozyme (14.3 kDa), 2. trypsin inhibitor (20.1 kDa), 3. carbonic anhydrase (29.0 kDa), 4. ovalbumin (44.3 kDa), 5. serum albumin (66.4 kDa), 6. phosphorylase B (97.2 kDa), and 7. β-galactosidase (116.0 kDa).
Separations 09 00284 g001
Figure 2. (A) The electropherogram of proteins separation in mixed HEC (1,300,000/250,000) solution with different ratios; (B) The mobility varied with the protein size in the mixed solution. Other electrophoretic conditions were the same as those in Figure 1. The peaks were characterized as follows: 1. Lysozyme (14.3 kDa), 2. Trypsin inhibitor (20.1 kDa), 3. Carbonic anhydrase (29.0 kDa), 4. Ovalbumin (44.3 kDa), 5. Serum albumin (66.4 kDa), 6. Phosphorylase B (97.2 kDa), 7. Β-galactosidase (116.0 kDa), and 8. Myosin (200 kDa).
Separations 09 00284 g002
Figure 3. (A) The resolution for the adjacent proteins at mixed HEC (1,300,000/250,000) solution with concentrations varying from 0.5% (m/v) to 1.4% (m/v). (B) The electropherogram of proteins when they were separated at electric field strength varied from 50 V/cm to 150 V/cm. The ratio of the two HEC polymers was 5/5, and other electrophoretic conditions were the same as in Figure 1.
Separations 09 00284 g003
Figure 4. The electropherogram of (A) tear proteins and (B) protein markers in 1.4% (m/v) mixed HEC (1,300,000/250,000), the ratio of the two HEC polymers was 5/5, and other electrophoretic conditions were the same as in Figure 1. The peaks in Figure 4B were characterized as follows: 1. aprotinin bovine pancreas (6.5 kDa), 2. lysozyme (14.3 kDa), 3. trypsin inhibitor (20.1 kDa), 4. carbonic anhydrase (29.0 kDa), 5. ovalbumin (44.3 kDa), 6. serum albumin (66.4 kDa), 7. phos-phorylase B (97.2 kDa), and 8. β-galactosidase (116.0 kDa).
Separations 09 00284 g004
Publisher’s Note: MDPI stays neutral with regard to jurisdictional claims in published maps and institutional affiliations.

