Article

Mean Centered Kinetic—Spectrophotometric Data—Continuous Wavelet Transform for Simultaneous Determination of Dopamine and Uric Acid in Presence of Ascorbic Acid at Biological Samples

by
Maryam Abbasi Tarighat
1,*,
Zahara Keshavarz
1,
Gholamreza Abdi
2 and
Charalampos Proestos
3,*
1
Faculty of Nano and Bio Science and Technology, Persian Gulf University, Bushehr 75169, Iran
2
Department of Biotechnology, Persian Gulf Research Institute, Persian Gulf University, Bushehr 7516, Iran
3
Food Chemistry Laboratory, Department of Chemistry, National and Kapodistrian University of Athens, Panepistimiopolis Zographou, 15771 Athens, Greece
*
Authors to whom correspondence should be addressed.
Separations 2022, 9(10), 282; https://doi.org/10.3390/separations9100282
Submission received: 18 August 2022 / Revised: 23 September 2022 / Accepted: 29 September 2022 / Published: 3 October 2022
(This article belongs to the Special Issue Novel Applications of Separation Technology)

Abstract

:
In the present study, a rapid, practical, selective and sensitive method was proposed for simultaneous determination of dopamine (DA) and uric acid (UA). Kinetic profiles of analytes were recorded and transformed by different mother wavelets. The contribution of ascorbic acid was neglected using mean centering of data before transformation. The concentrations range were 1.0–60.0 μmol L−1 and 7–40.0 μmol L−1, with detection limit of 0.06 and 0.30 μmol L−1 for uric acid and dopamine, respectively. The results of sym8 and db4 mother wavelets showed that proposed method creates a most selective and sensitive determination without using initial separation steps. The obtained results by CWT-sym8 and CWT-db4 were compared with partial least squares (PLS) results. The simultaneous quantitation of DA and UA with the proposed method was successfully applied in different urine and serum samples.

1. Introduction

Dopamine, uric acid, and ascorbic acid co-exist in human body fluids (such as serum) and a change in their amounts significantly affects human health. It may cause problems in cardiovascular systems, nervous system, kidney and hormones. Simultaneous detection of DA, AA and UA is a very significant factor in biomedical chemistry and neurochemistry, pathological research and diagnostic studies [1]. DA is the main catecholamine neurotransmitter that displays a basic role in the action of the central nervous system of mammals. The low amounts of DA may lead to schizophrenia and Parkinson’s disease. the final purine metabolism product is UA. Unusual amount of UA causes diseases such as gout, hyperuricemia and Lesch-Nyan disease [2,3].
A significant problem in detecting DA is the low concentration of DA compared to biological molecules such as AA and UA in extracellular fluids, which makes it difficult to determine DA. Additionally, AA catalytic oxidation by oxidized DA is a further significant interference in DA detection and quantitation.
Among analytical methods, electrochemical methods have been mostly proposed for determination of DA, UA and AA species in several samples [2,4,5,6]. The electrochemical oxidation potential of these species is very close to each other at bare electrodes; hence they can interfere with each other’s determinations [7,8,9,10,11,12,13,14]. The nearness of oxidation potentials and accumulation of the oxidation products of them remains a challenging subject [15]. The accumulation product of them decreases reusability, selectivity and reproducibility of the electrode surface. Hence, different modified electrodes were created to separate the oxidation potential of species [8,9,10,11,12,13,14].
Additionally, HPLC methods [16] and fluorescent biosensors have been applied for the determination of targets [17,18,19]. Some of these methods were difficult to operate and use expensive instruments.
Spectrophotometric methods are simple, sensitive and suitable, and are techniques that report for analyte determination in various mixtures [20,21,22,23]. In many cases, there is a significant overlap between the spectral responses of two or more components in the mixture that it is impossible to analyze them with classical spectrophotometric methods.
In recent years, there has been much concern in spectrophotometric methods for multi-component determinations using chemometric approaches [24]. Spectrophotometry-chemical kinetics may be applicable when there is spectral overlap. Additionally, spectrophotometric studies of reaction kinetics coupled with chemometrics methods are powerful tools for simultaneous multi-component determination.
Chemometric methods are efficient ways for simultaneous multi-component determinations. Multivariate calibration methods such as principal component regression (PCR) [25], mean centering of ratio spectra, and partial least squares (PLS) [26] have been effectively performed for the processing of kinetic data. Additionally, artificial neural network (ANN) is applicable for simultaneous determinations [27].
The display of a signal using its transformed form is suitable for solving mentioned problems in different science. Wavelet transform (WT) is efficient and simultaneously provides time and frequency information and collects a time-frequency representation of the signals. So, the wavelets provide a new conception of a signal. WT is very effective for eliminating or reducing of baseline effect and noise of data, data compression, recognition and detection of latent transient information [24,28]. The combination of continuous wavelet transforms (CWT) and zero crossing technique has been adjusted for the simultaneous determination of different binary and ternary mixtures [29,30,31,32,33,34,35].
In addition to simultaneous quantitative determination of a multi-component mixtures [36,37], CWT has been used for periodic error compensation [38], electrochemical signals [39], spectrophotometric determination of drugs using high performance liquid chromatography [40], solvent effect on MRI probe and [41] sampling structures from molecular dynamics simulations [42]. This approach has the advantages of removing the Fourier transform restriction, increasing the signal-to-noise ratio in comparison to previous approaches, and reducing spectral interference.
This method’s drawback is that it first determines the wavelet family for these criteria, then zero points, before obtaining these conditions. As mentioned before, it is necessary to create practical, selective and sensitive methods for simultaneous determination of biological molecules not only for investigation of their physiological impact but also for diagnoses of several diseases. In the current work, the applicability of mean-centering coupled by CWT was suggested for kinetic quantitation of UA, and DA mixtures in presence of AA. As the AA signal did not change over the time, the contribution of AA was subtracted by mean centering technique and transformation of spectrophotometric kinetic profiles was performed after mean-centering. To the best of our knowledge, this is the first report on the applicability of mean-centered kinetic profile CWT to the simultaneous determination of overlapped signals of biological samples. The results show that the quality of the results obtained is not a function of overlapping spectral lines, and it is very interesting with respect to improving the sensitivity and selectivity for simultaneous determination of DA and UA with the co-existence of AA. The proposed method shows low detection limit, wide dynamic range and good selectivity with respect to other published works.

2. Materials and Method

2.1. Apparatus and Reagents

The pH of solutions was checked by a model 713 Metrohm pH-meter using combined glass electrode. Analytical Jena SPECORD250-22P16 UV−Vis double-beam spectrophotometer was applied for spectrophotometric measurements in the range of wavelength from 250–600 and bandwidth of 1.00 nm and average of three separate measurements. Quartz cells with 1 cm path length, slit of 0.5 nm, and scan speed of 100 nm s−1 at 25 °C were used.
The purchased chemicals from Sigma-Aldrich and Merck (Darmstadt, Germany) were used as received, without further purification. Stock solution of Cu(NO3)2 (0.01 mol L−1), 10-phenanthroline (0. 2 mol L−1 DA (0.1 mol L−1) and AA (0.1 mol L−1) was prepared in doubly distilled water (DW). UA (0.1 mol L−1) solution was prepared in a minimum volume of 0.1 M NaOH solution and then diluted to the mark with (DW). A buffer solution (0.5 mol L−1) of sodium acetate and acetic acid was prepared. KCl solution (0.01 mol L−1) was used for adjusting ionic strength of solutions.

2.2. Computational Software

Calculations were done by MATLAB software (version 7.8, MathWorks, Natick, MA, USA). Multivariate regressions were done in PLS-Toolbox.

2.3. General Procedure

The 0.5 mL, 0.30 mL and 1.0 mL of 10-phenanthroline, Cu2+ and buffer solution were carried into a 5.0 mL volumetric flask and diluted to the mark. After the addition of 2.0 mL of this solution to the spectrophotometric cell, appropriate amounts of AA, UA, and DA were also transferred. The absorbance was recorded as a function of time for 600 s at 320 nm against a reagent blank.

2.4. Preparation of Real Samples

All blood samples were collected from Bushehr Blood Transfusion Organization. After centrifugation and dilution of samples, the pH was adjusted to 4.5 using acetate buffer.
Urine samples were obtained from the Mehr diagnostic laboratory of Bushehr. Urine samples were filtered through a 0.45 μm Millipore filter. On 25 mL of urine sample, 10.0 mL of 1:1 H2O:HNO3 mixture was added and heated for 10 min. The sample was cooled and then the pH was adjusted to 4.5 using acetate buffer, and the analytes were determined according to the given procedure [43].

3. Result and Discussion

3.1. Preliminary Investigation

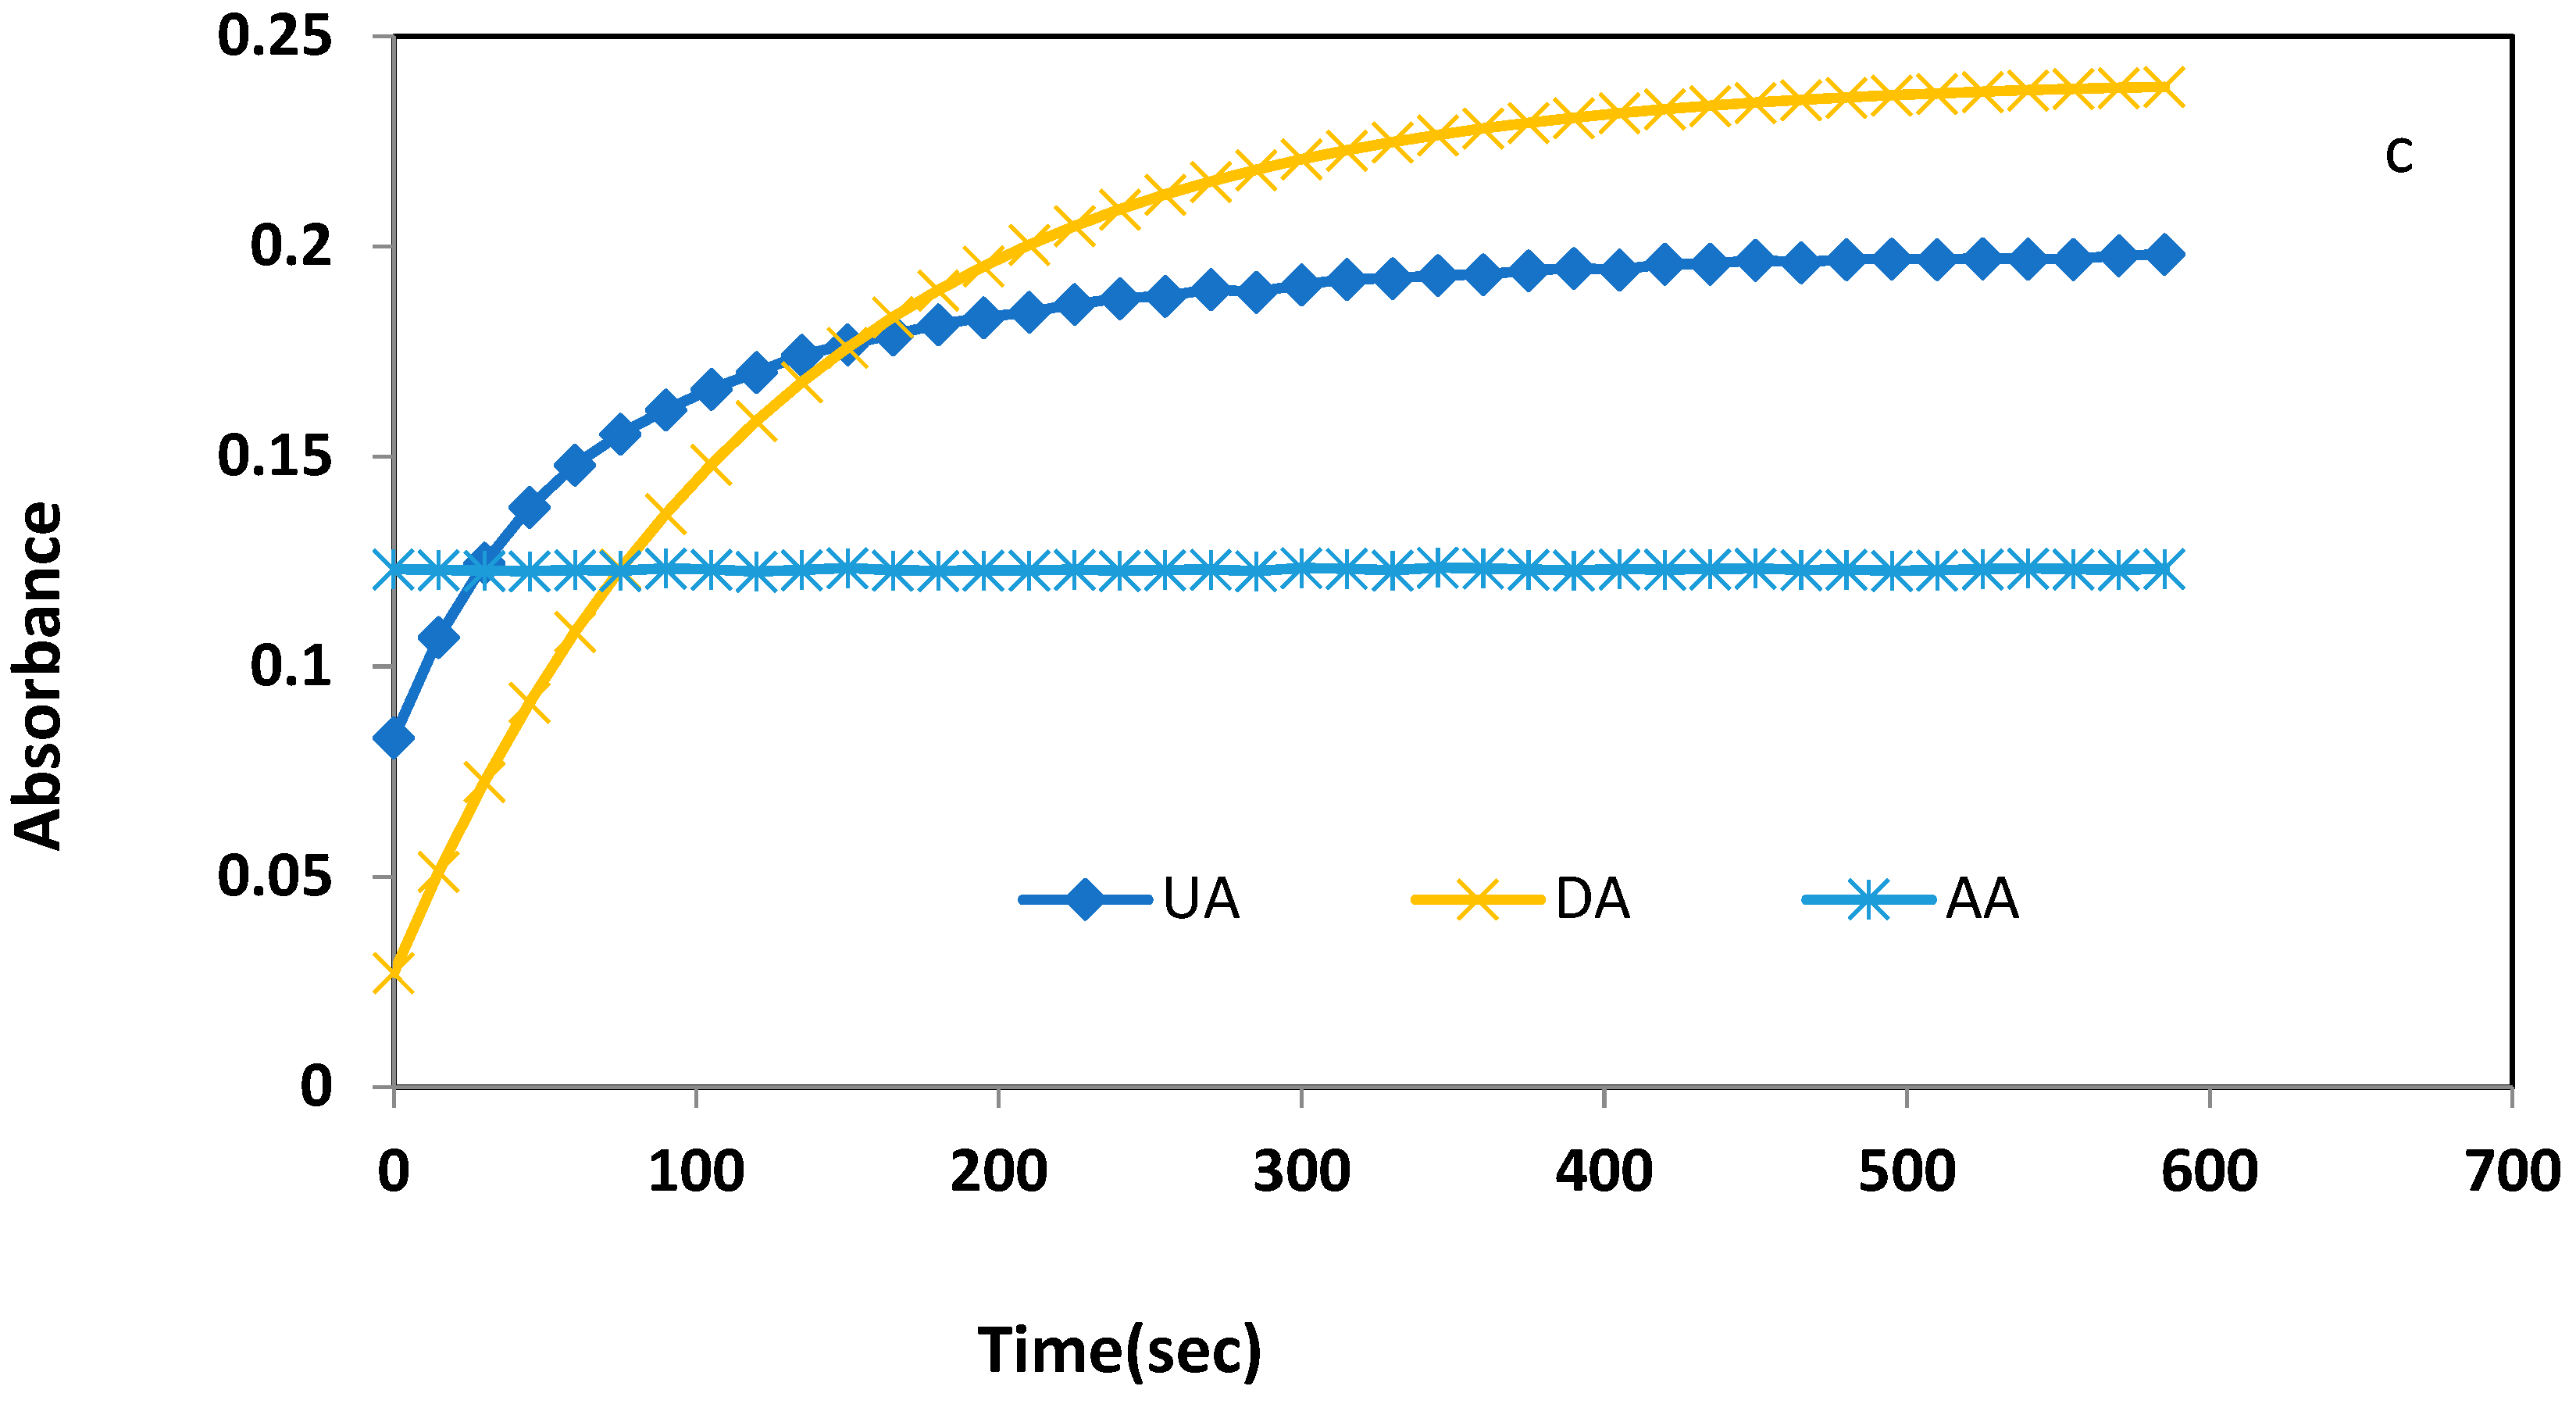
The spectral shape resulting from the complexes was very similar and showed maximum absorbance at 320 nm (Figure 1a,b). Hence, simultaneous determination of targets by conventional methodology is impossible. Studies showed that the reaction rates for the copper complexes with 1,10-phenanthroline in the presence of DA and UA are different (Figure 1c). However, the kinetic profile of AA remains constant over the time (Figure 1b). Thus, the differential kinetic rates should be beneficial for determination of the mixtures with the chemometric techniques. Therefore, in this study, the CWT method was proposed for simultaneous determination of DA and UA in the presence of AA as a selective and sensitive method.
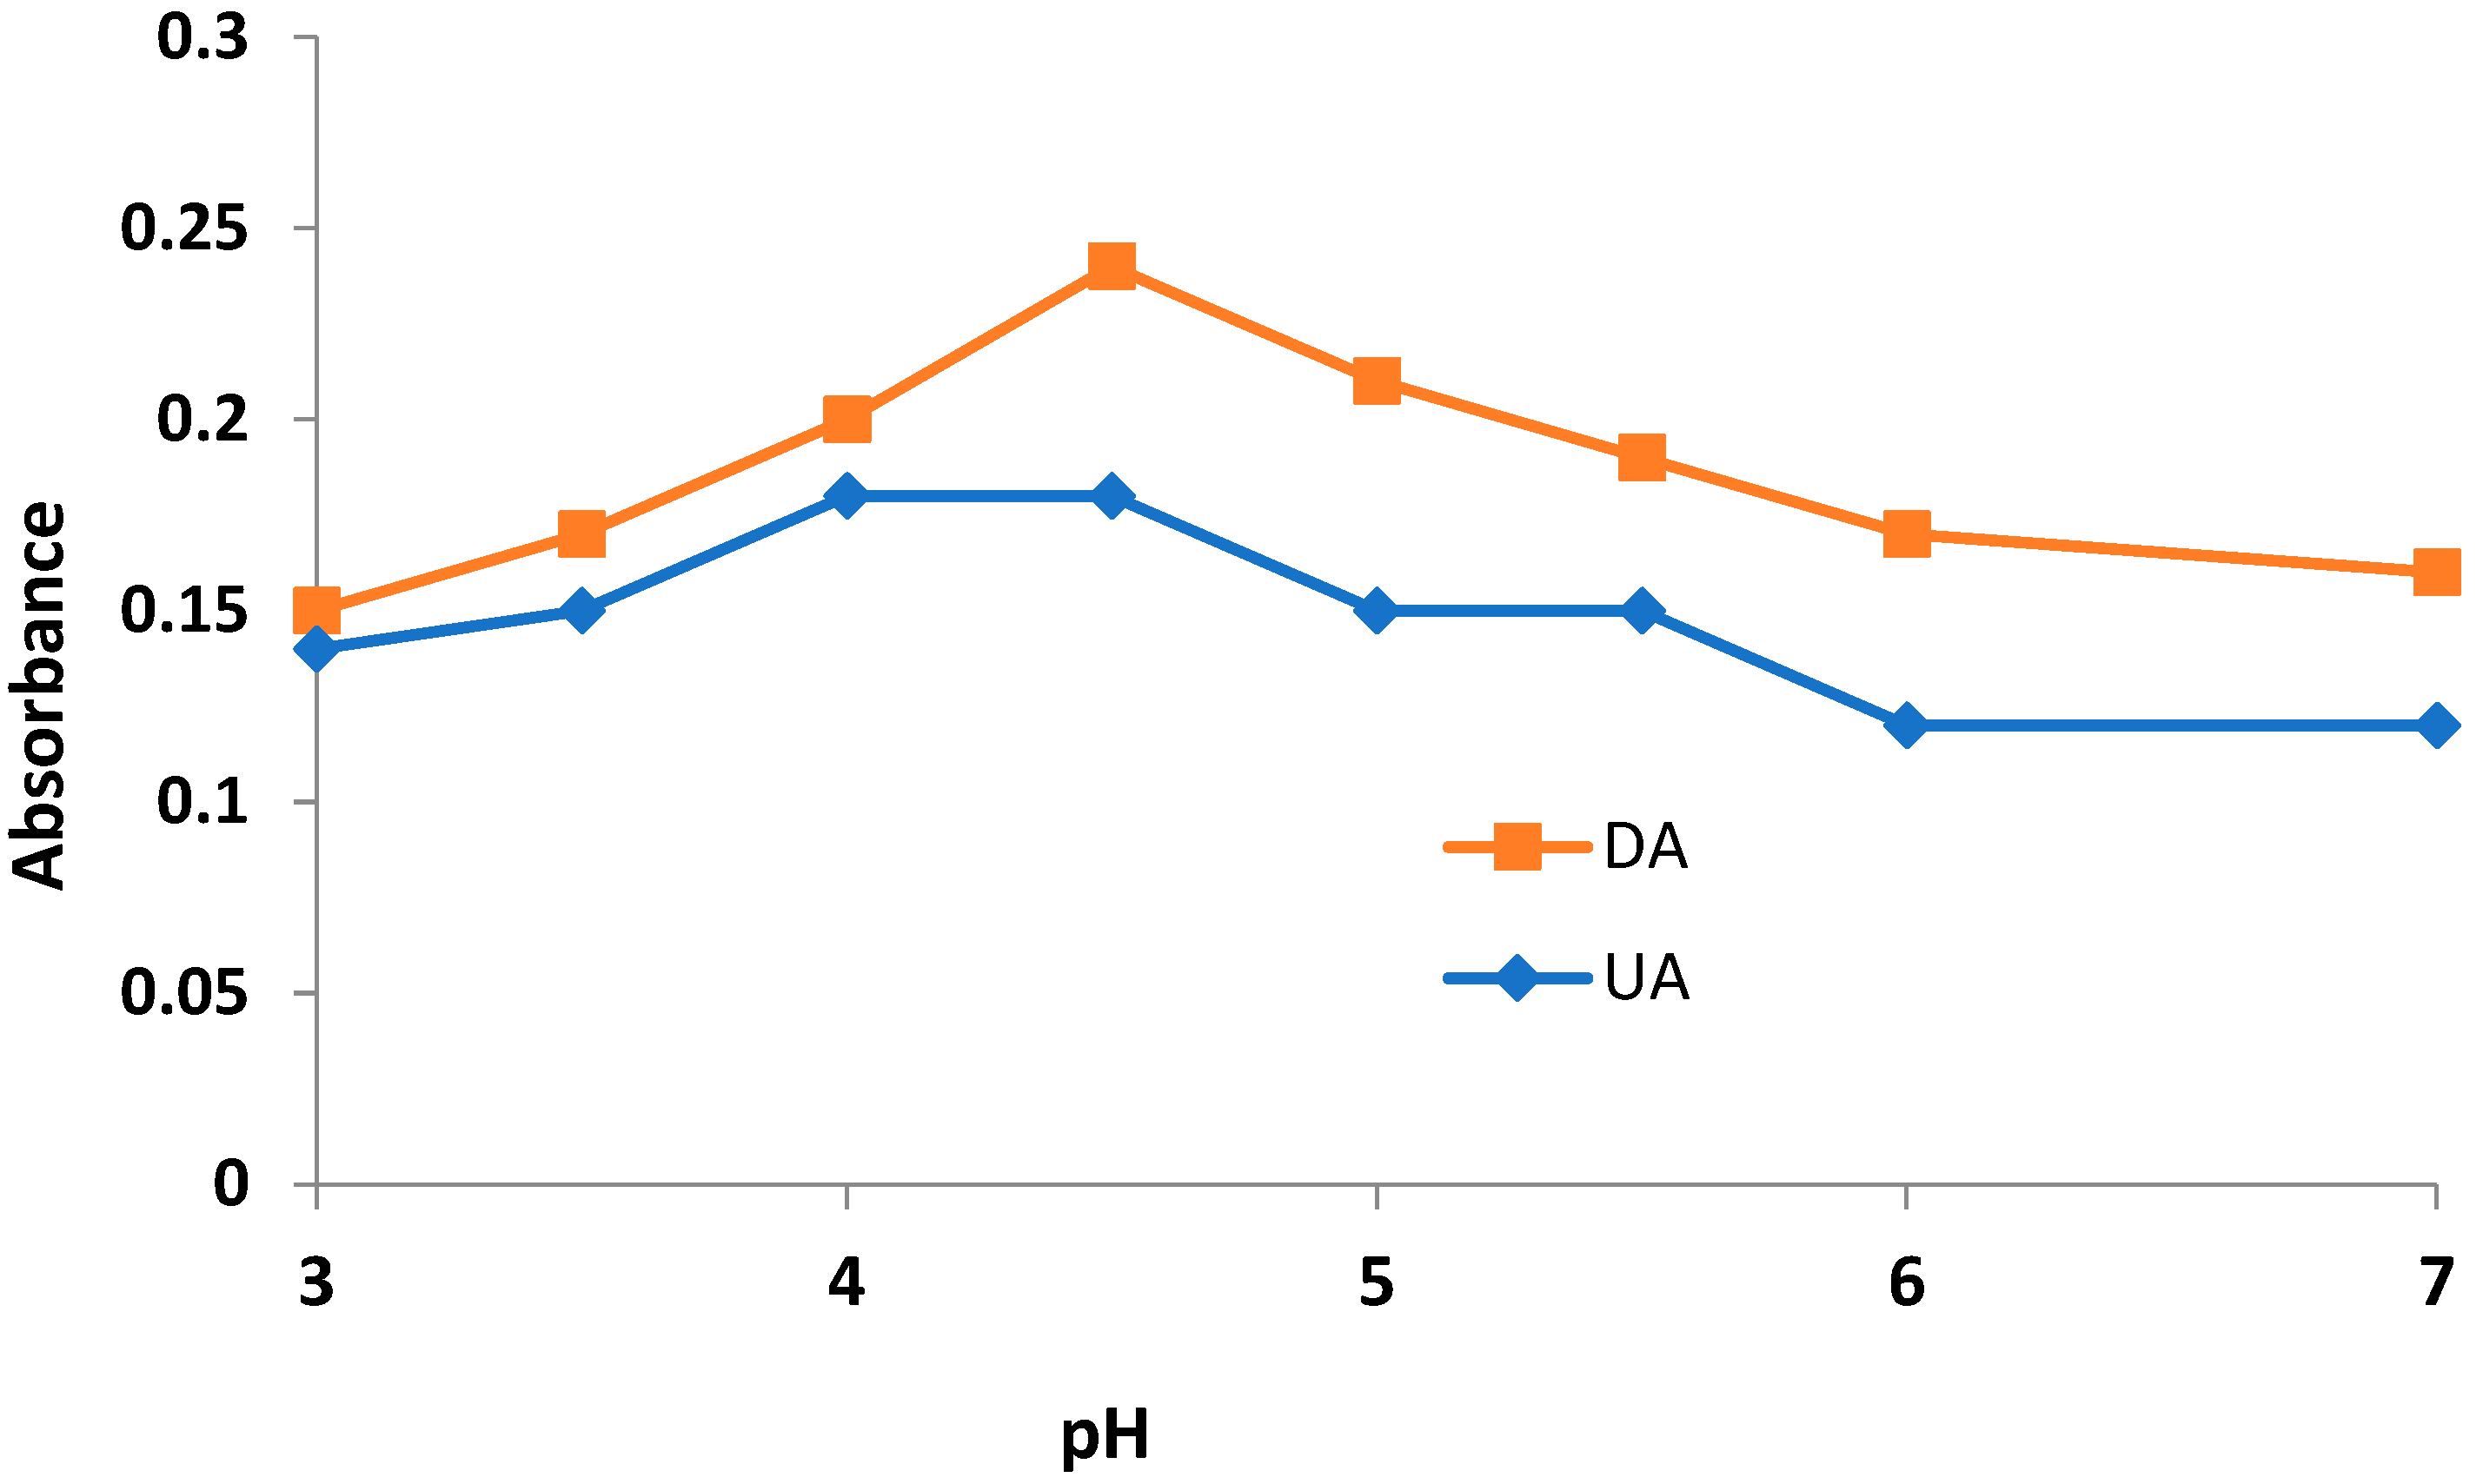
The pH studies were performed using sodium acetate–acetic acid for pHs 3.0–4.5 and disodium hydrogen phosphate-monosodium phosphate pHs for 5.0–7.0. The number of absorbance changes at different pHs at 320 nm over 600 s following the initiation of the reaction were monitored, and a plot of ΔAAtotal − ΔAblank) against pH was sketched. The results showed that at pH 4.5 the ΔA signal reached its maximum value (Figure 2).

3.2. Individual Calibration Graphs of UA and DA

Different concentrations of UA and DA were prepared, and measurements were carried out. The calibration curves were obtained. The obtained linear ranges, correlation coefficients, LODs and LOQs are presented at Table 1.

3.3. Chemometrics Analysis

Mean Centering of Data

Prior to multivariate analysis (e.g., principal components analysis (PCA or PLS), data pre-processing must be used to isolate the signal of interest from the interferences and noise signals. Pre-processing methods can improve the predictive ability of calibration models. Centering, autoscaling, pareto scaling, range scaling, vast scaling, log transformation, and power transformation, were proposed for preprocessing of different data sets [43]. The appropriate pre-processing method depends on quality of the data set and the method of analysis. Seasholtz and Kowalski (1992) reported that it is better to perform mean centering of data in the presence of baseline and closure in response data [44].
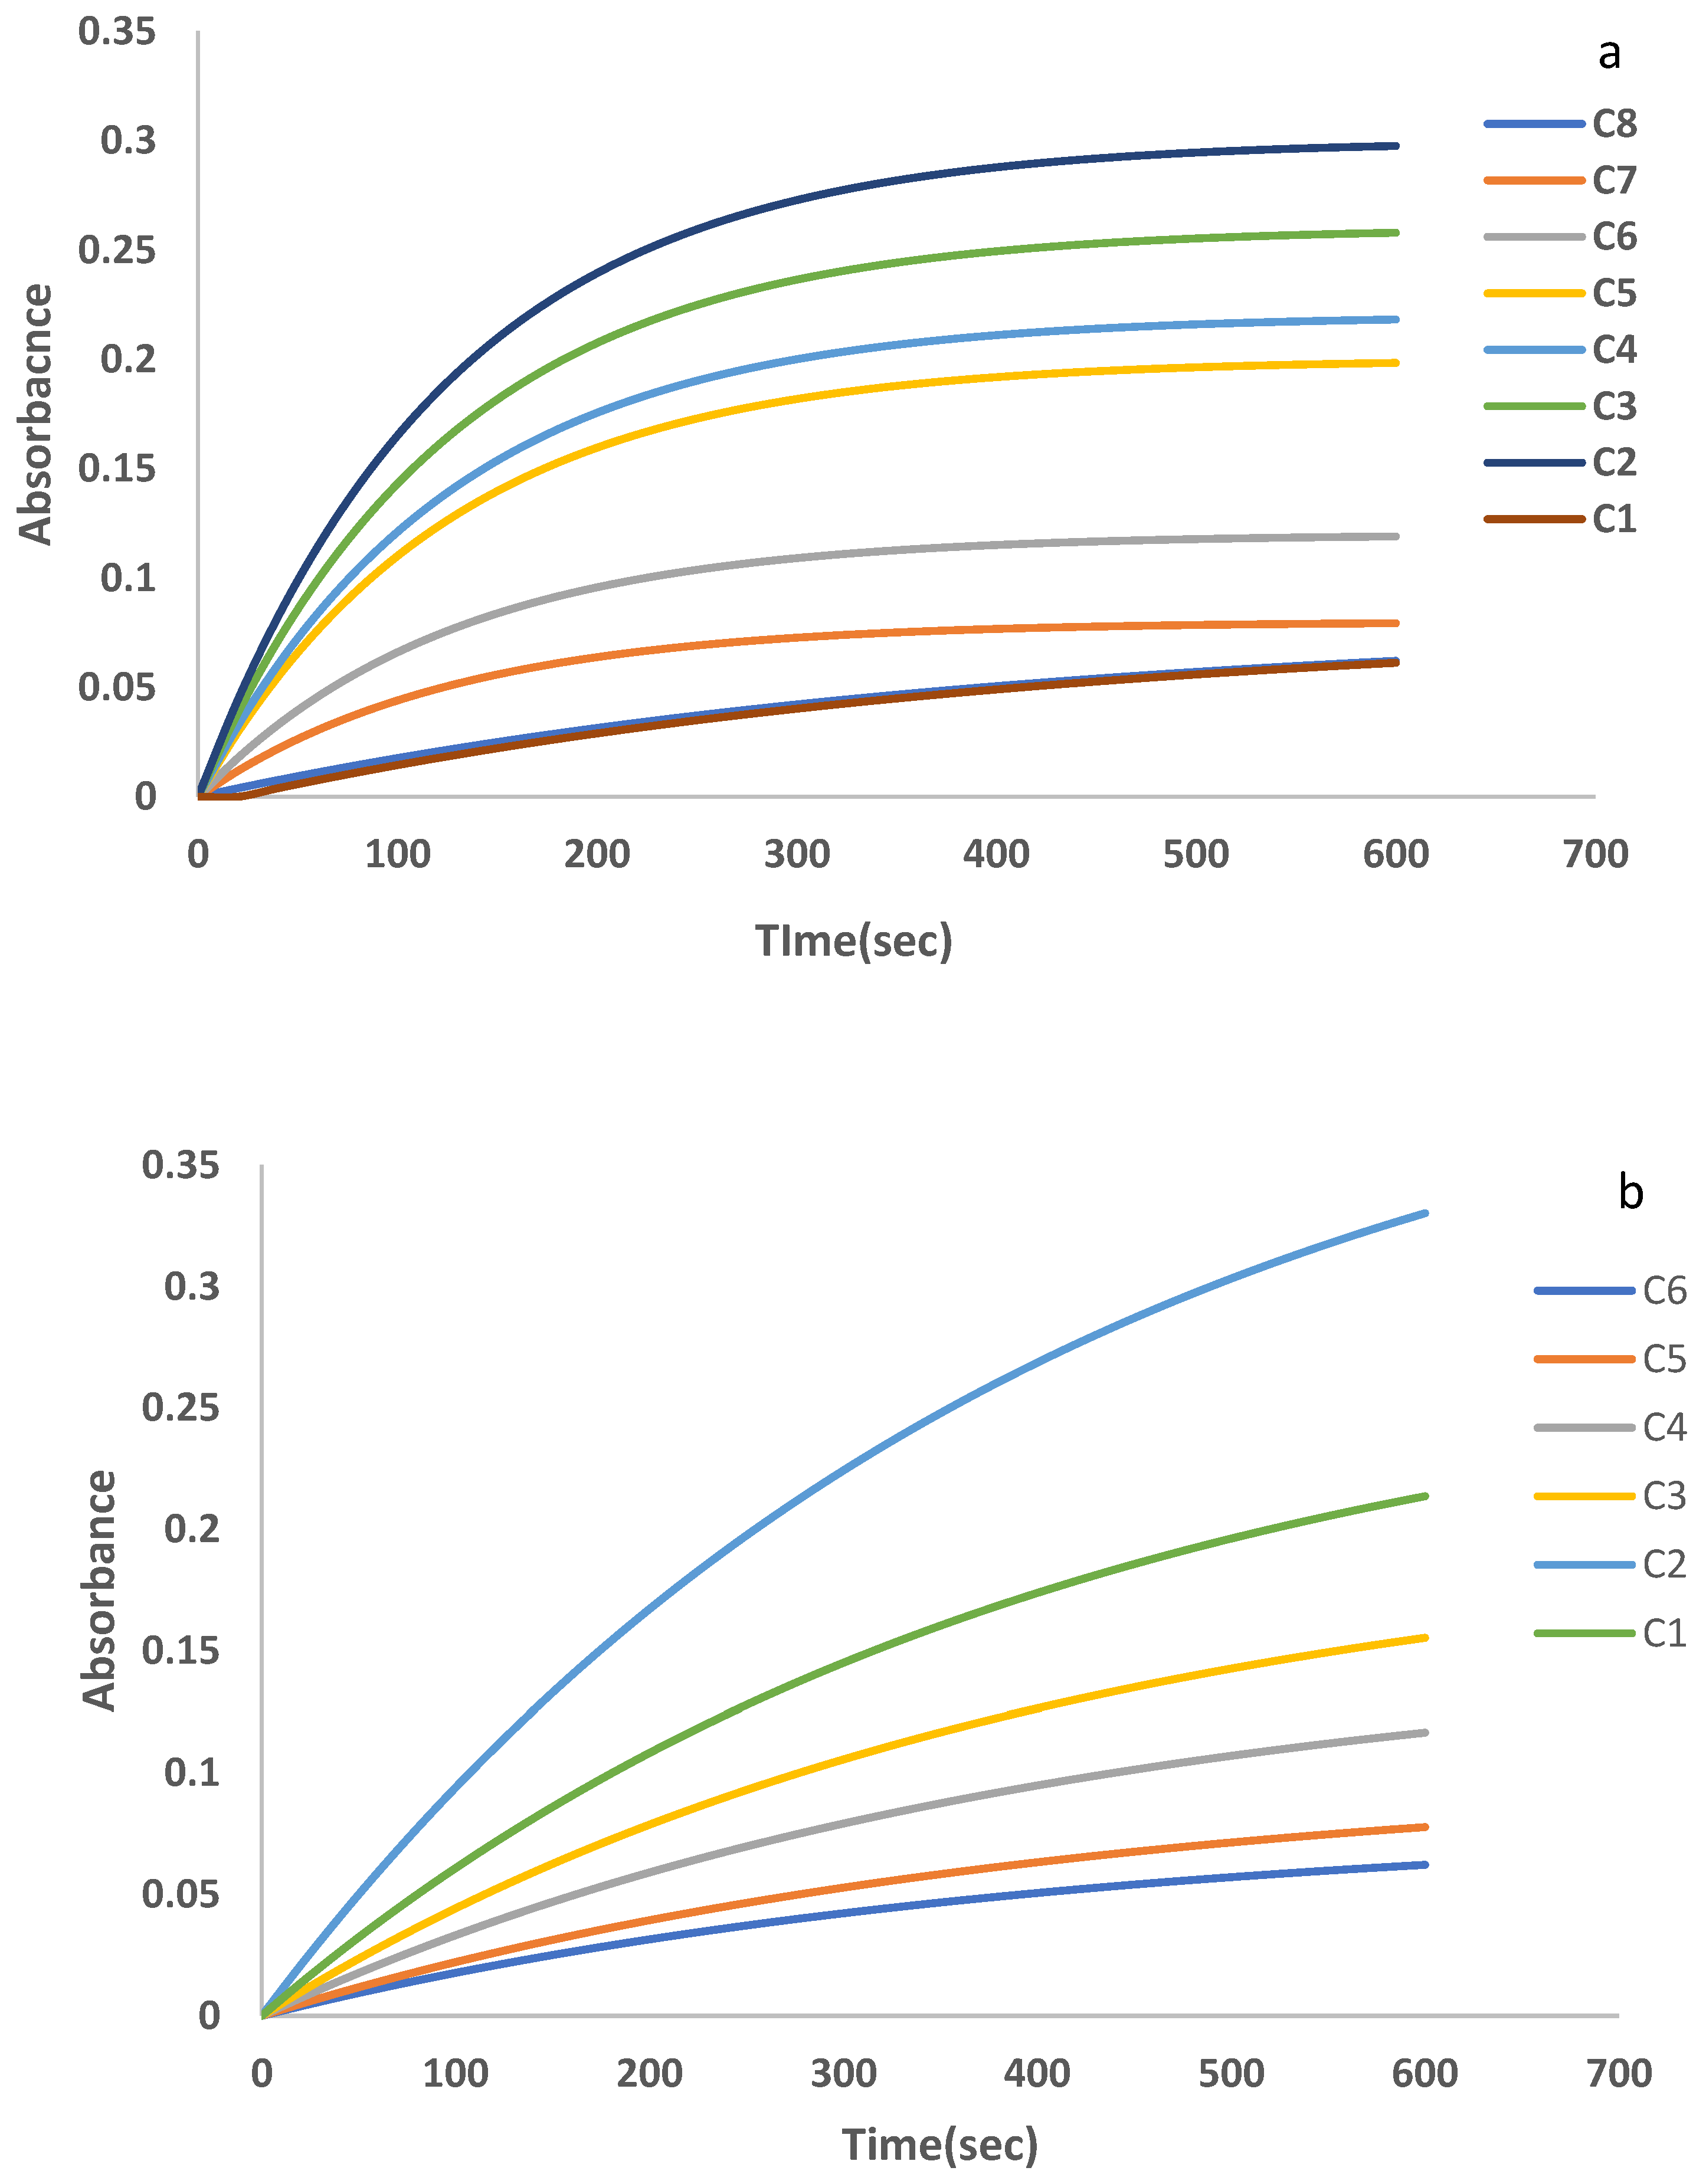
The kinetic profiles of samples with different concentrations of analytes in the presence of a constant amount of AA were recorded in the time range 0–600 s (Figure 3). The recorded profiles were transferred from EXCLE to MATLAB 7.1 domain. In order to compensate the signal of AA, mean centering of data was performed. Then mean centered data was applied for further analysis.

3.4. CWT Analysis

For CWT analysis, the selection of mother wavelet and decomposition (dilation) or scaling level are very important parameters. Therefore, various mother wavelets were applied and tested. The best mother wavelets were selected according to sensitivity of calibration graphs and selectivity of zero crossing points. Between different mother wavelet functions, the mother wavelets that could create distinct zero-crossing points for components were requested. For the mentioned reasons, Daubechies (Db) and Symlet (sym) were used for the transferring of signals. These two groups are known as orthogonal wavelet families. After selecting the mother wavelets, the scaling factor was examined. There is dependence between the number of zero-crossing points and scaling (dilation) factors. Large dilation values create fewer distinct zero-crossing points with high intensity, but large values of scaling factors create a large number of zero-crossing points with low intensity. The values of 25 and 30 were used as optimum scaling factors for sym8 and db4, respectively, and transformation of signals was carried out at these values.
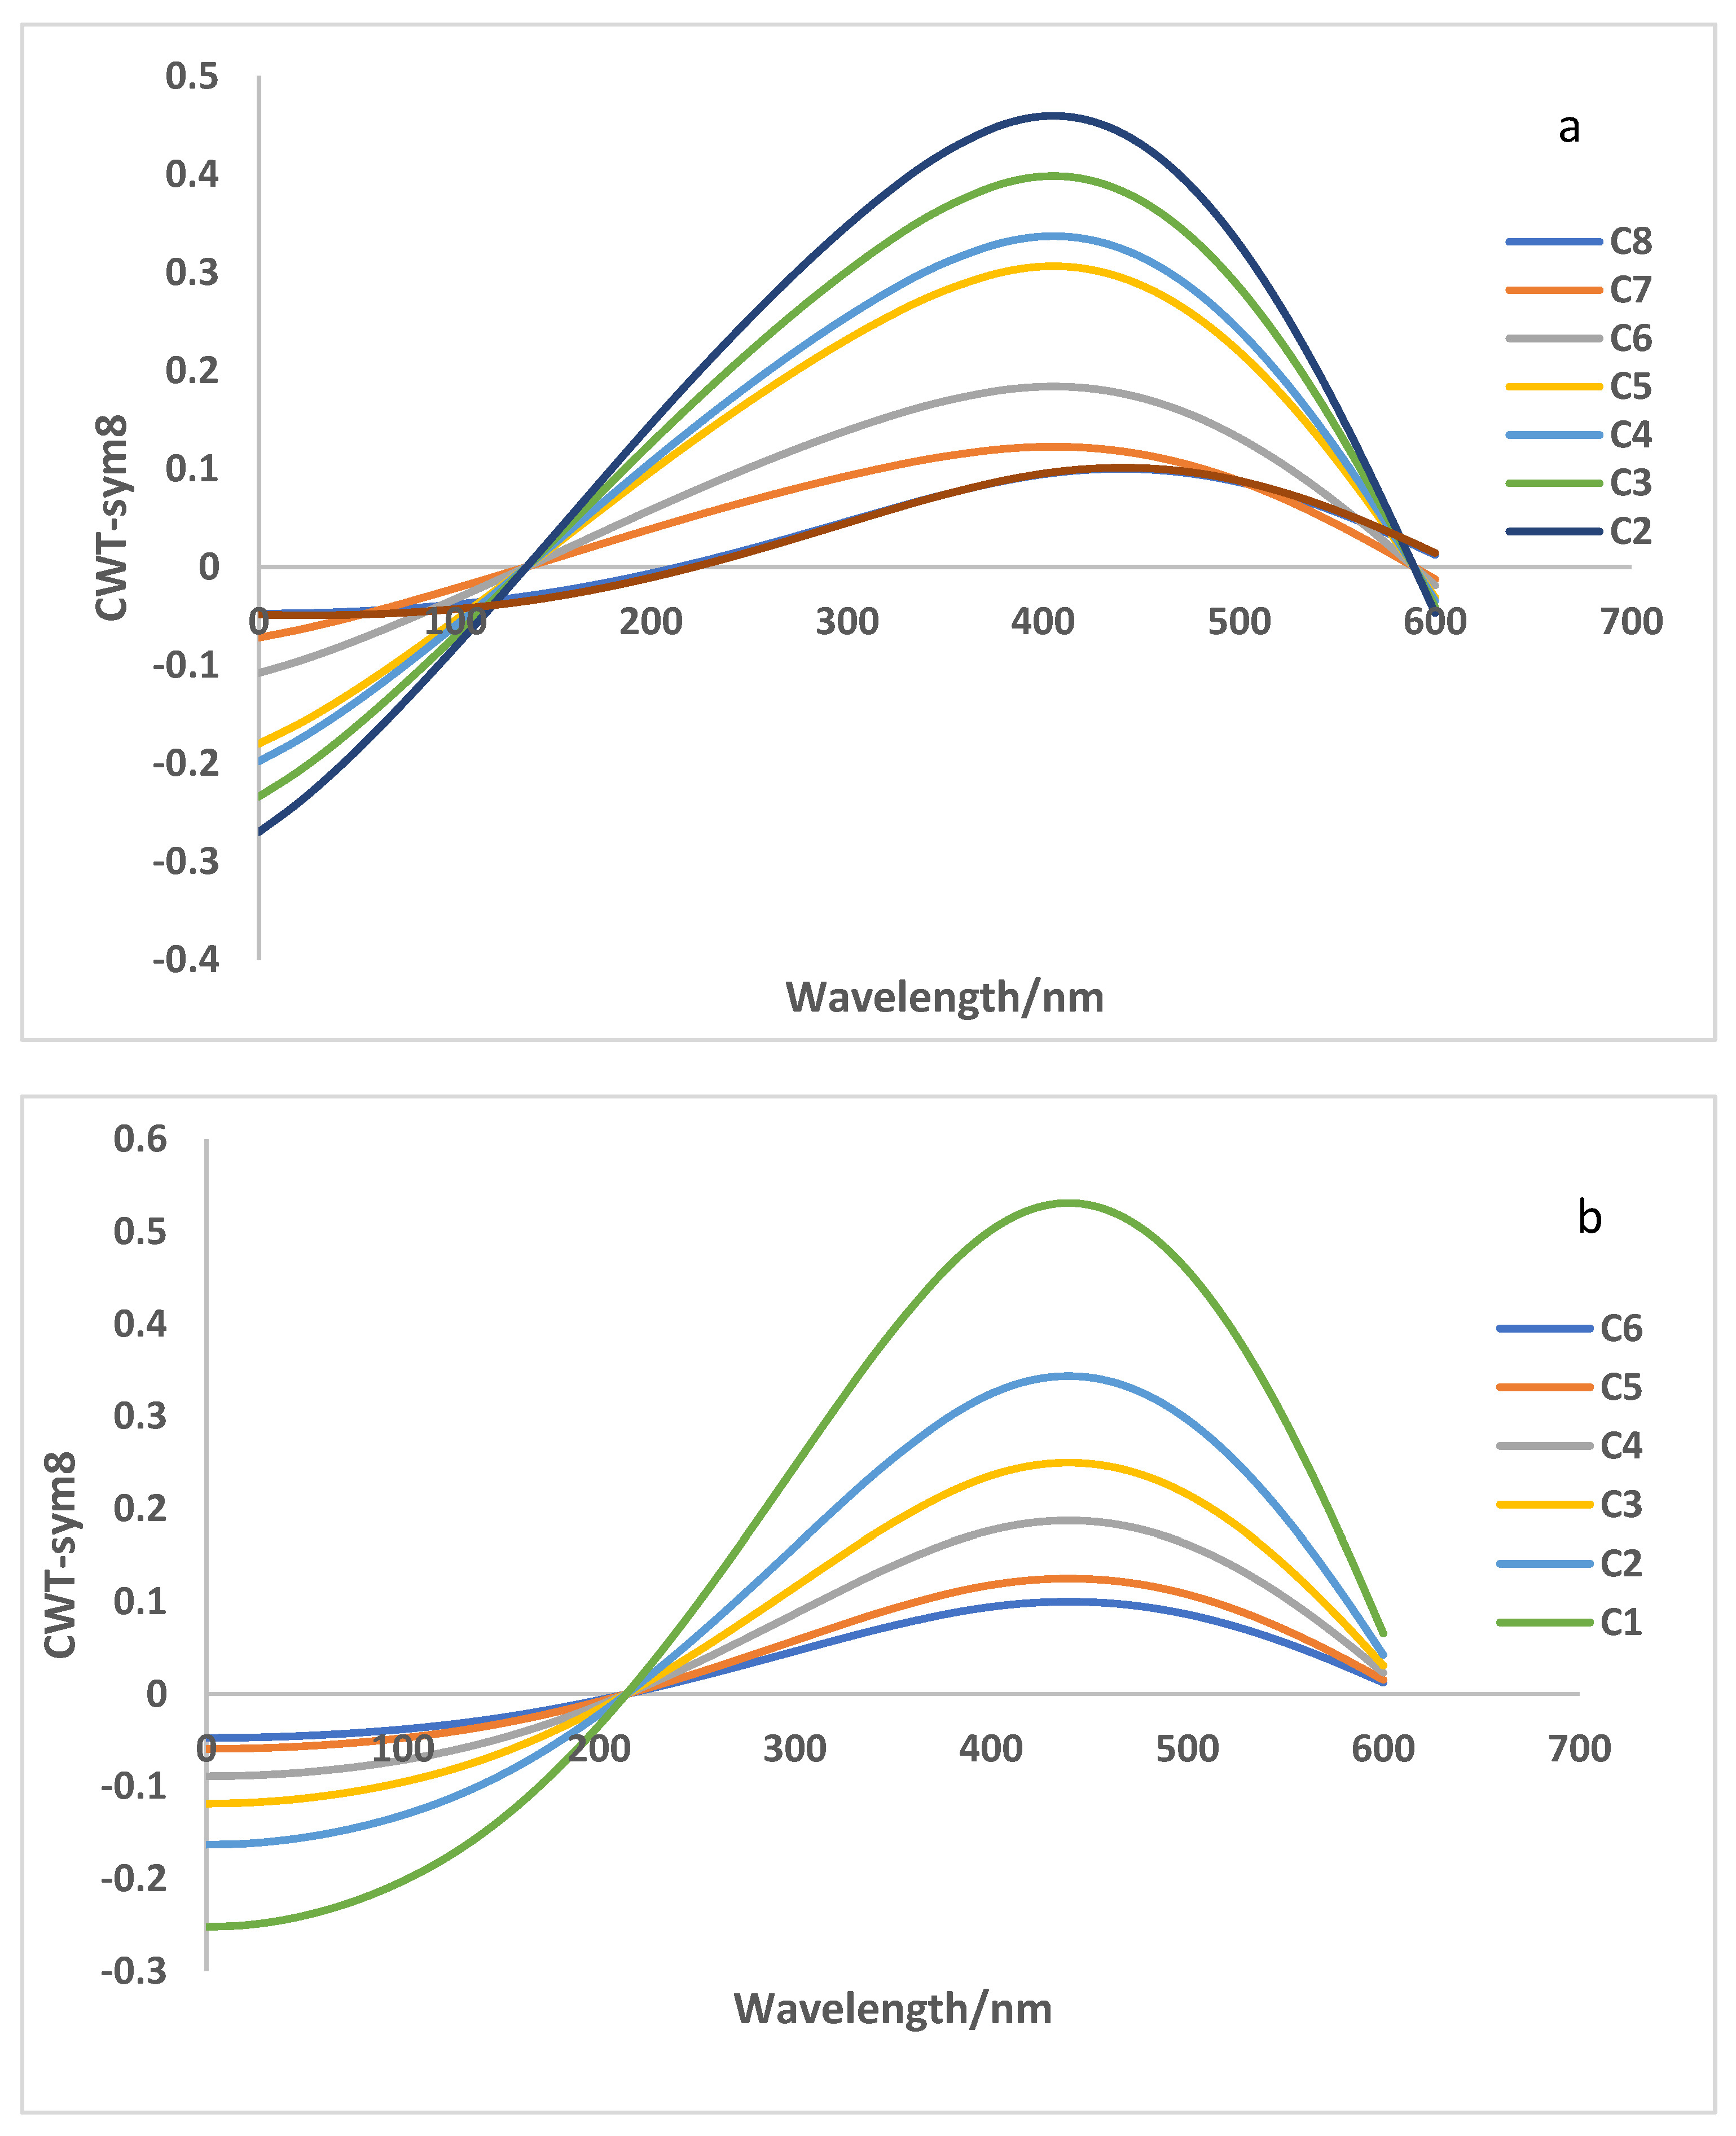
Figure 4a represents the graphs of CWT-sym8 signals of analyte solutions at a dilation value of 25. As mentioned before, CWT-sym8 calibration equations were extracted at the zero-crossing points based on their maximum sensitivity and selectivity (minimum overlapping). Therefore, times of 220 s for the determination of UA at zero-crossing points of DA and 140 s for determination of DA at zero-crossing points of UA were selected. Linear regression analysis and the statistical parameters of calibration sets are shown in Table 1.
In the same way, a calibration equation for DA was obtained by measuring the CWT-db8 signals of DA at zero-crossing points for UA. As can be seen, a good linearity with the good correlation coefficients was obtained by transformation of kinetic profiles by sym8 (see Table 1).
Additionally, applicability of db4 mother wavelet at a scaling value of 30 was tested on calibration graphs for DA and UA. The calibration equation of UA at zero-crossing points of UA and DA at zero-crossing points of UA was extracted (See Figure 4). The results of linear regression and its statistical results with LOD and LOQ values are shown in Table 2.
Finally, the validity of the method was tested using an independent prediction set of synthetic binary mixtures (prediction set). The amounts of UA and DA in synthetic mixtures were estimated using calibration equations of zero-crossing points. The averages of three determinations are presented in Table 2. The relative standard error (R.S.E.) of concentration was calculated according to the following equation:
R . S . E = i = 1 N C ^ i j C i j 2 i = 1 N C i j 2 0.5 × 100
where N is the number of samples and Cij and C ^ i j are the used concentration and estimated concentration of the component in the jth mixture, respectively.
It can be concluded that transformation of mean centered data can be used as a powerful technique for the quantitation of target biological molecules. There is high level of agreement between results of mother wavelets.
The partial least squares (PLS-1) algorithm, as a standard method was used for checking validity of method, too. The first four latent variables (LVs) explained 95.0% of the variance. So, the model was constructed with four LVs. The estimated concentration of prediction set was presented at Table 3. The results reveal that the results of CWT and PLS-1 method are in good agreement and there is no significant difference between their results.
It can be concluded that transformed data at zero-crossing point (CWT domain) instead of the spectral domain (in the PLS-1model) has advantages of effectively eliminating background interference and noise and further reducing the number of variables (coefficients) required for a making a good calibration model. So, the model created a regression model with a high quality.

3.5. Applications

According to the results of Table 3, it is revealed that the proposed method created acceptable results. So, the applicability of selected CWT was tested for the simultaneous determination of analytes in human serum and urine samples. The analysis of the spiking experiments of the known amounts of analytes was performed by the proposed method. The mean recovery values were calculated. Table 4 shows the predicted results and standard deviation of the results obtained for three replicates of each sample.
The recovery values of the analytes were in the order of 95–103%. It is clear that the recovery of spiked samples is remarkably suitable and shows the capacity of the method in the determination of DA and UA.
Additionally, the applicability of method was compared by the result of the other previously published works on DA and UA determinations. The results of comparison are provided in Table 5. It indicates that the proposed methods show a good linear dynamic range, higher r2 values, and lower LOD and LOQ values. Therefore, the proposed method presents a good methodology with high accuracy for analyzing complex mixtures, using simple available spectrophotometers in all laboratories.

4. Conclusions

Since the quantization of DA, UA and AA for physiological research and diagnosis of some diseases is useful, in the present study a very simple, selective, sensitive and accurate analytical method was proposed. It is the first time that the applicability of mean centered CWT of kinetic–spectrophotometric data was demonstrated for the simultaneous determination of UA and DA in the presence of AA. The results showed that the usage of CWT and the transformation of mean-centered kinetic absorption spectra can provide higher peak amplitudes, fewer noises and sharp peaks in the presence of constant spectra of AA. This means that the advantage of CWT in revealing characteristic information of the data set is suitable for obtaining the net contribution of each component of the overall signal, while the quality of the results obtained is not a function of overlapping spectral lines.

Author Contributions

Conceptualization, M.A.T. and G.A.; methodology, M.A.T., G.A. and Z.K.; software, M.A.T. and G.A.; validation, Z.K., M.A.T. and C.P.; formal analysis, M.A.T. and G.A.; investigation, M.A.T., G.A. and C.P.; resources, M.A.T., G.A. and C.P.; data curation, M.A.T., G.A. and C.P.; writing—original draft preparation, M.A.T. and G.A.; writing—review and editing, M.A.T., G.A. and C.P.; visualization, Z.K.; supervision, M.A.T.; project administration, M.A.T.; funding acquisition, M.A.T. and C.P. All authors have read and agreed to the published version of the manuscript.

Funding

This research received no external funding.

Data Availability Statement

Not applicable.

Conflicts of Interest

The authors declare no conflict of interest.

References

  1. Smith, T.E. Textbook of Biochemistry with Clinical Correlations; Devlin, T.M., Ed.; Wiley/Liss: New York, NY, USA, 1992; p. 929. [Google Scholar]
  2. Ulubay, S.; Dursun, Z. Cu nanoparticles incorporated polypyrrole modified GCE for sensitive simultaneous determination of dopamine and uric acid. Talanta 2010, 80, 1461–1466. [Google Scholar] [CrossRef] [PubMed]
  3. Thiagarajan, S.; Chen, S.M. Preparation and characterization of PtAu hybrid film modified electrodes and their use in simultaneous determination of dopamine, ascorbic acid and uric acid. Talanta 2007, 74, 212–222. [Google Scholar] [CrossRef]
  4. Ghanbari, K.H.; Moloudi, M. Flower-like ZnO decorated polyaniline/reduced graphene oxide nanocomposites for simultaneous determination of dopamine and uric acid. Anal. Biochem. 2016, 512, 91–102. [Google Scholar] [CrossRef] [PubMed] [Green Version]
  5. Huang, J.; Liu, Y.; Hou, H.; You, T. Simultaneous electrochemical determination of dopamine, uric acid and ascorbic acid using palladium nanoparticle-loaded carbon nanofibers modified electrode. Biosens. Bioelectron. 2008, 24, 632–637. [Google Scholar] [CrossRef] [PubMed]
  6. Zare, H.R.; Nasirizadeh, N.; Mazloum Ardakani, M. Electrochemical properties of a tetrabromo-p-benzoquinone modified carbon paste electrode Application to the simultaneous determination of ascorbic acid, dopamine and uric acid. J. Electroanal. Chem. 2005, 577, 25–33. [Google Scholar] [CrossRef]
  7. Tian, X.; Cheng, C.; Yuan, H.; Du, J.; Xiao, D.; Xie, S.; Choi, M.M. Simultaneous determination of l-ascorbic acid, dopamine and uric acid with gold nanoparticles–β-cyclodextrin–graphene-modified electrode by square wave voltammetry. Talanta 2012, 93, 79–85. [Google Scholar] [CrossRef]
  8. Stamford, J.A.; Justice, J.B. Probing brain chemistry: Voltammetry comes of age. Anal. Chem. 1996, 68, 359A–363A. [Google Scholar] [CrossRef]
  9. Rohani Moghadam, M.; Haji Shabani, A.M.; Shahbazikhah, P. Chemometric-assisted kinetic–spectrophotometric method for simultaneous determination of ascorbic acid, uric acid, and dopamine. Anal. Biochem. 2011, 410, 289–295. [Google Scholar] [CrossRef]
  10. Atta, N.F.; El-Kady, M.F.; Galal, A. Simultaneous determination of catecholamines, uric acid, and ascorbic acid at physiological levels using poly(N-methylpyrrole)/Pd–nanoclusterssensor. Anal. Biochem. 2010, 400, 78–88. [Google Scholar] [CrossRef]
  11. Shakkthivel, P.; Chen, S.M. Simultaneous determination of ascorbic acid and dopamine in the presence of uric acid on ruthenium oxide modified electrode. Biosens. Bioelectron. 2007, 22, 1680–1687. [Google Scholar] [CrossRef]
  12. Sun, C.L.; Lee, H.H.; Yang, J.M.; Wu, C.C. The simultaneous electrochemical detection of ascorbic acid, dopamine, and uric acid using graphene/size-selected Ptnanocomposites. Biosens. Bioelectron. 2011, 26, 3450–3455. [Google Scholar] [CrossRef] [PubMed]
  13. Liu, Y.; Huang, J.S.; Hou, H.Q.; You, T.Y. Simultaneous determination of dopamine, ascorbic acid and uric acid with electrospun carbon nanofibers modified electrode. Electrochem. Commun. 2008, 10, 1431–1434. [Google Scholar] [CrossRef]
  14. Dursun, Z.; Gelmez, B. Simultaneous Determination of Ascorbic Acid, Dopamine and Uric Acid at Pt Nanoparticles Decorated Multiwall Carbon Nanotubes Modified GCE. Electroanalysis 2010, 22, 1106–1114. [Google Scholar] [CrossRef]
  15. Xue, Z.; Feng, Y.; Guo, H.; Hu, C.; Idris Mohmed, A.M.; Li, J.; Lu, X. A novel electrocatalytic platform for separation of the overlapping voltammetric responses of AA, DA and UA. RSC Adv. 2014, 4, 5849–5852. [Google Scholar] [CrossRef]
  16. Ferin, R.; Pavão, M.L.; Baptista, J. Rapid, sensitive and simultaneous determination of ascorbic and uric acids in human plasma by ion-exclusion HPLC-UV. Clin. Biochem. 2013, 46, 665–669. [Google Scholar] [CrossRef] [Green Version]
  17. Martinoz-Perez, D.; Ferrer, M.L.; Mateo, C.R. A reagent less fluorescent sol–gel biosensor for uric acid detection in biological fluids. Anal. Biochem. 2003, 322, 238–242. [Google Scholar] [CrossRef]
  18. Kooshki, M.; Shams, E. Selective response of dopamine in the presence of ascorbic acid on carbon paste electrode modified with titanium phosphated silica gel. Anal. Chim. Acta 2007, 587, 110–115. [Google Scholar] [CrossRef]
  19. Haloi, S.; Goswami, P.; Das, D.K. Differentiating response of 2,7-dichlorofluorescein intercalated CTAB modified Na-MMT clay matrix towards dopamine and ascorbic acid investigated by electronic, fluorescence spectroscopy and electrochemistry. Appl. Clay Sci. 2013, 77, 79–82. [Google Scholar] [CrossRef]
  20. Eldawy, M.A.; Tawfik, A.S.; Elshiabouri, S.R. Rapid, sensitive spectrophotometric method for the determination of ascorbic acid. Anal. Chem. 1975, 47, 461–465. [Google Scholar] [CrossRef]
  21. Guclu, K.; Sozgen, K.; Tutem, E.; Ozyurek, M.; Apak, R. Spectrophotometric determination of ascorbic acid using copper(II)–neocuproine reagent in beverages and pharmaceuticals. Talanta 2005, 65, 1226–1232. [Google Scholar] [CrossRef]
  22. Yamaguchi, T.; Hasegawa, K.; Kamino, S.; Miyachi, K.; Tominaga, H.; Fujita, Y. Spectrophotometric determination of uric acid based on fading of ohydroxyhydroquinonephthalein–palladium(II)–hexadecyltrimethyl–ammonium complex. Anal. Sci. 2007, 23, 223–226. [Google Scholar] [CrossRef] [PubMed] [Green Version]
  23. Guo, L.; Zhang, Y.; Li, Q. Spectrophotometric determination of dopaminehydrochloride in pharmaceutical, banana, urine, and serum samples by potassium ferricyanide–Fe(III). Anal. Sci. 2009, 25, 1451–1455. [Google Scholar] [CrossRef] [PubMed] [Green Version]
  24. Afkhami, A.; Abbasi-Tarighat, M. Application of continuous wavelet transformation to the simultaneous kinetic determination of binary mixtures. Talanta 2009, 78, 424–431. [Google Scholar] [CrossRef] [PubMed]
  25. Ghasemi, J.; Amini, R.; Niazi, A. Kinetic simultaneous determination of Fe (II) and Fe(III)using partial least squares (PLS) and principal component regression (PCR) calibration methods. Anal. Let. 2002, 35, 533–544. [Google Scholar] [CrossRef]
  26. Afkhami, A.; Sarlak, N.; Zarei, A.R. Simultaneous kinetic spectrophotometric determination of cyanide and thiocyanate using the partial least squares (PLS) regression. Talanta 2007, 71, 893–899. [Google Scholar] [CrossRef]
  27. Safavi, A.; Abdollahi, H.; Nezhad, M.H. Artificial neural networks for simultaneous spectrophotometric differential kinetic determination of Co (II) and V (IV). Talanta 2003, 59, 515–523. [Google Scholar] [CrossRef]
  28. Abbasi Tarighat, M.; Afkhami, A. Simultaneous spectrophotometric determination of Cu(II), Co(II) and Ni(II) using ratio spectra-continuous wavelet transformation in some food and environmental samples. J. Braz. Chem. Soc. 2012, 23, 1312–1319. [Google Scholar] [CrossRef] [Green Version]
  29. Afkhami, A.; Abbasi-Tarighat, M.; Bahram, M. Artificial neural networks for determination of enantiomeric composition of α-phenylglycine using UV spectra of cyclodextrin host–guest complexes: Comparison of feed-forward and radial basis function networks. Talanta 2008, 75, 91–98. [Google Scholar] [CrossRef]
  30. Afkhami, A.; Madrakian, T.; Abbasi-Tarighat, M. Simultaneous determination of calcium, magnesium and zinc in different foodstuffs and pharmaceutical samples with continuous wavelet transforms. Food Chem. 2008, 109, 660–669. [Google Scholar] [CrossRef]
  31. Abbasi Tarighat, M.; Nabavi, M.; Mohammdizadeh, M.R. Chemometrics-assisted spectrophotometric method for simultaneous determination of Pb2+ and Cu2+ ions in different foodstuffs, soil and water samples using 2-benzylspiro [isoindoline-1,5′-oxazolidine]-2′,3,4′-trione using continuous wavelet transformation and partial least squares–Calculation of pKf of complexes with rank annihilation factor analysis. Spectrochim. Acta 2015, 145, 54–62. [Google Scholar]
  32. Dinc, E.; Baleanu, D. Multidetermination of thiamine HCl and pyridoxine HCl in their mixture using continuous daubechies and biorthogonal wavelet analysis. Talanta 2003, 59, 707–717. [Google Scholar] [CrossRef]
  33. Dinc, E.; Baleanu, D. A zero-crossing technique for the multidetermination of thiamine HCl and pyridoxine HCl in their mixture by using one-dimensional wavelet transform. J. Pharm. Biomed. Anal. 2003, 31, 969–978. [Google Scholar] [CrossRef]
  34. Dinc, E.; Baleanu, D. Application of the Wavelet Method for the Simultaneous Quantitative Determination of Benazepril and Hydrochlorothiazide in Their Mixtures. J. AOAC Int. 2004, 87, 834–841. [Google Scholar] [CrossRef] [PubMed] [Green Version]
  35. Abbasi Tarighat, M. Simultaneous spectrophotometric determination of phosphate and silicate in different water and soil samples using chemometrics approach. Int. J. Environ. Sci. Technol. 2016, 13, 11–20. [Google Scholar] [CrossRef] [Green Version]
  36. Abbasi Tarighat, M.; Hasaninejad, A.; Abdi, G. Chemometrics-Enhanced Micelle-Mediated Extraction Spectrophotometric Method for Simultaneous Determination of Cu2+ and Zn2+ in Medicinal Plant, Rice and Water Samples Using Continuous Wavelet Transform. Food Anal. Met. 2016, 9, 1928–1938. [Google Scholar] [CrossRef]
  37. Abbasi Tarighat, M. Orthogonal projection approach and continuous wavelet transform-feed forward neural networks for simultaneous spectrophotometric determination of some heavy metals in diet samples. Food Chem. 2016, 192, 548–556. [Google Scholar] [CrossRef]
  38. Lu, C.; Troutman, J.R.; Schmitz, T.L.; Ellis, J.D.; Tarbutton, J.A. Application of the continuous wavelet transform in periodic error compensation. Precis. Eng. 2016, 44, 245–251. [Google Scholar] [CrossRef] [Green Version]
  39. Suslu, I.; Dinc, E.; Altinoz, S. An application of continuous wavelet transforms to electrochemical signals for the quantitative analysis. In Mathematical Methods in Engineering; Springer: Dordrecht, The Netherlands, 2007; pp. 303–313. [Google Scholar]
  40. Valizadeh, M.; Sohrabi, M.R.; Motiee, F. The application of continuous wavelet transform based on spectrophotometric method and high-performance liquid chromatography for simultaneous determination of anti-glaucoma drugs in eye drop, Spectrochim. Acta Part A Mol. Biomol. Spectrosc. 2020, 242, 118777. [Google Scholar] [CrossRef] [PubMed]
  41. Gonçalves, M.A.; Santos, L.S.; Prata, D.M. Optimal wavelet signal compression as an efficient alternative to investigate molecular dynamics simulations: Application to thermal and solvent effects of MRI probes. Theor. Chem. Acc. 2017, 136, 15. [Google Scholar] [CrossRef]
  42. Gonçalves, M.A.; Júnior, A.M.; da Cunha, E.F.; Ramalho, T.C. Investigating an efficient and accurate protocol for sampling structures from molecular dynamics simulations: A close look by different wavelet families. Theor. Chem. Acc. 2021, 140, 109. [Google Scholar] [CrossRef]
  43. Afkhami, A.; Abbasi-Tarighat, M.; Bahram, M.; Abdollahi, H. A new strategy for solving matrix effect in multivariate calibration standard addition data using combination of H-point curve isolation and H-point standard addition methods. Anal. Chim. Acta 2008, 21, 144–151. [Google Scholar] [CrossRef] [PubMed]
  44. Seasholtz, M.B.; Kowalski, B.R. The effect of mean centering on prediction in multivariate calibration. J. Chemom. 1992, 6, 103–111. [Google Scholar] [CrossRef]
  45. Khajehsharifi, H.; Pourbasheer, E.; Tavallali, H.; Sarvi, S.; Sadeghi, M. The comparison of partial least squares and principal component regression in simultaneous spectrophotometric determination of ascorbic acid, dopamine and uric acid in real samples. Arab. J. Chem. 2017, 10, S3451–S3458. [Google Scholar] [CrossRef] [Green Version]
  46. Safavi, A.; Maleki, N.; Moradlou, O.; Tajabadi, F. Simultaneous determination of dopamine, ascorbic acid, and uric acid using carbon ionic liquid electrode. Anal. Biochem. 2006, 359, 224–229. [Google Scholar] [CrossRef]
  47. Yang, L.; Liu, D.; Huang, J.; Yo, T. Simultaneous determination of dopamine, ascorbic acid and uric acid at electrochemically reduced graphene oxide modified electrode. Sens. Actuators B Chem. 2014, 193, 166–172. [Google Scholar] [CrossRef]
  48. Wei, Y.; Liu, Y.; Xu, Z.; Wang, S.; Chen, B.; Zhang, D.; Fang, Y. Simultaneous Detection of Ascorbic Acid, Dopamine, and Uric Acid Using a Novel Electrochemical Sensor Based on Palladium Nanoparticles/Reduced Graphene Oxide Nanocomposite. Int. J. Anal. Chem. 2020, 2020, 8812443. [Google Scholar] [CrossRef] [PubMed]
  49. Wu, Y.; Deng, P.; Tian, Y.; Feng, J.; Xiao, J.; Li, J.; Liu, J.; Li, G.; He, Q. Simultaneous and sensitive determination of ascorbic acid, dopamine and uric acid via an electrochemical sensor based on PVP-graphene composite. J. Nanobiotechnol. 2020, 18, 112. [Google Scholar] [CrossRef]
  50. Tian, Y.; Deng, P.; Wu, Y.; Li, J.; Liu, J.; Li, G.; He, Q. MnO2 nanowires-decorated reduced graphene oxide modified glassy carbon electrode for sensitive determination of bisphenol A. J. Electrochem. Soc. 2020, 167, 046514. [Google Scholar] [CrossRef]
Figure 1. Spectrophotometric spectra of (a) UA, (b) DA and (c) Kinetic profiles of DA, UA and AA at acetate media (pH = 4.5) and wavelength 320 nm.
Separations 09 00282 g001aSeparations 09 00282 g001b
Figure 2. Effect of pH on absorbance variation of DA and UA.
Separations 09 00282 g002
Figure 3. (a) Kinetic profiles of randomly selected mixtures of (a) UA 5, 10, 20, 30, 40, 50 and 55 μ mol L−1 and (b) DA 7, 10, 15,20, 30, and 400 μ mol L−1.
Separations 09 00282 g003
Figure 4. (a) Transformed kinetic profiles of (a) UA 5, 10, 20, 30, 40, 50 and 55 μ mol L−1 and (b) DA 7, 10, 15,20, 30, and 400 μ mol L−1 using sym8.
Separations 09 00282 g004
Table 1. Statistical results of calibration graphs obtained at zero-crossing points using CWT-sym8.
AnalyteTime (s)Dynamic RangeRegression EquationR2LOD/μMLOQ/μM
UA2202.0–50.0CWT = 0.0051CUA + 0.0020.9840.060.19
DA1402.0–40.0CWT = −0.002CDA − 0.0280.9980.30.96
Table 2. Statistical results of calibration graphs obtained at zero-crossing points using CWT-db4.
AnalyteTime (s)Dynamic RangeRegression EquationR2LOD LOQ
UA1001.0–60.0CWT = 0.002CUA − 0.0430.9930.060.3
DA5007.0–40.0CWT = 0.004CDA − 0.0010.9950.20.5
Table 3. Estimated concentration and R.S.E values of DA and UA predicted by CWT-sym8 and CWT-Db4.
Concentration (μM)
Real ValuePredicted Value
Sym8Db4
UADAUADAUADA
501050.510.15110.2
50551.15.3515.1
501551.215.350.815.2
201021.110.120.310.5
205215.220.85.2
201521.415.520.515.1
R.S.E.%2.82.522.4
Table 4. The obtained recovery values of DA and UA in urine and serum samples.
SampleAnalyte (μM)Recovery%
AddedFound
DAUADAUADAUA
Urine00ND a8--
10109.5 ± 0.518.2 ± 0.795102
Urine00ND9.2 ± 0.8--
10109.8 ± 1.119.5 ± 1.198103
Serum00NDND--
303029.4 ± 0.831 ± 1.298103.3
a ND: not detected.
Table 5. Comparison of proposed method with some published works.
ModifierTechniqueDynamic Range (μM)R2LOD (μM)LOQ (μM)Reference
DAUADAUADAUADAUA
Kinetic-spectrophotometryANN a2–334.3–78.3--0.80.5--[9]
SpectrophoometryPLS b/PCR c0.57–22.761.68–28.58------[45]
CILE dDPV2–15002–220--0.10.1--[46]
ERGO eDPV0.5–600.5–600.990.990.50.5--[47]
PdNPs/rGO/GC fDVP15–420.3–1.4--1.016.67--[48]
PVP-GR/GCE gDPV0.02–0.2;
0.2–100
0.04–1.0; 1.0–100--0.0020.02--[49]
GR-Pt/GCE hDPV0.03–8.130.05–11.85--0.030.05--[50]
Kinetic-spectrophotometry10-phen i/Cu2+1–607–400.9950.9980.060.30.250.75Current work
a Artificial neural network, b Partial least square; c principal component regression; d carbon ionic liquid electrode; e electrochemically reduced graphene oxide; f Palladium Nanoparticles/Reduced Graphene Oxide Nanocomposite; g polyvinylpyrrolidone (PVP)-graphene composite film modified glassy carbon electrode; h Graphene/size-selected Pt nanocomposites modified glassy carbon electrode; i 10-phenanthroline.
Publisher’s Note: MDPI stays neutral with regard to jurisdictional claims in published maps and institutional affiliations.