Article

Evaluation of New, Sputtered Carbon SPME Fibers with a Multi-Functional Group Test Mixture

by
Dhananjay I. Patel
1,
Tuhin Roychowdhury
1,
Collin Jacobsen
1,
Colton Myers
2,
Jason S. Herrington
2,* and
Matthew R. Linford
1,*
1
Department of Chemistry & Biochemistry, Brigham Young University, Provo, UT 84602, USA
2
Restek Corporation, 110 Benner Circle, Bellefonte, PA 16823, USA
*
Authors to whom correspondence should be addressed.
Separations 2021, 8(12), 228; https://doi.org/10.3390/separations8120228
Submission received: 31 October 2021 / Revised: 18 November 2021 / Accepted: 18 November 2021 / Published: 23 November 2021
(This article belongs to the Special Issue Recent Advances in Green Sample Preparation Techniques)

Abstract

:
We report the first fabrication of sputtered carbon, solid-phase microextraction (SPME) fibers. These fibers have competitive extraction capabilities compared with the commercial carbon wide range (CWR) SPME fiber. This report also includes a demonstration of a newly developed SPME test mix that includes 15 different compounds with a wide range of functional groups and chemical properties. The fiber fabrication process involves sputtering carbon onto fused silica fibers, and the effects of throw distance on the morphology of the carbon coatings were studied. Four different carbon coating thicknesses were evaluated, with PDMS added as a stationary phase. These fibers were characterized with multiple analytical techniques, including scanning electron microscopy (SEM), X-ray photoelectron spectroscopy (XPS), water contact angle (WCA) goniometry, as well as headspace (HS) and direct immersion (DI)–SPME–GC–MS. The best (11.5 µm) sputtered carbon SPME fibers, with and without PDMS, were evaluated using the new evaluation mix and compared with the commercial CWR fiber and a previously sputtered/developed silicon fiber. The new probe mix helped elucidate differences among the fibers, which would have been missed by current commercial test mixes. The sputtered carbon SPME fibers showed similar functional group selectivity as commercial CWR fibers. However, the sputtered carbon fibers showed higher responses per volume compared with the commercial CWR fiber, indicating the porous morphology of the sputtered carbon has the ability to overcome large phase thickness/volume discrepancies and increase the relative recovery for various compounds.

1. Introduction

Solid-phase microextraction (SPME) is a green, solventless sampling technique that has grown rapidly since its introduction by Arthur and Pawliszyn [1]. SPME requires little to no sample preparation and allows for high throughput and automated analysis via robotics. It is commonly used in tandem with gas chromatography (GC) and liquid chromatography (LC). SPME is a remarkable tool that is widely accepted by the scientific community. It is used in environmental [2], pharmaceutical [3], biological [4], forensic [5], food [6], and natural product analyses [7].
SPME uses different coatings that are immobilized on fused silica fibers or metal wires. The technique is based on the distribution of analytes between the coating and the sample matrix, which is followed by desorption of the extracted analytes from the SPME coating. Due to its selectivity and sensitivity, SPME plays a pivotal role in the extraction of many different analytes. Thus, there are different commercial coatings available, e.g., polydimethylsiloxane (PDMS), polyacrylate (PA), carboxen/polydimethylsiloxane (CAR/PDMS), and PDMS/divinylbenzene (DVB). However, these commercial fibers suffer from various drawbacks. For example, the fibers and coatings may be fragile, weakly adhered to each other, or show poor thermal stability, short lifetimes, high carry-over, and high phase bleed [8].
In the past few decades, new materials for SPME coatings have been explored. These include mesoporous silica nanoparticles (MSNs) [9], molecularly imprinted polymers (MIPs) [10], metal–organic frameworks (MOFs) [11], ionic liquids (ILs) [12], metal oxides [13,14], carbon nanotubes [15], graphene [16,17], and conducting polymers [13]. Our group has demonstrated the use of porous, sputtered silicon coatings for SPME [18,19,20]. These sputtered coatings have very high surface areas and allow subsequent functionalization with organic thin films. These coatings have shown promising results in the analysis of amines, alcohols, aldehydes, and PAHs. Sputtering, which remains largely unexplored in chromatography and SPME, is very widely used in industry, including in semiconductor manufacturing, to produce microelectronic devices, optical materials, biochip arrays, sensors, and catalysts [21,22]. Sputtering is a type of physical vapor deposition [18]. Sputter processes use solid (often elemental) targets as a source, where atoms are ejected from the target by bombardment with gas ions in a vacuum. The ejected atoms strike/coat a substrate. At oblique angles of deposition, shadowing may lead to the production of porous coatings with columnar microstructures and high capacities for analytes [23,24,25]. Carbon-based materials have played an important role in SPME. Among these, porous carbon [26], mesoporous graphene aerogels [27], carbon spheres [28,29], graphene [17], and carbon nanotubes [15] have been of particular interest for chromatographers. These coatings are mostly used for the analysis of polyaromatic hydrocarbons (PAHs).
Despite the recent progress in SPME materials, coatings, and configurations, very little has been done to systematically benchmark these advances over a wide range of chemical classes. For over six decades now, the performance of chromatographic systems has been evaluated with standardized test mixes such as those developed by Kovats [30,31], McReynolds [32], and Grob [33]. However, this degree of systematic evaluation of SPME devices through test mixes appears to be absent from the literature; relatively little effort has been made to develop appropriate test mixes for SPME. Indeed, the majority of SPME manuscripts have only considered one or two compound classes. For example, Khaled and Pawliszyn only focused on alkanes [34]; Kremser et al. [35], Patel et al. [19], and Roychowdhury et al. [20] only evaluated PAHs in water and baby formula; Myers et al. only worked on terpenes in cannabis matrices [36]; Koziel et al. and Wang et al. only tested a few aromatics [37,38]. Of course, there are SPME studies that consider multiple classes of compounds, but they are generally application specific. For example, Stefanuto et al. evaluated esters, fatty acids, alcohols, phenols, terpenoids/ketones/aldehydes, and nitrocyclic compounds for the aroma profiling of beer [39], and Eckert et al. looked at alkanes, aromatics, aldehydes, sulfides, and alcohols for microbiological VOC profiling [40]. An extensive literature search only produces a few SPME studies that are non-application specific and that provide a systematic evaluation of SPME devices spanning several chemical classes. Most notably, Grandy et al. developed standard gas generation vials for modified McReynolds standards including benzene, 2-pentanone, 1-nitropropane, pyridine, 1-pentanol, octane, dodecane, and hexadecane [41]. However, this compound list is relatively short and lacks functional group diversity, i.e., three of the eight compounds are aliphatic alkanes. The reasons for a lack of non-application-specific SPME studies bridging across several chemical classes/functional groups is not clear. It may be that the industries and markets served by SPME do not necessitate broad coverage of chemical classes in non-application-specific scenarios. Another possibility may be the fact that the few commercially available SPME fiber test mixes that exist are limited in scope and only include nitrobenzene and 2-nitrotoluene. Regardless of the reasons, the current work sets out to develop and use a diverse group of compounds that spans multiple functional groups, and specific compounds of interest. The intent behind this SPME test mix is to create a standard that will help elucidate incremental and/or significant differences in SPME materials, coatings, configurations, etc.
Our previous work on sputtered SPME coatings focused on silicon coatings. However, as noted above, carbon materials/coatings have also been important for SPME. Here, we report the first example of porous, sputtered carbon SPME coatings on single fibers and also a new SPME evaluation mix to test those fibers. Fibers with porous carbon coatings of four different thicknesses (0.25. 2.5, 11.5, and 20 µm), with and without a PDMS stationary phase, were evaluated with the new SPME evaluation mix. This mix contains a variety of chemical properties/functional groups including alkane, cycloalkane, chloroalkane, diene, alcohol, diol, ketone, amine, sulfonyl, aromatic, phenol, heterocyclic, and terpenoid. This report also describes the characterization of our new SPME coatings using scanning electron microscopy (SEM), X-ray photoelectron spectroscopy (XPS), and water contact angle (WCA) goniometry.

2. Experimental

2.1. Materials

Polyimide-coated silica fibers (Part# 1068000066) were purchased from Polymicro Technologies (Phoenix, AZ, USA). Carbon (99.99%) targets (3” dia. x 0.125” thick) were purchased from Plasmaterials (Livermore, CA, USA). Sylgard® 184 silicone elastomer base and curing agent were purchased from Dow Corning Corp. (Midland, MI, USA). Epo-Tek 353NDT epoxy glue was purchased from Fosco Fiber Optics (Livermore, CA, USA). Single-sided Kapton® tape, 6.3 mm × 32.9 m, was purchased from Ted Pella (Redding, CA, USA). SPME fiber assemblies were provided by the Restek Corp. (Bellefonte, PA, USA). Grob’s test mix (cat. # 35000), Kovats’ test mix (cat. # 35258), and the custom test mix shown in Table 1 were provided by the Restek Corp. (Bellefonte, PA, USA).

2.2. Fiber Preparation

2.2.1. Sputtered Carbon Coatings on Fused Silica Fibers

Sputtering was carried out with a carbon (99.99%) target in a PVD 75 (Kurt J. Lesker Co., Clairton, PA, USA) sputtering tool. Fused silica fibers were positioned on the substrate platen perpendicular to the incoming vapor flux. This arrangement of the fibers leads to shadowed/oblique angle deposition (OAD) that results in a porous morphology. The pressure and power in the depositions were 4 mTorr and 400 W, respectively. Fibers were sputtered at different throw distances (4, 12, 20 cm) and times (6, 13, 26 h) to obtain different morphologies and thicknesses. SEM was used to characterize the different sputtered carbon surfaces.

2.2.2. PDMS Deposition on Sputtered Carbon Coatings

As previously reported, carbon-sputtered fibers and witness silicon shards (also carbon-sputtered) were positioned ca. 2 cm above freshly mixed (prepolymer and curing agent, 10:1) Sylgard 184 in a ceramic vessel on an aluminum slab, which was then placed in an oven at 300 °C for 12 h under ambient conditions [20]. This process resulted in the deposition of a thin, hydrophobic film of PDMS. After PDMS deposition, the sputtered fibers were cleaned with toluene and deionized (DI) water and dried with a jet of nitrogen. These coatings were then characterized by SEM, XPS, and WCA goniometry. Finally, the fibers were attached to SPME assemblies with epoxy glue and evaluated using SPME–GC–MS.

2.3. HS/DI–SPME–GC–MS Analysis

Headspace (HS) and direct immersion (DI)–SPME parameters, and GC–MS conditions used for the analysis of the SPME test mixes are described in Table 2 and Table 3, respectively.

3. Results and Discussion

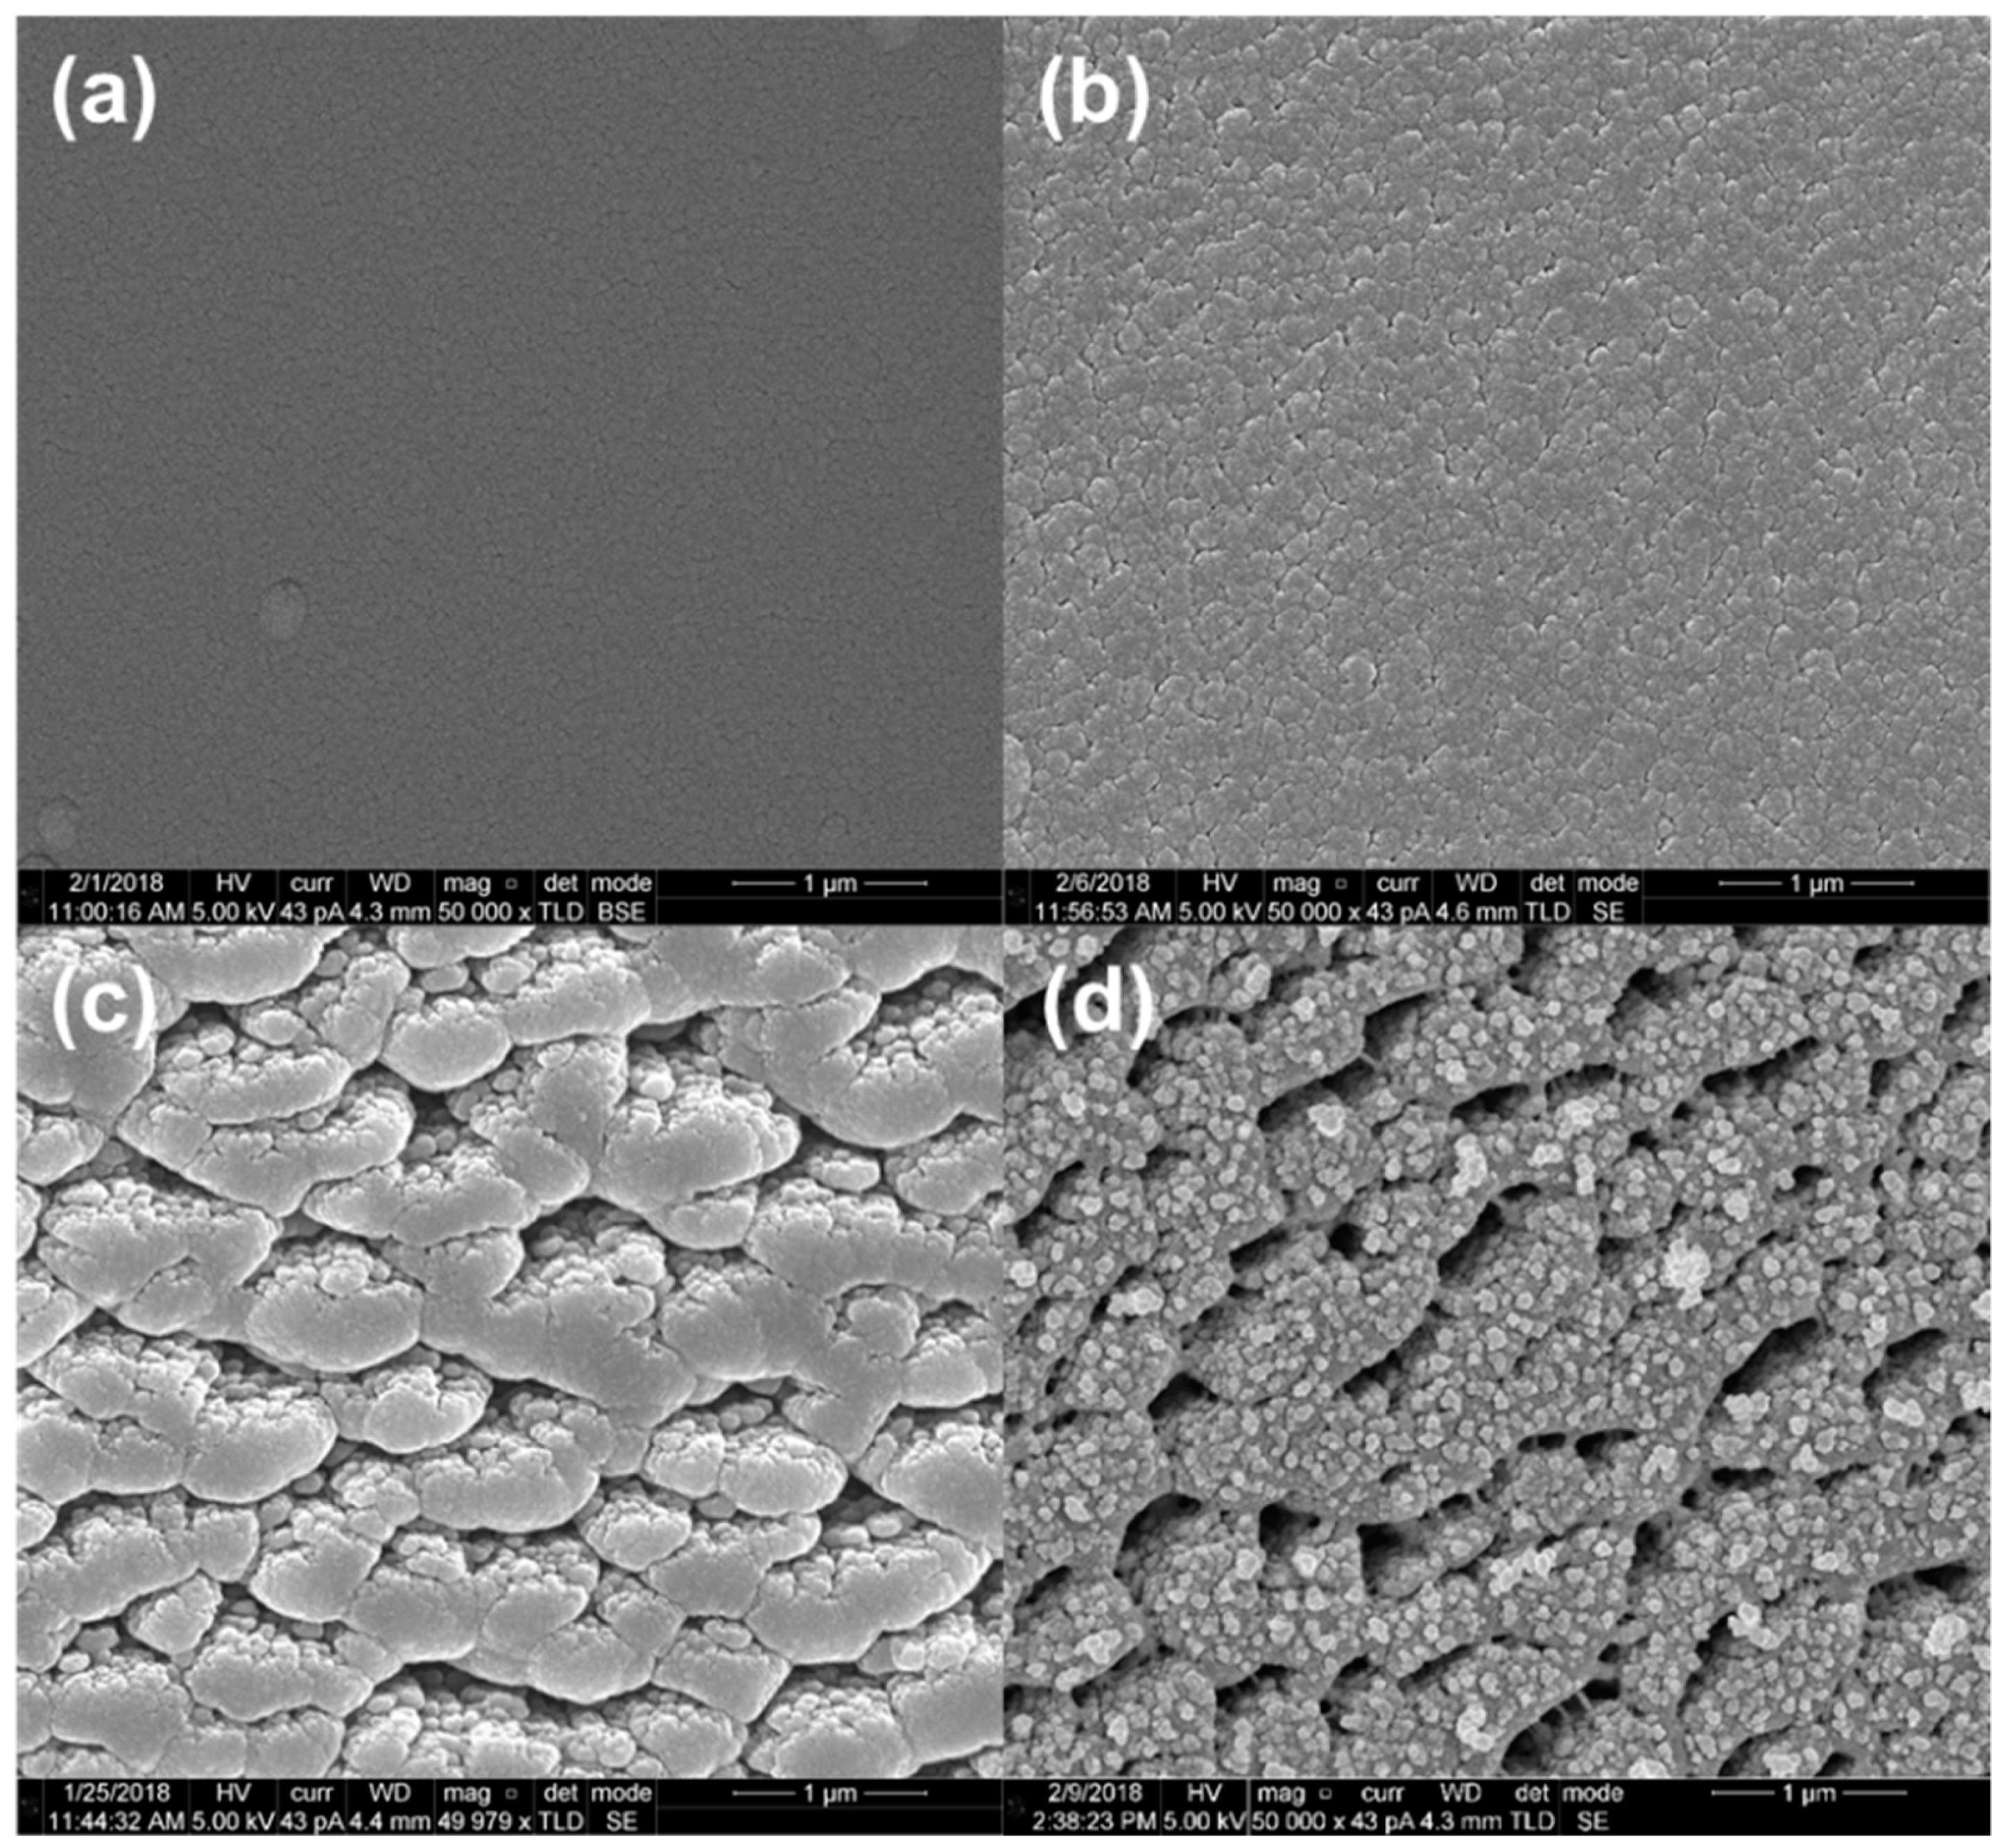
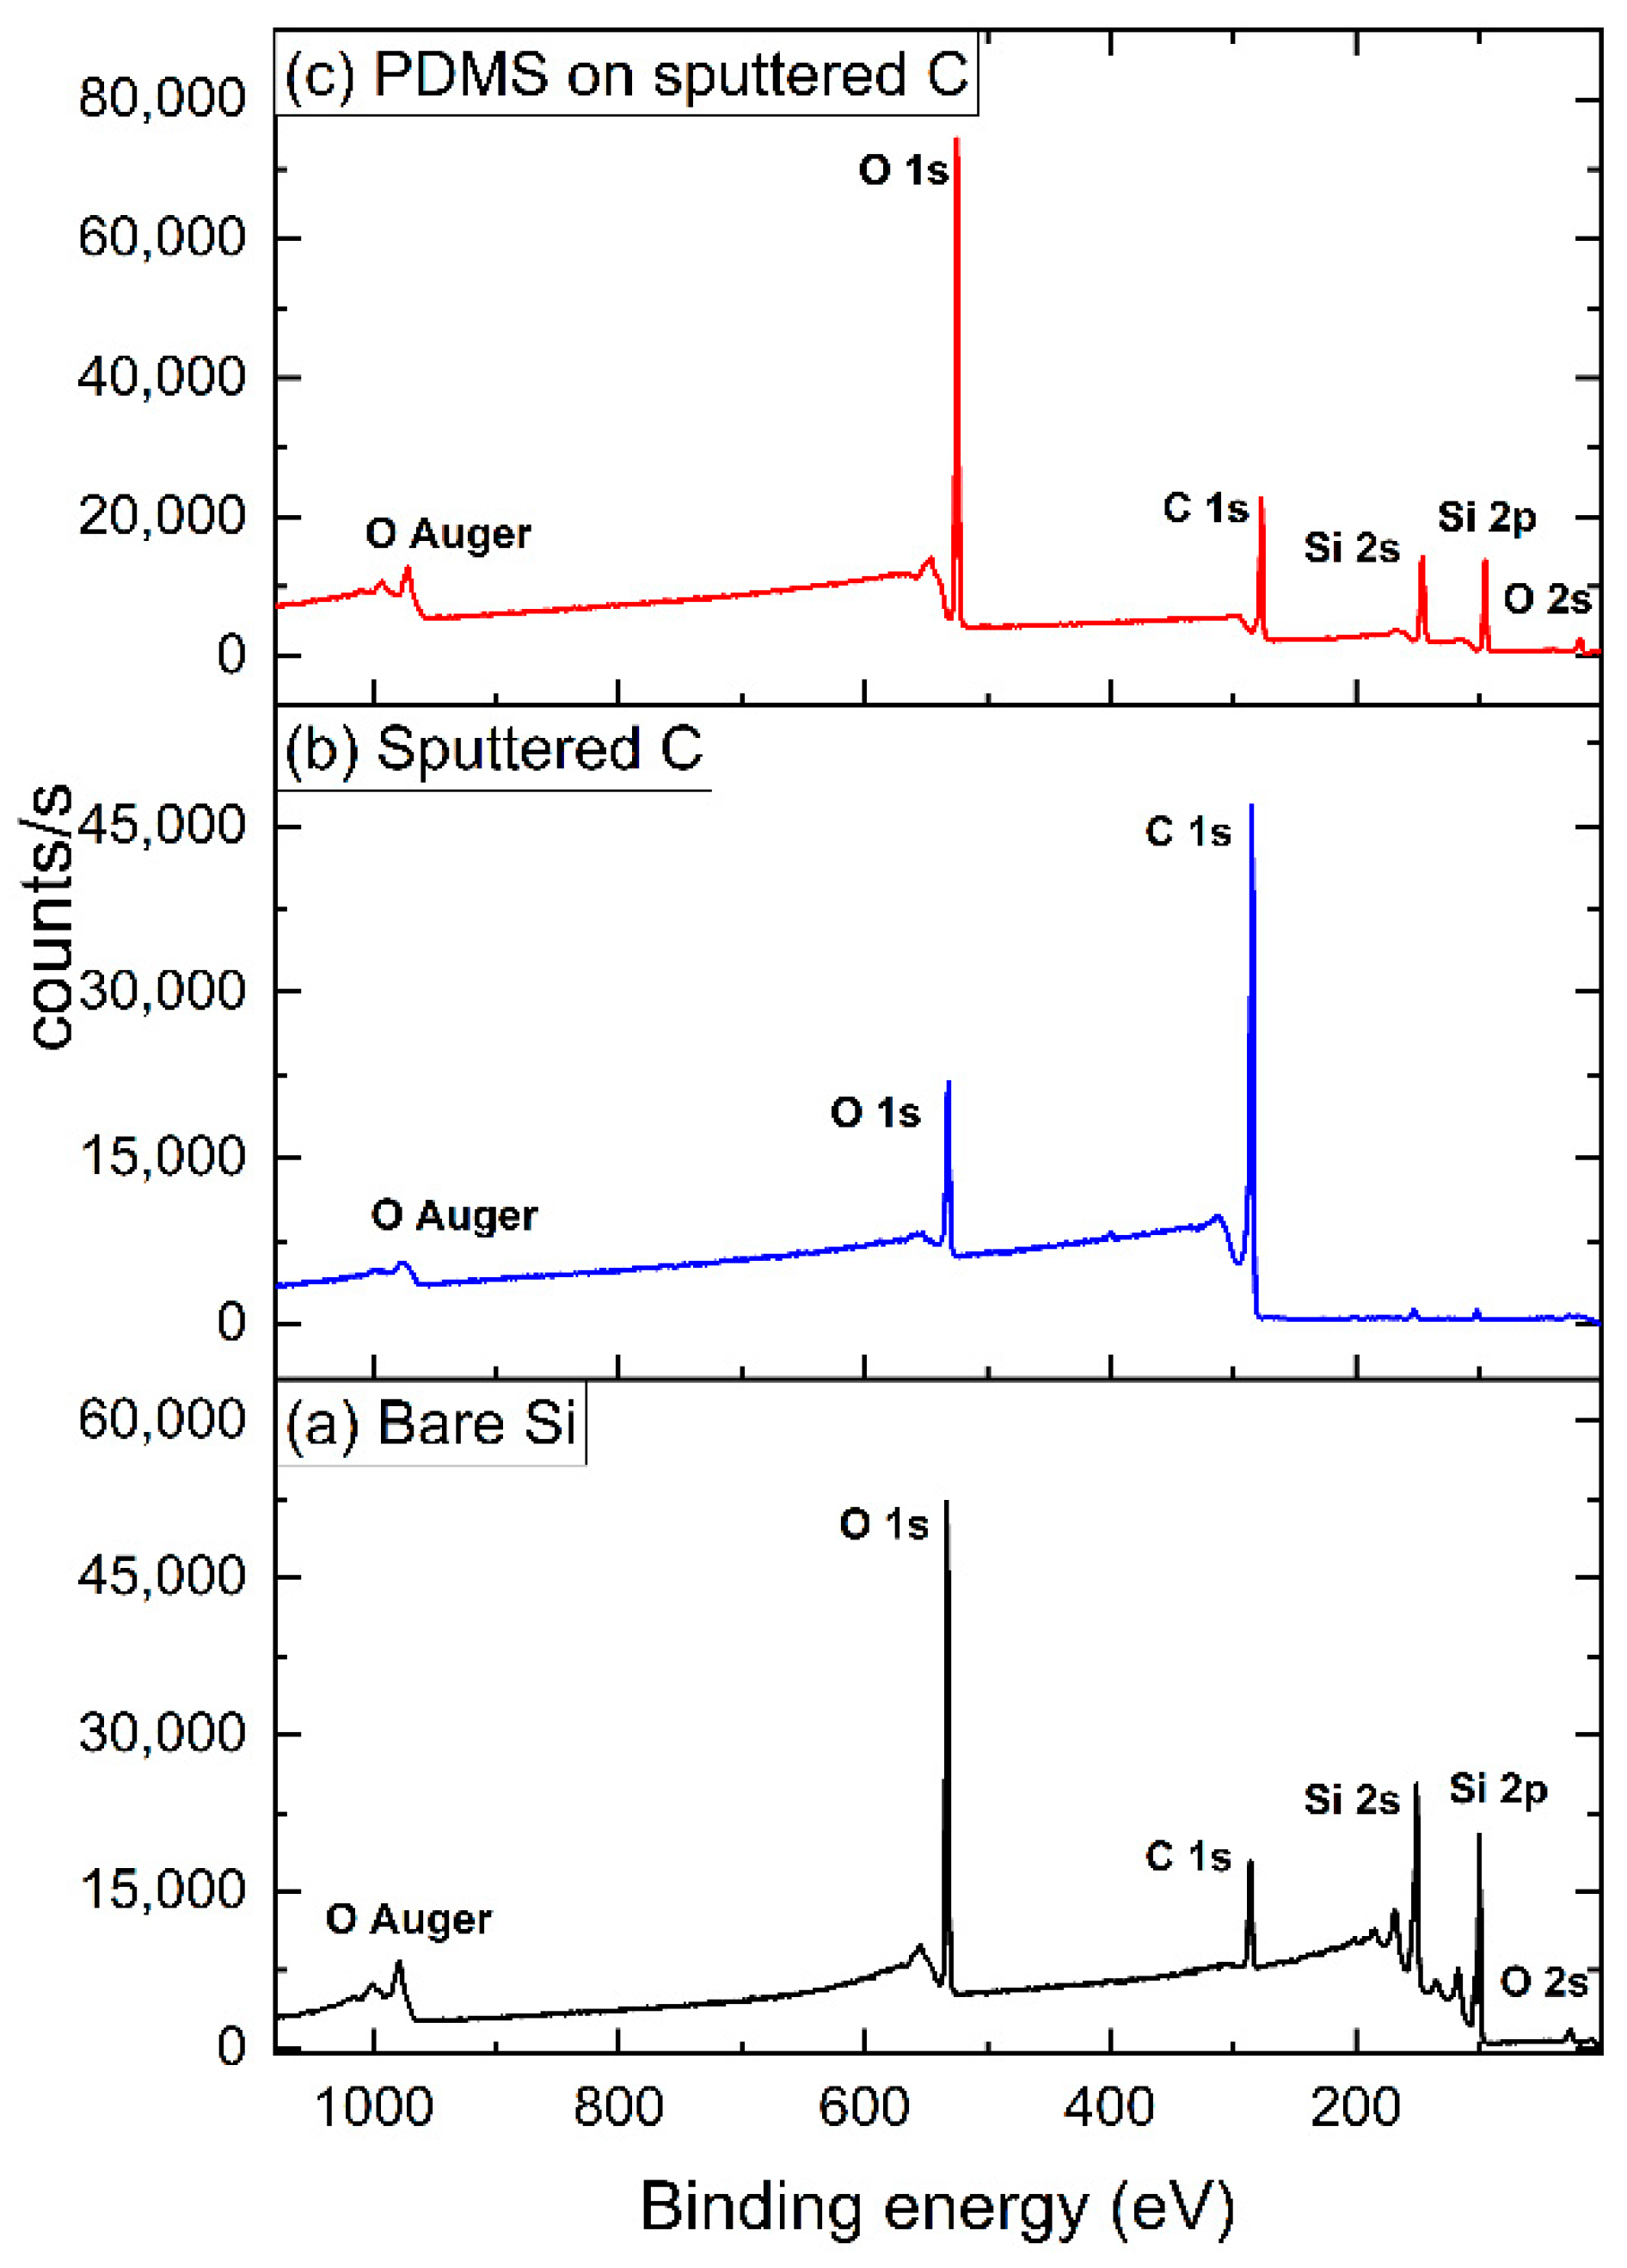
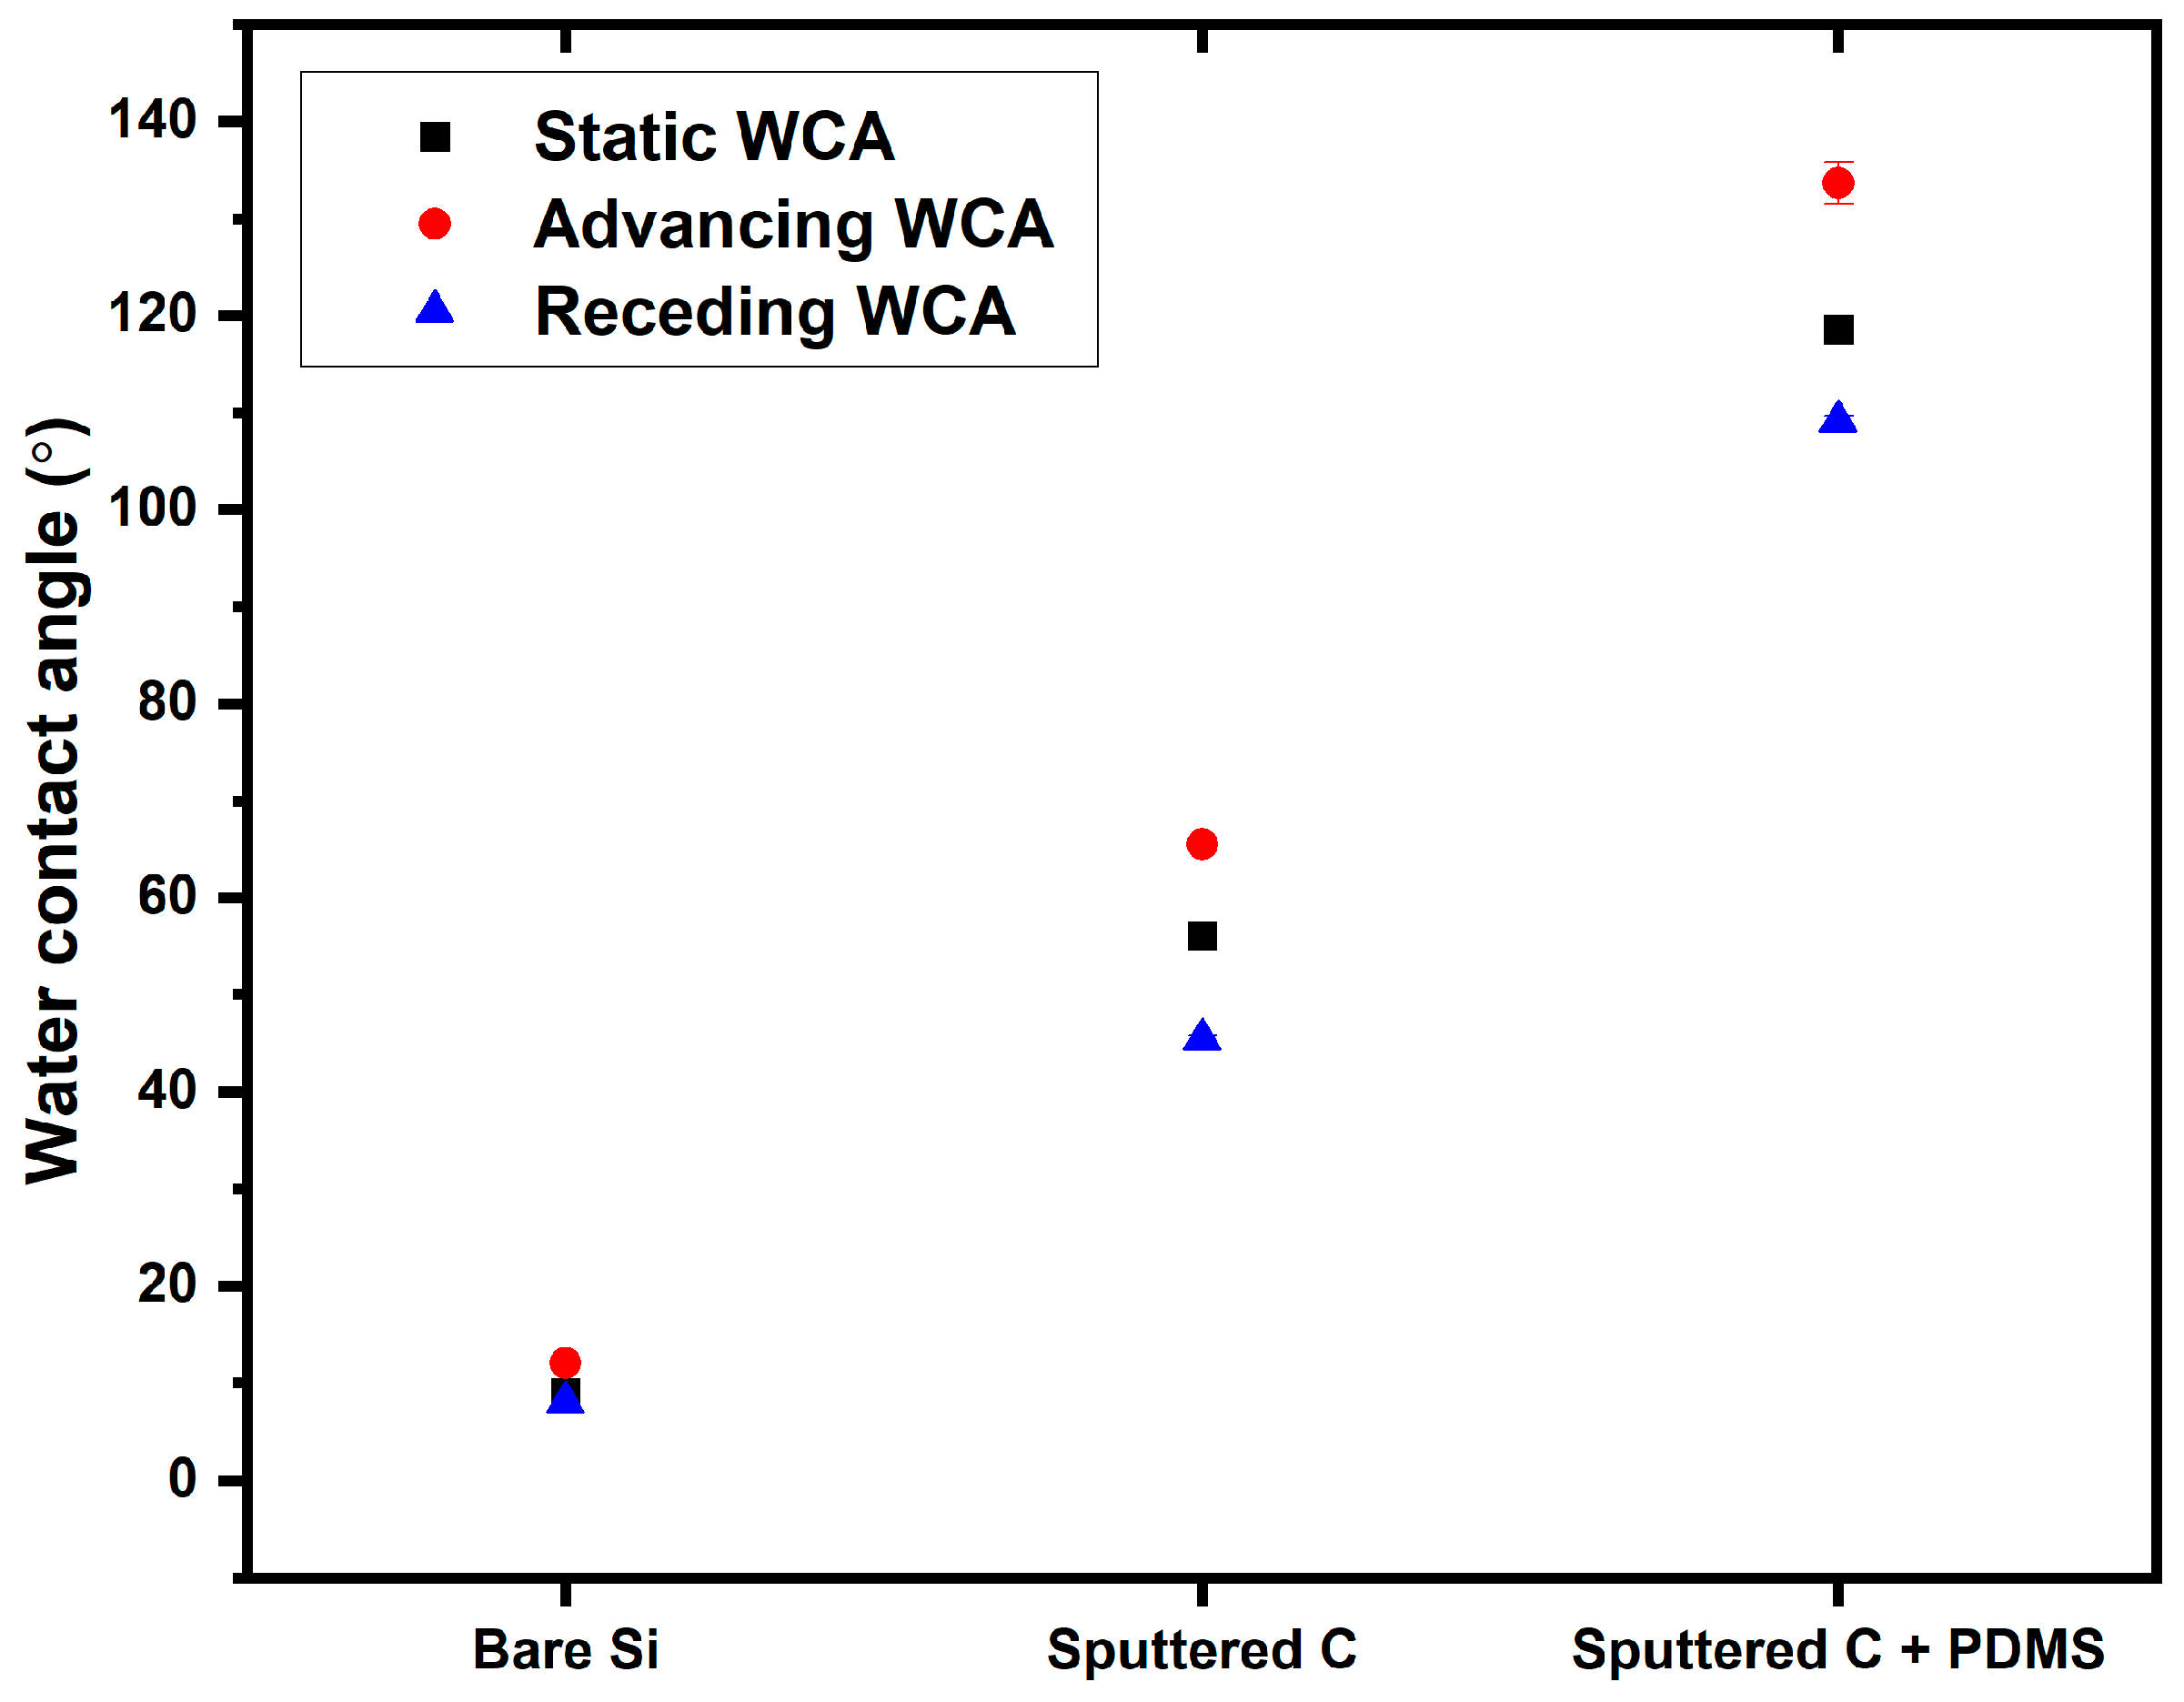
3.1. Material Characterization

SEM was used to characterize the surface morphology of the sputtered carbon coatings that were deposited at three different throw distances (4, 12, 20 cm). As shown in Figure 1, coatings produced at the 4 cm throw distance were more porous than the other two. We attribute this substantial difference in morphology to the directionality (or lack thereof) of the sputtering process. Based on previous calculations [18], the mean free path for carbon atoms in this process is 1.32 cm. Accordingly, at a throw distance of 12 or 20 cm, the process should be non-directional. However, at a 4 cm throw distance, carbon atoms only have to travel three mean free paths, which should lead to a more directional process. This directional sputtering results in a highly porous morphology. Due to the greater porosity of the fibers produced with the 4 cm throw distance, only these fibers were considered in this study. The thicknesses of sputtered coatings were measured by SEM (see Supplementary Materials Figure S1). The small globules/spots in Figure 1d provide visual evidence for PDMS deposition on the sputtered carbon coating. In addition, as was the case in our previous study [20], spectroscopic ellipsometry provided an average thickness of the PDMS coating of 16 nm on witness silicon shards.
XPS and WCA goniometry were also used to analyze the elemental compositions and hydrophobic natures of the surfaces, respectively. However, because of their small size, sputtered SPME fibers are difficult to characterize using XPS and WCA goniometry. Thus, the same deposition processes were replicated on witness silicon shards, which were then characterized by XPS and WCA goniometry. Figure 2 shows the XPS survey spectra [42] of a bare silicon wafer, carbon sputtered on a silicon wafer, and PDMS deposited on a sputtered carbon surface. The expected changes in the elemental compositions of the materials are evident. For example, the bare silicon wafer shows the expected O 1s, O 2s, O Auger, Si 2s, Si 2p, and C 1s signals, where the C 1s signal is attributed to adventitious carbon (surface contamination). After sputtering of carbon, a drastic increase in the C 1s signal is observed, while the Si 2s, Si 2p, and O 1s signals decrease substantially. The C to O atomic ratio (ca. 7:1) obtained from the survey scan of the sputtered carbon coating suggests a significant amount of sp2 character in the upper 5–10 nm of the material, which is the sampling depth of XPS. This is consistent with the C 1s narrow scan of the material, which basically shows a single peak with significant asymmetry (a tail toward higher binding energy) (see Supplementary Materials Figure S2). Strong Si 2s, Si 2p, and O 1s signals are again observed after PDMS deposition on the carbon surface. The advancing WCAs are consistent with the expected changes in the material, changing from ca. 12° for the bare silicon surface, to 65° for the carbon-coated surface, to 133° for the PDMS-coated surface (see Figure 3, which also shows the static and receding contact angles for these surfaces). These results suggest that the bare carbon surface has both sp2 character and C-O containing functional groups. The PDMS stationary phase presumably then adds more functionality to this material.

3.2. HS–SPME–GC–MS Evaluation of Sputtered Carbon Fibers with Commercially Available Test Mixes

Four different sputtered carbon SPME fibers were prepared with carbon thicknesses of 0.25, 2.5, 11.5, 20 µm, and were coated with the PDMS stationary phase [20]. Carbon is expected to provide complicated interactions with analytes, i.e., via sp2 type graphitic carbon and oxygenated carbon species. The interactions of the analytes with the PDMS stationary phase are also expected to be substantial, where the PDMS is expected to help trap/retain analytes. Initial testing of the fibers was conducted with a mixture of commercially available Kovats’ and Grob’s test mixes. These analyses were performed in HS mode (by HS–SPME–GC–MS) because of the volatile nature of many of the analytes in these mixes. As shown in Figure 4, the analytical responses of our sputtered carbon fibers are less than desired for some of the compounds, e.g., 2,3-butanediol and 1-octanol, but this observation is expected given the hydrophobic nature of sp2 carbon and PDMS. In addition, the hydrophobic compounds such as heptane and octane, which were extracted more efficiently, showed higher variability than desired (note the y-error bars (standard deviations) in Figure 4). These observations are consistent with previous studies, as Linford et al. demonstrated that sputtered silicon coatings perform better in DI mod [19,20]. The lower-than-desired analytical response of our sputtered carbon fibers in HS mode may be attributed to the inefficiency of extraction of some analytes with high vapor pressures and lower molecular weights because of the relatively thin coatings of our SPME fibers, i.e., when compared with the 95 µm carbon wide range (CWR) commercially available SPME fiber. In general, the thicker sputtered carbon coatings seem to show higher responses, which is consistent with intuition and the aforementioned theory. Accordingly, we chose to further study the 11.5 µm sputtered carbon fibers with our custom evaluation mix (see next section) because it provided the best level of performance, i.e., the highest sum of responses of all compounds relative to the other thicknesses.

3.3. New SPME Evaluation Mix

While results from the Kovats’ and Grob’s test mixes suggested that the 11.5 µm sputtered carbon SPME fiber was our best performing fiber, the combined mixes do not have the desired chemical diversity. More specifically, one-third of the compounds, i.e., five of the fourteen, are alkanes (see Figure 4), and only a few additional functional groups are represented in the remaining nine compounds. Accordingly, we set out to develop our own custom test mix to capture a more diverse selection of functional groups and compounds of interest. The list of these fifteen compounds, including their structures, functional groups, and properties is provided in Table 1.

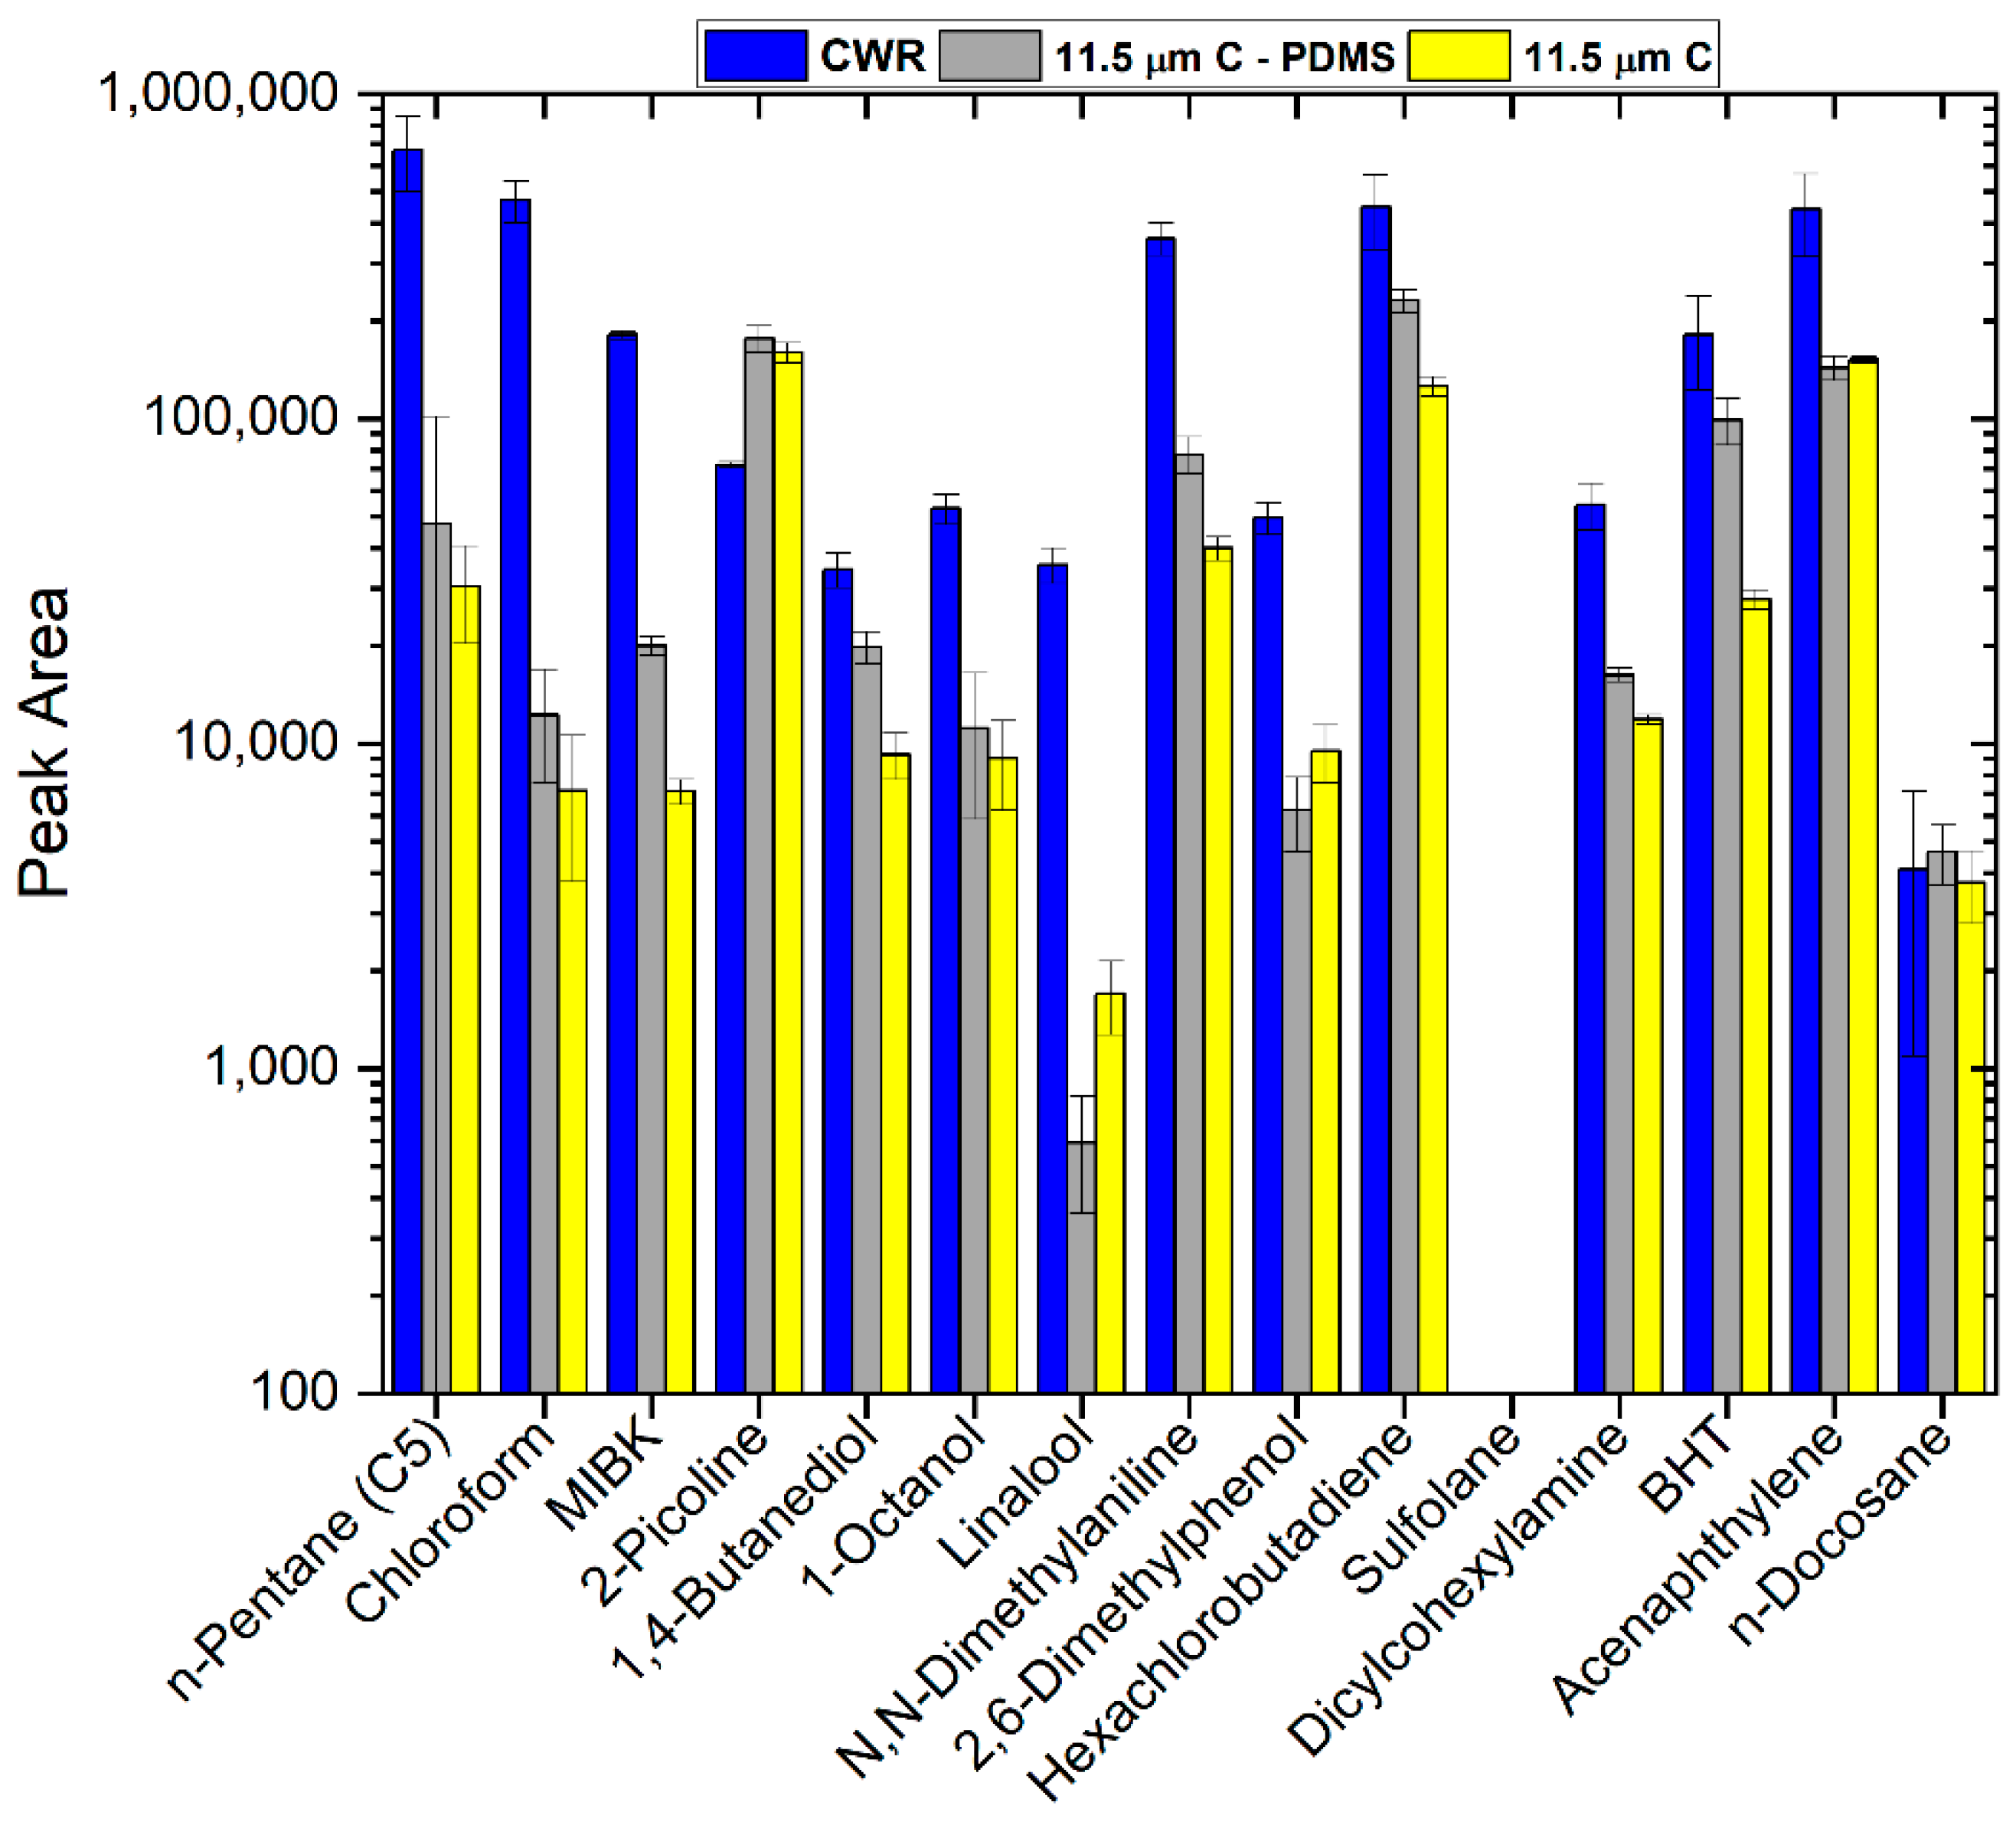
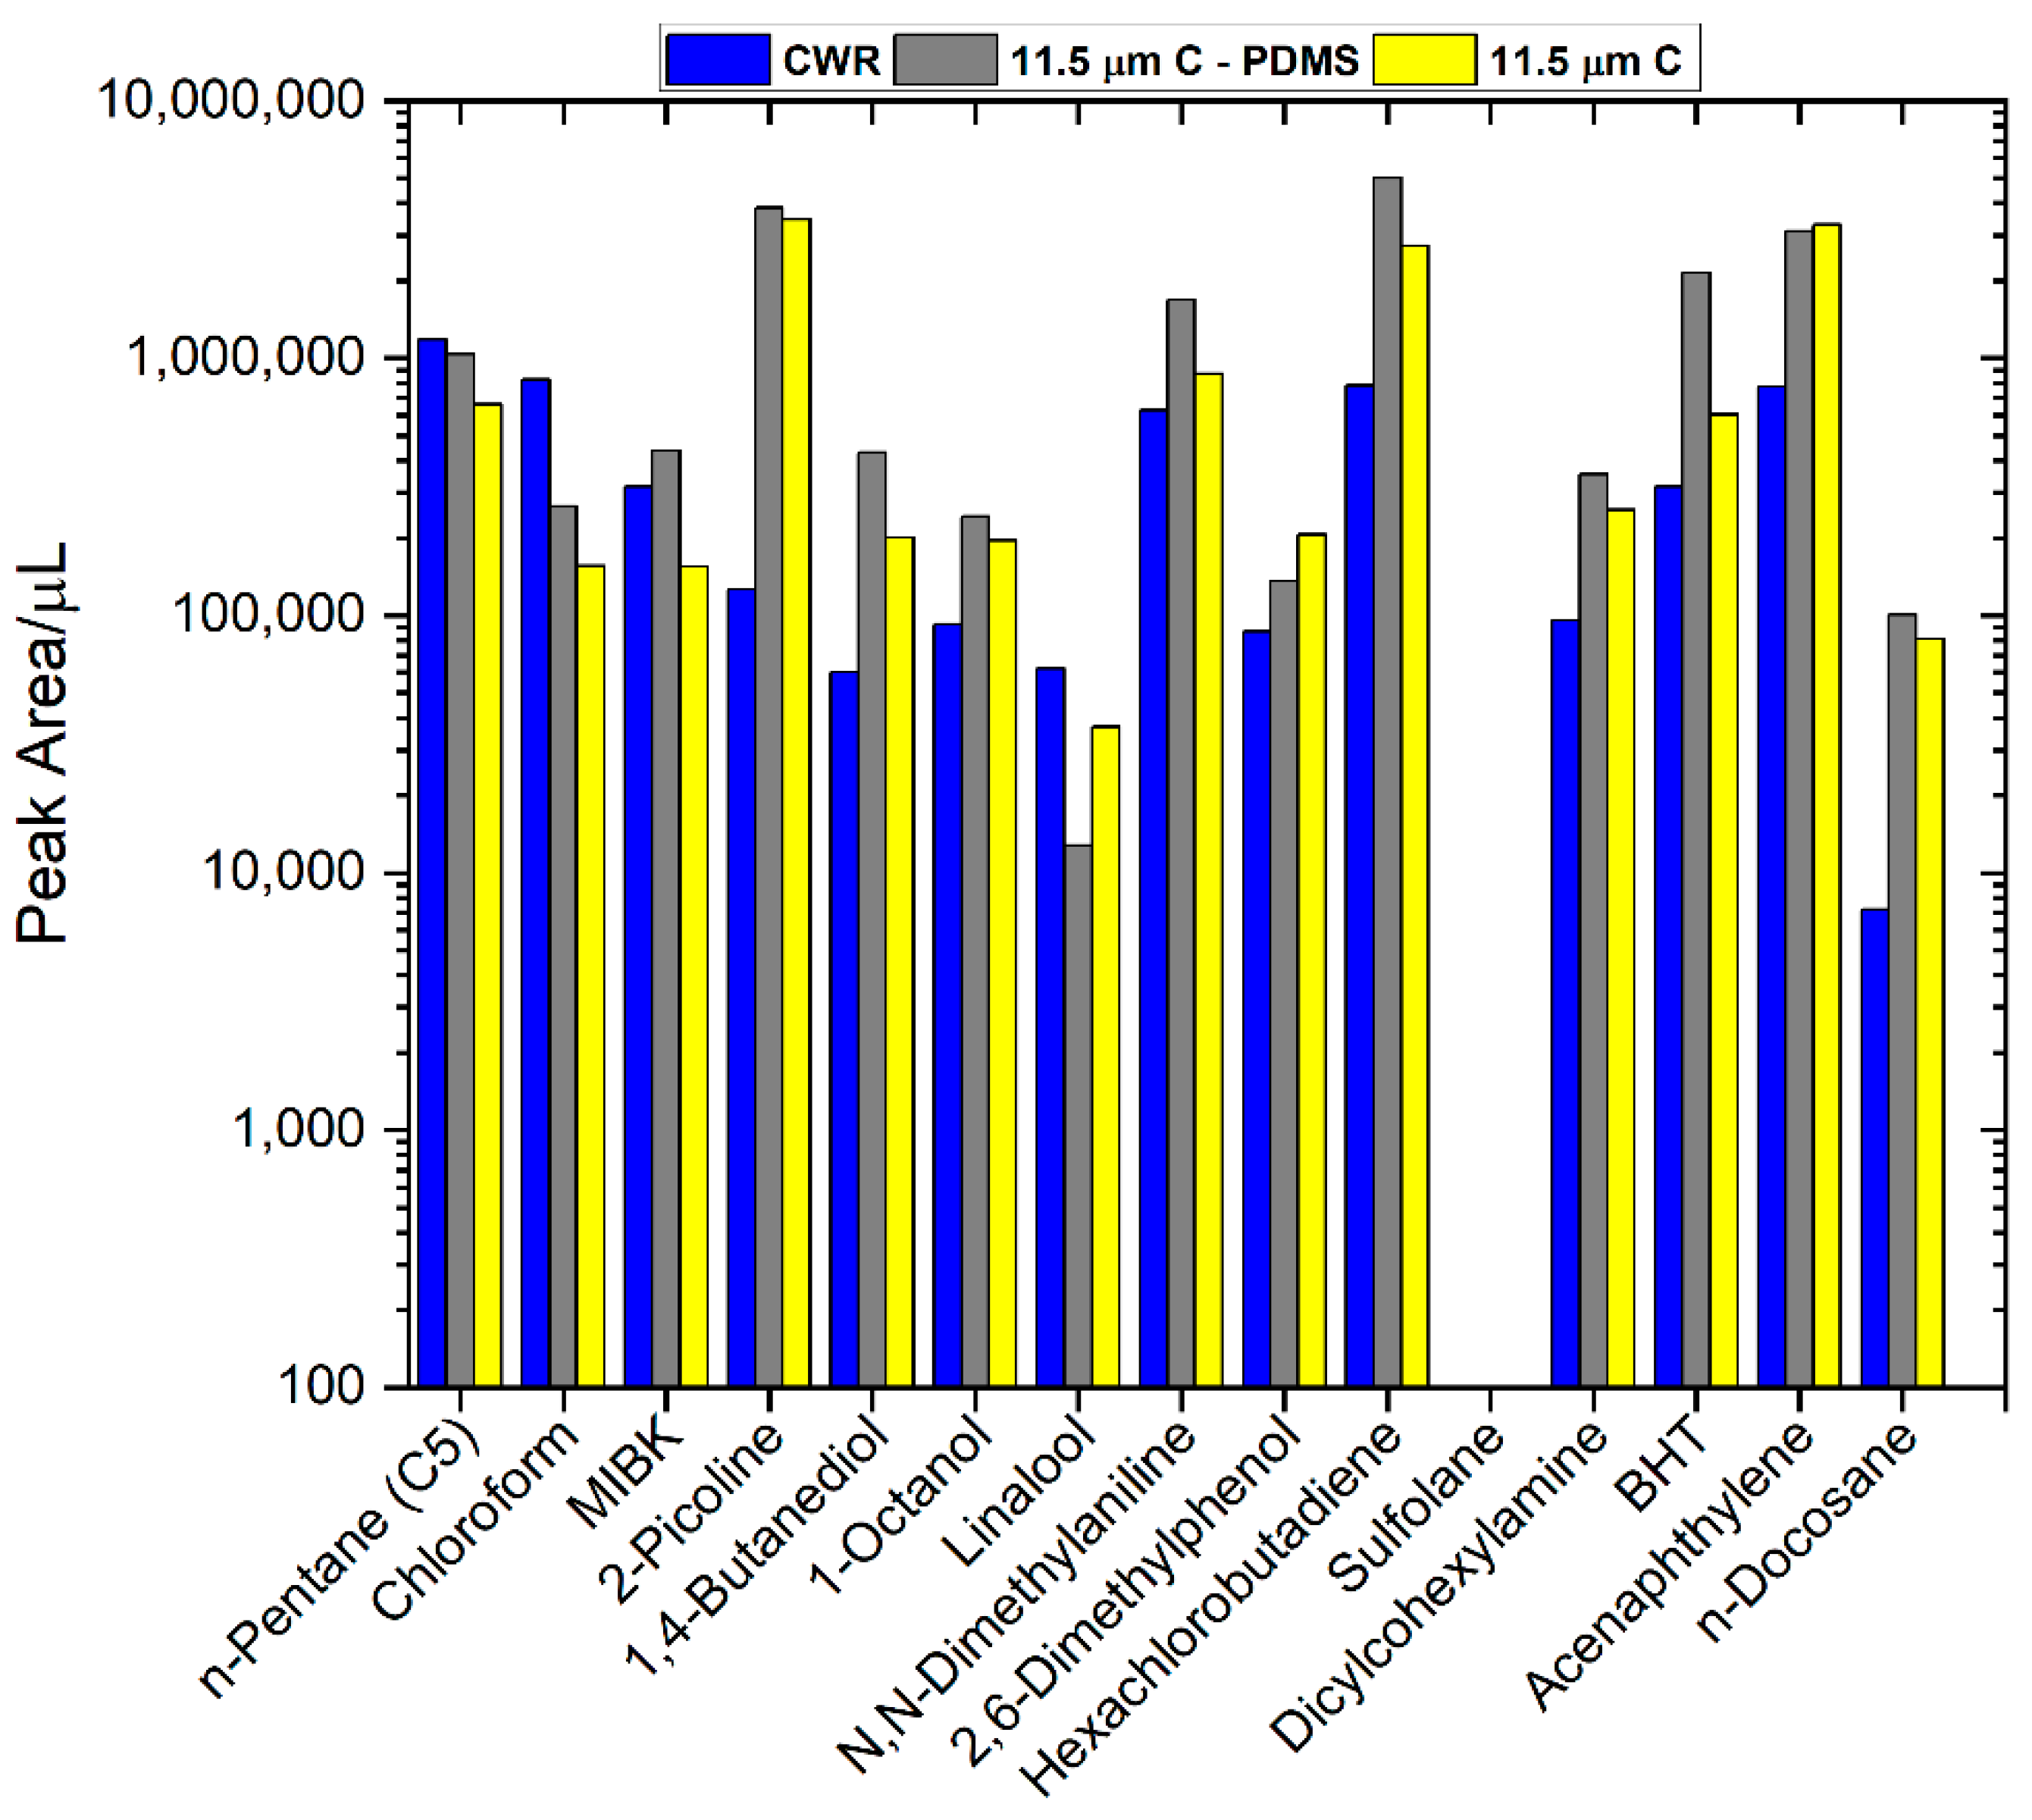
3.4. Comparison of Commercial CWR and Sputtered Carbon SPME Fibers with Our New Test Mix

Figure 5 shows a comparison of our 11.5 µm sputtered carbon SPME fibers (with and without PDMS) to the commercial CWR SPME fiber using our new test mix. Notably, this comparison was made in direct immersion mode. Sulfolane in our new test mix was not detected for any of the fibers, which suggests that using sulfolane in the custom test mix was successful in demonstrating that carbon-based SPME fibers lack the appropriate polarity and strength to overcome sulfolane’s strong affinity for water. This observation may prove useful in the future when evaluating more polar stationary phases, which are virtually absent from the commercial SPME market. When considering the raw data for the remaining fourteen probes, with the exception of 2-picoline and docosane, the commercial CWR fiber outperforms the sputtered carbon fibers. The 2-picoline observation (p ≤ 0.05) suggests that the sputtered carbon SPME fiber has a particularly strong affinity for bases, presumably through carboxyl groups on the carbon surface. It is not clear why the other two bases (dicyclohexylamine and N,N-dimethylaniline) did not exhibit the same affinity for our sputtered carbon fiber as picoline. However, we theorize that any base affinity associated with these compounds may have been preferentially overcome by stronger pi-pi interactions for this aromatic species, which is to be expected of the graphene structures anticipated on both traditional carbon SPME fibers and sputtered carbon SPME fibers. Notably, a direct comparison between the commercial CWR fiber and sputtered carbon fibers is difficult and may not be appropriate because the CWR fiber is considerably thicker, i.e., 95 µm vs. 11.5 µm. These results suggest that phase thickness/capacity may dominate any functional group selectivity, which is not unexpected. The fact that the custom test mix did not reveal any significant differences in functional group affinities, except for 2-picoline, is consistent with the fact that all three fibers are composed of carbon.
It is important to note that the ratios of the signals from the commercial CWR fiber (95 µm) to our 11.5 µm carbon fiber were greater than or equal to 8:1 for pentane, chloroform, MIBK, linalool, and 2,6-dimethylphenol, where this ratio is approximately that of the carbon thicknesses on the fibers. However, the ratios of the signals from the remaining nine compounds were 3:1 or less, suggesting that the morphology/chemistry of the sputtered carbon fibers was able to overcome the phase thickness discrepancy for the majority of compounds evaluated. It is difficult to draw any definitive conclusions about these results without comparable phase thicknesses. Nevertheless, while phase thickness is an important consideration for extraction/desorption efficiencies and capacity, our previous work comparing 100 µm PDMS traditional SPME fibers to 100 µm SPME Arrows, indicates that phase volume must be considered [43]. For example, the SPME Arrow has ca. 6 times the phase volume of a traditional SPME fiber (with the same 100 µm phase thickness), and it produced ca. 4× the response, on average, for 92 VOCs evaluated [43]. Albeit a rather intuitive observation, these previous conclusions highlight the importance of phase volume and therefore suggest that correcting the current results for phase volume may provide more insightful comparisons on the strength/extraction capacity of our sputtered carbon fibers. The 95 µm commercial CWR fiber and the sputtered carbon fibers have phase volumes of ca. 0.60 and 0.05 µL, respectively. Figure 6 shows a comparison of our sputtered carbon fibers, with and without PDMS, with the commercial CWR fiber, where the analytical response has been normalized to phase volume, i.e., analytical response/phase volume. These results show that on a per volume basis, our fiber is competitive with the commercial fiber, often outperforming it. In most cases, the PDMS-coated sputtered fiber performed better than the bare fiber.
The volume-normalized responses in Figure 6 are significantly (p ≤ 0.05) higher for our sputtered carbon SPME fibers (with and without PDMS) than the commercial CWR SPME fibers, with the exception of those for n-pentane, chloroform, and linalool. However, it is not clear from these results whether the sputtered carbon fibers extract and/or desorb more efficiently. The extraction strength of our sputtered carbon fibers is consistent with our previous observations that the cauliflower morphology of the sputtered SPME fibers affords a great deal of surface area for extraction [19,20]. In addition, our previous carry-over studies have demonstrated that sputtered SPME fibers desorb more efficiently [19,20]. The implications of the current observations and those of previous studies are that both sputtering silicon and carbon (with and without functionalization, e.g., PDMS and 6-phenylhexylsilane) is a powerful approach to improving SPME fiber responses, especially if the sputtered surfaces were to be applied at volumes comparable to the commercially available SPME fibers, e.g., 95 µm.

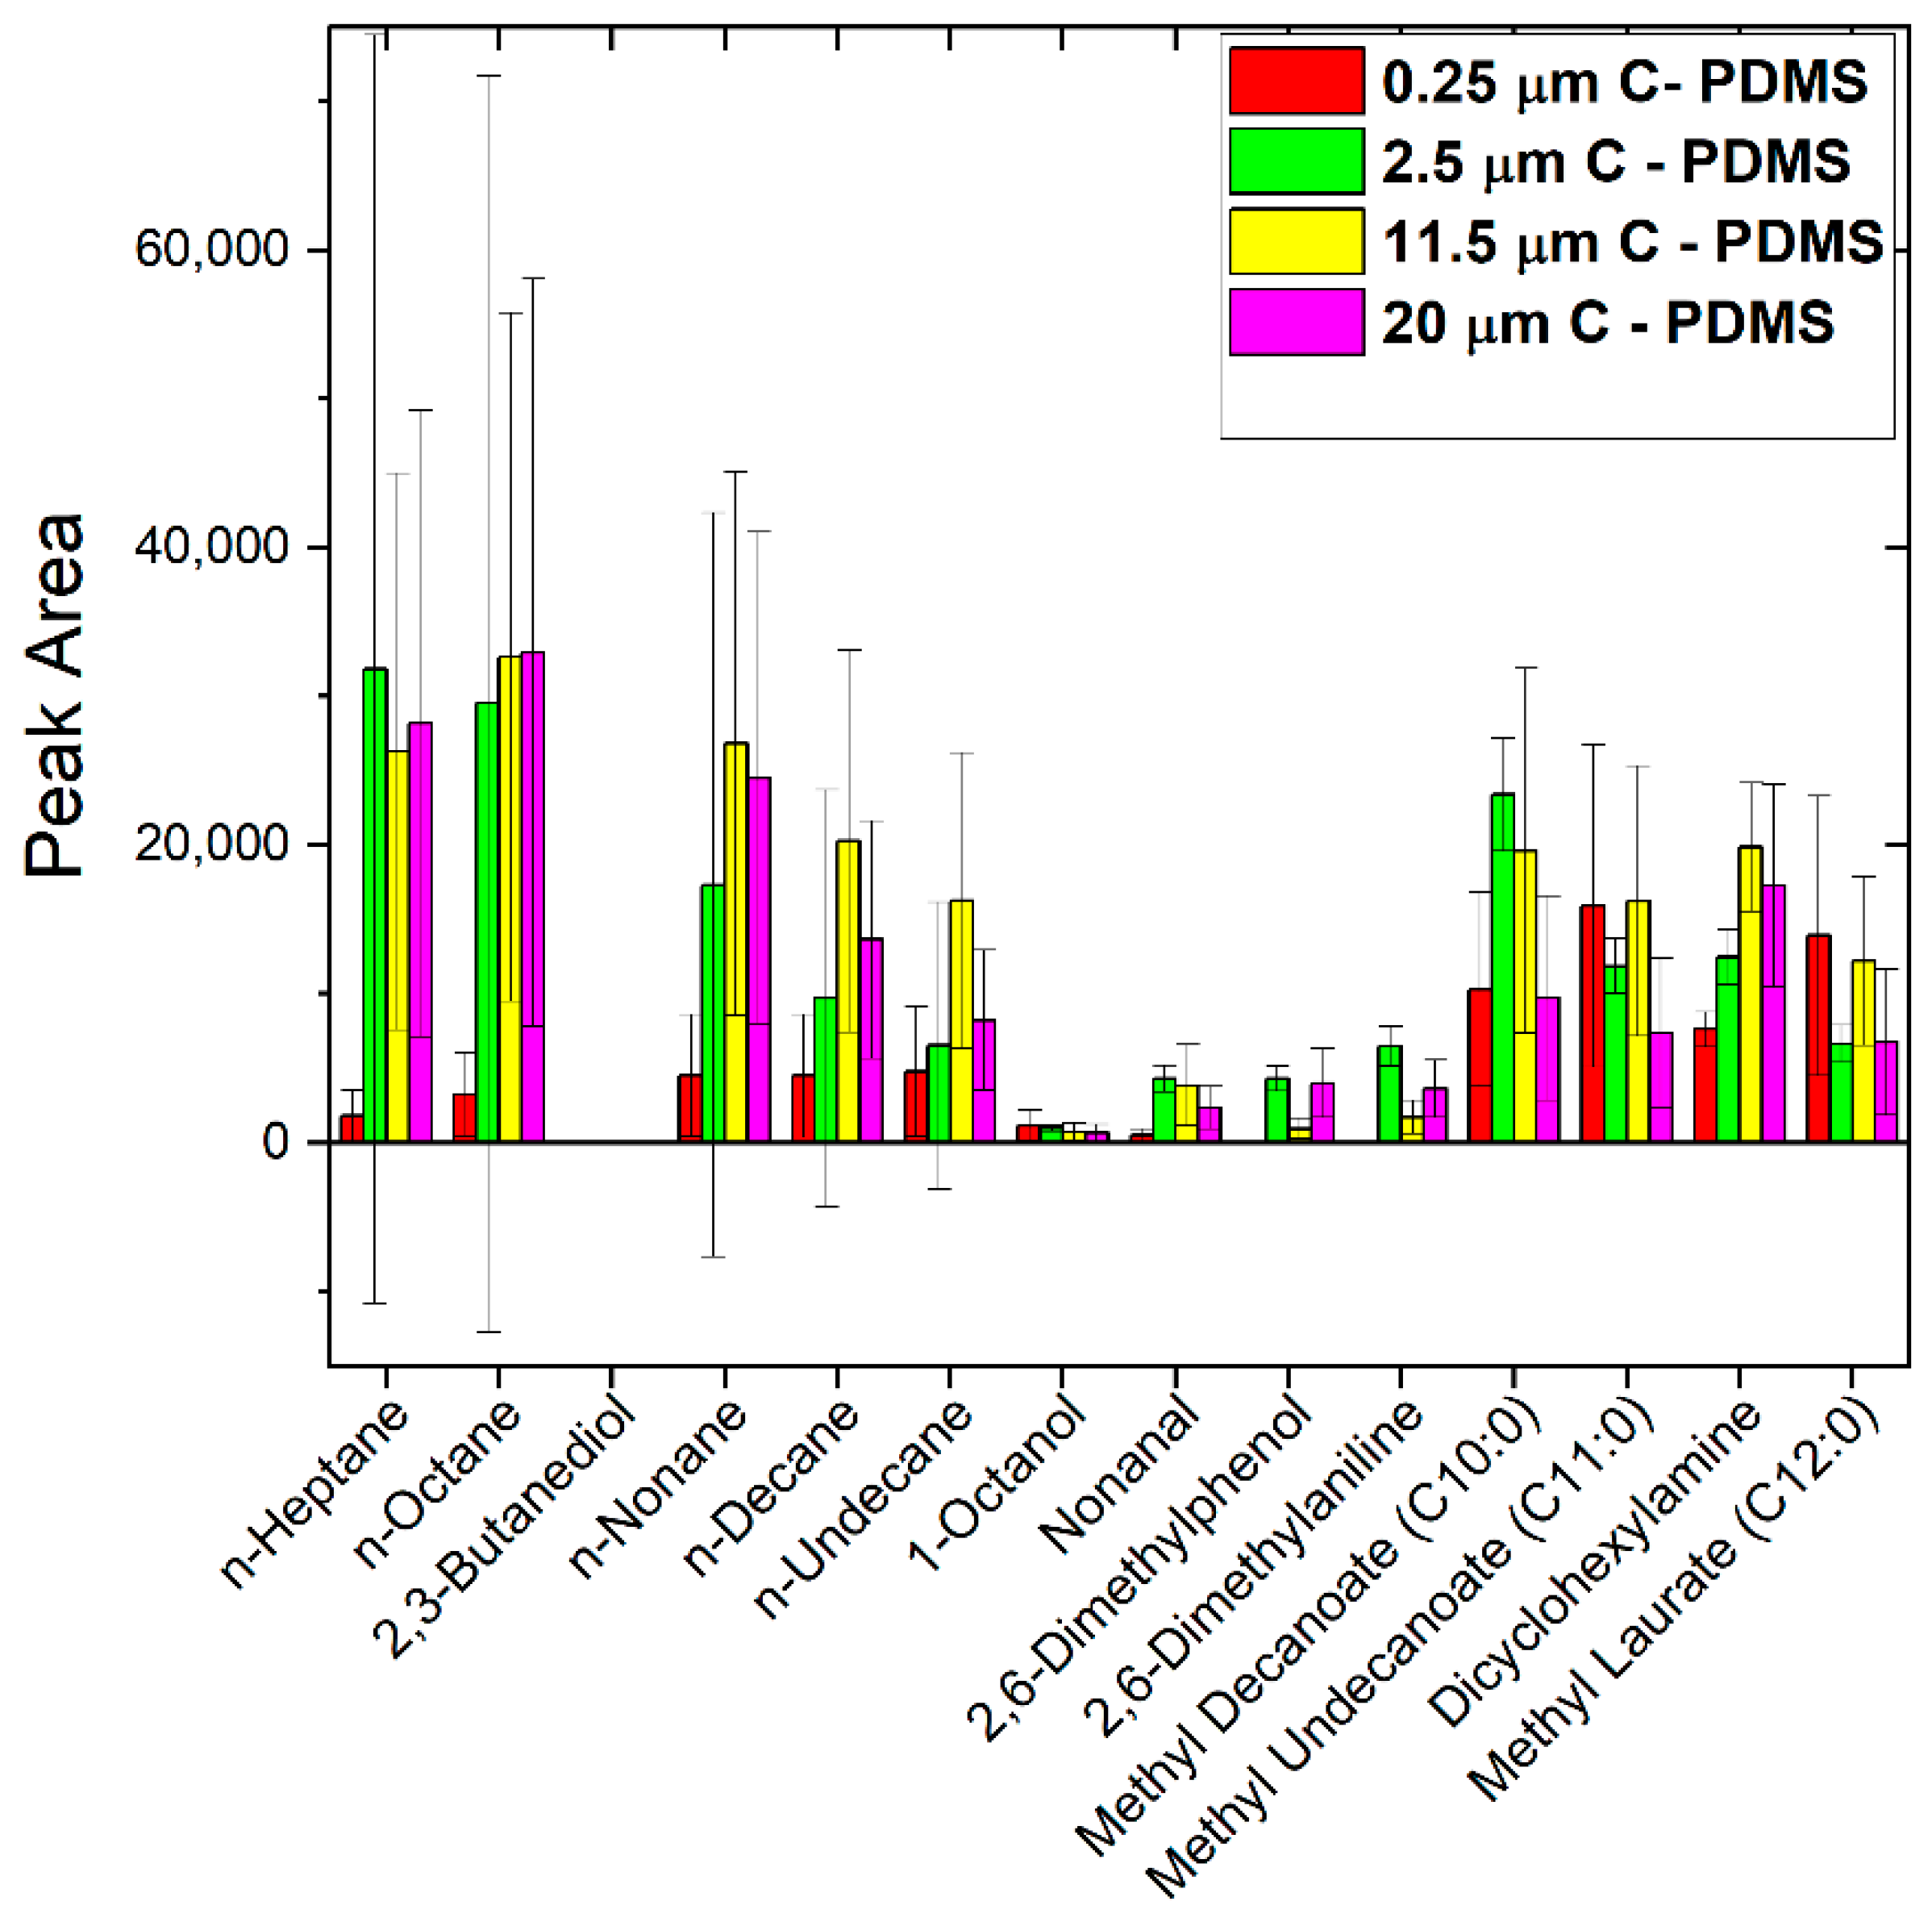
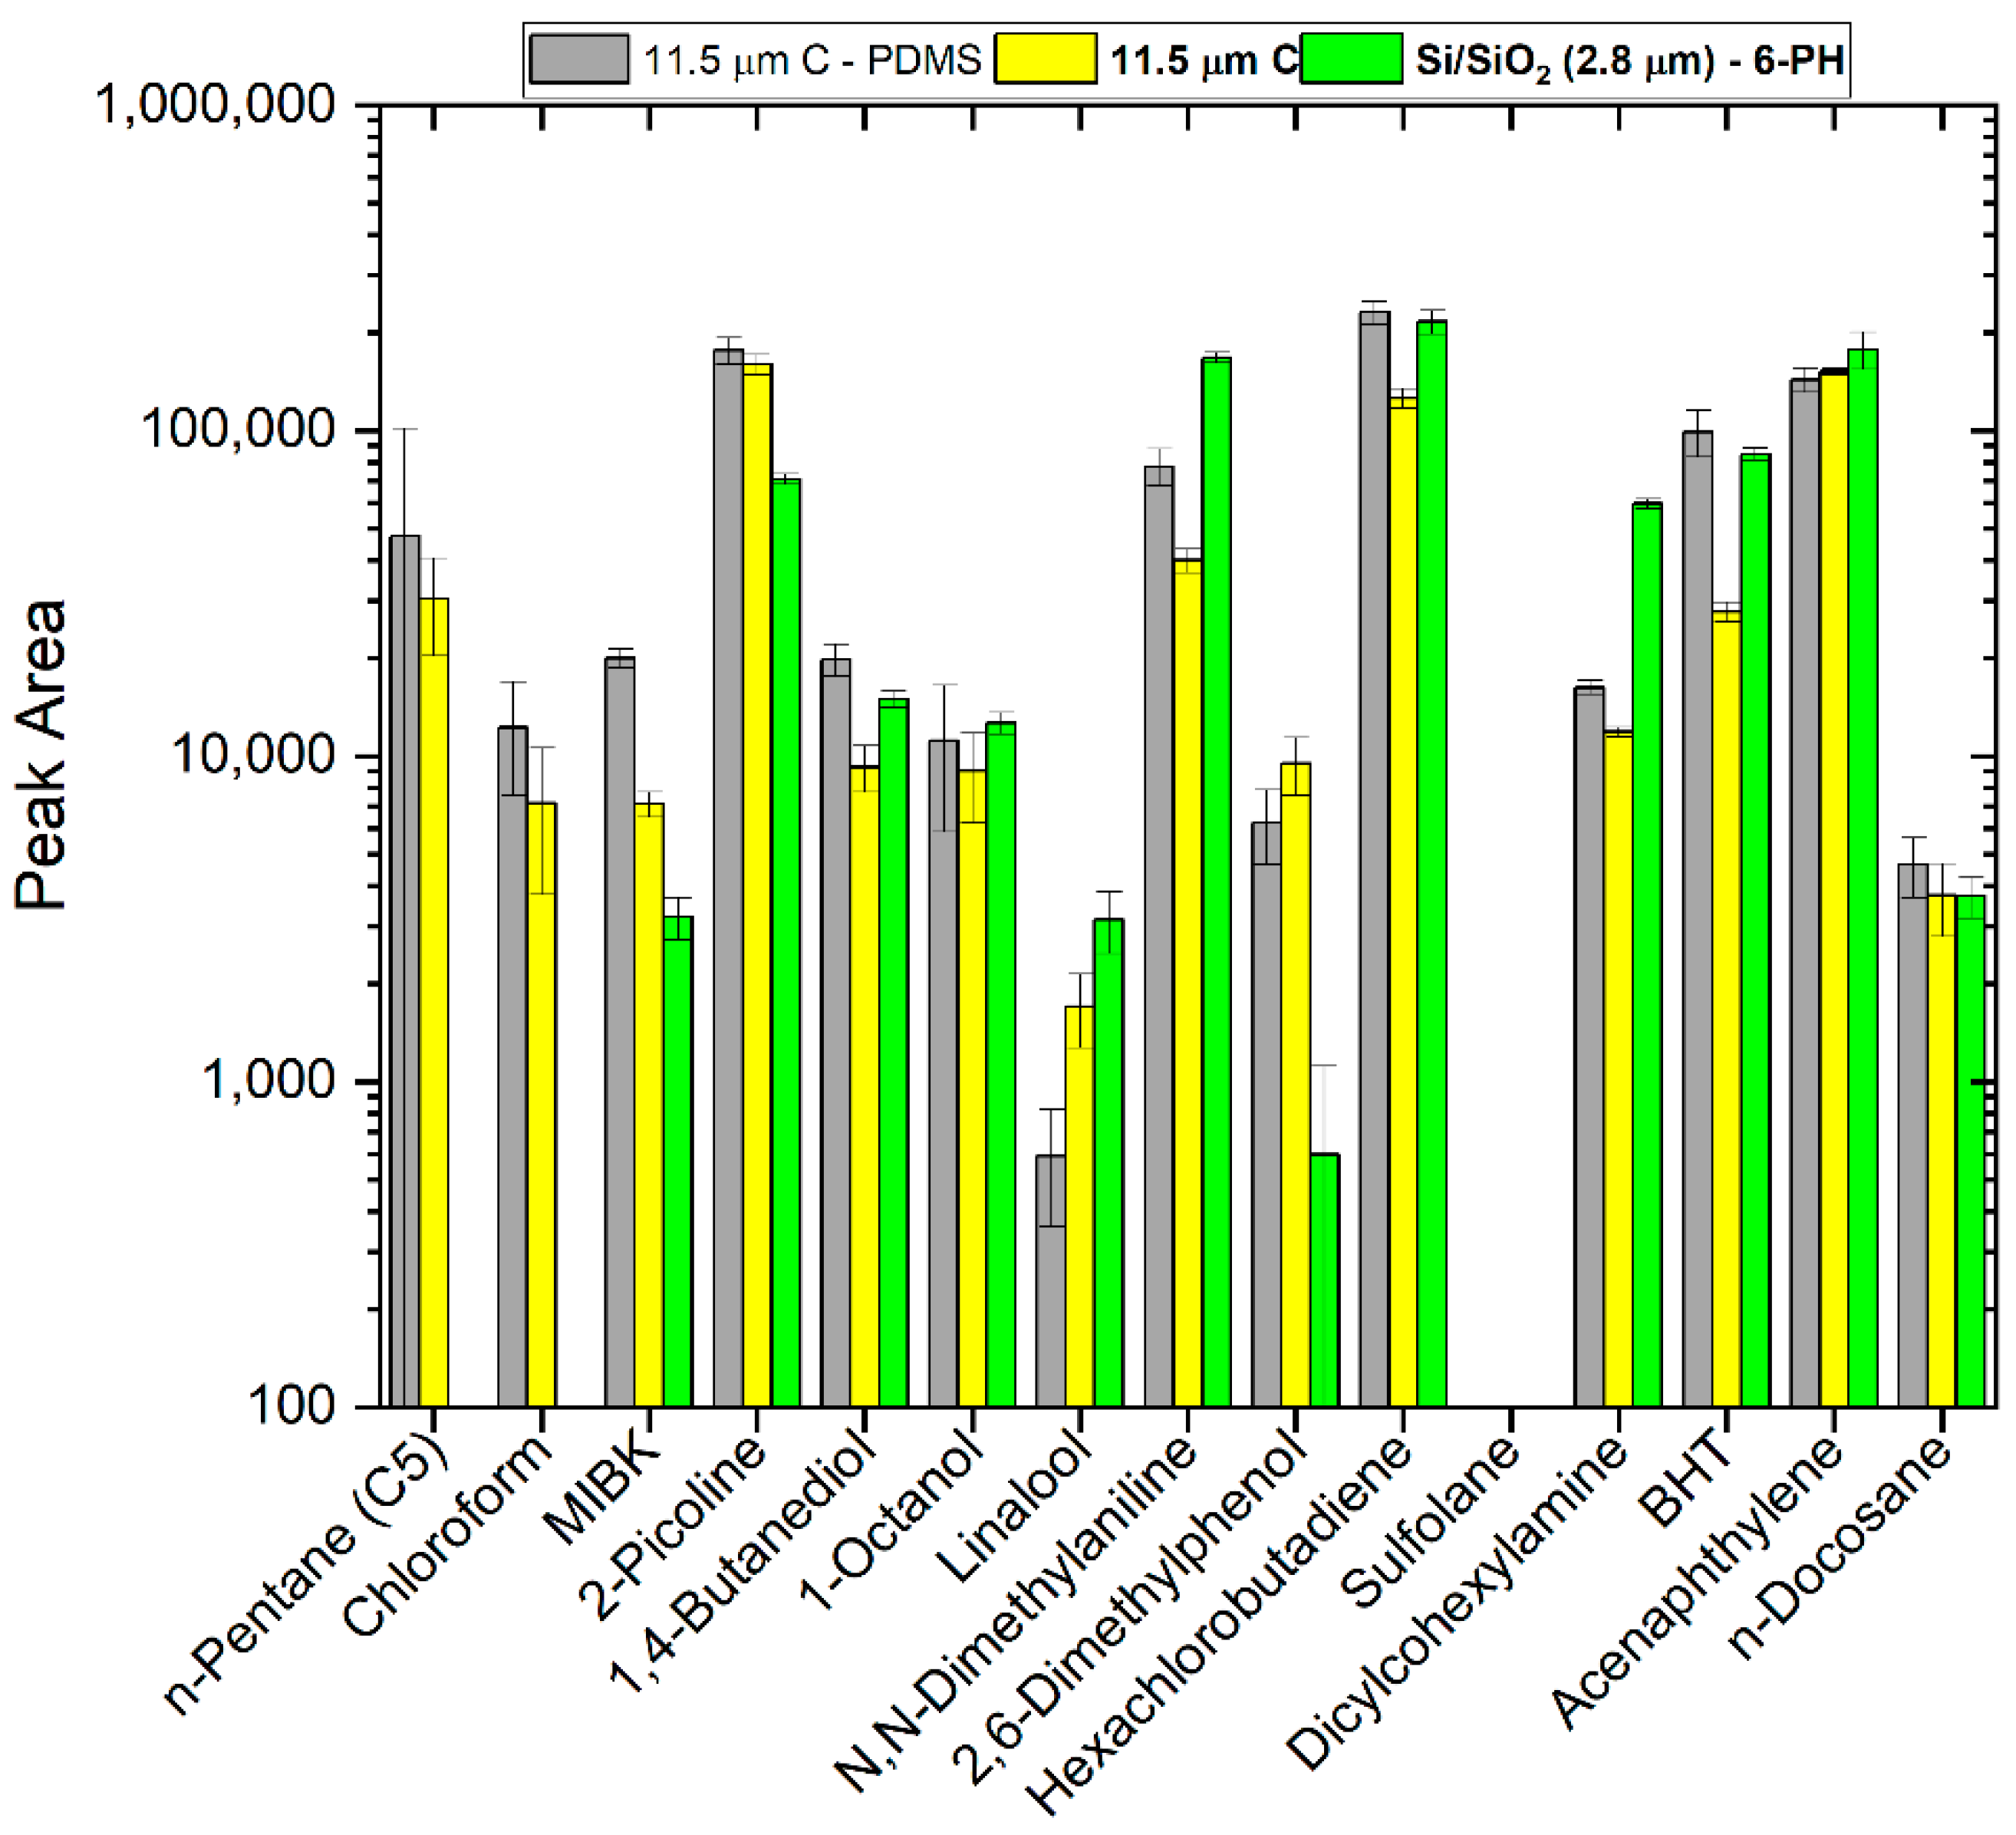
3.5. Comparison of Sputtered Carbon and Silicon SPME Fibers with Our New Test Mix

One of the objectives of the current study was to develop a test mix with a diverse set of functional groups, which, in theory, will help investigators elucidate differences among SPME fiber coatings. In the text above, we compared the commercial CWR SPME fiber and our sputtered carbon SPME fibers (with and without PDMS). Despite all three fiber configurations being carbon based, we aimed to elucidate functional group affinities, which are attributable to the cauliflower morphology of our sputtered fibers and their sp2 carbon (and other chemical) characteristics. We are able to confidently assert that our sputtered carbon fibers have a strong affinity for 2-picoline and potentially other bases, presumably through carboxyl groups on its surface. Beyond the aforementioned observation, it is difficult to draw any definitive conclusions on additional functional group affinities. Consequently, we compared the current sputtered carbon SPME fibers (with and without PDMS) with our previous sputtered silicon SPME fibers (with 6-phenylhexlsilane) in an attempt to draw out differences among these SPME fiber coatings using our custom test mix [19]. The results of this experiment are shown in Figure 7, where both sputtered carbon fibers outperformed the sputtered silicon fiber, except for 1-octanol, linalool, N-N-dimethylamine, dicyclohexylamine, and acenaphthylene.
Similar to the previous comparisons with the commercial CWR SPME fiber, a majority of these observations may be attributable to phase thickness/volume. However, the performance of sputtered silicon SPME fibers with N,N-dimethylamine and dicyclohexylamine was significantly higher (p ≤ 0.05) than for the sputtered carbon SPME fibers. This trend is present despite the fact that the sputtered silicon fiber has less phase volume than the sputtered carbon fibers, i.e., 2.8 µm vs. 11.5 µm thickness, respectively. These results suggest a legitimate functional group affinity to the sputtered silicon phase. In particular, N,N-dimethylamine and dicyclohexylamine were chosen to potentially demonstrate irreversible adsorption, which may be the case with the sputtered carbon fibers. Nevertheless, this adsorption was not entirely irreversible on the sputtered carbon fibers, i.e., there is a response for N,N-dimethylamine and dicyclohexylamine. The sputtered silicon SPME fiber does not extract pentane and chloroform at all. These C5 and C1 compounds were probably not extracted due to a lack of phase thickness of the sputtered silicon relative to the sputtered carbon fibers. It is possible these compounds were never extracted, and/or they desorbed/were lost before the fiber reached the GC inlet. Another possibility is that these lower molecular weight species were replaced by higher molecular weight compounds due to competitive adsorption, which we have previously observed with our sputtered fibers [18,19,20]. This observation would otherwise have been missed by the Kovats’ and Grob’s mixes, which only go down to C7 compounds. Overall, the sputtered carbon fiber with PDMS provided higher efficiencies over the sputtered carbon fiber without PDMS, with the exception of linalool, 2,6-dimethylphenol, and acenaphthylene. This general trend is probably due to the extra phase thickness/volume/hydrophobicity afforded by the PDMS, regardless of the functional group. However, this observation is only significant (p ≤ 0.05) for half of the compounds. Finally, we note that on a per volume basis, the sputtered silicon fiber outperforms the sputtered carbon fibers for 11 of the 15 compounds in the test mix (see Figure 8). The strong performance of the sputtered silicon fiber is presumably the result of its unique chemistry (aromatic ring, alkyl chain, unfunctionalized silanol groups, and siloxane bonds) and morphology. This chemistry may be more controlled than that of the air-oxidized sputtered carbon.
The new carbon fibers described in this work are reusable, i.e., the results shown here were generated from multiple runs on the same fibers. In addition, our previous work with sputtered SPME fibers has demonstrated that our sputtered coatings are robust enough for numerous (hundreds of) runs. However, because we deposited our coatings on a traditional SPME fiber platform, they should suffer the same fate as commercially available, traditional SPME fibers, i.e., mechanical failures [43]. Extensive lifetime testing has not been performed on the current carbon fibers. Future work will need to address this issue.

4. Conclusions

A sputtered carbon SPME fiber deposited at different throw distances was explored. These coatings were characterized by SEM, XPS, SE, and contact angle goniometry. The best coatings produced (11.5 µm carbon, with and without PDMS) were evaluated by DI–GC–MS. Sputtered carbon SPME fibers showed similar functional group selectivity as commercial CWR fibers. However, the sputtered morphology has again shown the ability to overcome phase thickness/volume discrepancies and increase the relative recovery for some compounds. Additionally, a new SPME evaluation mix was developed, which consists of 15 compounds with different functional groups and chemical properties. Pentane, chloroform, 2-picoline, and sulfolane provided valuable insights into the coating/stationary phase behavior, which would otherwise have been missed by the traditional probe mixes. N,N-dimethylamine and dicyclohexylamine, which are present in the Kovats’ and Grob’s test mixes, continue to show their value in the current study. The sputtered carbon fibers showed better responses per volume of the coatings than the commercial CWR fibers. Future work may include expanding the test mix to include fatty acids, nitro groups, and pesticides of interest. In addition, a more systematic exploration of this test mix with traditional SPME fibers should be performed.
Our previous and current studies suggest that sputtered SPME fibers offer the following potential advantages, which should be further perused in future research: (i) high surface area/volume ratios afforded by their cauliflower morphology; (ii) the high surface area/volume ratio means sputtered fibers have shown a great deal of promise using very thin films of phase; (iii) as a result of the aforementioned, the fibers tend to exhibit low phase blead and low carryover; (iv) with little phase on the sputtered coatings, the phase swelling/stripping typically encountered with traditional SPME fiber phases during DI mode appears to be absent. These advantages make sputtered SPME devices very promising for DI applications, which are probably the future for SPME devices in general. Future work should also include the investigation of thicker sputtered coatings.

Supplementary Materials

The following are available online at https://www.mdpi.com/article/10.3390/separations8120228/s1, Figure S1: SEM images of cross section of sputtered carbon coatings with thicknesses of (a) 0.5 µm, (b) 2.5 µm, (c) 11.5 µm, and (d) 20 µm. Figure S2: XPS C 1s narrow scan of sputtered carbon coatings with and without PDMS.

Author Contributions

Conceptualization, D.I.P., J.S.H. and M.R.L.; investigation, D.I.P., C.M., T.R. and C.J.; resources, J.S.H. and M.R.L.; data curation, D.I.P., C.M. and J.S.H.; writing—original draft preparation, D.I.P. and J.S.H.; writing—review and editing, J.S.H. and M.R.L.; supervision, M.R.L.; project administration, M.R.L.; funding acquisition, M.R.L. All authors have read and agreed to the published version of the manuscript.

Funding

This article was funded by ‘Restek Corp’.

Institutional Review Board Statement

Not applicable.

Informed Consent Statement

Not applicable.

Data Availability Statement

Upon appropriate and timely request, the data used herein will be available.

Acknowledgments

We acknowledge David S. Bell from Restek Corporation for his support and valuable conversations on this project.

Conflicts of Interest

Some of the authors and entities on this paper could benefit financially from the commercialization of the fibers described herein.

References

  1. Arthur, C.L.; Pawliszyn, J. Solid phase microextraction with thermal desorption using fused silica optical fibers. Anal. Chem. 1990, 62, 2145–2148. [Google Scholar] [CrossRef]
  2. Benfenati, E.; Müller, L.; Perani, L.; Pierucci, P. Analysis of industrial pollutants in environmental samples. In Applications of Solid Phase Microextraction; Pawliszyn, J., Ed.; The Royal Society of Chemistry: London, UK, 1999; pp. 333–346. [Google Scholar]
  3. Khaled, A.; Belinato, J.R.; Pawliszyn, J. Rapid and high-throughput screening of multi-residue pharmaceutical drugs in bovine tissue using solid phase microextraction and direct analysis in real time-tandem mass spectrometry (SPME-DART-MS/MS). Talanta 2020, 217, 121095. [Google Scholar] [CrossRef]
  4. Vuckovic, D.; Zhang, X.; Cudjoe, E.; Pawliszyn, J. Solid-phase microextraction in bioanalysis: New devices and directions. J. Chrom. A 2010, 1217, 4041–4060. [Google Scholar] [CrossRef]
  5. Meng, L.; Dai, Y.; Chen, C.; Zhang, J. Determination of amphetamines, ketamine and their metabolites in hair with high-speed grinding and solid-phase microextraction followed by LC-MS. Forensic Sci. Res. 2021, 6, 273–280. [Google Scholar] [CrossRef]
  6. Merkle, S.; Kleeberg, K.K.; Fritsche, J. Recent Developments and Applications of Solid Phase Microextraction (SPME) in Food and Environmental Analysis—A Review. Chromatography 2015, 2, 293–381. [Google Scholar] [CrossRef] [Green Version]
  7. Łyczko, J.; Jałoszyński, K.; Surma, M.; Masztalerz, K.; Szumny, A. HS-SPME Analysis of True Lavender (Lavandula angustifolia Mill.) Leaves Treated by Various Drying Methods. Molecules 2019, 24, 764. [Google Scholar] [CrossRef] [Green Version]
  8. Azenha, M.A.; Nogueira, P.J.; Silva, A.F. Unbreakable solid-phase microextraction fibers obtained by sol-gel deposition on titanium wire. Anal. Chem. 2006, 78, 2071–2074. [Google Scholar] [CrossRef]
  9. Mehdinia, A.; Aziz-Zanjani, M.O. Recent advances in nanomaterials utilized in fiber coatings for solid-phase microextraction. TrAC-Trend Anal. Chem. 2013, 42, 205–215. [Google Scholar] [CrossRef]
  10. Koster, E.H.M.; Crescenzi, C.; Den Hoedt, W.; Ensing, K.; De Jong, G.J. Fibers coated with molecularly imprinted polymers for solid-phase microextraction. Anal. Chem. 2001, 73, 3140–3145. [Google Scholar] [CrossRef] [PubMed]
  11. Rocío-Bautista, P.; Pacheco-Fernández, I.; Pasán, J.; Pino, V. Are metal-organic frameworks able to provide a new generation of solid-phase microextraction coatings?—A review. Anal. Chim. Acta 2016, 939, 26–41. [Google Scholar] [CrossRef] [PubMed]
  12. Liu, J.-F.; Li, N.; Jiang, G.-B.; Liu, J.-M.; Jönsson, J.Å.; Wen, M.-J. Disposable ionic liquid coating for headspace solid-phase microextraction of benzene, toluene, ethylbenzene, and xylenes in paints followed by gas chromatography–flame ionization detection. J. Chrom. A 2005, 1066, 27–32. [Google Scholar] [CrossRef]
  13. Ji, J.; Liu, H.; Chen, J.; Zeng, J.; Huang, J.; Gao, L.; Wang, Y.; Chen, X. ZnO nanorod coating for solid phase microextraction and its applications for the analysis of aldehydes in instant noodle samples. J. Chrom. A 2012, 1246, 22–27. [Google Scholar] [CrossRef]
  14. Zhang, Z.; Wang, Q.; Li, G. Fabrication of novel nanoporous array anodic alumina solid-phase microextraction fiber coating and its potential application for headspace sampling of biological volatile organic compounds. Anal. Chim. Acta 2012, 727, 13–19. [Google Scholar] [CrossRef]
  15. Ghaemi, F.; Amiri, A.; Yunus, R. Methods for coating solid-phase microextraction fibers with carbon nanotubes. TrAC Trends Anal. Chem. 2014, 59, 133–143. [Google Scholar] [CrossRef]
  16. Chen, J.; Zou, J.; Zeng, J.; Song, X.; Ji, J.; Wang, Y.; Ha, J.; Chen, X. Preparation and evaluation of graphene-coated solid-phase microextraction fiber. Anal. Chim. Acta 2010, 678, 44–49. [Google Scholar] [CrossRef] [PubMed]
  17. Zhang, S.; Li, Z.; Yang, X.; Wang, C.; Wang, Z. Fabrication of a three-dimensional graphene coating for solid-phase microextraction of polycyclic aromatic hydrocarbons. RSC Adv. 2015, 5, 54329–54337. [Google Scholar] [CrossRef]
  18. Diwan, A.; Singh, B.; Roychowdhury, T.; Yan, D.; Tedone, L.; Nesterenko, P.N.; Paull, B.; Sevy, E.T.; Shellie, R.A.; Kaykhaii, M.; et al. Porous, high capacity coatings for solid phase microextraction by sputtering. Anal. Chem. 2016, 88, 1593–1600. [Google Scholar] [CrossRef]
  19. Patel, D.I.; Roychowdhury, T.; Shah, D.; Jacobsen, C.; Herrington, J.S.; Hoisington, J.; Myers, C.; Salazar, B.G.; Walker, A.V.; Bell, D.S.; et al. 6-Phenylhexyl silane derivatized, sputtered silicon solid phase microextraction fiber for the parts-per-trillion detection of polyaromatic hydrocarbons in water and baby formula. J. Sep. Sci. 2021, 44, 2824–2836. [Google Scholar] [CrossRef]
  20. Roychowdhury, T.; Patel, D.I.; Shah, D.; Diwan, A.; Kaykhaii, M.; Herrington, J.S.; Bell, D.S.; Linford, M.R. Sputtered silicon solid phase microextraction fibers with a polydimethylsiloxane stationary phase with negligible carry-over and phase bleed. J. Chrom. A 2020, 1623, 461065. [Google Scholar] [CrossRef]
  21. Harris, K.D.; Brett, M.J.; Smy, T.J.; Backhouse, C. Microchannel surface area enhancement using porous thin films. J. Electrochem. Soc. 2000, 147, 2002–2006. [Google Scholar] [CrossRef]
  22. Wu, A.T.; Brett, M.J. Sensing humidity using nanostructured SiO posts: Mechanism and optimization. Sens. Mater. 2001, 13, 399–431. [Google Scholar]
  23. Smith, D.O.; Cohen, M.S.; Weiss, G.P. Oblique-Incidence Anisotropy in Evaporated Permalloy Films. J. Appl. Phys. 1960, 31, 1755–1762. [Google Scholar] [CrossRef]
  24. Dick, B.; Brett, M.J.; Smy, T. Controlled growth of periodic pillars by glancing angle deposition. J. Vac. Sci. Technol. B: Microelectron. Nanometer Struct. Process. Meas. Phenom. 2003, 21, 23–28. [Google Scholar] [CrossRef]
  25. Robbie, K.; Brett, M.J. Sculptured thin films and glancing angle deposition: Growth mechanics and applications. J. Vac. Sci. Technol. A 1997, 15, 1460–1465. [Google Scholar] [CrossRef]
  26. Zhu, F.; Guo, J.; Zeng, F.; Fu, R.; Wu, D.; Luan, T.; Tong, Y.; Lu, T.; Ouyang, G. Preparation and characterization of porous carbon material-coated solid-phase microextraction metal fibers. J. Chrom. A 2010, 1217, 7848–7854. [Google Scholar] [CrossRef]
  27. Wang, X.; Lu, M.; Wang, H.; Huang, P.; Ma, X.; Cao, C.; Du, X. Three-dimensional graphene aerogel–mesoporous carbon composites as novel coatings for solid-phase microextraction for the efficient enrichment of brominated flame retardants. New J. Chem. 2016, 40, 6308–6314. [Google Scholar] [CrossRef]
  28. Chang, Q.; Wang, M.; Zhang, G.; Zang, X.; Li, H.; Zhang, S.; Wang, C.; Wang, Z. Carbon nanospheres as solid-phase microextraction coating for the extraction of polycyclic aromatic hydrocarbons from water and soil samples. J. Sep. Sci. 2020, 43, 2594–2601. [Google Scholar] [CrossRef] [PubMed]
  29. Hu, X.; Liu, C.; Li, J.; Luo, R.; Jiang, H.; Sun, X.; Shen, J.; Han, W.; Wang, L. Hollow mesoporous carbon spheres-based fiber coating for solid-phase microextraction of polycyclic aromatic hydrocarbons. J. Chrom. A 2017, 1520, 58–64. [Google Scholar] [CrossRef]
  30. Kovats, E. Characterization of organic compounds by gas chromatography. Part 1. Retention indices of aliphatic halides, alcohols, aldehydes and ketones. Helv. Chim. Acta 1958, 41, 1915–1932. [Google Scholar] [CrossRef]
  31. Kováts, E. Gas-chromatographische Charakterisierung organischer Verbindungen. Teil 1: Retentionsindices aliphatischer Halogenide, Alkohole, Aldehyde und Ketone. Helv. Chim. Acta 1958, 41, 1915–1932. [Google Scholar] [CrossRef]
  32. Mc Reynolds, W.O. Characterization of Some Liquid Phases. J. Chrom. Sci. 1970, 8, 685–691. [Google Scholar] [CrossRef]
  33. Grob, K.; Grob, K., Jr. Splitless injection and the solvent effect. J. High. Res. Chrom. 1978, 156, 1–20. [Google Scholar] [CrossRef]
  34. Khaled, A.; Pawliszyn, J. Time-weighted average sampling of volatile and semi-volatile airborne organic compounds by the solid-phase microextraction device. J. Chrom. A 2000, 892, 445–467. [Google Scholar] [CrossRef]
  35. Kremser, A.; Jochmann, M.A.; Schmidt, T.C. PAL SPME Arrow—Evaluation of a novel solid-phase microextraction device for freely dissolved PAHs in water. Anal. Bioanal. Chem. 2016, 408, 943–952. [Google Scholar] [CrossRef] [PubMed] [Green Version]
  36. Myers, C.; Herrington, J.S.; Hamrah, P.; Anderson, K. Accelerated Solvent Extraction of Terpenes in Cannabis Coupled With Various Injection Techniques for GC-MS Analysis. Front. Chem. 2021, 9, 2. [Google Scholar] [CrossRef]
  37. Koziel, J.A.; Martos, P.A.; Pawliszyn, J. System for the generation of standard gas mixtures of volatile and semi-volatile organic compounds for calibrations of solid-phase microextraction and other sampling devices. J. Chrom. A 2004, 1025, 3–9. [Google Scholar] [CrossRef]
  38. Wang, Y.; O’Reilly, J.; Chen, Y.; Pawliszyn, J. Equilibrium in-fibre standardisation technique for solid-phase microextraction. J. Chrom. A 2005, 1072, 13–17. [Google Scholar] [CrossRef]
  39. Stefanuto, P.-H.; Perrault, K.A.; Dubois, L.M.; L’Homme, B.; Allen, C.; Loughnane, C.; Ochiai, N.; Focant, J.-F. Advanced method optimization for volatile aroma profiling of beer. J. Chrom. A 2017, 1507, 45–52. [Google Scholar] [CrossRef]
  40. Eckert, K.E.; Carter, D.O.; Perrault, K.A. Sampling Dynamics for Volatile Organic Compounds. Separations 2018, 5, 45. [Google Scholar] [CrossRef] [Green Version]
  41. Grandy, J.J.; Murtada, K.; Belinato, J.R.; Suarez, P.A.O.; Pawliszyn, J. Development and validation of an improved, thin film solid phase microextraction based, standard gas generating vial for the repeatable generation of gaseous standards. J. Chrom. A 2020, 1632, 461541. [Google Scholar] [CrossRef]
  42. Shah, D.; Patel, D.I.; Roychowdhury, T.; Rayner, G.B.; O’Toole, N.; Baer, D.R.; Linford, M.R. Tutorial on interpreting x-ray photoelectron spectroscopy survey spectra: Questions and answers on spectra from the atomic layer deposition of Al2O3 on silicon. J. Vac. Sci. Technol. B 2018, 36, 062902. [Google Scholar] [CrossRef]
  43. Herrington, J.S.; Gómez-Ríos, G.A.; Myers, C.; Stidsen, G.; Bell, D.S. Hunting Molecules in Complex Matrices with SPME Arrows: A Review. Separations 2020, 7, 12. [Google Scholar] [CrossRef] [Green Version]
Figure 1. Top-view SEM images of sputtered carbon deposited at throw distances of (a) 20 cm, (b) 12 cm, (c) 4 cm, and (d) with PDMS on top of the 4 cm coating. Scale bars are 1 µm.
Separations 08 00228 g001
Figure 2. XPS survey scans of (a) a bare silicon surface, (b) a silicon surface coated with sputtered carbon, and (c) a sputtered carbon surface after PDMS deposition.
Separations 08 00228 g002
Figure 3. Static, advancing, and receding WCAs of a bare silicon surface, a silicon surface coated with sputtered carbon, and the carbon surface coated with PDMS. The error bars for these results are smaller than the symbols used here.
Separations 08 00228 g003
Figure 4. Comparison of HS–SPME–GC–MS results of sputtered SPME fibers with different carbon thicknesses. These fibers were also coated with PDMS. n = 3 for each compound, and y-error bars represent standard deviations.
Separations 08 00228 g004
Figure 5. Comparison of DI–SPME–GC–MS results for 11.5 µm sputtered carbon SPME fibers and the commercial CWR SPME fiber. n = 3 for each compound, and y-error bars represent standard deviations.
Separations 08 00228 g005
Figure 6. Volume normalized responses of DI–SPME–GC–MS results for 11.5 µm sputtered carbon SPME fibers and the commercial CWR SPME fiber. These are the same data as in Figure 5 in normalized form.
Separations 08 00228 g006
Figure 7. DI–SPME–GC–MS results for 11.5 µm sputtered carbon SPME fibers and a 2.8 µm sputtered silicon SPME fiber. n = 3 for each compound, and y-error bars represent standard deviations.
Separations 08 00228 g007
Figure 8. Volume normalized responses of DI–SPME–GC–MS results for 11.5 µm sputtered carbon SPME fibers and a previous sputtered silicon SPME fiber. These are the same data as in Figure 7 in normalized form.
Separations 08 00228 g008
Table 1. Custom test mix used to evaluate SPME fiber performance across a range of functional groups.
CompoundsStructureFunctional GroupsProperties
Dicyclohexylamine Separations 08 00228 i001Cycloalkane, AmineIrreversible adsorption
4-Methyl-2-pentanone (MIBK) Separations 08 00228 i002Alkane, KetoneProton acceptor
2-Picoline Separations 08 00228 i003Arene, AmineAcid-base interactions
n-Pentane (C5) Separations 08 00228 i004AlkaneNonpolar, short chain, volatile alkane
1,4-Butanediol Separations 08 00228 i005Alkane, AlcoholShort chain, volatile alkane, hydrogen bonding
1-Octanol Separations 08 00228 i006Alkane, AlcoholFatty alcohol, hydrogen bonding
N,N-Dimethylaniline Separations 08 00228 i007Arene, AmineAromatic pi-pi interactions, irreversible adsorption
Sulfolane Separations 08 00228 i008SulfonylPolar aprotic solvent
2,6-Di-tert-butyl-4-methylphenol (BHT) Separations 08 00228 i009Arene, AlcoholAromatic pi-pi interactions, hydrogen bonding
Acenaphthylene Separations 08 00228 i010ArenePAH of interest, aromatic pi-pi interactions
2,6-Dimethylphenol Separations 08 00228 i011PhenolAromatic pi-pi interactions, acid-base interactions
n-Docosane (C22) Separations 08 00228 i012AlkaneNonpolar, long chain, semi volatile alkane
Chloroform Separations 08 00228 i013HaloalkaneVery volatile alkyl chloride
Linalool Separations 08 00228 i014Alkane, AlcoholMonoterpene alcohol of interest, hydrogen bonding
Hexachlorobutadiene Separations 08 00228 i015HaloalkaneHighly halogenated, unsaturated alkane
Table 2. HS/DI–SPME parameters.
CTC PAL Parameters
HS/DI Modes
Conditioning temperature280 °C
Conditioning time60 s
PreconditioningYes
Post conditioningNo
Vial penetration depth35 mm
Incubation/extraction temperature300 s
Incubation/extraction time120 s
Injector penetration depth50 mm
Desorption time60 s
Table 3. GC–MS parameters.
Agilent 7890B/5977B GC–MS Parameters
ColumnRxi-624Sil MS—30 m × 0.25 mm × 1.4 µm (Cat# 13868)
InjectionSee CTC PAL Parameters
ModeSplit (50:1)
LinerTopaz 0.75 mm ID Straight/SPME Inlet Liner (Cat# 23434)
Injector temperature280 °C
Purge flow3 mL/min
Oven50 °C (hold 1 min) to 150 °C by 15 °C/min to 280 °C (hold 5 min) by 25 °C/min
Carrier gasHe
Flow rate1.4 mL/min (Constant Flow)
DetectorHES-MS
ModeFull Scan
Transfer line temp.300 °C
Source temp.325 °C
Quad temp.200 °C
Solvent delay1 min
Acquisition range35–350 m/z
Frequency4.5 scans/sec
Publisher’s Note: MDPI stays neutral with regard to jurisdictional claims in published maps and institutional affiliations.

