Article

Designing Safer Solvents to Replace Methylene Chloride for Liquid Chromatography Applications Using Thin-Layer Chromatography as a Screening Tool

1
Department of Biomedical Engineering and Biotechnology, University of Massachusetts Lowell, Lowell, MA 01854, USA
2
Department of Plastics Engineering, University of Massachusetts Lowell, Lowell, MA 01854, USA
3
Toxics Use Reduction Institute, University of Massachusetts Lowell, Lowell, MA 01852, USA
*
Author to whom correspondence should be addressed.
Co-First Author.
Separations 2021, 8(10), 172; https://doi.org/10.3390/separations8100172
Submission received: 27 August 2021 / Revised: 19 September 2021 / Accepted: 30 September 2021 / Published: 6 October 2021
(This article belongs to the Special Issue Separations in Biomedical Analysis)

Abstract

:
Methylene chloride, commonly known as dichloromethane (DCM), is a widely used chemical for chromatography separation within the polymer, chemical, and pharmaceutical industries. With the ability to effectively solvate heterocyclic compounds, and properties including a low boiling point, high density, and low cost, DCM has become the solvent of choice for many different applications. However, DCM has high neurotoxicity and is carcinogenic, with exposure linked to damage to the brain and the central nervous system, even at low exposure levels. This research focuses on sustainability and works towards finding safer alternative solvents to replace DCM in pharmaceutical manufacturing. The research was conducted with three active pharmaceutical ingredients (API) widely used in the pharmaceutical industry: acetaminophen, aspirin, and ibuprofen. Thin-layer chromatography (TLC) was used to investigate if an alternative solvent or solvent blend could show comparable separation performance to DCM. The use of the Hansen Solubility Parameter (HSP) theory and solubility testing allowed for the identification of potential alternative solvents or solvent blends to replace DCM. HSP values for the three APIs were experimentally determined and used to identify safer solvents and blends that could potentially replace DCM. Safer solvents or binary solvent blends were down-selected based on their dissolution power, safety, and price. The down-selected solvents (e.g., ethyl acetate) and solvent blends were further evaluated using three chemical hazard classification approaches to find the best fitting nonhazardous replacement to DCM. Several safer solvent blends (e.g., mixtures composed of methyl acetate and ethyl acetate) with adequate TLC performance were identified. Results from this study are expected to provide guidance for identifying and evaluating safer solvents to separate APIs using chromatography.

1. Introduction

Methylene chloride, commonly known as dichloromethane (DCM), is a widely used chemical for chromatography separation in the polymer, chemical, and pharmaceutical industries [1]. DCM is well known for its ability to solvate heterocyclic compounds. That, in combination with properties including high density, a low boiling point, cost-effectiveness, and ease of availability has resulted in widespread use of the chemical. However, DCM is a highly toxic chemical linked to numerous health effects including skin irritation, corrosive burns, cancer, and damage to the central nervous system [2,3]. DCM has been used extensively as a paint stripper and as an extraction solvent in the food industry (e.g., in decaffeination of coffee) [4]. The chemical has also been utilized in the production of cellulose triacetate films and fibers [5]. Considering its versatility and availability, the production and use of DCM in the United States peaked around 1980 with a production capacity of 830 million pounds per year [2]. More recently, the production of DCM has decreased to below 650 million pounds per year [2].
Within the pharmaceutical industry, DCM has been utilized in chromatographic applications, particularly in liquid chromatography (LC), which is frequently used in synthesizing active pharmaceutical ingredients. In LC, the separation is based on the interactions between the mobile phase, stationary phase, and the analytes. In general, a single chemical or chemical blend is used as the mobile phase, and adsorbent materials (e.g., silica gel) are used as the stationary phase [6]. Although various kinds of solvents can be used in chromatography, DCM is predominantly used in medicinal chemistry. Despite the dominant use of DCM in chromatography, DCM often cannot be satisfactorily replaced with safer solvent alternatives. For example, Jessop et al. (2012) reported that there are many problematic solvents (including DCM) for which a safer substitute does not exist [7].
Previous studies have focused on the identification of solvent replacement. Gao et al. (2021) discussed the replacement of halogenated solvents with a butyl acetate solution of bisphenol s in the transformations of indoles [8]. Past studies have also investigated alternatives for DCM in chromatography. For instance, Taygerly et al. (2012) developed a solvent guide (based on safety, environmental impact, toxicity, and other factors) to help select replacements for DCM in chromatographic applications [9]. Although it is a very important paper that will help in the adoption of safer alternatives to DCM, the authors state that their system only provides starting points from which others can develop replacements. The goal of this study is to identify specific solvents and blends to replace DCM with a method that can be adapted for use with other analytes and in other applications.
To replace DCM with safer solvent alternatives, the solubility of targeted APIs was measured by evaluating their solubility parameters. Solubility parameters are numerical values that represent the degree of solubility for a specific solvent. The Kamlet-Taft parameters, Hansen solubility parameters (HSP), and the Schneider solubility triangle are three such systems that have been used to evaluate the solubility of organic molecules such as APIs [10,11,12]. The Kamlet-Taft parameters utilize Solvatochromic data based on Solvatochromism, a phenomenon where specific compounds (probes) adsorb different wavelengths of light and thus show different colors [13]. In the case of solubility, the color of the probe changes based on the solvent in which it resides, providing information about the solvation ability of the solvent [13,14]. The Kamlet-Taft system contains the parameters α (hydrogen bonding donating ability), β (hydrogen bonding accepting ability), and π* (polarizability), which are used in combination to predict solubility results [7]. The method has been used to identify replacements for DCM before. However, previous studies have shown that the parameters are unable to provide identifiable replacements with similar values and performance [7].
Lewis acidity, basicity, and dipolar interactions are used within the Schneider solubility triangle [12]. Solvents are categorized into groups based on their parametric values, with groups of solvents showing similar solubility abilities [12]. The Schneider triangle has been used for the identification of solvents in LC applications in the past. However, the capacity of the system to identify alternative solvents is quite limited as it only contains 82 common solvents [12].
HSP, which is refined from the Hildebrand solubility parameters, predicts the effectiveness of solvents based on their hydrogen bonding forces, polar forces, and dispersive forces [15]. With an extensive database of thousands of solvents, the system allows for the quick identification of many potential solvent alternatives for testing. HSP theory has previously been used to identify effective solvents for the dissolution of polymeric materials including polystyrene, polycarbonate, and styrene acrylonitrile [10]. For example, Lu et al. (2021) used the HSP theory to find alternative solvent replacements for DCM to dissolve acrylic coatings on electronics [10]. It has also been used to identify the miscibility between a pharmaceutical and coformer for indications of cocrystal formulation [16]. However, prior to our research, the utilization of the HSP theory for identifying solvents capable of dissolving APIs has not been investigated in depth.
This study progressed with the use of acetaminophen, aspirin, and ibuprofen, three commonly used active pharmaceutical ingredients (API) in the pharmaceutical industry [17,18,19]. Tested solvents and blends were evaluated for their safety and performance compared to DCM. The conditions under which the chemicals had to pass were (1) safer than DCM from a human health and safety standpoint and (2) show dissolution and thin-layer chromatography (TLC) testing results similar to DCM, with equivalent or better performance preferred.
Preliminary performance screening was conducted with TLC to observe the distance traveled by each analyte, which helped to identify the different compounds used [20]. TLC was chosen as a prescreening tool for its cost-effectiveness per sample, allowing for a large number of solvents and solvent blends to be screened [20]. Correspondingly, solvents and solvent blends were evaluated for human health and safety impacts utilizing three chemical hazard classification approaches: GlaxoSmithKline (GSK) Health Scores, GreenScreen Scores, and the Pollution Prevention Options Analysis System (P2OASys). Some promising solvent blends and a few individual solvents were successfully identified using this research method. The findings from this research will be of great importance for pharmaceutical companies currently utilizing DCM in manufacturing operations. The use of safer and effective solvents will not only prevent workers from exposure to a highly toxic chemical but will also work towards public health protection by limiting industrial releases of DCM. In addition, the methodology used during this study could also be used to identify DCM replacements for other uses.

2. Materials and Methods

2.1. Materials

The APIs used for this project, acetaminophen (98% purity), aspirin (97% purity), and ibuprofen (99.5% purity), were obtained from Fisher Scientific (Waltham, MA, USA). The non-API analyte, caffeine (99% purity), was also obtained from Fisher Scientific (Waltham, MA, USA). The TLC plates (Supelco TLC Silica gel 60 F254 Plates 20 × 20 cm 1.05715) and the ultraviolet (UV) torch (Supelco UV lamp 254 nm for TLC 1.12537) used to observe TLC plates were obtained from Millipore Sigma (Burlington, MA, USA). Glass capillary tubes and glass vials used for dissolution testing were purchased from Fisher Scientific (Waltham, MA, USA) and used as provided. The manual glass cutter (Fletcher-Terry gold tip glass cutter) was acquired from McMaster-Carr (Elmhurst, IL, USA). All solvents used for this research are listed in Table 1.

2.2. General Procedure for Solubility Testing, Solvent Optimization, and Thin-Layer Chromatography

2.2.1. Dissolution Testing of Active Pharmaceutical Ingredients

Using a graduated cylinder, 15 mL of solvent was measured and poured into a glass vial, which contained 0.1 g of one of the APIs: Acetaminophen, aspirin, or ibuprofen. Each vial was left undisturbed without agitation for a 2 min dwell time. The vial contents were then visually inspected to determine if the analyte had fully dissolved or not. Vials were also visually inspected for dissolution after a 10 min dwell time and 30 min dwell time. For each glass vial and dissolution time, the solubility performance of each solvent was labeled as “Dissolved” if the API was fully dissolved or “Undissolved” if the API was not fully dissolved. This protocol was modified from a prior study measuring the solubility of a conformal coating in various solvents [10].

2.2.2. Procedures for Optimization of Solvent Blends

The Hansen Solubility Parameters (HSP) theory was used to determine the solubility of the tested APIs. HSP theory can be used to predict which solvents may be able to dissolve target solutes and is an efficient method to rapidly identify safer and effective alternatives to toxic solvents [10,12,21]. The HSP approach is based on three distinctive forms of inter-molecular force: Dispersion forces (D), Polar forces (P), and Hydrogen bond forces (H). These three forces (also known as parameters) are used to describe solvent and solute interactions. Each parameter is used as an axis in the three-dimensional solubility space. As shown by Figure 1, each solvent is represented as a point in the three-dimensional solubility space, with each solute represented as a sphere within the three-dimensional solubility space [22]. The black dot represents the center point for the sphere of solubility. The green dots represent solvents that are located within the solute’s solubility sphere that will dissolve the solute (e.g., API in this study). The red dots represent solvents outside the solubility sphere that will not dissolve the solute.
HSP values are based on the principle that "like dissolves like". The closer the solute and solvent are in the three-dimensional solubility space, the greater the likelihood that the solvent will be effective. If the solvent is located inside of the sphere of solubility, then it will dissolve the solute. If the solvent is located outside the sphere of solubility, then it will NOT dissolve the solute. In general, solvents have absolute HSP values (with specific δD, δP and δH values), while solutes (e.g., APIs) are represented as a sphere indicating a spatial region of likely solubility (with a radius, R0) [15]. The HSP distance from the center of the sphere to a solvent (Ra) can be calculated as shown in Equation (1):
R a 2 = 4 × ( δ D 2 δ D 1 ) 2 + ( δ P 2 δ P 1 ) 2 + ( δ H 2 δ H 1 ) 2
In Equation (1), δ D 2 and δ D 1 represent the dispersion forces for a selected solvent and a given polymer, respectively. Similar denotation is also applied to δ P (polarity) and δ H (hydrogen bonding). With the values of Ra and R0, one can calculate the relative energy difference (RED) as shown in Equation (2):
RED = T h e   H S P   d i s t a n c e   o f   a   s o l v e n t   t o   t h e   c e n t e r   o f   t h e   s o l u t e   s p h e r e T h e   r a d i u s   o f   t h e   s o l u t e   s p h e r e = R a R 0
Theoretically, an ideal solvent would be located at the solute sphere center with a RED value of 0, with the solvent effectiveness decreasing with increasing distance from this ideal solvent. If a solvent has a RED value smaller than 1 (i.e., the selected solvent is inside the sphere), then the solvent and solute are considered compatible at the given pressure and temperature (Figure 1) [22,23]. Overall, the lower the HSP distance between the solvent and the center of the solute solubility sphere, the faster the anticipated dissolution time [22].
The data gathered from dissolution testing were used to calculate the best-fit sphere with HSP values and radius using multi-response optimization algorithms as described in the literature [10,15,22,24]. Each solvent in the list was marked using a binary system, with “1” input for solvents with “dissolved” solutes and “0” input for solvents with “undissolved” solutes. Separate lists were created for each API at each dissolution dwell time, with solute spheres generated from each list. Each solute sphere generated came with an output fit value between 0 and 1, indicating sphere stability and reliability. The output fit values were compared with one another, and the plot with the highest value was identified (note that higher output fit values indicate more stable and reliable spheres).

2.2.3. Thin-Layer Chromatography

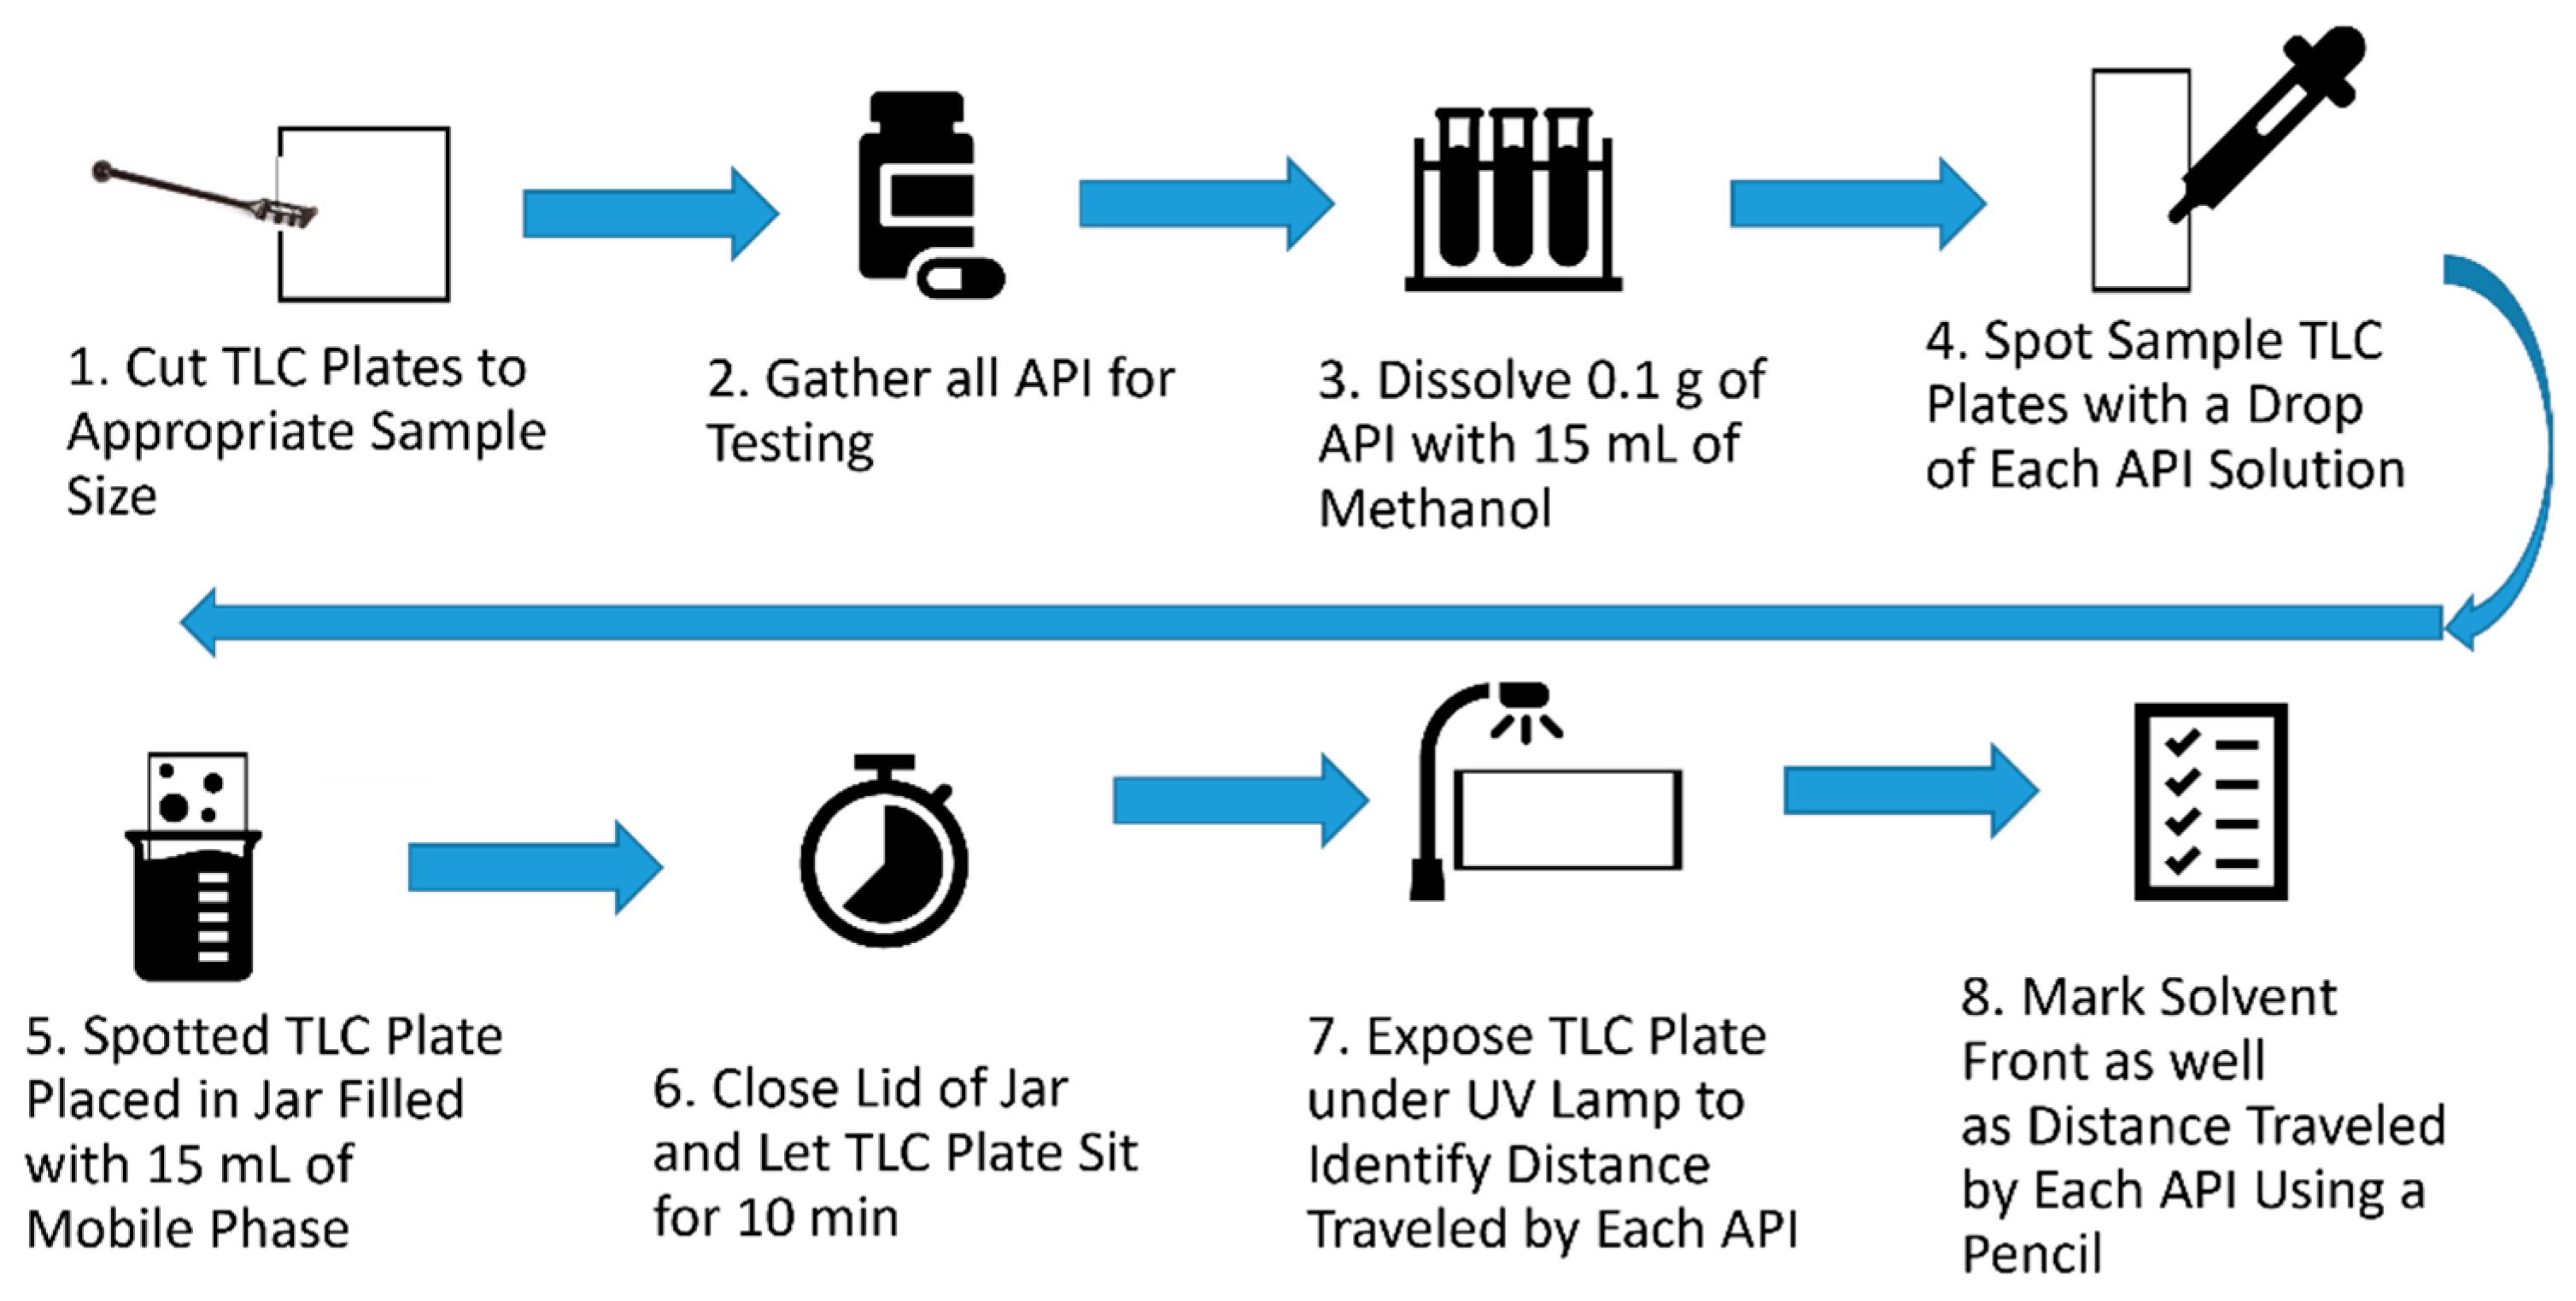
As Figure 2 shows, TLC plates (originally 20 cm by 20 cm) were cut to 5 cm by 10 cm sections using a manual glass cutter. The origin was marked 1 cm from the bottom of the TLC plate along the silica gel side, and vertical markers (spaced 1 cm from each other) were marked across the origin line. The API solution was created with the API dissolved in methanol. The concentration of API in each solution used for spotting was kept constant at 6.67 mg/mL, which was the maximum concentration methanol could readily dissolve the analytes. The solution was then spotted along the vertical markers with a glass capillary tube and was immediately placed into the developing jar with 15 mL of the mobile phase to develop for 10 min [25,26]. TLC plates were subsequently removed and the solvent front (i.e., the distance mobile phase traveled up on the TLC plates, Figure 3) was immediately marked. A UV torch with a wavelength of 254 nm was used to observe the developed plates, and the distance traveled by each API and the solvent front was marked and measured. This protocol was modified from the literature discussing all aspects of TLC including procedural information [25,27].
The Retention factor (Rf) identifies the distance traveled by each analyte when spotted on a TLC plate. Rf is a ratio between the solvent front and the distance moved by the analyte from the origin that is calculated using Equation (3) [6]:
Rf = D/S
where D is the distance moved by the analyte and S represents the solvent front (Figure 3). More details about Equation (3) can be found in Bettelheim and Landesberg (1997) [28], and Williamson and Masters (2016) [29].

3. Results

3.1. Dissolution Testing of Analytes

The solubility of the tested APIs (acetaminophen, aspirin, and ibuprofen) was measured at dissolution times of 2 min, 10 min, and 30 min. The solubility testing results for solvents with 2 min dissolution time are summarized in Table 1. A 3D solute sphere for each API was created with the help of the data obtained from dissolution testing at 2 min, 10 min, and 30 min (Figures S1–S3 in the Supplementary Data). Solvents that lie inside the sphere of solubility were marked as “good” solvents whereas the solvents that lie outside the sphere were marked as “bad” solvents. Different APIs showed different output fit values and fit trends over different dissolution times (Table S1 in the Supplementary Data). The output fit values indicate the amount of error associated with the solvent location in relation to the sphere and its solubility. As these errors decrease to zero, the fit accuracy increases to 1.00 [30]. The error associated with the bad solvents located inside the sphere and the good solvents located outside the sphere should be minimized. Acetaminophen 2 min had a fit value of 0.8, which was the highest fit value. This indicated that the solute sphere generated with data from acetaminophen with a 2 min dwell time was the most stable and reliable. Moreover, as an active ingredient in all kinds of pain products, acetaminophen represents a larger share of the API market (41%) than the others tested, followed by aspirin (34%) and ibuprofen (25%) [31]. Thus, acetaminophen was selected for further study.
It is important to note other interactions that had an impact on sphere fit accuracy but were outside the scope for this research project. Three parameters were considered when generating the spheres (polar force, hydrogen bonding force, and dispersion force). The HSP theory used for sphere development did not consider any factors related to the solvent-API interactions or donor-acceptor reactions that may have occurred. Chen et al. (2020) noted that many pharmaceuticals in solid form exhibit polymorphism [32]. This means different crystalline structures exist within the same solid substance. These different polymorphs can often show different properties, including solubility behaviors. In some cases, polymorphs show poor thermodynamic stability when exposed to various solvents, resulting in unwanted solvent-API interactions that adversely affect the drug manufacturing process [32]. Given these effects, the data collected for acetaminophen with a 2min dissolution time were used for further testing.

3.2. Thin-Layer Chromatography

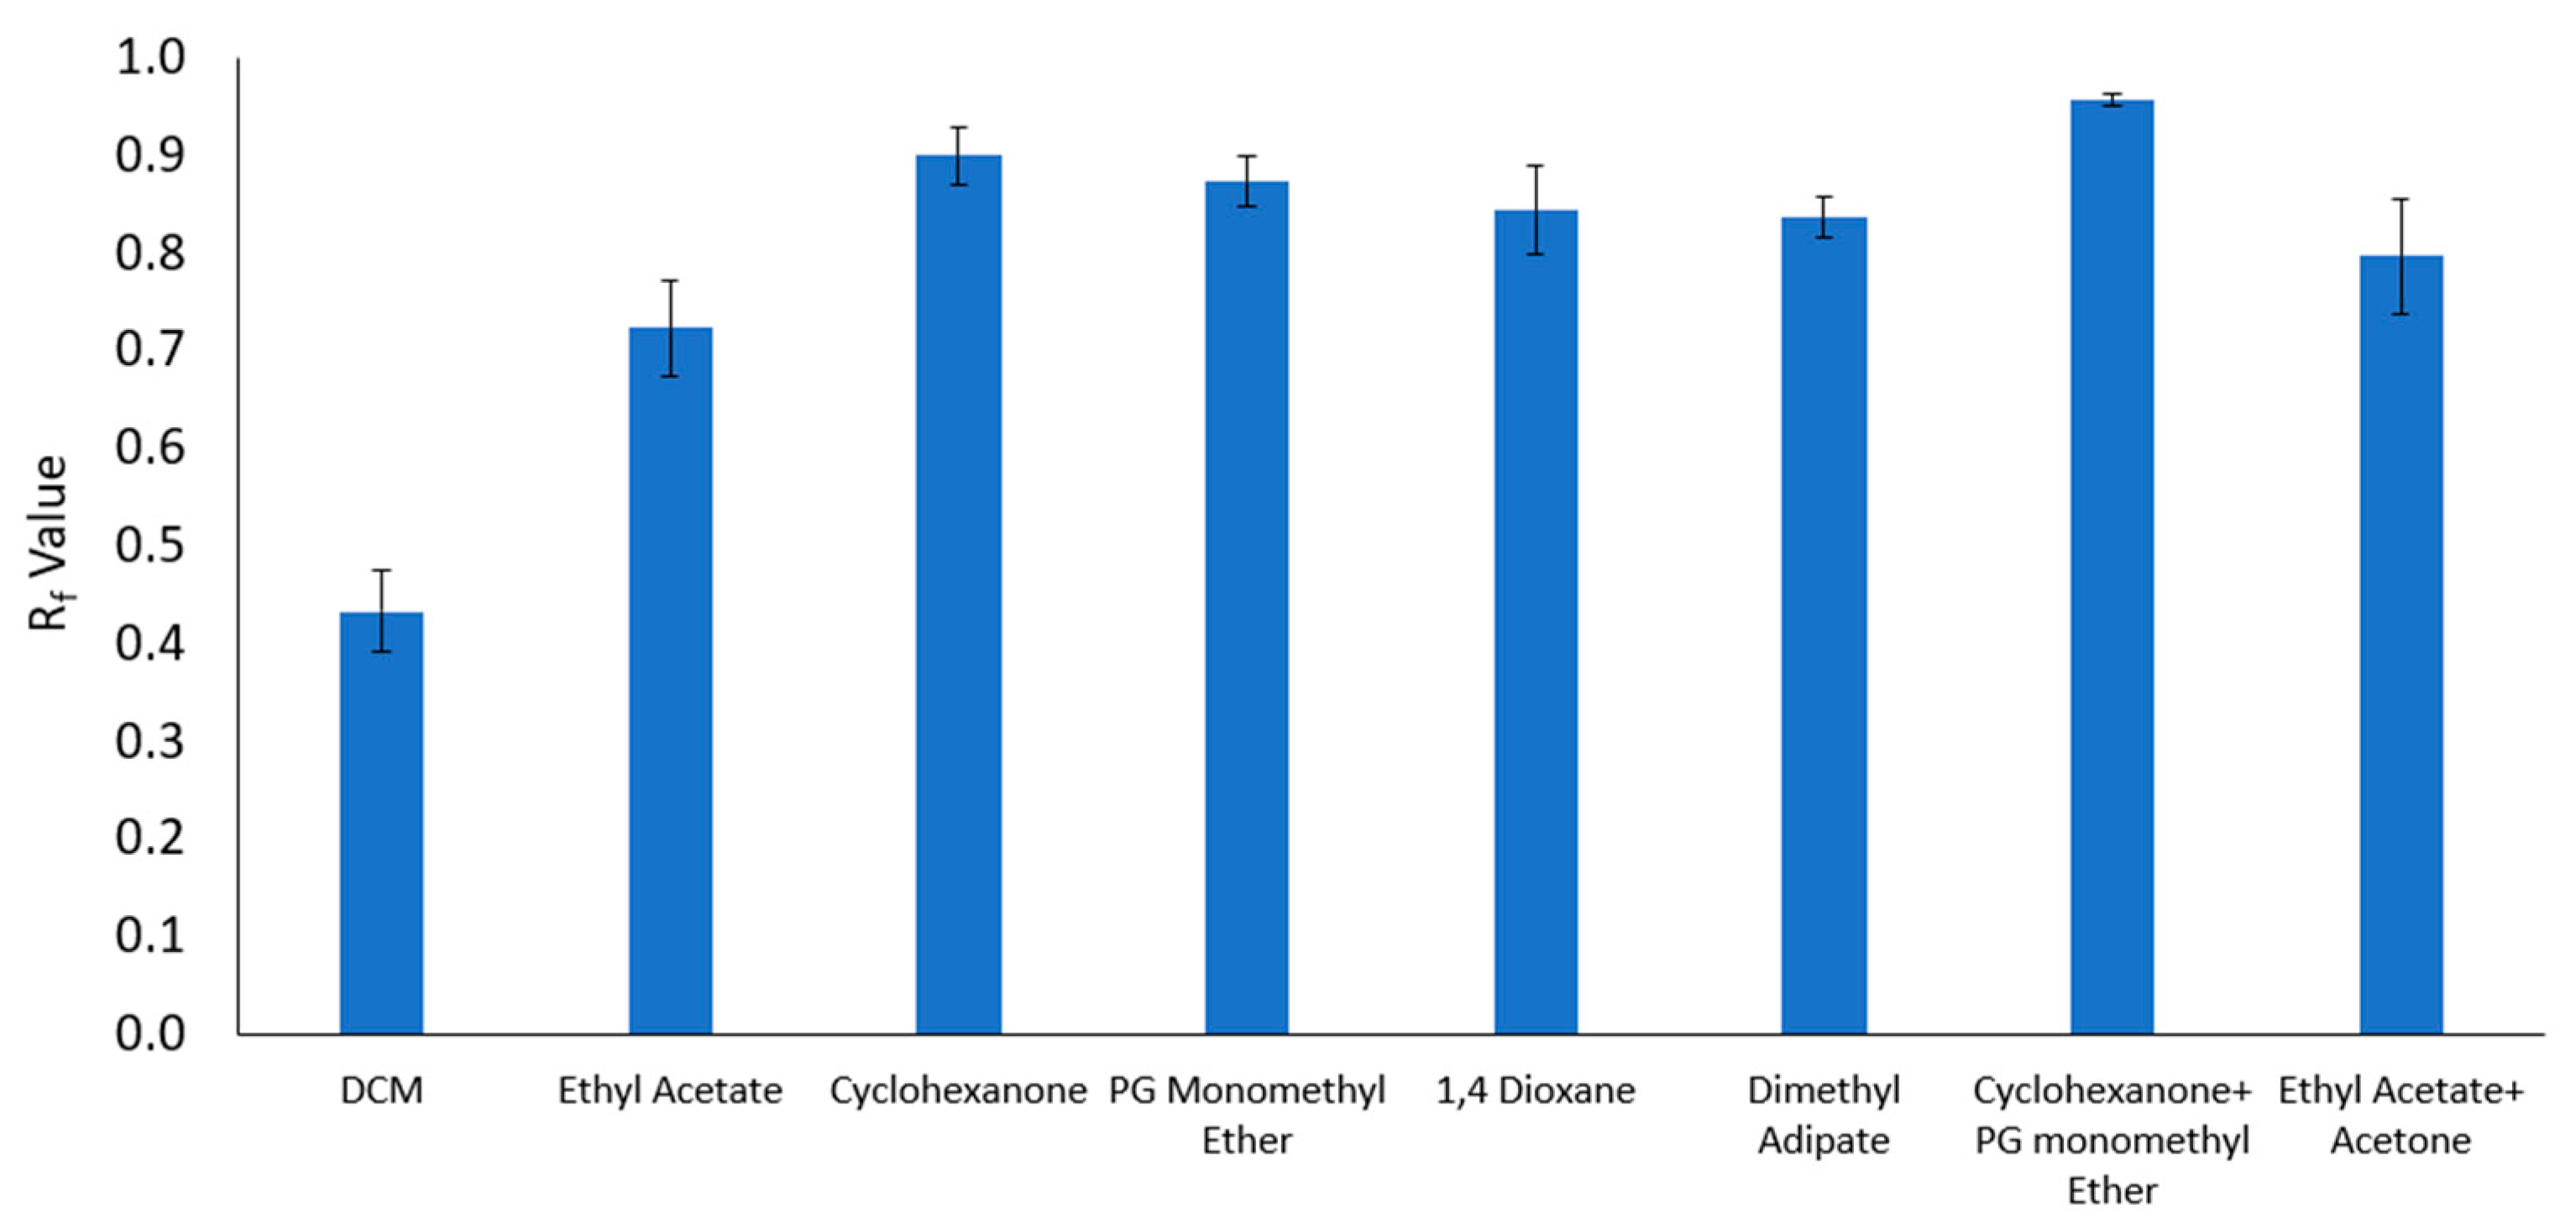
Both DCM and potential replacement solvents and solvent blends were compared to one another using TLC (Figure 4). TLC plates were spotted with a mixture of acetaminophen dissolved in methanol and subjected to a mobile phase environment. Each solvent/solvent blend was used as a separate mobile phase during testing. The solvent front and the distance traveled by acetaminophen were marked and compared for eluting strength. Solvents and solvent blends with Rf values between 0.4 and 0.8 were noted as falling within the preferred target range used by a major pharmaceutical manufacturing company for TLC test results. Notably, only ethyl acetate and ethyl acetate solvent blends fell within this target range.

3.3. Addition of Caffeine as a Second Analyte

Caffeine was added to the previously prepared acetaminophen solution to compare the abilities of the solvents to separate the two different components within a mixture. Caffeine was used as a stimulant for API (i.e., acetaminophen in this case), while acetaminophen served as the model API for evaluating the separation efficiency of safer solvents [33,34]. Notably, caffeine is the most widely used stimulant because it has fatigue-reducing properties [35]. Caffeine is often added to pharmaceuticals (e.g., analgesics, migraine medication, etc.) to help enhance the performance of the various drugs. In fact, many commercial analgesics (e.g., Tylenol, i.e., acetaminophen) include both analgesics and caffeine [28,29]. Thus, in this study, thin-layer chromatography was used to test for the separation performance of alternative solvents with the presence of analgesics (i.e., acetaminophen) in a commercial product setting. Other studies have used caffeine for the same reason as well [33,34].
The concentration of caffeine used in the mixture was 0.67 mg/mL, which was the maximum concentration that could be readily dissolved by methanol. After spotting the mixture on a TLC plate, two spots representing acetaminophen and caffeine were obtained after being subjected to a mobile phase environment (Figure S2 in the Supplementary Data). The solvent front and the distance traveled by both spots were marked and compared for eluting strength (Table 2). There was a noticeable difference in the separation distance between the two analytes, with all tested solvent/solvent blends showing greater separation values of the two analytes than DCM. Notably, 1,4 Dioxane and dimethyl adipate showed the most similar separation data to DCM. Both solvents were found to have identical polarity values of 6.8, a number similar to the polarity value of DCM (7.3). This suggests that polarity may be an important factor in determining the abilities of solvents to solubilize API and similar organic compounds. However, a blend of ethyl acetate and acetone with an identical polarity value to that of DCM did not show similar results to that of DCM. This indicates that although HSP is a helpful tool in the solvent/solvent blend identification process, it cannot be solely used to determine effective alternatives. Additional investigation including a more complex computational analysis regarding the molecular solvation theory is required to understand the intermolecular interactions not accounted for by the HSP theory.

3.4. Chemical Hazard Classification of the Potential Alternative Solvents

A three-factored approach was adopted to assess the safety of the screened solvents and solvent blends (Table 3). First, the GSK health scores of the solvents were investigated. The GSK system provides a score for chemicals on a scale between 1 and 10 for various health, safety, and environmental categories such as waste, environmental impact, health, flammability/explosion, and reactivity/stability. For the purposes of our research, we focused on human health and safety and, consequently, used the GSK “Health” score. Safer substances have high GSK Health scores while substances with high human toxicity are assigned lower Health scores [36]. GSK Health scores for most of the screened solvents were found to be higher than that of DCM, indicating that they are less hazardous than DCM. However, GSK Health scores were not available for all solvents evaluated. To further evaluate the safety of the solvents, an assessment using P2OASys was conducted [37]. P2OASys provides information using both qualitative and quantitative data considered to accurately assess the safety of solvents. The system ranks substances on a scale between 1 and 10, with lower scores given to safer chemicals [37]. Cyclohexanone was found to have a higher score than DCM, indicating it is more hazardous than DCM (note that higher P2OAsys scores indicate more toxic solvents). Acetone, PG monomethyl ether, ethyl acetate, 1,3 dioxolane, methyl acetate, and dimethyl adipate were found to have lower P2OASys scores, showing that they are safer alternatives to DCM, cyclohexanone, and 1,4 dioxane. The third approach used to evaluate solvent safety was the GreenScreen Score system [38]. The system categorizes chemicals on a scale from Benchmark 1 (BM-1) to Benchmark 4 (BM-4). Substances listed under BM-1 are those of high concern whose use should be avoided. BM-2, BM-3, and BM-4 chemicals represent usable substances within a range of increasing safety [38,39]. DCM was listed as BM-1, identifying it as a highly hazardous chemical (note that high benchmark levels indicate less hazardous chemicals within the Green Screen Score system). Similarly, 1,4 dioxane, was found as BM-LT1 (list translator 1), which identified it as a likely BM-1 substance. Acetone, 1,3 dioxolane, and methyl acetate were classified as BM-2, thus identifying them as safer substitutes to DCM. Evaluation data for cyclohexanone, PG monomethyl ether, ethyl acetate, and dimethyl adipate were not found as GreenScreen was unable to provide a benchmark score for all solvents screened. All solvents and solvent blends presented in Table 3 (with the exception of 1,4 dioxane and cyclohexanone) were found to have less toxicity than DCM based on the results from all three safety evaluation systems.

3.5. Optimization of Safer Solvents Blends

Results from dissolution testing and safety screening showed only a select number of potential individual replacement solvents for DCM. To increase the number of alternatives to DCM, solvent blend optimization and additional TLC testing were conducted to identify effective binary solvent blends. A multi-factored approach was used for the solvent blend optimization process. The factors that were selected as most important and used were solvent distance, chemical safety/toxicity, physical-chemical properties (boiling point and miscibility), and price [10]. Initial screening consisted of down-selecting the large number of blends based on solvent distance, miscibility, and solvent safety. A maximum solvent distance of 4.0 MPa1/2 to the target solute was chosen to increase the likelihood that all the blends would be able to perform with similar results to DCM during TLC testing [40]. Only blends listed with miscible solvents were kept, to prevent phase separation of the solvents during TLC testing. Based on the safety assessment results, only blends containing solvents safer than DCM were selected. After safety screening, additional parameters were added to further down-select blend combinations. An initial maximum boiling point of 100 °C was selected to better facilitate solvent recovery. The maximum boiling point for the blends was listed as the higher of the two boiling points between the two solvents within the blend. The maximum cost for all possible blends (with consideration of blend ratios) was set at 125 USD per liter to ensure blends would be similarly cost-effective to DCM. Prices for each solvent were based on the cost listed from the Sigma Aldrich chemical pricing website during the time of research (Spring 2021) [41]. Lastly, blends with at least 5% of each solvent were chosen as results with those with over 95% of the majority solvent would be too similar to the majority solvent in its pure form [10].
Two potential solvents blends (methyl acetate/ethyl acetate and ethyl acetate/1,3 dioxolane) were found to meet the parameters from the solvent optimization process. The optimization process was conducted again without the boiling point parameter and resulted in the addition of a third solvent blend with dimethyl adipate and 1,3 dioxolane. Upon further analysis of the solvent optimization and preliminary performance screening results, a fourth potential DCM replacement solvent blend was identified: Dimethyl adipate/ethyl acetate. These four DCM potential replacement solvent blends are included in Table 4.
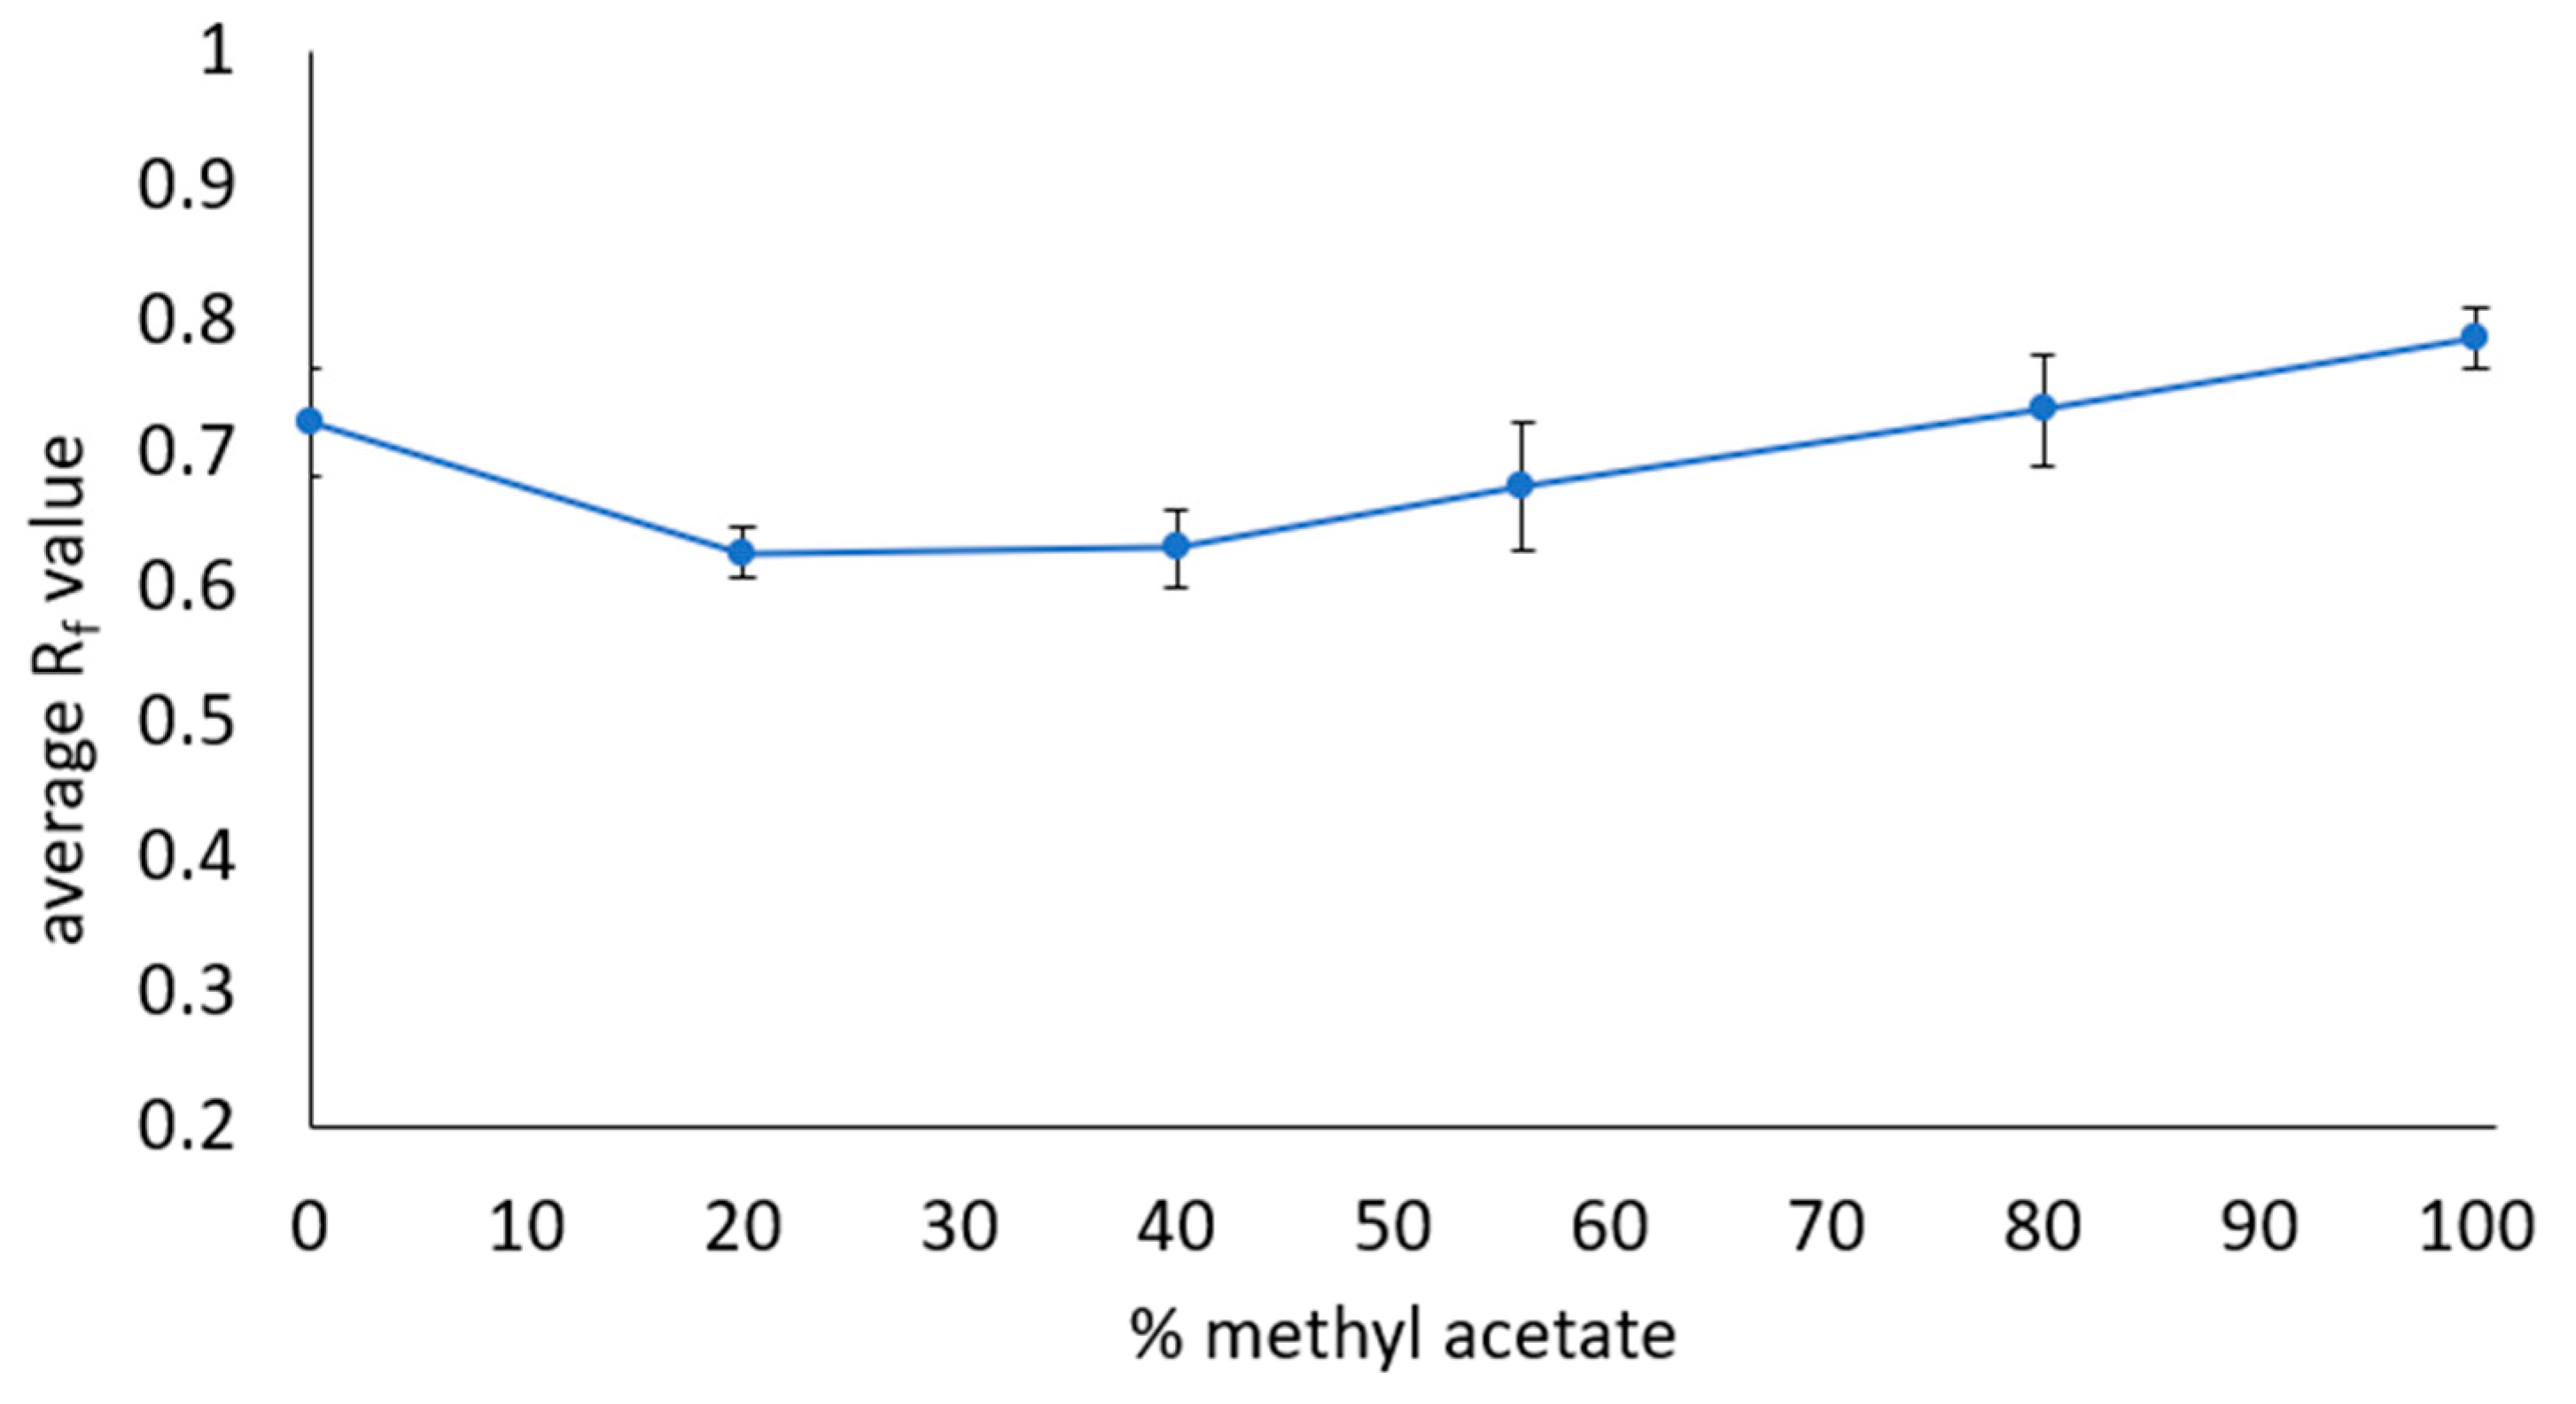
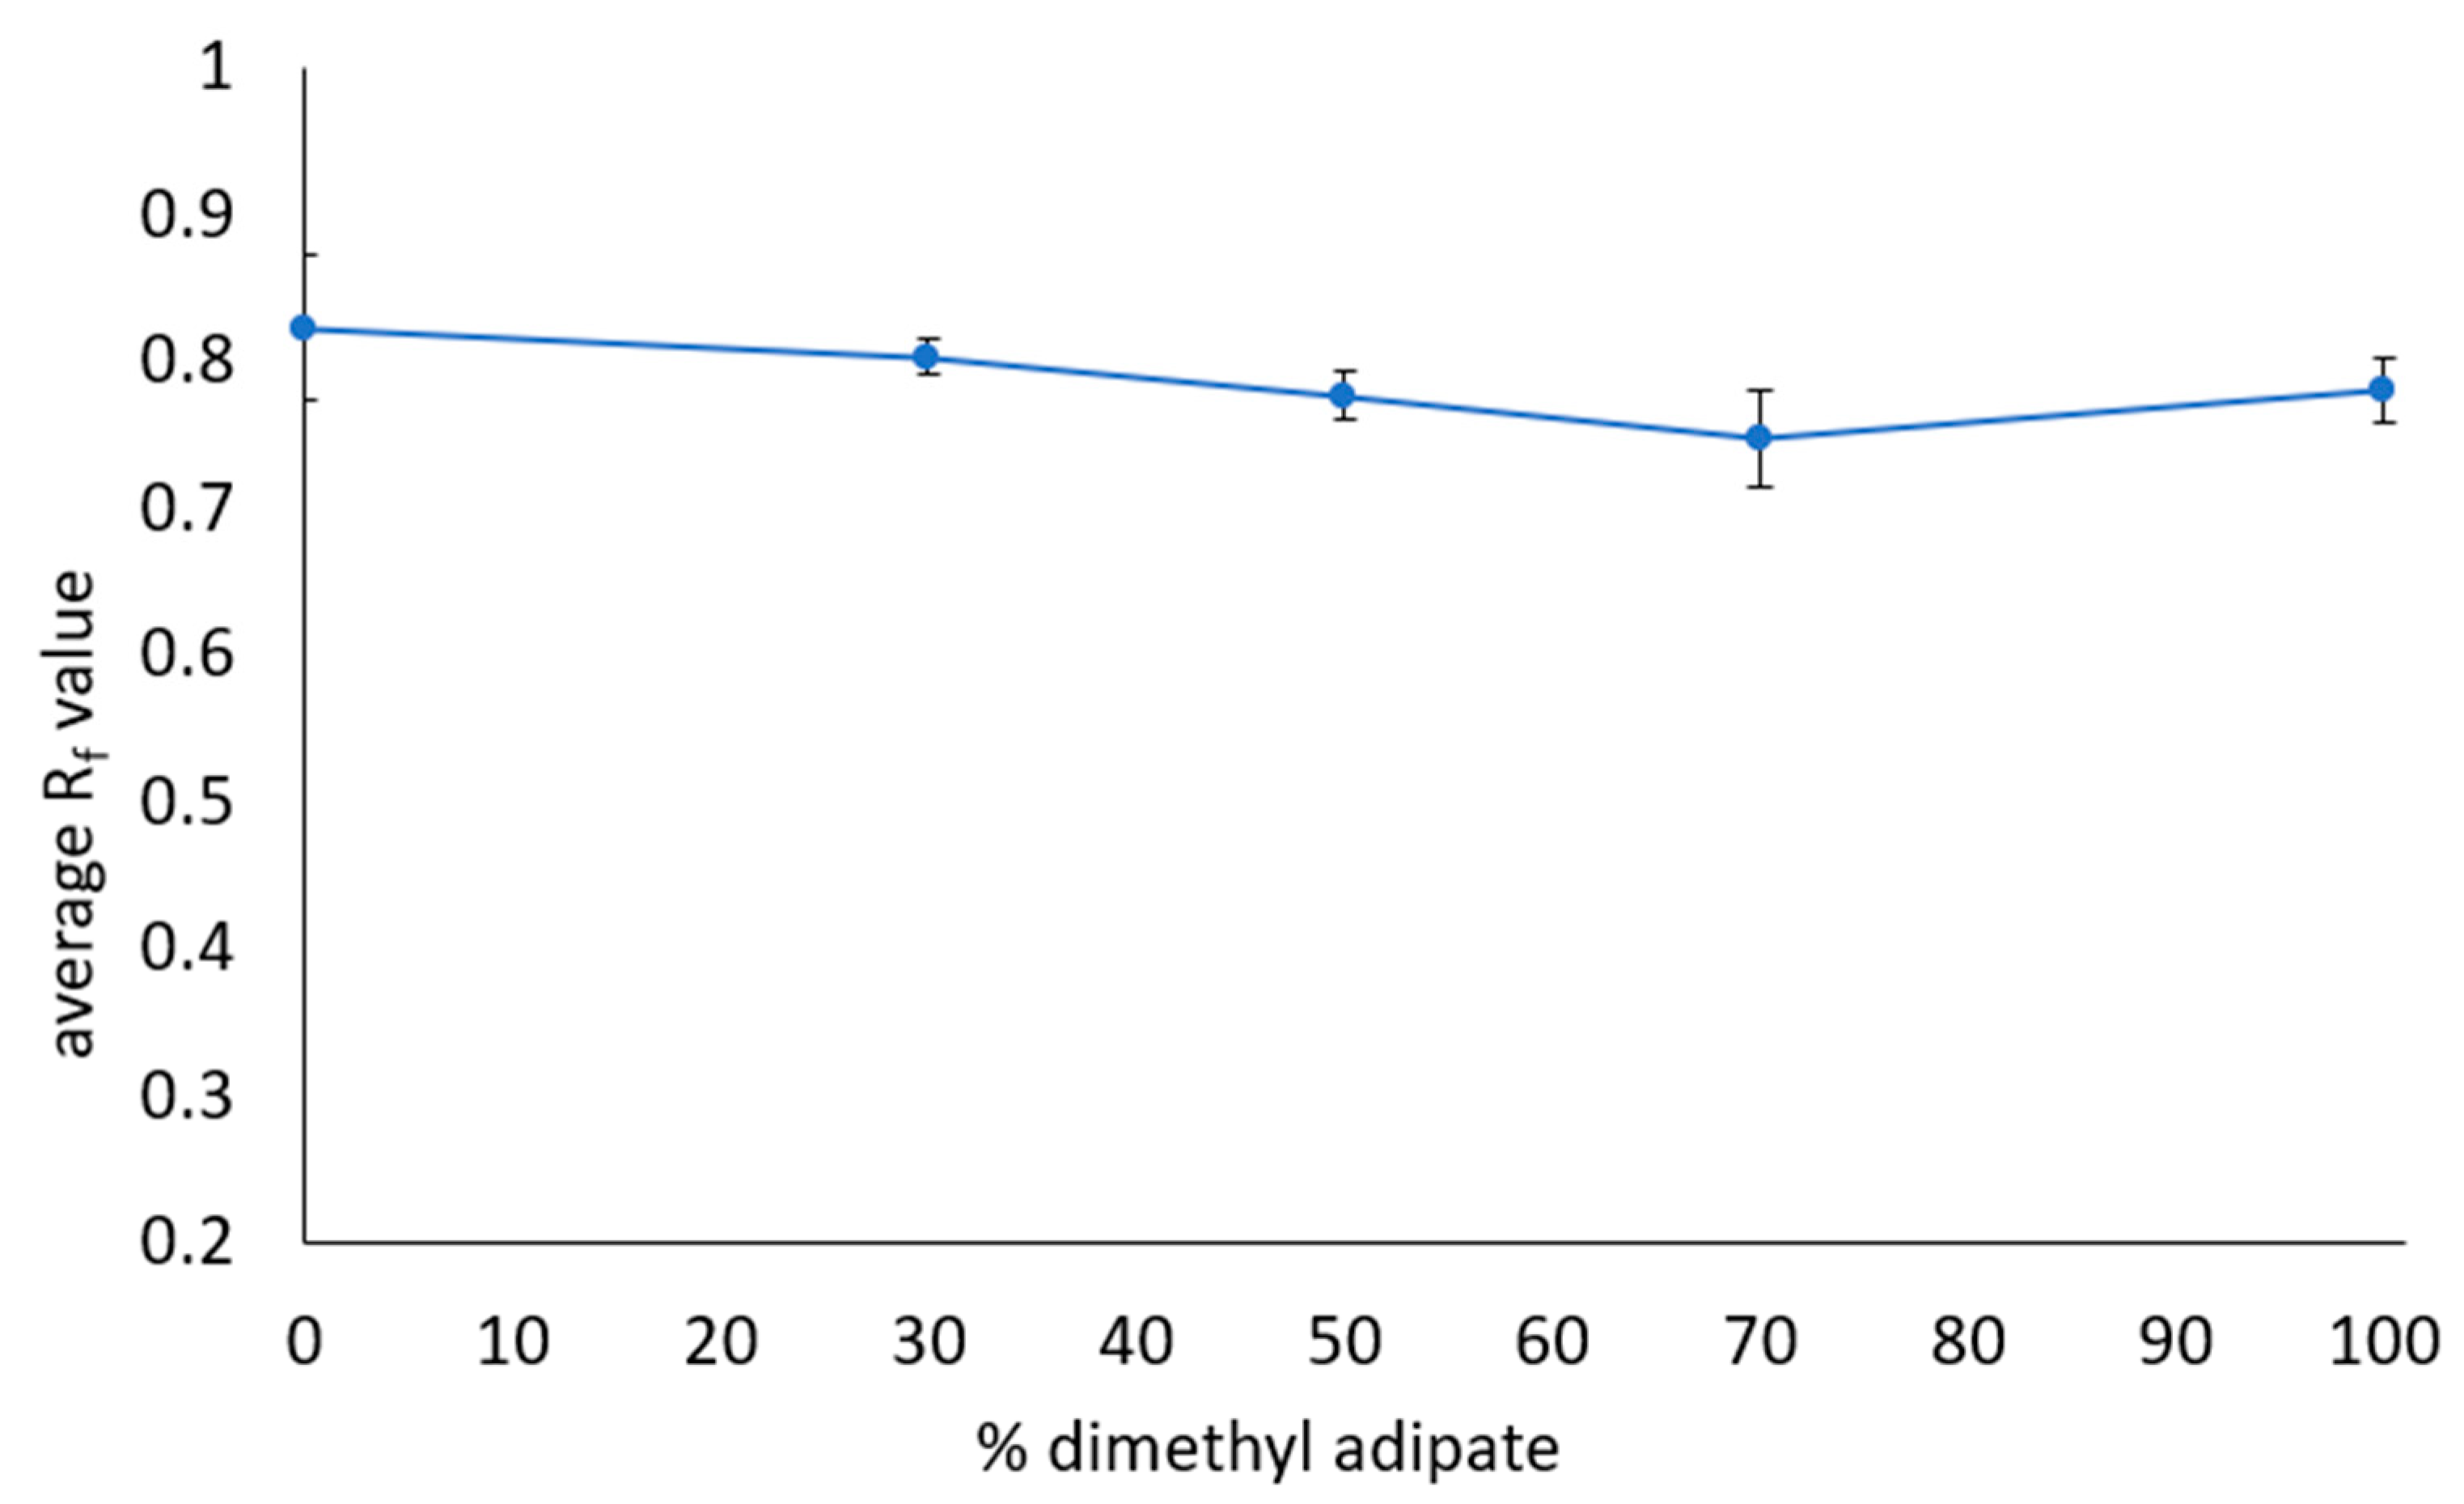
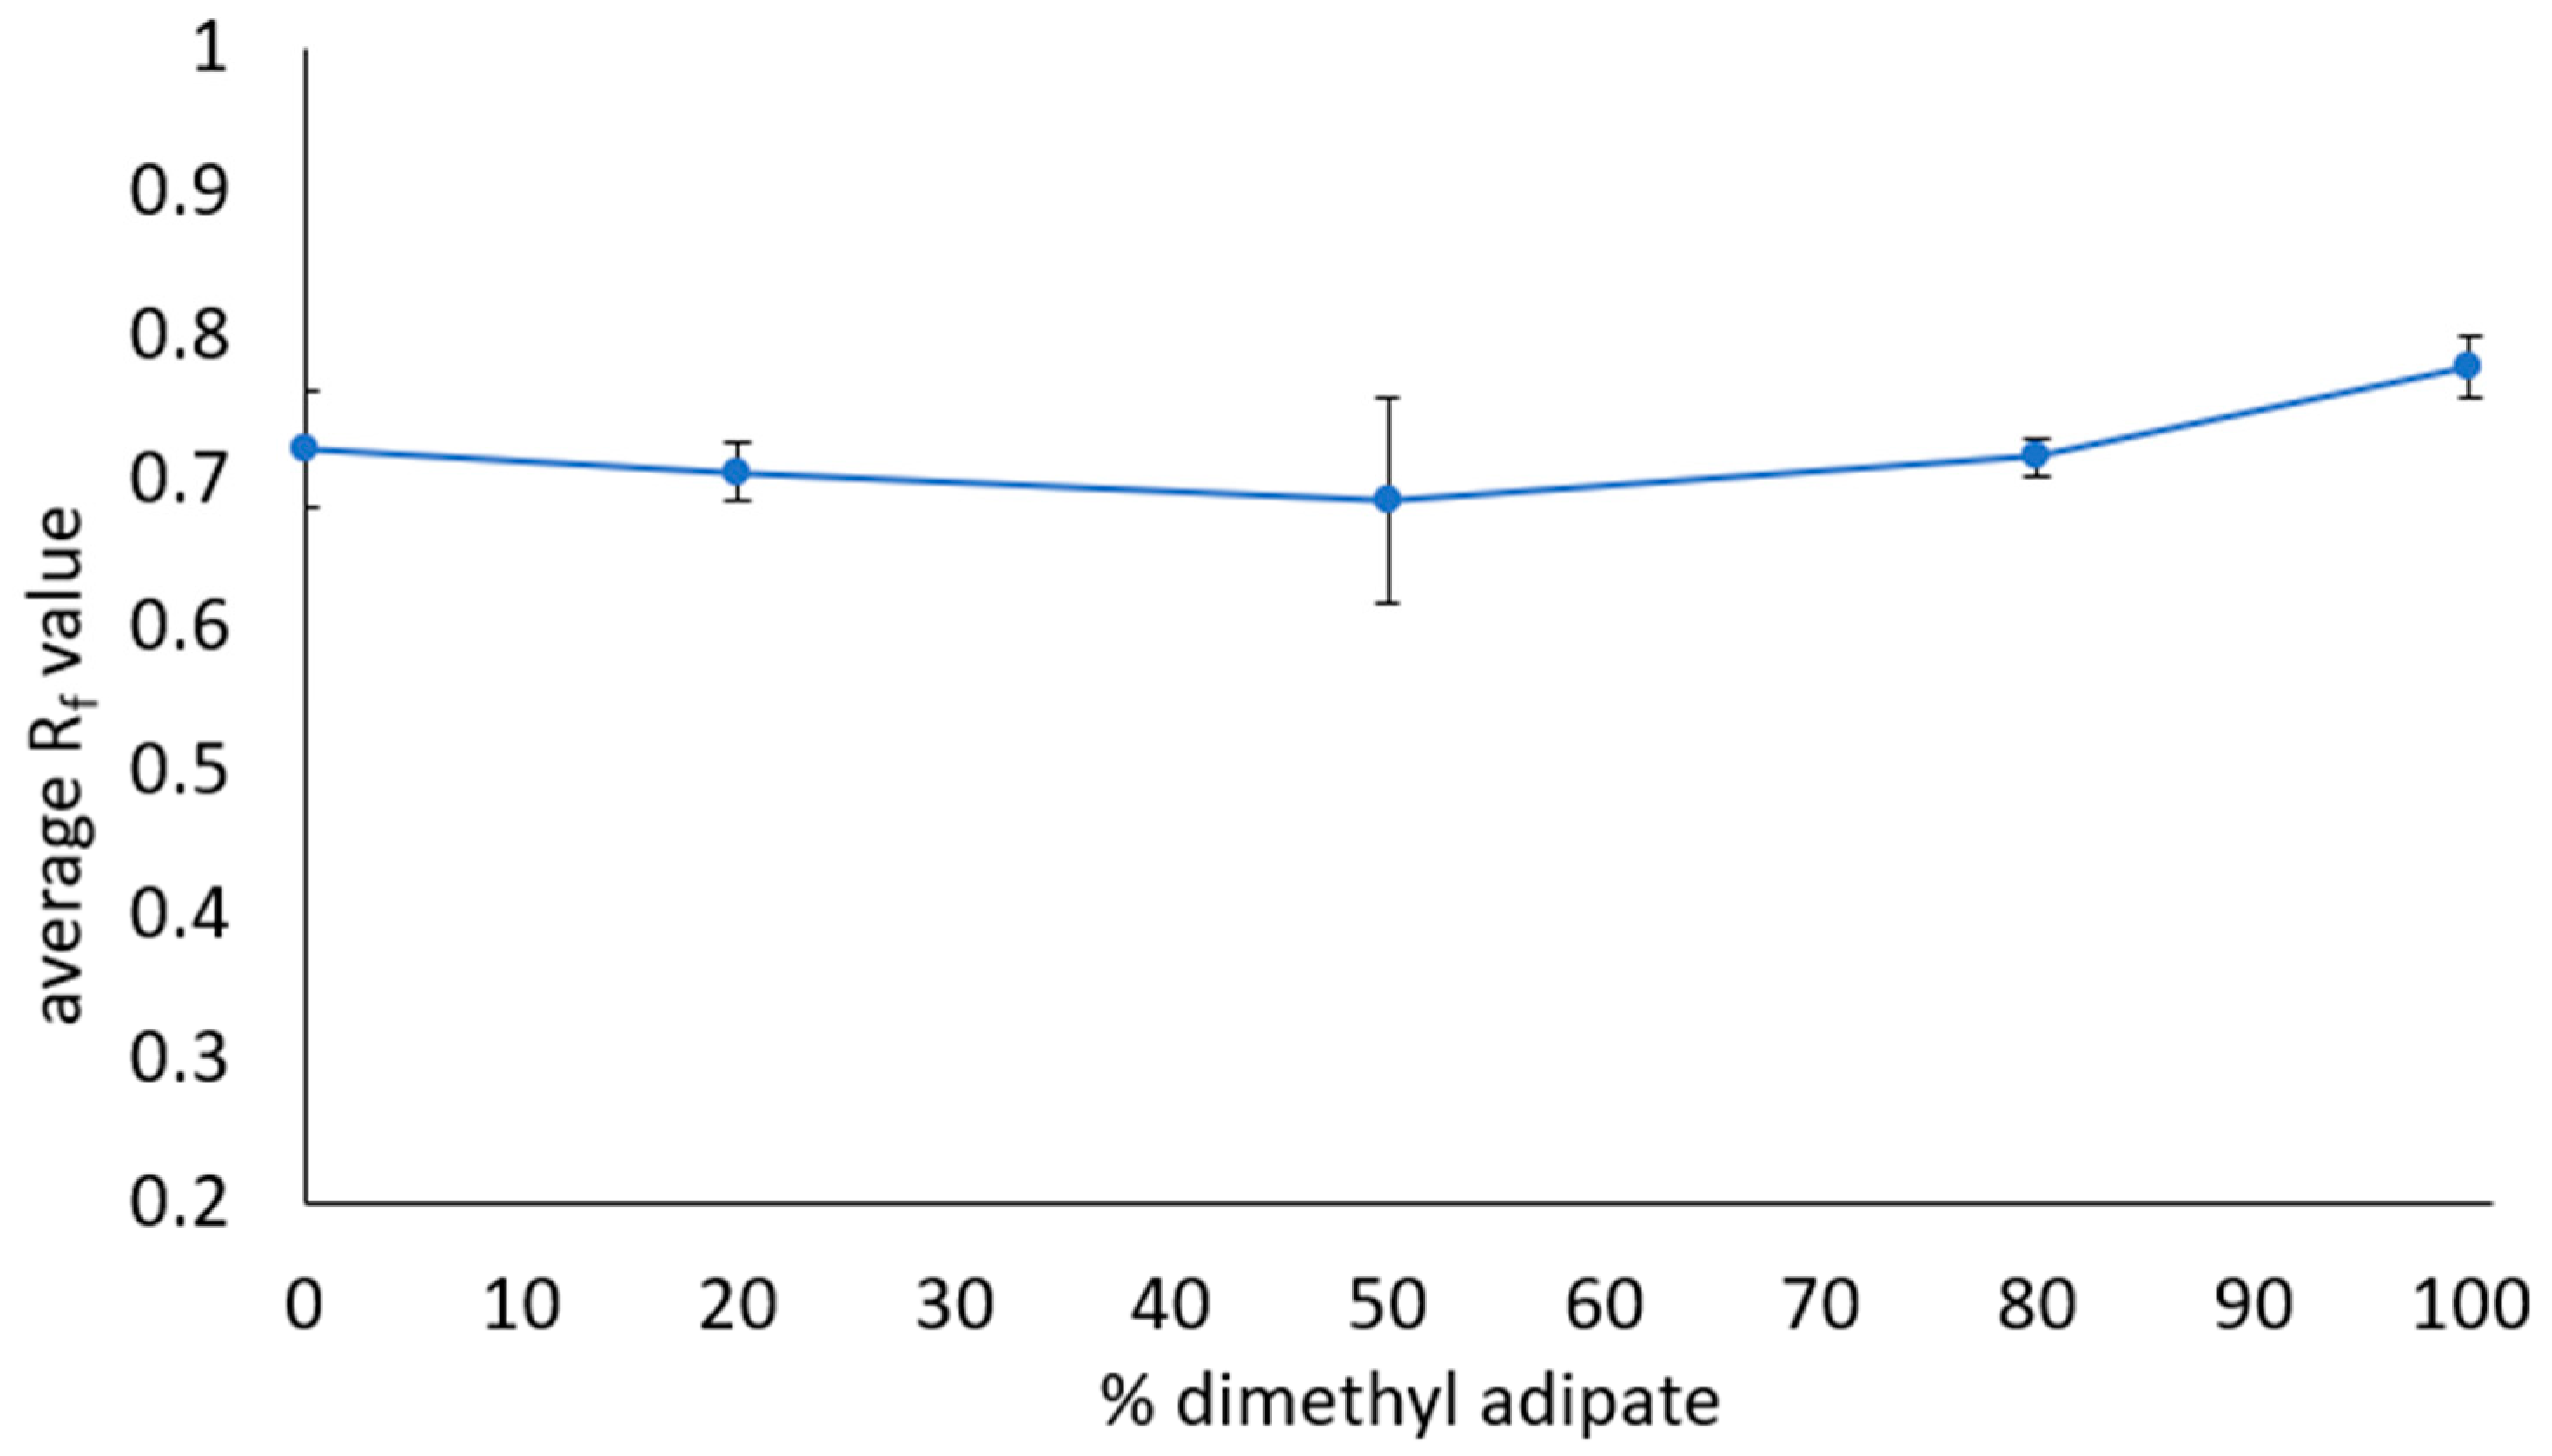
The four solvent blend combinations were then analyzed using TLC performance testing. The identified solvent blends were used as the mobile phase during testing and the TLC results were compared to that of DCM. The initial TLC test results for the ethyl acetate/1,3 dioxolane blend combination had the worst performance out of the four solvent blend combinations, and therefore no additional trials were conducted for this blend. After initial testing of the DCM replacement solvent blends was completed, additional TLC testing was then conducted with the remaining three solvent blend combinations at varying blend ratios to identify the effect of blend ratio on the TLC results. This additional testing also allowed us to see if varying the solvent ratio for each optimized blend combination would result in acceptable Rf value results. Three replicates for each solvent blend ratio selected were tested. For example, the dimethyl adipate and 1,3 dioxolane solvent blend was tested (with three replicates) at the following dimethyl adipate concentrations: 0%, 30%, 50%, 70%, and 100%. Rf values from all replicates were averaged and are shown in Figure 5, Figure 6 and Figure 7. Blends containing methyl acetate and ethyl acetate were found to show the closest TLC data to that of DCM with all values in the target Rf range of 0.4 to 0.8. Despite having very similar chemical structures, blends of methyl acetate and ethyl acetate showed lower Rf values than that of either of the two solvents in pure form. The results suggest that chemical interactions between the constituents of a solvent blend play a part in affecting the separation abilities of the blend and should be further investigated in future research.

4. Conclusions

This study illustrates that dissolution testing along with applying the Hansen Solubility Parameter theory can be used to effectively measure the solubility of different analytes and provide information about the interactions between the solutes and solvents. The data-processing methods from this study are effective at identifying a targeted list of optimized solvents and binary solvent blends to replace toxic solvents such as DCM. TLC testing was used to evaluate how the alternative solvents were able to separate the analytes as compared to DCM. The identified potential replacement solvents and solvent blends were found to have better analyte separation than DCM. Tested individual solvents were shown to have Rf values at least 0.2 above that for DCM. The optimized solvent blends were found to have Rf values around 0.7, within the acceptable range for use in a pharmaceutical setting. The solvent blend combination containing methyl acetate and ethyl acetate showed the most promising TLC results with the closest Rf values to that of DCM. More specifically, the methyl acetate and ethyl acetate blend with a ratio of 20%/80% performed the best out of all blends tested with an average Rf value of 0.63. These research results are of value towards improving worker safety during pharmaceutical manufacturing processes. By eliminating exposure to the substance, the number of workplace-related health issues can be reduced, thus also leading to a reduction in worker injury costs and higher company profits. In addition, other green aspects of the potential alternatives to DCM could be evaluated including global warming potential, energy consumption (e.g., during solvent recovery), waste generation, animal toxicity, and photochemical smog potential. These aspects could be investigated using all GSK scoring categories and life cycle assessment software tools such as GaBi or SimaPro [42].

Supplementary Materials

The following are available online at https://www.mdpi.com/article/10.3390/separations8100172/s1, Figure S1: Sphere showing good and bad solvents for acetaminophen, 2 min, Figure S2: Sphere showing good and bad solvents for aspirin, 2 min, Figure S3: Sphere showing good and bad solvents for ibuprofen, 2 min, Figure S4: Acetaminophen and Caffeine spotted on the TLC plate with (left) Ethyl Acetate and Acetone, and (right) Ethyl Acetate as mobile phase under a UV lamp, Table S1: Fit, D, P, and H values of APIs in different time intervals.

Author Contributions

Conceptualization, W.-T.C. and G.M.; methodology, W.-T.C., E.Y. and A.S.; software, E.Y. and D.T.N.; validation, A.S. and E.Y.; formal analysis, A.S. and E.Y.; investigation, A.S. and E.Y.; resources, W.-T.C. and G.M.; data curation, A.S., E.Y. and D.T.N.; writing—original draft preparation, A.S. and E.Y.; writing—review and editing, all; visualization, A.S. and E.Y.; supervision, W.-T.C. and G.M.; project administration, W.-T.C. and G.M.; funding acquisition, W.-T.C. and G.M. All authors have read and agreed to the published version of the manuscript.

Funding

This research was funded by the Toxics Use Reduction Institute (Academic Research Grants) and the University of Massachusetts Lowell (start-up funds).

Data Availability Statement

The data presented in this study are available on request from the corresponding author.

Acknowledgments

The authors would like to acknowledge the technical input received during this research project by personnel from Johnson Matthey, a manufacturer of active pharmaceutical ingredients. The authors would also like to acknowledge Gregory Reimonn for his contribution towards the python coding system used during the solvent optimization process, and Taofeng Lu for his discussion and training for using HSP.

Conflicts of Interest

The authors declare no conflict of interest.

References

  1. Bryan, M.C.; Dunn, P.J.; Entwistle, D.; Gallou, F.; Koenig, S.G.; Hayler, J.D.; Hickey, M.R.; Hughes, S.; Kopach, M.E.; Moine, G.; et al. Key Green Chemistry research areas from a pharmaceutical manufacturers’ perspective revisited. Green Chem. 2018, 20, 5082–5103. [Google Scholar] [CrossRef] [Green Version]
  2. Wilson, J.D. Toxicological Profile for Methylene Chloride; United States Department of Health and Human Services, Ed.; Agency for Toxic Substances and Disease Registry: Atlanta, GA, USA, 2000.
  3. U.S. Government. Toxicological Review of Dichloromethane (Methylene Chloride); U.S. Environmental Protection Agency, Ed.; U.S. Environmental Protection Agency: Washington, DC, USA, 2011.
  4. Pietsch, A. Decaffeination—Process and Quality. In The Craft and Science of Coffee; Elsevier: Amsterdam, The Netherlands, 2017; pp. 225–243. [Google Scholar]
  5. Han, S.O.; Son, W.K.; Youk, J.H.; Lee, T.S.; Park, W.H. Ultrafine porous fibers electrospun from cellulose triacetate. Mater. Lett. 2005, 59, 2998–3001. [Google Scholar] [CrossRef]
  6. Moulishankar, A.; Ganesan, P.; Elumalai, M.; Lakshmanan, K. Significance of TLC and HPTLC in Phytochemical Screening of Herbal Drugs. J. Glob. Pharma Technol. 2020, 13, 30–45. [Google Scholar]
  7. Jessop, P.G.; Jessop, D.A.; Fu, D.; Phan, L. Solvatochromic parameters for solvents of interest in green chemistry. Green Chem. 2012, 14, 1245–1259. [Google Scholar] [CrossRef]
  8. Gao, F.; Ferlin, F.; Bai, R.; Li, M.; Vaccaro, L.; Gu, Y. Replacing halogenated solvents by a butyl acetate solution of bisphenol S in the transformations of indoles. Green Chem. 2021, 23, 3588–3594. [Google Scholar] [CrossRef]
  9. Taygerly, J.P.; Miller, L.M.; Yee, A.; Peterson, E.A. A convenient guide to help select replacement solvents for dichloromethane in chromatography. Green Chem. 2012, 14, 3020–3025. [Google Scholar] [CrossRef]
  10. Lu, T.; Reimonn, G.; Morose, G.; Yu, E.; Chen, W.-T. Removing Acrylic Conformal Coating with Safer Solvents for Re-Manufacturing Electronics. Polymers 2021, 13, 937. [Google Scholar] [CrossRef]
  11. Islam, T.; Sarker, Z.I.; Uddin, A.H.; Bin Yunus, K.; Prasad, R.; Mia, A.R.; Ferdosh, S. Kamlet Taft Parameters: A Tool to Alternate the Usage of Hazardous Solvent in Pharmaceutical and Chemical Manufacturing/Synthesis—A Gateway towards Green Technology. Anal. Chem. Lett. 2020, 10, 550–561. [Google Scholar] [CrossRef]
  12. Nallar, M.; Tenaglia, N.; Morose, G.; Wong, H.-W. Safer Solvent Blends for Food, Dye, and Environmental Analyses Using Reversed-Phase High Performance Liquid Chromatography. Chromatographia 2021, 84, 1–12. [Google Scholar] [CrossRef]
  13. Pires, P.A.; Seoud, O.A.E.; Machado, V.G.; de Jesus, J.C.; de Melo, C.E.; Buske, J.L.; Cardozo, A.P. Understanding Solvation: Comparison of Reichardt’s Solvatochromic Probe and Related Molecular “Core” Structures. J. Chem. Eng. Data 2019, 64, 2213–2220. [Google Scholar] [CrossRef]
  14. Reichardt, C. Solvatochromic dyes as solvent polarity indicators. Chem. Rev. 1994, 94, 2319–2358. [Google Scholar] [CrossRef]
  15. Hansen, C.M. Hansen Solubility Parameters: A User’s Handbook; CRC Press: Boca Raton, FL, USA, 2002. [Google Scholar]
  16. Gaikwad, E.R.; Khabade, S.S.; Sutar, T.B.; Bhat, M.R.; Payghan, S.A. Three-dimensional hansen solubility parameters as predictors of miscibility in cocrystal formation. Asian J. Pharm. Bull. 2017, 11, 302–318. [Google Scholar]
  17. Yu, H.; Le, H.M.; Kaale, E.; Long, K.D.; Layloff, T.; Lumetta, S.S.; Cunningham, B.T. Characterization of drug authenticity using thin-layer chromatography imaging with a mobile phone. J. Pharm. Biomed. Anal. 2016, 125, 85–93. [Google Scholar] [CrossRef] [PubMed] [Green Version]
  18. Rivai, H.; Kardela, W.; Kartanti, A. Development and validation of analysis method for tablet ibuprofen by thin layer chromatography-densitometry. J. Chem. Pharm. Res. 2016, 8, 324–329. [Google Scholar]
  19. Komsta, Ł.; Kobyłka, M. Chemometric Approach to Selectivity in TLC with Densitometric Detection. J. Chromatogr. Sci. 2012, 51, 400–405. [Google Scholar] [CrossRef] [Green Version]
  20. Ferenczi-Fodor, K.; Végh, Z.; Renger, B. Thin-layer chromatography in testing the purity of pharmaceuticals. TrAC Trends Anal. Chem. 2006, 25, 778–789. [Google Scholar] [CrossRef]
  21. Jankovic, S.; Tsakiridou, G.; Ditzinger, F.; Koehl, N.; Price, D.J.; Ilie, A.-R.; Kalantzi, L.; Kimpe, K.; Holm, R.; Nair, A.; et al. Application of the solubility parameter concept to assist with oral delivery of poorly water-soluble drugs—A PEARRL review. J. Pharm. Pharmacol. 2019, 71, 441–463. [Google Scholar] [CrossRef] [Green Version]
  22. Abbott, S.; Hansen, C.M. Hansen Solubility Parameters in Practice; Hansen-Solubility.com: Online, 2008; Volume 110. [Google Scholar]
  23. Hansen, C.M. The Three Dimensional Solubility Parameter; Danish Technical: Copenhagen, Denmark, 1967; Volume 14. [Google Scholar]
  24. Abbott, S. Solubility Science: Principles and Practice; University of Leeds: Leeds, UK, 2017; pp. 109–110. [Google Scholar]
  25. MIT OpenCourse. Thin Layer Chromatography (TLC) Guide. 2012. Available online: https://ocw.mit.edu/courses/chemistry/5-301-chemistry-laboratory-techniques-january-iap-2012/labs/MIT5_301IAP12_TLC_Handout.pdf (accessed on 16 September 2021).
  26. Santiago, M.; Strobel, S. Thin layer chromatography. Methods Enzymol. 2013, 533, 303–324. [Google Scholar] [PubMed]
  27. Peter, E.W. Thin-Layer Chromatography: A Modern Practical Approach; RSC Chromatography Monographs; Royal Society of Chemistry: London, UK, 2005; p. 184. [Google Scholar]
  28. Bettelheim, F.A.; Landesberg, J.M. Experiments for Introduction to Organic Chemistry: A Miniscale Approach; Saunders College Publishing: Philadelphia, PA, USA, 1997; p. 57. [Google Scholar]
  29. Masters, K.M.; Williamson, K.L. Macroscale and Microscale Organic Experiments; Cengage Learning: Boston, MA, USA, 2016; pp. 161–162. [Google Scholar]
  30. De los Ríos, M.D.; Ramos, E.H. Determination of the Hansen solubility parameters and the Hansen sphere radius with the aid of the solver add-in of Microsoft Excel. SN Appl. Sci. 2020, 2, 1–7. [Google Scholar] [CrossRef] [Green Version]
  31. Condon, G. In World of over-the-Counter Pain Relief, the Venerable Aspirin Gets: Hartford Courant. 2018. Available online: www.courant.com/news/connecticut/hc-xpm-1993-02-05-0000106290-story.html (accessed on 16 September 2021).
  32. Chen, D.; Sun, Q.; Huang, W.; Yang, B.-S. Diverse Solvent Selection for Polymorph Landscape Investigation Based on Specific API–Solvent Interactions. Cryst. Growth Des. 2020, 20, 2251–2265. [Google Scholar] [CrossRef]
  33. Pyka, A.; Budzisz, M.; Dołowy, M. Validation Thin Layer Chromatography for the Determination of Acetaminophen in Tablets and Comparison with a Pharmacopeial Method. BioMed Res. Int. 2013, 2013, 1–10. [Google Scholar] [CrossRef] [PubMed] [Green Version]
  34. Tavallali, H.; Zareiyan, J.S.F.; Naghian, M. An Efficient and Simultaneous Analysis of Caffeine and Paracetamol in Pharmaceutical Formulations Using TLC with a Fluorescence Plate Reader. J. AOAC Int. 2011, 94, 1094–1099. [Google Scholar] [CrossRef] [PubMed] [Green Version]
  35. Northern Arizona University, Thin Layer Chromatography of Analgesics and Amino Acids. Available online: https://jan.ucc.nau.edu/~jkn/235L7-TLC%20Analgesics.htm (accessed on 16 September 2021).
  36. Alder, C.M.; Hayler, J.D.; Henderson, R.K.; Redman, A.M.; Shukla, L.; Shuster, L.E.; Sneddon, H.F. Updating and further expanding GSK’s solvent sustainability guide. Green Chem. 2016, 18, 3879–3890. [Google Scholar] [CrossRef]
  37. Toxics Use Reduction Institute, Pollution Prevention Options Analysis System: P2OASys. 2021. Available online: https://p2oasys.turi.org/ (accessed on 21 August 2021).
  38. Chemicals, G.F.S. GreenScreen Chemicals. 2021. Available online: https://www.greenscreenchemicals.org/ (accessed on 21 August 2021).
  39. Gauthier, A.M.; Fung, M.; Panko, J.; Kingsbury, T.; Perez, A.L.; Hitchcock, K.; Ferracini, T.; Sahmel, J.; Banducci, A.; Jacobsen, M.; et al. Chemical assessment state of the science: Evaluation of 32 decision-support tools used to screen and prioritize chemicals. Integr. Environ. Assess. Manag. 2015, 11, 242–255. [Google Scholar] [CrossRef] [PubMed]
  40. Marcus, Y. Are solubility parameters relevant to supercritical fluids? J. Supercrit. Fluids 2006, 38, 7–12. [Google Scholar] [CrossRef]
  41. MilliporeSigma. 2021. Available online: https://www.emdmillipore.com/US/en (accessed on 31 May 2021).
  42. Gandhi, N.; Farfaras, N.; Wang, N.-H.L.; Chen, W.-T. Life Cycle Assessment of Recycling High-Density Polyethylene Plastic Waste. J. Renew. Mater. 2021, 9, 1463–1483. [Google Scholar] [CrossRef]
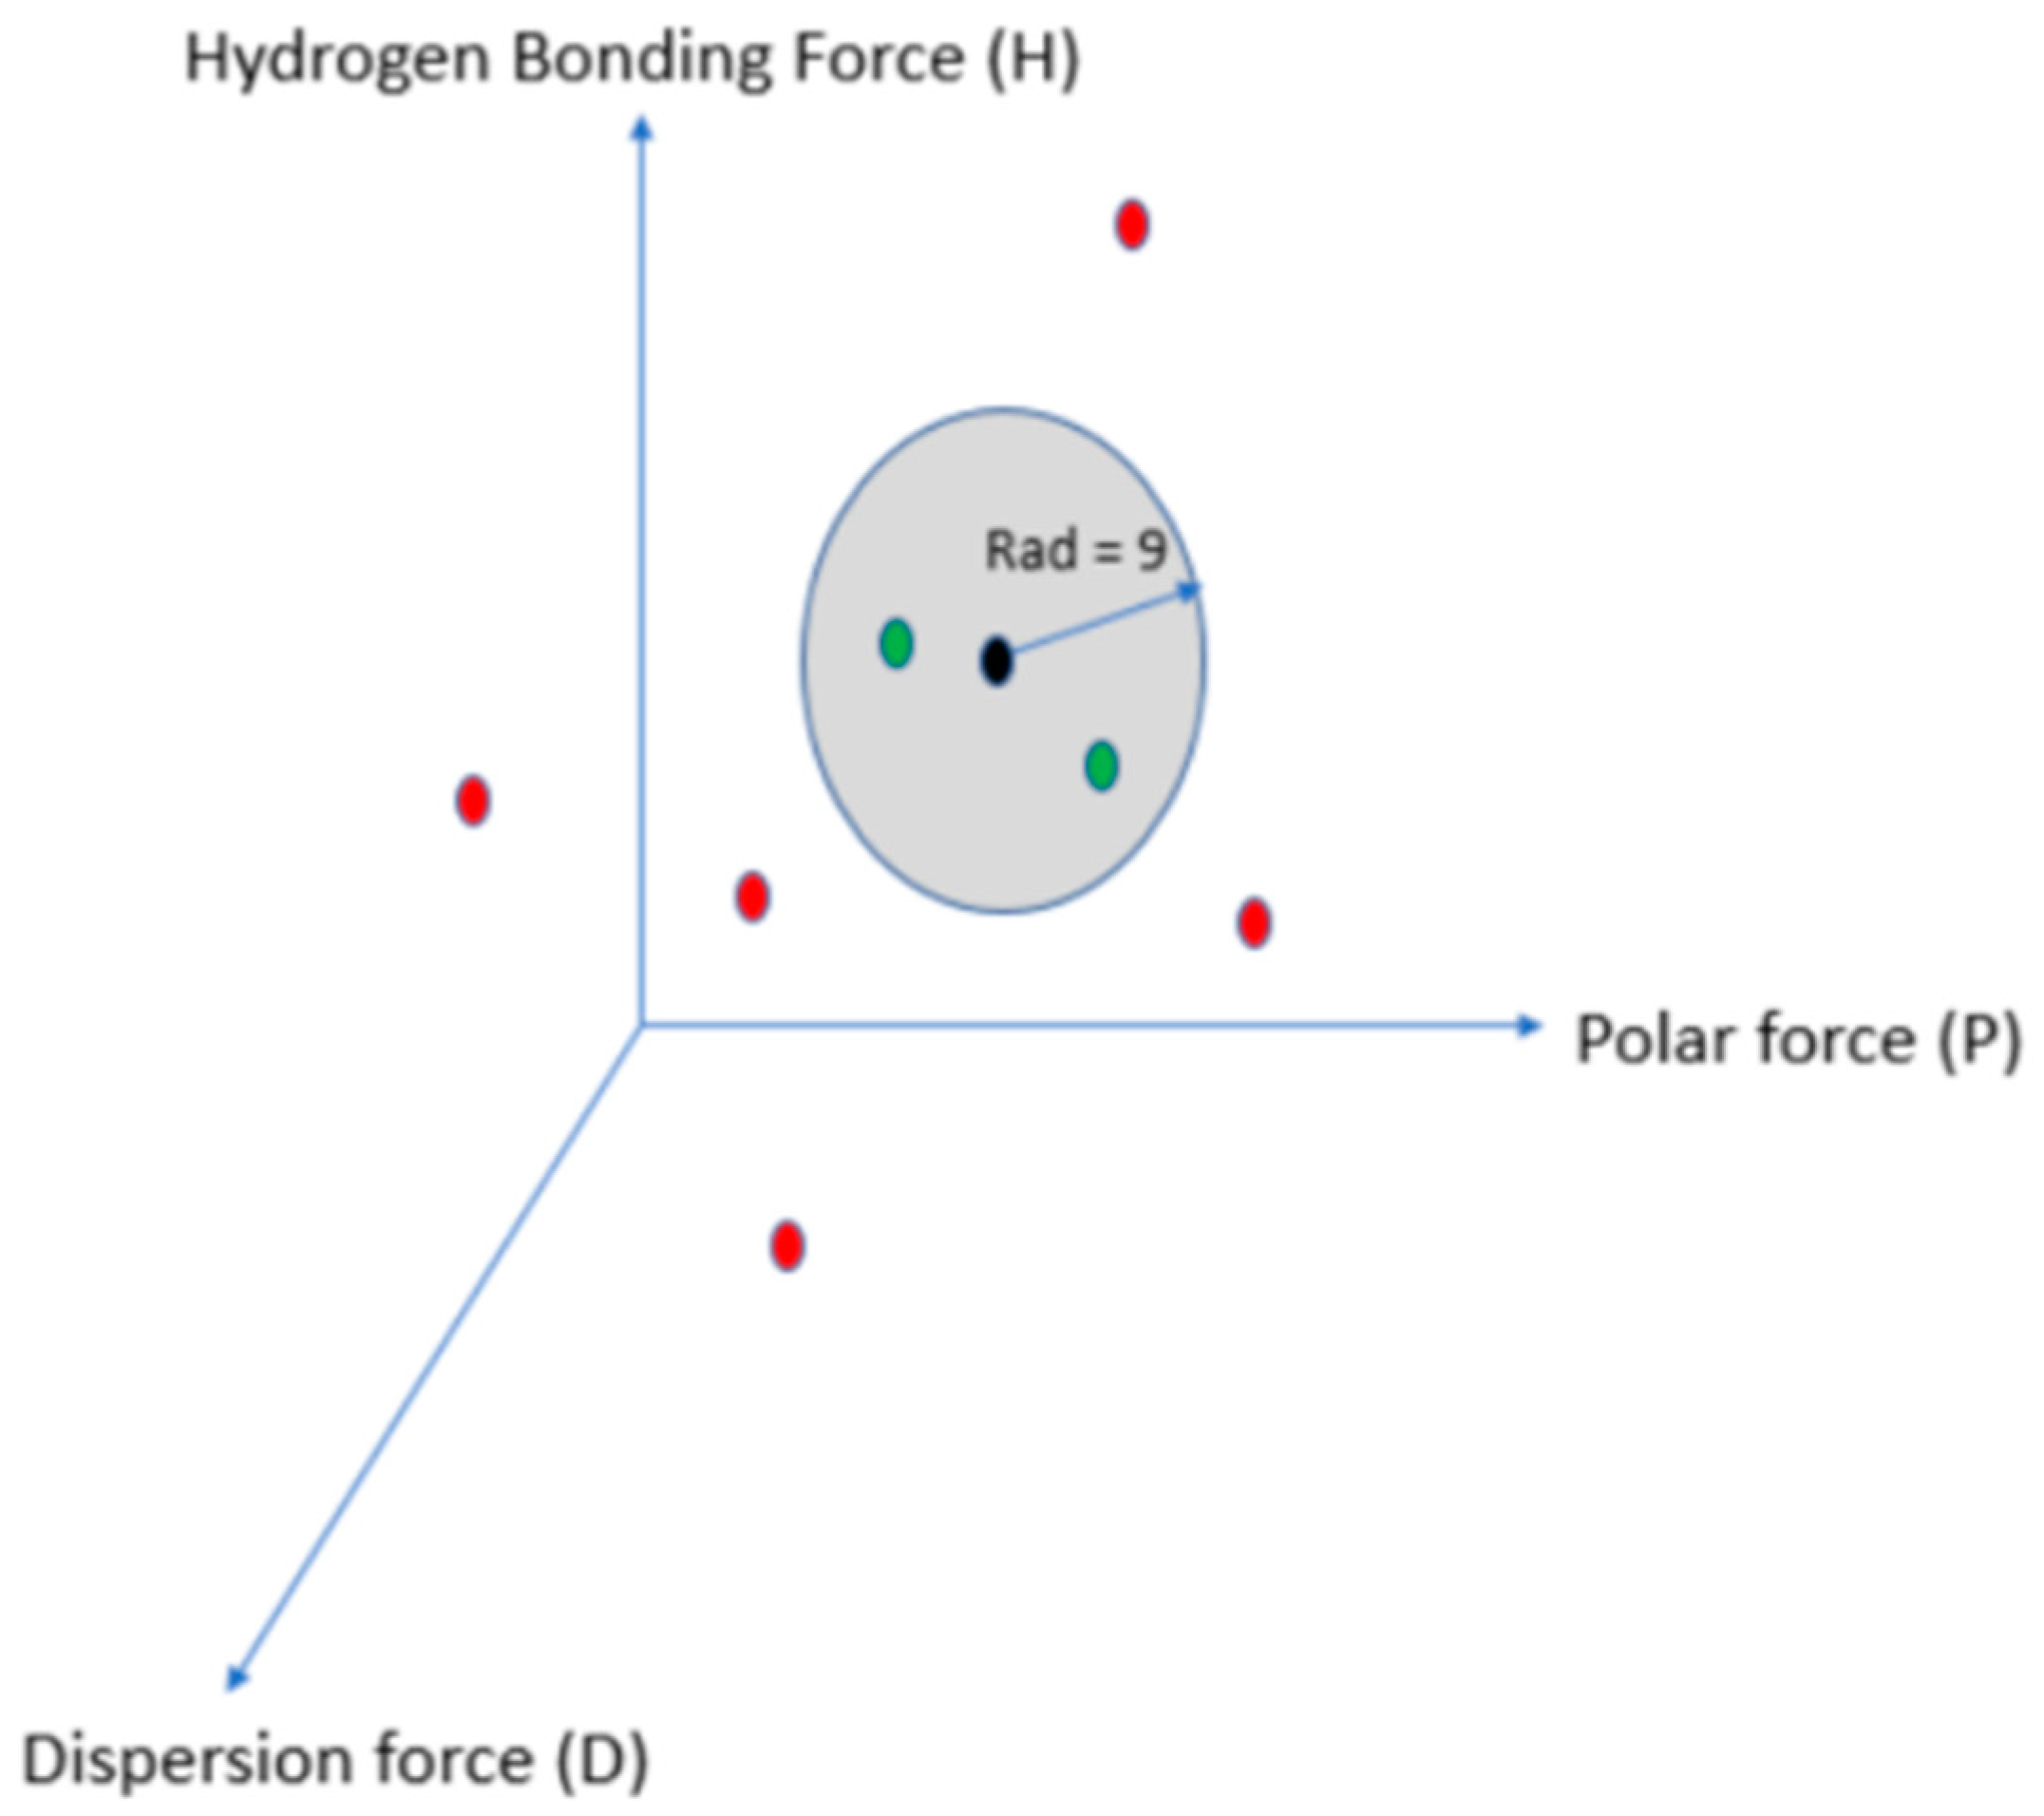
Figure 1. Solvents and sphere of solubility in Hansen Solubility Parameter 3D Space; Red points represent solvents located outside of the solubility sphere and green points represent solvents located within the solubility sphere.
Separations 08 00172 g001
Figure 2. Workflow diagram of thin-layer chromatography: Cut TLC is spotted with solution of API dissolved in methanol and exposed to a mobile phase for development. Fully developed plates are subsequently removed and exposed to UV light to identify the distance traveled by the API on the plate which is recorded.
Separations 08 00172 g002
Figure 3. The Retention factor (Rf): A ratio between the solvent front (the green line) and the distance moved by the analytes from the origin (the blue line).
Separations 08 00172 g003
Figure 4. Rf values of acetaminophen for each solvent (n = 3).
Separations 08 00172 g004
Figure 5. Comparison between Rf Values for various methyl acetate/ethyl acetate blend concentrations (n = 3).
Separations 08 00172 g005
Figure 6. Comparison between Rf Values for various dimethyl adipate/1,3 dioxolane blend concentrations (n = 3).
Separations 08 00172 g006
Figure 7. Comparison between Rf Values for various dimethyl adipate/ethyl acetate blend concentrations (n = 3).
Separations 08 00172 g007
Table 1. Results from dissolution testing after 2 min (Ace: acetaminophen; Asp: aspirin; Ibu: ibuprofen).
Solvent and Solvent BlendsHansen Solubility ParametersScores with 2 min Dissolution Time 1
δDδPδHAceAspIbu
acetic acid14.5813.5001
acetone15.510.47111
acetonitrile15.3186.1001
acetophenone18.894001
amyl acetate15.83.36.1001
anisole17.84.46.9001
cyclohexanone17.88.45.1000
cyclopentyl methyl ether16.74.34.3001
cyrene18.912.47.1000
diacetone alcohol15.88.210.8000
dichloromethane177.37.1001
diethyl ether14.52.94.6001
dimethyl adipate16.36.88.5001
DI Water15.51642.3000
DMF17.413.711.3111
DMSO18.416.410.2001
ethanol15.88.819.4111
ethyl acetate15.85.37.2001
ethylene glycol171126000
formic acid14.61014100
glycerol17.411.327.2000
Isophorone1785000
methanol14.712.322.3111
n-butyl benzoate18.35.65.5000
n-heptane15.300000
sulfolane17.817.48.7000
tetrahydrofuran16.85.78011
toluene181.42001
xylene17.813.1001
1 bromonaphthalene20.63.14.1000
1 chlorobutane16.25.52001
1 methoxy 2 propanol (propylene glycol monomethyl ether)15.66.311.6000
1 2 propanediol monomethyl ether acetate15.65.69.8001
1,4 dioxane17.16.87.8001
1 2 3 4 tetrahydronaphthalene19.622.9000
2 butanol15.85.714.5000
2-picoline18.46.45.7011
cyclohexanone (65%) + PG monomethyl ether (35%) 2177.77.4000
ethanol (80%) + toluene (20%) 216.27.315.9000
ethyl acetate (60%) + acetone (40%) 215.77.37.1001
ethyl acetate (75%) + ethanol (25%) 215.86.210.3001
tetrahydrofuran (55%) + cyclohexanone (45%) 217.36.96.7001
tetrahydrofuran (85%) + toluene (15%) 2175.17.1011
water (50%) + acetonitrile (50%) 215.41724.2000
1 Scoring Criteria, 0: API not fully dissolved within 2 min, 1: API fully dissolved within 2 min. 2 Solvent blend matrix created with D, P, and H values closer to DCM to improve the reliability of the HSP sphere.
Table 2. Distances traveled by spots (Spot 1: Acetaminophen; Spot 2: Caffeine).
Solvent/Solvent BlendDistance Traveled by
Spot 1 (cm)
Distance Traveled by
Spot 2 (cm)
Distance between the Spots
DCM2.62.40.2
1,4 dioxane3.42.80.6
dimethyl adipate2.51.90.6
cyclohexanone2.61.90.7
cylohexanone (65%) + PG monomethyl ether (35%)3.01.81.2
PG monomethyl ether3.32.01.3
ethyl acetate (75%) + ethanol (25%)4.32.81.5
ethyl acetate (60%) + acetone (40%)4.52.91.6
ethyl acetate3.92.21.7
Table 3. Hazard classification of screened solvents.
SolventTURI P2OAsys
10: High Hazard
2: Low Hazard
GSK Scores
1: High Hazard
10: Low Hazard
Green Screen Score
BM-1: High Hazard;
BM-4: Low Hazard
Reasons for Selection
DCM7.84BM-1Baseline, chemical to be replaced
1,4 dioxane7.94BM-LT1HSP similar to DCM to evaluate
cyclohexanone7.86No evaluationHSP similar to DCM to evaluate
1,3 dioxolane6.5No evaluationBM-2Safer alternative to evaluate
acetone5.48BM-2Safer alternative to evaluate
PG monomethyl ether5.0No evaluationNo evaluationSafer alternative to evaluate
ethyl acetate4.28.0No evaluationSafer alternative to evaluate
methyl acetate4.1No evaluationBM-2Safer alternative to evaluate
dimethyl adipate3.5No evaluationNo evaluationSafer alternative to evaluate
Table 4. Potential DCM replacement solvent blends.
Blend CombinationBlend Ratio
(Solvent 1/Solvent 2)
Blend Price (USD)Max Boiling Point (C)
dimethyl adipate/1,3 dioxolane72/28$115215.2
ethyl acetate/1,3 dioxolane51/49$11878
methyl acetate/ethyl acetate56/44$9877
dimethyl adipate/ethyl acetate50/50$90215.2
Publisher’s Note: MDPI stays neutral with regard to jurisdictional claims in published maps and institutional affiliations.