Article

Tyrosol and Hydroxytyrosol Determination in Extra Virgin Olive Oil with Direct Liquid Electron Ionization-Tandem Mass Spectrometry

by
Veronica Termopoli
1,
Maurizio Piergiovanni
1,
Achille Cappiello
1,2,
Pierangela Palma
1,2 and
Giorgio Famiglini
1,*
1
LC–MS Laboratory, Department of Pure and Applied Sciences, University of Urbino Carlo Bo, 61029 Urbino, Italy
2
Department of Chemistry, Vancouver Island University (VIU), Nanaimo, BC V9R 5S5, Canada
*
Author to whom correspondence should be addressed.
Separations 2021, 8(10), 173; https://doi.org/10.3390/separations8100173
Submission received: 22 July 2021 / Revised: 21 September 2021 / Accepted: 29 September 2021 / Published: 6 October 2021

Abstract

:
Extra virgin olive oil (EVOO) is one of the main ingredients of the Mediterranean diet. It is claimed as a functional food for its unique content of health-promoting compounds. Tyrosol (Tyr), Hydroxytyrosol (Htyr), and their phenolic derivatives present in EVOO show beneficial properties, and their identification and quantification, both in their free form and after the hydrolysis of more complex precursors, are important to certify its quality. An alternative method for quantifying free and total Tyr and Htyr in EVOO is presented using an LC–MS interface based on electron ionization (EI), called liquid electron ionization (LEI). This method requires neither sample preparation nor chromatography; the sample is diluted and injected. The selectivity and sensitivity were assessed in multiple reaction monitoring mode (MRM), obtaining confirmation and quantification in actual samples ranging from 5 to 11 mg/Kg for the free forms and from 32 to 80 mg/Kg for their total amount after hydrolysis. Two MS/MS transitions were acquired for both compounds using the Q/q ratios as confirmatory parameters. Standard addition calibration curves demonstrated optimal linearity and negligible matrix effects, allowing a correct quantification even without expensive and difficult to find labeled internal standards. After several weeks of operation, the system’s repeatability was excellent, with an intraday RSD (%) spanning from five to nine and an interday RSD (%) spanning from 9 to 11.

1. Introduction

Extra virgin olive oil (EVOO) is widely used in the Mediterranean diet. EVOO is obtained after mechanical treatments of olives aimed to preserve their nutritional characteristics, and it is gaining interest worldwide thanks to its well-known dietary and nutraceutical values associated with several health benefits [1,2,3,4]. It is characterized by a unique composition of minor components, together with many monounsaturated fatty acids, triacylglycerols, vitamin K, and vitamin E. Minor components are phenolic compounds belonging to four major classes: flavonoids, lignans, simple phenols, and secoiridoids [5]. Polyphenols in olives are unique and responsible for their organoleptic and sensory properties, such as the characteristic and distinctive aroma [6]. Polyphenols may inhibit oxidation reactions of EVOO and indirectly play a significant role in preventing cancer, aging, and chronic diseases, such as atherosclerosis, obesity, diabetes, and many others. [7,8,9,10,11,12,13,14,15].
Several parameters contribute to the presence of phenolic compounds and their derivatives in EVOO, such as cultivar, fruit integrity and maturity, agricultural practices, production processes, and storage length. In the literature of the last ten years, many studies aimed to optimize all of those parameters that can improve the qualitative and quantitative composition of the phenolic profile. Several other studies have attempted to elucidate the ultimate mechanisms through which EVOO-derived phenols contribute to health benefits. Among all the phenols, hydroxytyrosol (Htyr) was listed as one of the most potent therapeutic and nutraceutical agents for its antimicrobial, antithrombotic, and anti-inflammatory effects and its capacity to eradicate intracellular and extracellular reactive oxygen species [16,17].
European Commission (EC) Regulation No. 432/2012 has listed the permitted health claims for foods and nutrients that refer to the reduction of disease risk and children’s development and health [18]. Olive oil polyphenols are claimed to “contribute to the protection of blood lipids from oxidative stress”, and “the claim may be used only for olive oil containing at least 5 mg of hydroxytyrosol and its derivatives (e.g., oleuropein complex and tyrosol, Tyr) per 20 g of olive oil. In order to bear the claim, information shall be given to the consumer that the beneficial effect is obtained with a daily intake of 20 g of olive oil” [19].
Starting from this regulation, the EC encourages EVOO producers to dose polyphenols in their products to certify high-quality and healthy properties. A clear, descriptive label on the bottles should inform consumers of the potential nutritional benefits. Despite this suggestion, the regulation does not indicate the official methods to obtain these data, and, at present, only a limited number of EVOO products are labeled with this information. This gap lies in the difficulty of determining the polyphenols content accurately and the lack of official methods and a list of specific molecules to be determined. Most of the recommended methods have been proposed by the International Olive Council (IOC).
In 2009, the IOC approved a method in which polyphenols are extracted with a hydroalcoholic solution and analyzed by HPLC–DAD [20]. Even though the detection and quantification of all the phenolic substances, including flavonoids, is demonstrated, retention times and UV absorbance at 280 nm might not be sufficient to exclude false positives or erroneous quantification. Olive oil composition was explored in many scientific publications, and different protocols were presented. None of these methods can be considered “official” because no new regulations have been issued to fulfill this purpose [21,22]. GC–FID and LC–DAD are commonly used because they are relatively inexpensive, straightforward, readily available, and suitable with quality control laboratory practices [20,22,23,24,25,26,27]. The LC–MS and LC–MS/MS methods enhance selectivity and sensitivity in combination with complex and time-consuming sample preparation steps, such as liquid–liquid extraction (LLE), solid-phase extraction (SPE), or derivatization protocols. In most cases, sample preparation involves a hydrolysis step where all the polyphenols are reduced to simple phenols (Tyr and Htyr) to quantify their total content either in the polar fraction or directly in oil or olive oil mill wastewaters [28,29,30,31,32,33]. However, Tyr and Htyr are simple phenols to dose in oil samples to comply with EC regulation N. 432/2012, either in their free form or after the hydrolysis of more complex phenols. Simplified analytical protocols and confirmatory techniques are invoked to fulfill the lack of official methods for olive oil certification in terms of quality and nutritional properties [34]. Recently, paper spray tandem mass spectrometry was applied to quantify free and total Tyr and Htyr with good results in terms of reliability, rapidity, and sensitivity [35]. Alternatively, EVOO was characterized by the direct determination of the secoiridoids without the hydrolysis of the sample [36].
In this work, we present an alternative method to quantify free and total Tyr and Htyr in EVOO samples using a liquid electron ionization (LEI–MS/MS) approach in flow injection analysis (FIA) mode. LEI is a new LC–MS interface able to vaporize a nano-flow liquid effluent at ambient pressure before entering into an electron ionization MS source. One of the peculiar advantages of the LEI interface is the relatively low matrix effects (ME), which guarantees quantitative results from over- or underestimations [37,38]. A chromatographic pump conveys the samples into the LEI interface, where they vaporize before entering the EI source. Compared to previous attempts, the proposed method does not require chromatographic separation due to MS/MS selectivity and LEI robustness. This approach can be used for the preliminary screening of oil samples to identify and quantify free Tyr and Htyr to rapidly certify the excellent quality of olive oils, bypassing the purification or pre-concentration steps and time-consuming sample preparations. Oil samples with a low concentration of free Tyr and Htyr should be investigated deeper, after polyphenols hydrolysis, before quantification. This method was applied to the analysis of Htyr and Tyr of three EVOO samples produced in Italy in different regions: Marche, Sardinia, and Apulia. High-molecular weight polyphenols that do not vaporize using the LEI interface were hydrolyzed before the analysis to determine the total Tyr and Htyr amount required for the health claim.

2. Materials and Methods

2.1. Chemicals

The analytical standards of 3-hydroxytyrosol (Htyr) (CAS 10597-60-1) and of 2-(4-hydroxyphenyl)ethanol (Tyr) (CAS 501-94-0) (purity ≥ 98%) were purchased from Sigma-Aldrich (Milan, Italy). Water, acetonitrile, ethanol, and acetone (HyperSolv Chromanorm LC–MS grade) were purchased from VWR, Part of Avantor (Milan, Italy). HCl (37%), and HCOOH (≥96%) was purchased from Sigma-Aldrich (Milan, Italy).

2.2. Standard Solutions and Extra Virgin Olive Oil Samples

Tyr and Htyr stock solutions were prepared gravimetrically at the concentration of 1 and 10 mg/mL in acetone. All solutions were stored at 4 °C in sealed amber glass vials. Working solutions of each compound were prepared daily by diluting the stock solutions with acetone.
EVOO samples (n = 3) from Apulia, Marche, and Sardinia regions were produced from local groves in 2019–2020 and stored in dark containers. Before determining the free analytes, each sample was weighted to obtain 100 mg of sample and diluted 1:10 (w:v) with acetone before analysis.
EVOO samples were submitted to hydrolysis [30] to quantify Tyr and Htyr total amount. An aliquot (500 mg) of each sample was extracted with 1 mL of EtOH/H2O (0.1% HCOOH) 7:3 (v:v) vortexing for 3 min and then centrifuged. 100 µL of 2M HCl was added to 100 µL of the extract and hydrolyzed at 950 W microwave power at 130 °C for 10 min (MDS-2100-CEM-Microwave Technology Ltd., Buckingham, UK). The procedure was carried out in triplicate. Each hydrolysate was then diluted with 200 µL of acetone before the analysis.
Five-point calibration curves were plotted using the standard addition method for each EVOO sample (≅100 µL) by adding 2, 4, 6, 8 µL of the 1 mg/mL standard solutions. The same procedure was used to construct five-point calibration curves to determine the total amount of Tyr and Htyr after the hydrolysis process for each EVOO sample. Amounts of 2, 4, 6, and 8 µL of the 10 mg/mL standard solutions of Tyr and Htyr were added to the hydrolyzed samples.
After quantification (free and hydrolyzed Tyr and Htyr), fortified samples in acetone were prepared at the same concentration levels, and standard addition curves were plotted utilizing the procedure described above for matrix effect evaluation.
Free Tyr concentration determined in EVOO Marche and free Htyr concentration determined in EVOO Apulia were utilized to fortify corn oil samples, and standard addition curves were plotted starting from these fortified samples. Furthermore, standard addition calibration curves for corn oil were plotted from Tyr and Htyr concentrations determined in the hydrolyzed EVOO Marche sample. These corn oil curves helped to compare actual and acetone samples with a similar complex sample free of the analytes.

2.3. LC–LEI–MS/MS Apparatus and Working Conditions

An Agilent 1100 series nanoPump (Agilent Technologies, Palo Alto, CA, USA) was coupled to a triple quadrupole MS (Agilent 7010B, Agilent Technologies) operating in EI via an LEI interface and equipped with a high-efficiency source (HES) that allowed high ionization efficiency. The mobile phase was 20:80 H2O:ACN (v:v) at a 400 nL/min flow rate. A nano-column (Agilent Zorbax SB-C18, 0.075 × 150 mm, 3.5 μm particle size) was installed between the pump flow rate exit and the injector to guarantee sufficient backpressure to work in stable conditions and not for chromatographic purposes. Standard solutions and EVOO actual samples were analyzed in FIA using an external injector equipped with a 100 nL internal sample loop (VICI AG International, Schenkon, Switzerland). The LEI interface was thoroughly described elsewhere [36,37]; in this application, the vaporization micro-channel temperature was set at 300 °C. MS tuning was performed weekly at an ion source temperature of 280 °C using perfluorotributylamine as a reference compound. Check tune was performed daily in the same conditions. No mobile phase was admitted into the ion source during the tuning procedure. Analyses were carried out in full scan and multiple reaction monitoring (MRM) using the m/z range and transitions reported in Table 1. Ions at m/z 138 and 154 are radical ions formed during the EI process. They are used as precursor ions in MS/MS experiments. In Figure 1, structures and LEI–MS spectra of Tyr and Htyr are shown.

3. Results and Discussion

LEI–MS/MS offers a valid alternative in analyzing free and hydrolyzed phenols in EVOO because it relies on EI, a gas-phase ionization technique that occurs in-source at a high temperature and high vacuum where ion–ion or ion–molecule reactions are infrequent. These conditions explain why matrix effects (ME) are limited or absent compared with other LC–MS approaches [38]. Methods based on ESI–MS can provide accurate quantitative results only after addressing ME issues. Coeluted matrix components can represent a significant limitation when no sample preparation and fast analysis are required. Time-consuming and expensive extraction and purification procedures are needed to avoid or limit signal suppression or enhancement and develop adequate ME evaluation procedures. The EI process is highly reproducible, suitable for inter-laboratory assays, and the resulting spectra can be compared with those present in database libraries for the undoubted identification in targeted and untargeted analysis.

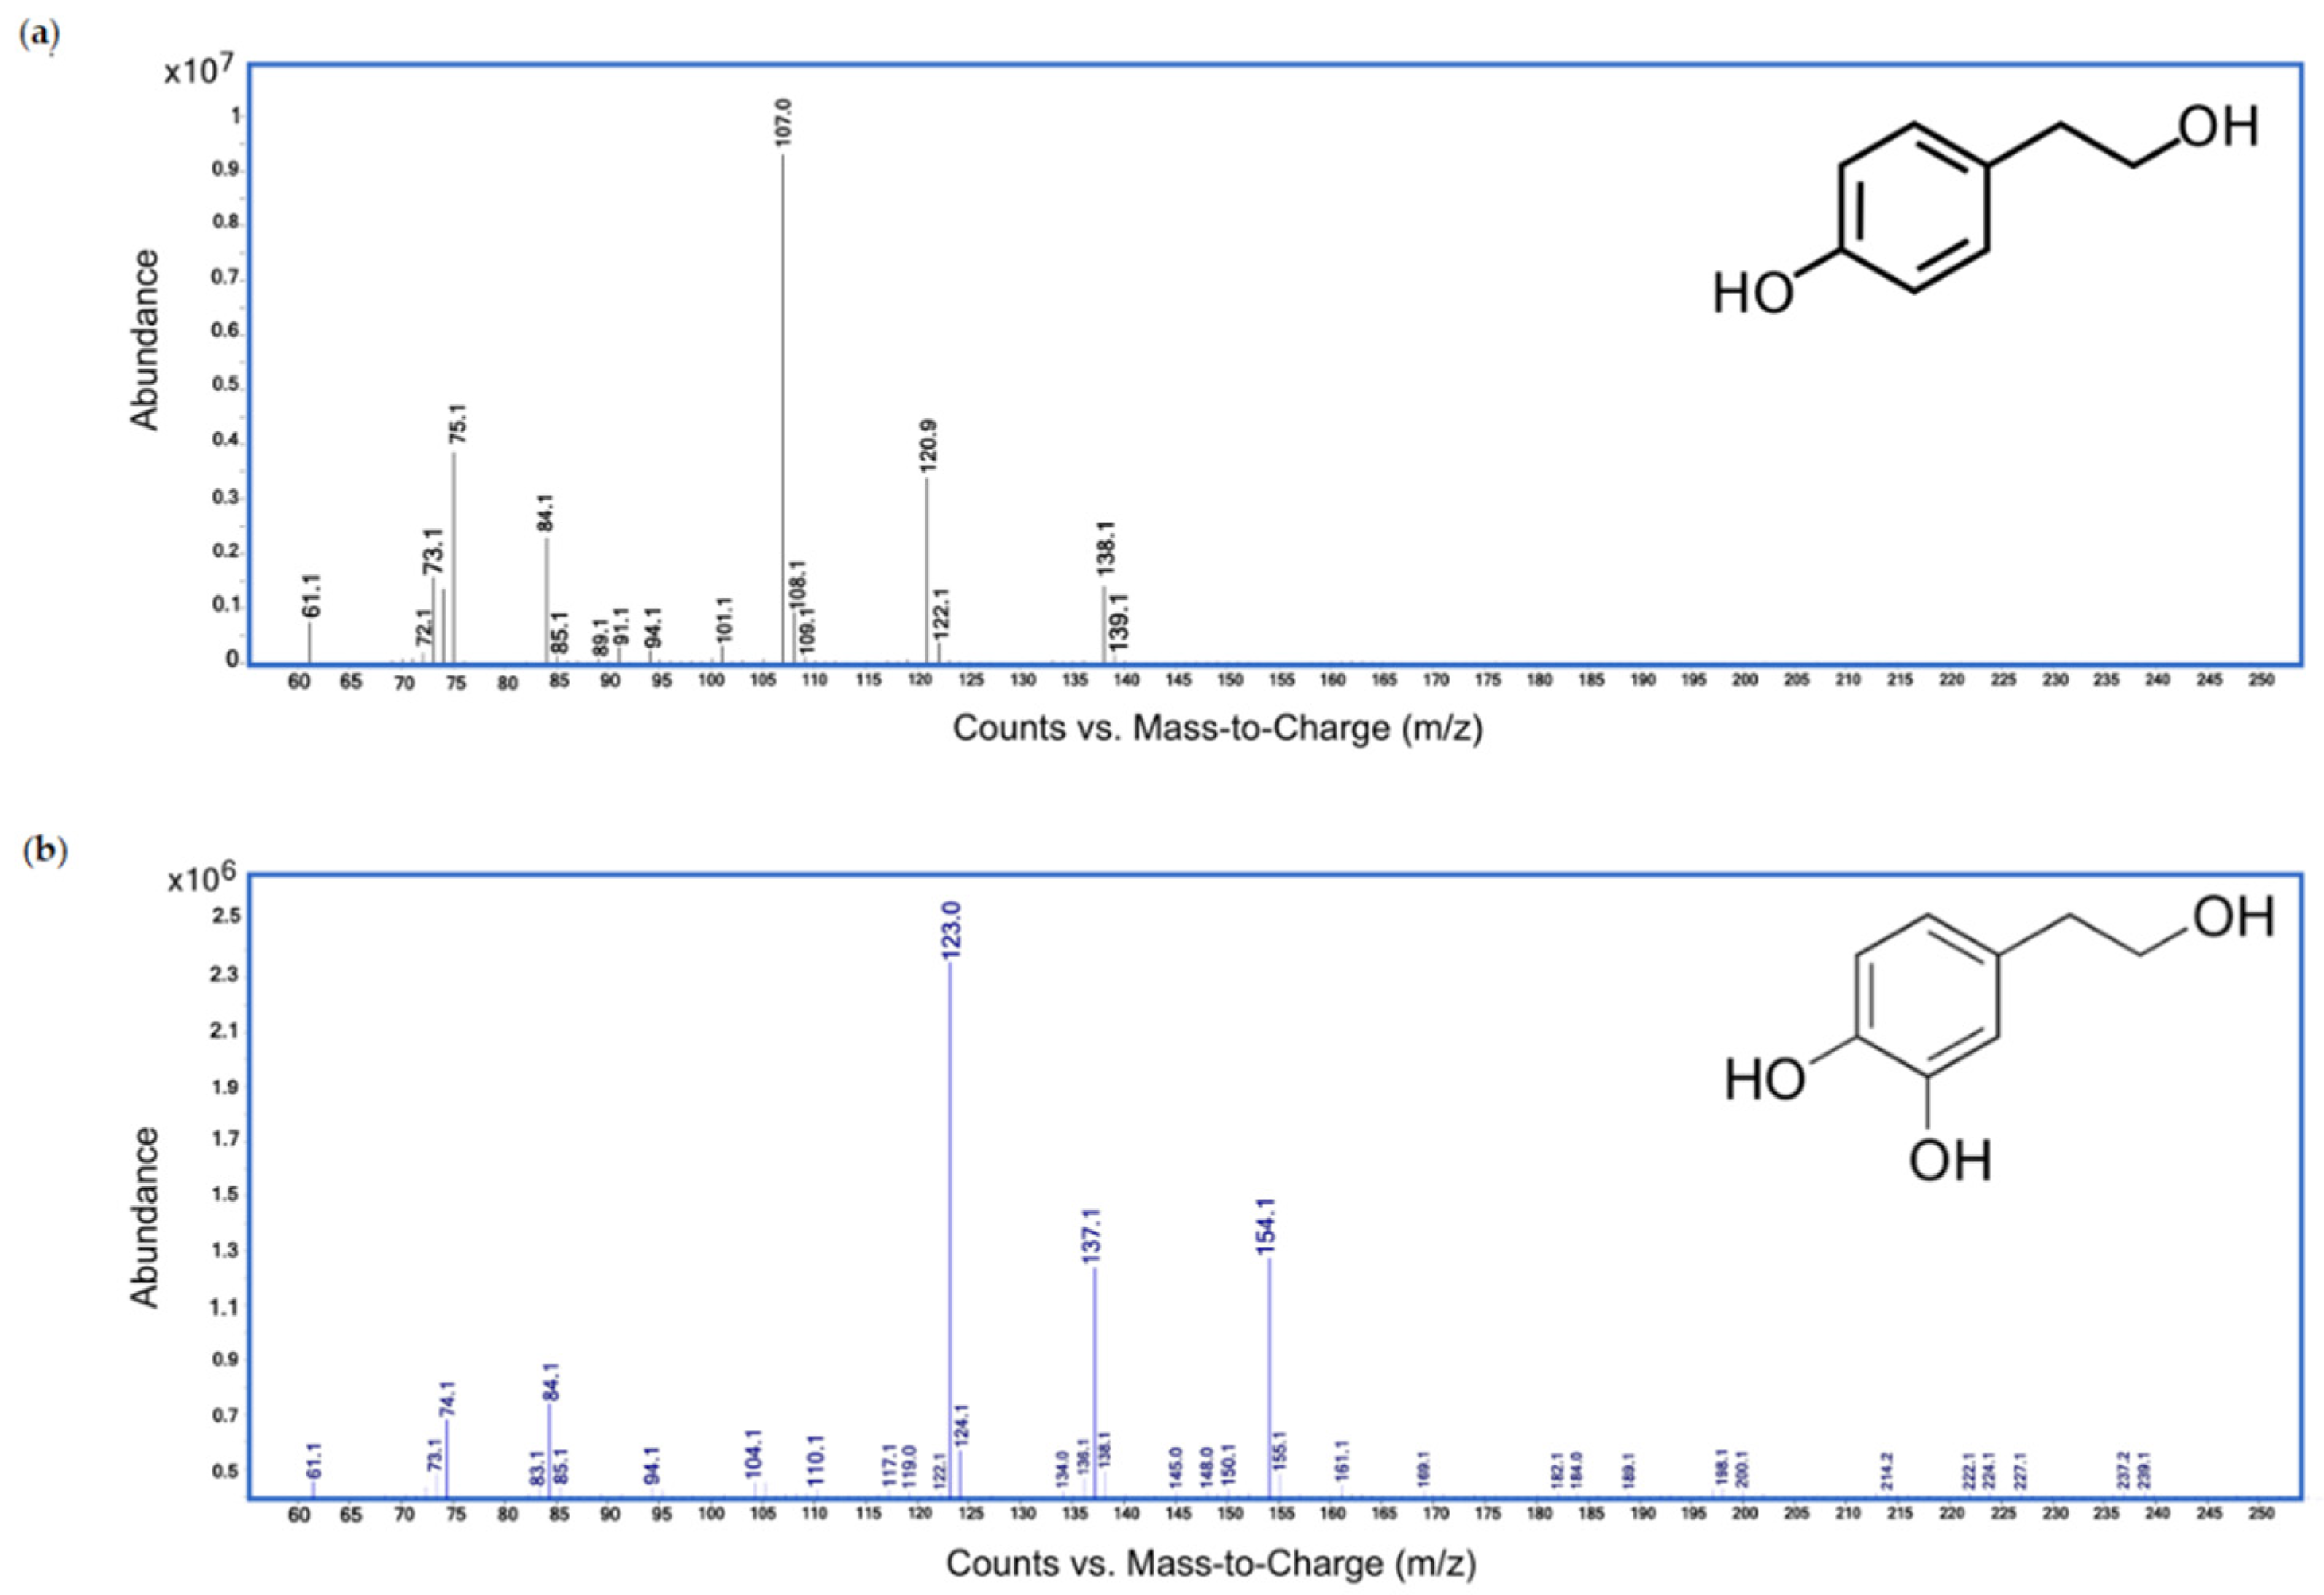
3.1. Qualitative Results

Qualitative identification in the target analysis of complex actual samples can benefit from the MS/MS approach increasing sensitivity and selectivity, even in the presence of high concentrations of interfering compounds. The Q/q ratio was calculated to confirm the peak identity in actual and fortified samples. Experimental Q/q ratios obtained from the actual samples were compared with those obtained with standard solutions. The confirmation of the analytes in the EVOO samples was considered positive when the experimental Q/q ratio was within ±20% of the average Q/q value calculated from the standards [39]. In Table 1, the reference and experimental Q/q ratios are reported, confirming the presence of the target analytes in the actual samples. This comparison is fundamental for the undoubted analytes identification, especially in direct analysis without chromatographic separation. Blank specimens were analyzed to assess the presence of possible interferents.

3.2. Method Validation
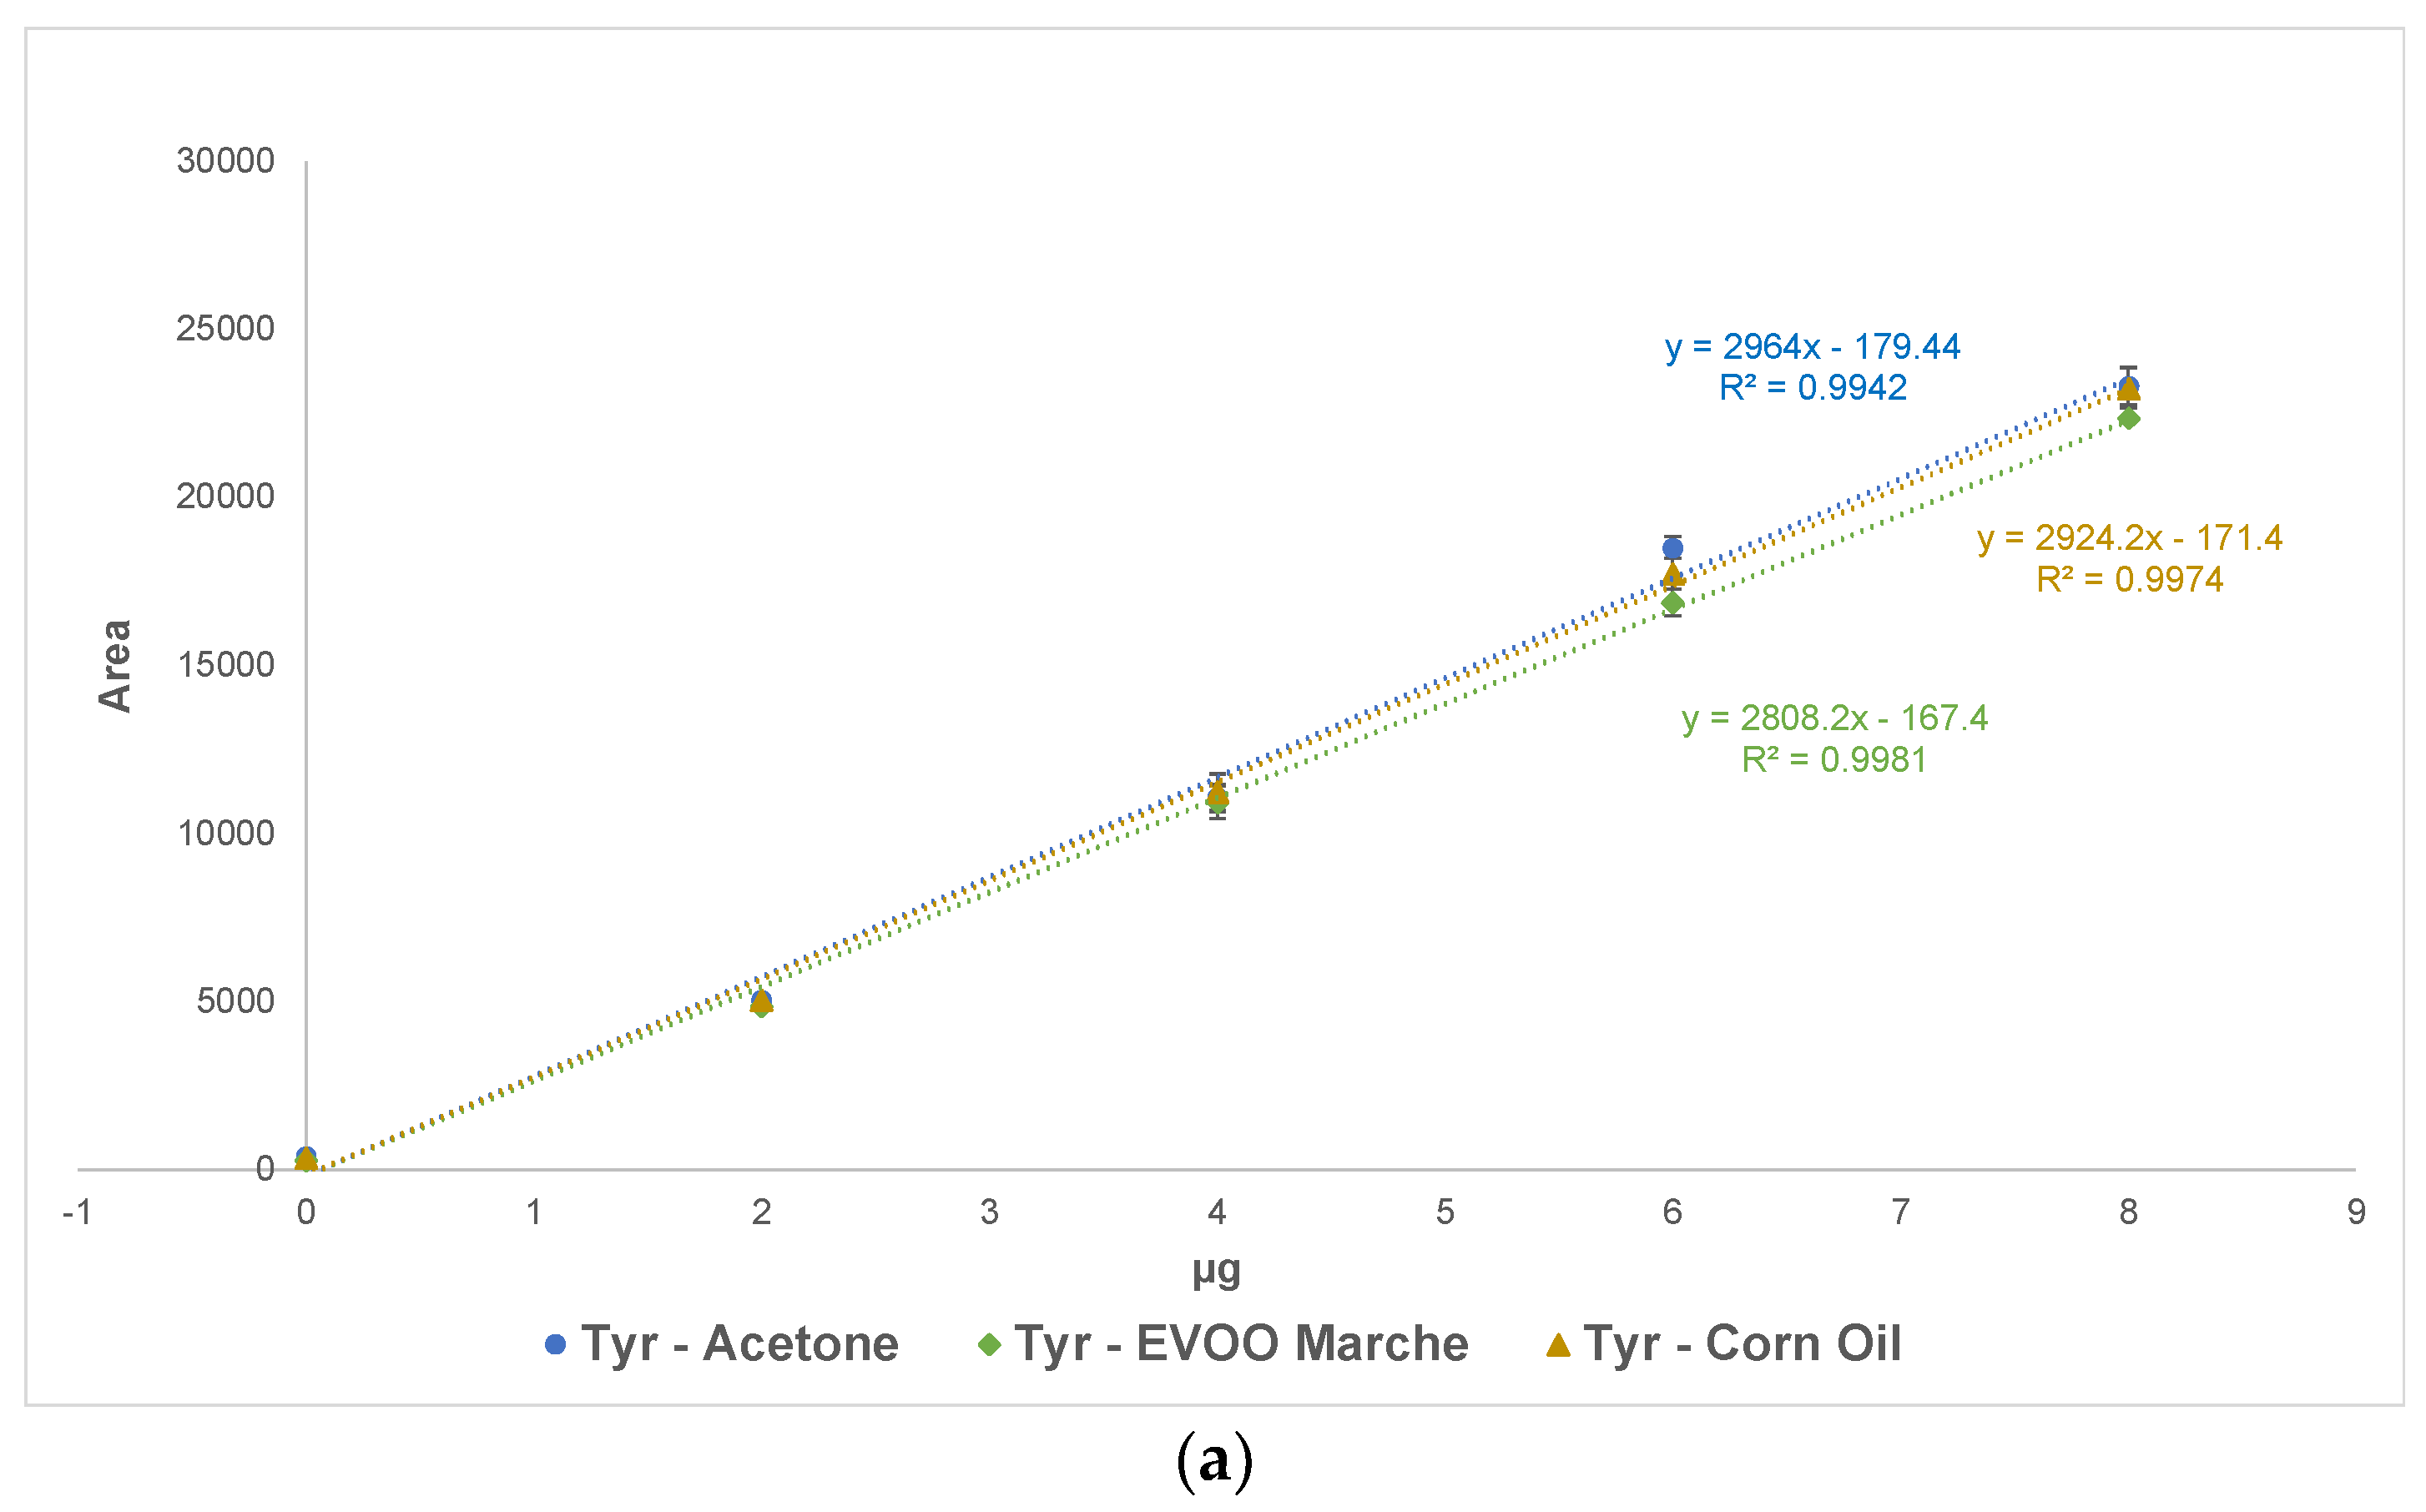
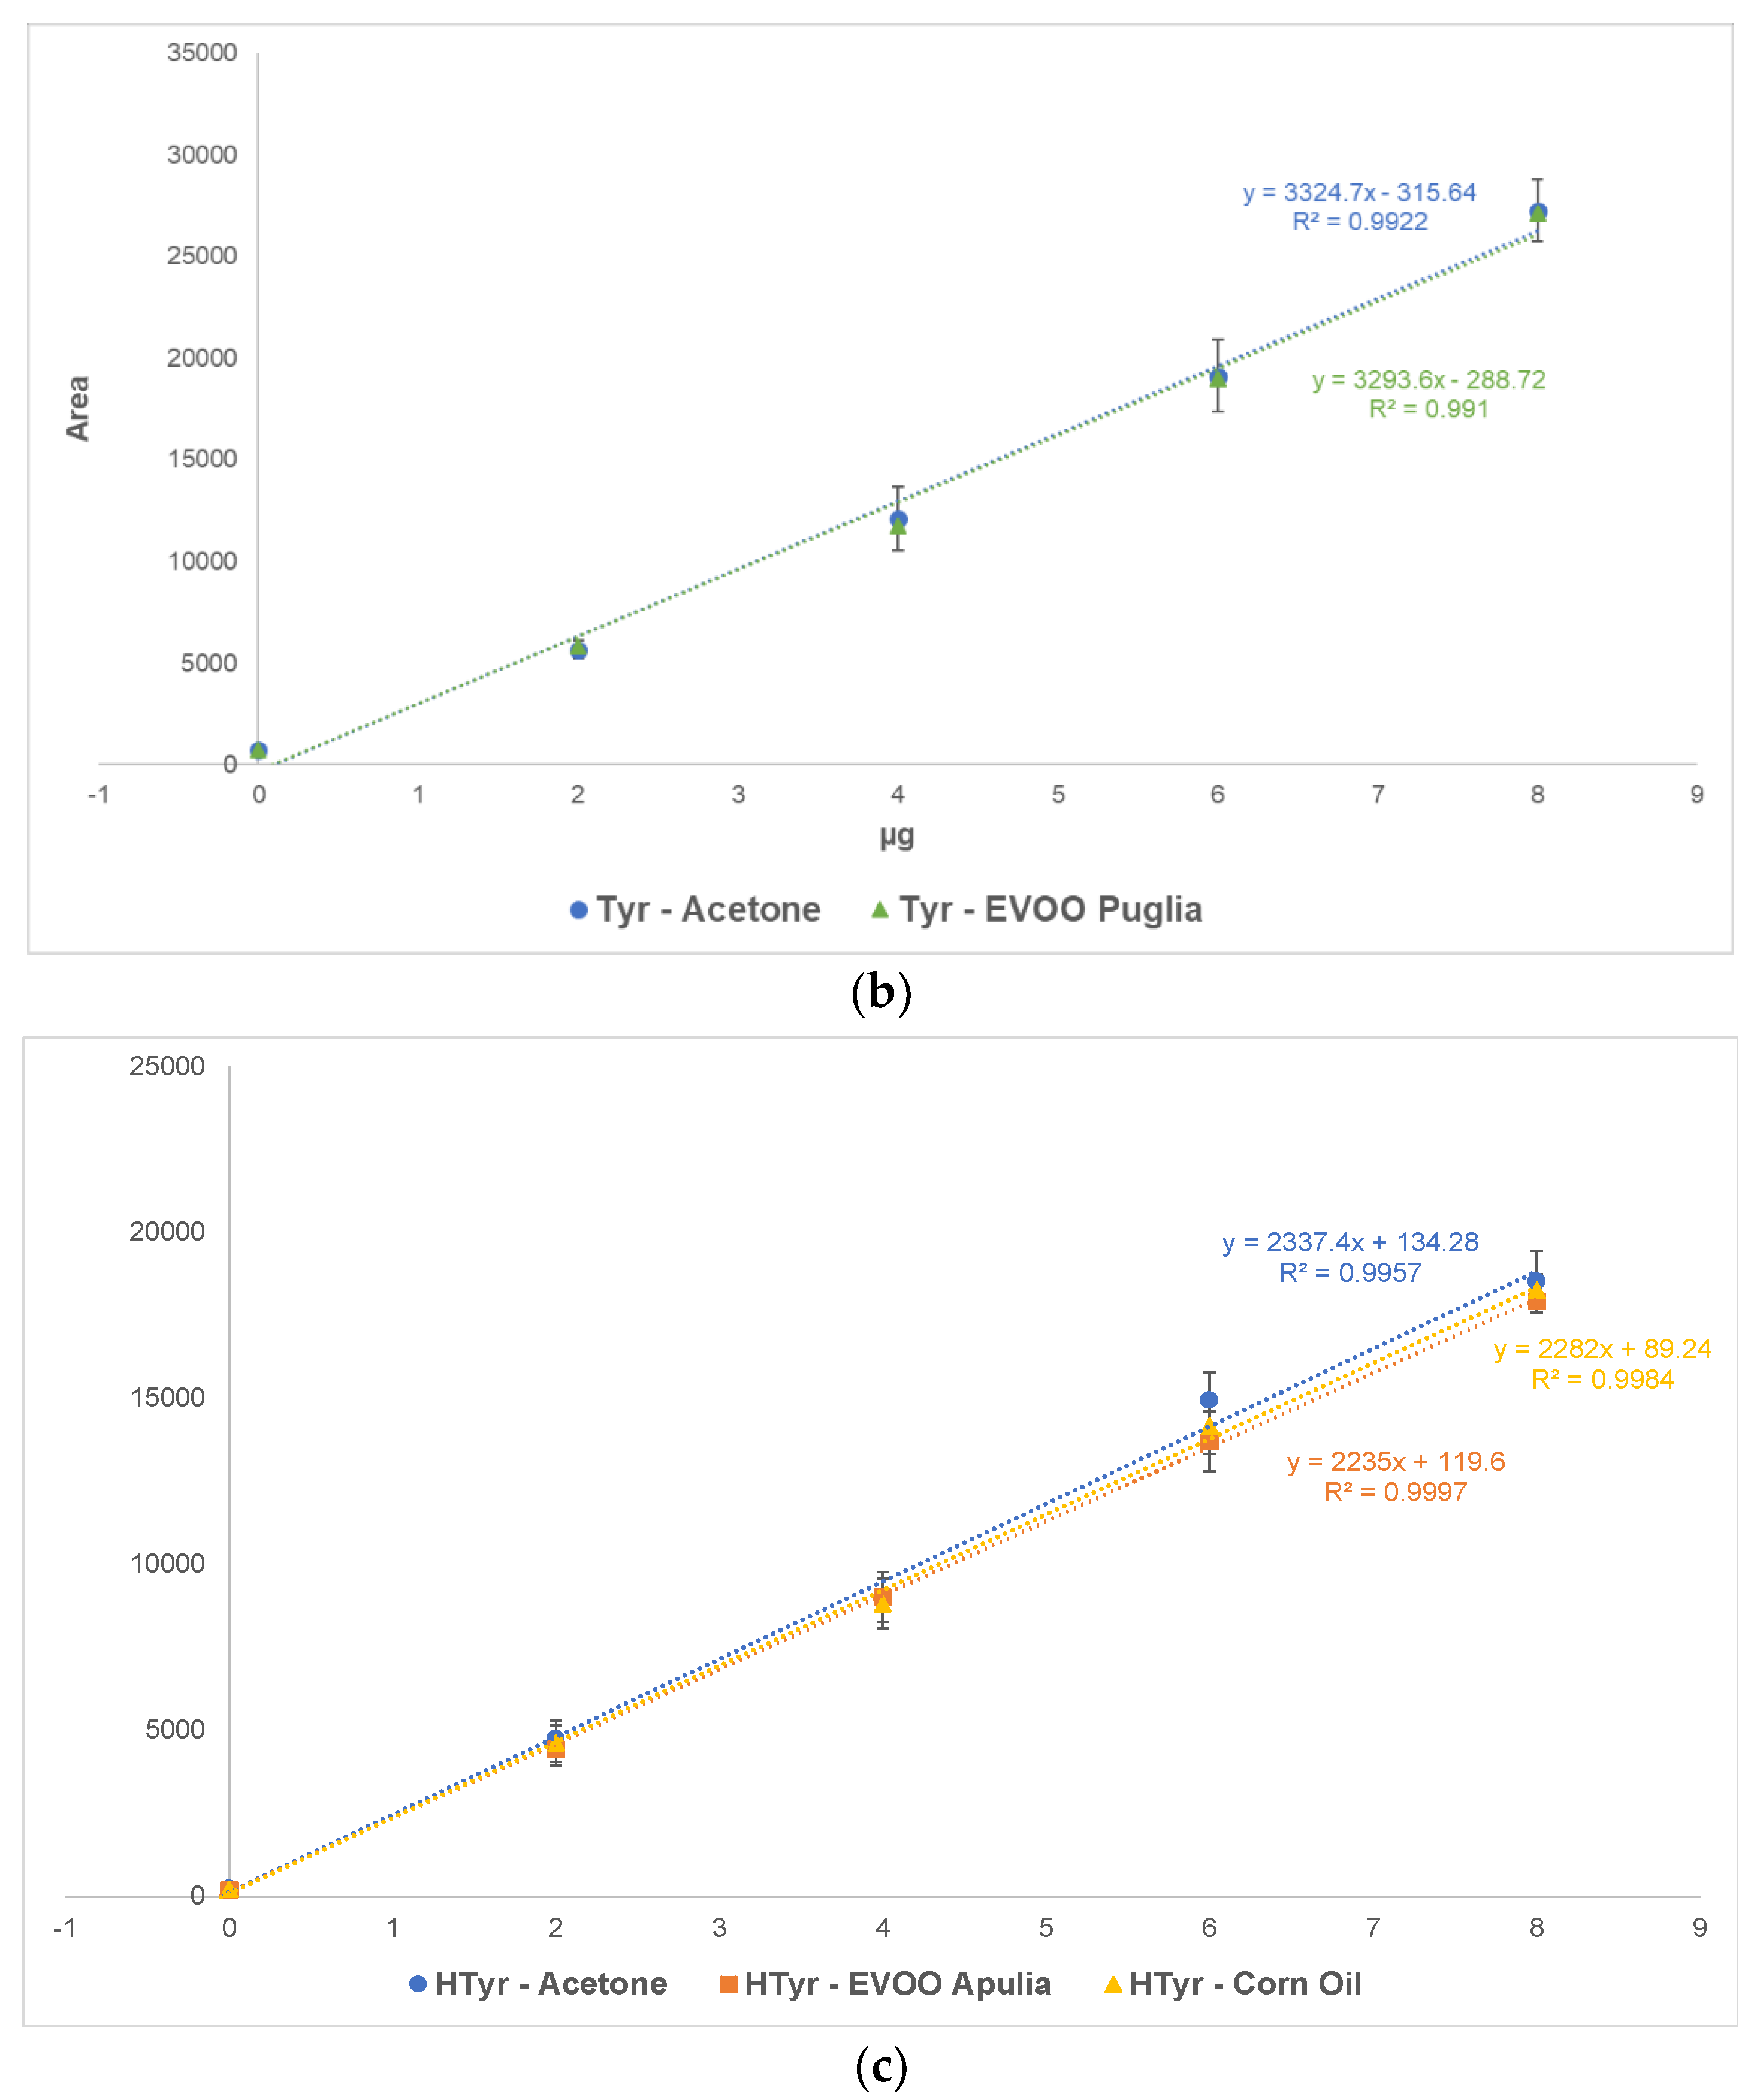
The method was validated considering linearity (R2), LODs, LOQs, intraday, interday precision, and ME evaluation.

3.2.1. Linear Range

Linearity was evaluated using the standard addition method, as described in Section 2.2. Calibration curves were plotted using the least-squares regression analysis of the signal intensity (peak area) versus the Tyr and Htyr absolute added amount. The linearity was evaluated from X to X + 8 µg for the determination of free Tyr and Htyr and from X to X + 80 µg for the compounds determination after hydrolysis. Each point on the curve is the mean of five replicates. The same experiments were conducted on the EVOO samples after hydrolysis to quantify the Tyr and Htyr total amount. The linear regression equations and Pearson square determination coefficients (R2) obtained from the actual samples, solvent samples, and corn oil samples are reported in Table 2. The R2 values are between 0.9942 and 0.9999, demonstrating a good linearity given the high matrix complexity. Acetone and corn oil samples were used to evaluate the ME and compare the linear regression in a complex matrix without analytes.

3.2.2. Limits of Detection and Quantification

The instrumental LOD was considered as the absolute amount of the compound, giving an S/N of 3/1, whereas the instrumental LOQ was set at an S/N of 10/1, expressing the lowest amount of the analyte that can be determined quantitatively. The LODs and LOQs were calculated by injecting a standard solution of 20 and 100 ng/mL of Tyr and Htyr. All of the data are reported in Table 2. These values are comparable with those obtained with other methods using LC–UV or DAD detectors or, in some cases, LC–MS, demonstrating the robustness of the method [22,35].

3.2.3. Evaluation of Matrix Effects

Interfering compounds present in the matrix represent a possible drawback that must be addressed in quantitative MS analysis. These compounds can enhance or suppress the analyte’s signal and cause misleading results. The LEI shows negligible ME, as already demonstrated [37,40]. Nevertheless, because EVOO is a complex matrix, a thorough evaluation of the ME is mandatory. The evaluation of the ME was made comparing the calibration curves of the Tyr and Htyr standards in acetone, corn oil, and EVOO (Figure 2). In ideal conditions, the total absence of ME is observed when the two slopes are identical. The slopes are overlapping, spanning from 95% to 97% for both compounds in all the EVOO samples (Table 3). The slight difference in the values can be ascribed to normal instrumental variations in LC–MS/MS experimental data acquisition. The ME evaluation demonstrates method robustness, especially considering that neither sample pretreatment nor chromatographic separation was performed. The corn oil overlapping value (99%) for free and hydrolyzed Tyr and Htyr in the three samples confirms that matrix components do not interfere considerably with analytes quantification.

3.2.4. Precision

The intraday and interday precisions were evaluated by injecting nine replicates of a 100 mg Marche EVOO sample at the concentration of X + 4 mg of both compounds for five consecutive days. The results obtained show good repeatability: the intraday RSD spanned from 4.5% to 9.0% for Tyr and from 3% to 7% for Htyr. The interday precision values spanned from 9.0% to 11.0% for Tyr and from 7.5% to 10.5% for Htyr. The precision data were not acquired for hydrolyzed samples.

3.3. Real Samples Analyses

After dilution or hydrolysis-and-dilution, the EVOO sample was injected via a 100 nL injection loop of the MS working in steady MRM conditions. The signals appearance and analysis time are only one minute for each sample. As no chromatography was involved, the samples could be injected in sequence without delay. Blanks were injected between samples, revealing no carryover.
The EVOO actual samples were produced in three different Italian regions: Marche, Apulia, and Sardinia. Different Tyr and Htyr contents were expected because the specimens come from different cultivars and soil compositions. All of the samples were diluted in acetone and hydrolyzed as described in Section 2.2. The validated method was used for the quali-quantitative analyses of Tyr and Htyr and to verify their free and total phenols content. The results obtained are reported in Table 4. The analytes’ content was determined using the standard addition method described in Section 3.2.1. The free Tyr and Htyr were both below the LOQs in the Sardinia samples, whereas the free Htyr was below the LOQs in the Marche samples. The total Tyr–Htyr content spans between 32 and 44 mg/Kg for Htyr and 67 and 80 mg/Kg for Tyr in all of the samples.
In Table 4, the results are also expressed as the absolute amount of compounds per 20 g of EVOOs to attest to the possible assignment of the nutraceutical label. The three oils are close to the concentration limit required to obtain the nutraceutical brand, but only Apulia oil fulfills it and could officially exhibit this claim. Although the selected EVOO samples come from regions with a rich tradition of oil, they all show poor quality, at least in their polyphenols content. None of them could bear the EU health claim based on the determination of free Tyr and Htyr.

4. Conclusions

Compared to other approaches recommended by the IOC, this method is simpler because it does not involve complex sample preparation procedures or chromatographic separation, only dilution before injection to determine the free analytes. Hydrolysis is necessary for the determination of the total Tyr and Htyr. The method is robust, and FIA ensures a rapid analysis of only one minute per sample. LEI–MS/MS quantitatively measures Tyr and Htyr without considerable ME, typical of other MS approaches, even with complex matrices, such as olive oil, and it does not require the support of other confirmatory techniques. The LEI–MS/MS proved to be accurate and sensitive in the range of the selected concentrations and can be used as an alternative method for the rapid screening of the free and total Tyr and Htyr content in EVOO to certify potential nutraceutical properties.

Author Contributions

Formal analysis V.T. and M.P.; writing—original draft preparation, and writing—review and editing P.P.; conceptualization and supervision A.C. and G.F. All authors have read and agreed to the published version of the manuscript.

Funding

This research did not receive any specific grant from funding agencies in the public, commercial, or not-for-profit sectors.

Acknowledgments

The authors thank Agilent Technologies for providing the LC–MS/MS instrumentation.

Conflicts of Interest

The authors declare no conflict of interest.

References

  1. Veneziani, G.; Sordini, B.; Taticchi, A.; Esposto, S.; Selvaggini, R.; Urbani, S.; Di Maio, I.; Servili, M. Improvement of Olive Oil Mechanical Extraction: New Technologies, Process Efficiency, and Extra Virgin Olive Oil Quality. In Products from Olive Tree; Boskou, D., Clodoveo, M.L., Eds.; Intech: Rijeka, Croatia, 2016; pp. 21–42. Available online: https://www.intechopen.com/books/products-from-olive-tree/improvement-of-olive-oil-mechanical-extraction-new-technologies-process-efficiency-and-extra-virgin- (accessed on 11 February 2019). [CrossRef] [Green Version]
  2. Obied, H.K.; Prenzler, P.D.; Omar, S.H.; Ismael, R.; Servili, M.; Esposto, S.; Taticchi, A.; Selvaggini, R.; Urbani, S. Pharmacology of olive biophenols. In Handbook of Advances in Molecular Toxicology; Fishbein, J.C., Heilman, J.M., Eds.; Elsevier: Amsterdam, The Netherlands, 2012; pp. 195–223. [Google Scholar] [CrossRef]
  3. Servili, M.; Sordini, B.; Esposto, S.; Urbani, S.; Veneziani, G.; Di Maio, I.; Selvaggini, R.; Taticchi, A. Biological activities of phenolic compounds of extra virgin olive oil. Antioxidants 2014, 3, 1–23. [Google Scholar] [CrossRef] [Green Version]
  4. Foscolou, A.; Critselis, E.; Tyrovolas, S.; Chrysohoou, C.; Sidossis, L.S.; Naumovski, N.; Matalas, A.L.; Rallidis, L.; Polychronopoulos, E.; Ayuso-Mateos, J.L.; et al. The effect of exclusive olive oil consumption on successful aging: A combined analysis of the ATTICA and MEDIS epidemiological studies. Foods 2019, 8, 25. [Google Scholar] [CrossRef] [PubMed] [Green Version]
  5. Incani, A.; Serra, G.; Atzeri, A.; Melis, M.P.; Serreli, G.; Bandino, G.; Sedda, P.; Campus, M.; Tuberoso, C.I.; Deiana, M. Extra virgin olive oil phenolic extracts counteract the pro-oxidant effect of dietary oxidized lipids in human intestinal cells. Food Chem. Toxicol. 2016, 90, 171–180. [Google Scholar] [CrossRef]
  6. Castelli, G.; Bianco, I.D.; Mizutamari, R.K. Polyphenol Content in Argentinean Commercial Extra Virgin Olive Oil. Eur. J. Lipid Sci. Technol. 2018, 120, 1800124. [Google Scholar] [CrossRef]
  7. Martín-Peláez, S.; Covas, M.I.; Fitó, M.; Kušar, A.; Pravst, I. Health effects of olive oil polyphenols: Recent advances and possibilities for the use of health claims. Mol. Nutr. Food Res. 2013, 57, 760–771. [Google Scholar] [CrossRef]
  8. Covas, M.I.; Nyyssönen, K.; Poulsen, H.E.; Kaikkonen, J.; Zunft, H.J.; Kiesewetter, H.; Gaddi, A.; de la Torre, R.; Mursu, J.; Bäumler, H.; et al. The effect of polyphenols in olive oil on heart disease risk factors: A randomized trial. Ann. Intern. Med. 2006, 145, 333–341. [Google Scholar] [CrossRef] [PubMed]
  9. Rubió, L.; Valls, R.M.; Macià, A.; Pedret, A.; Giralt, M.; Romero, M.P.; de la Torre, R.; Covas, M.I.; Solà, R.; Motilva, M.J. Impact of olive oil phenolic concentration on human plasmatic phenolic metabolites. Food Chem. 2012, 135, 2922–2929. [Google Scholar] [CrossRef] [PubMed]
  10. Estruch, R.; Martinez-Gonzalez, M.A.; Corella, D.; Salas-Salvado, J.; Ruiz-Gutierrez, V.; Covas, M.I.; Fiol, M.; Gómez-Garcia, E.; López-Sabater, M.C.; Vinyoles, E.; et al. Effects of a Mediterranean-style diet on cardiovascular risk factors: A randomized trial. Ann. Intern. Med. 2006, 145, 1–11. [Google Scholar] [CrossRef]
  11. Goncalves, I.; Andersson-Georgiadou, E.; Mattsson, S.; Skog, G.; Pedro, L.M.; Fernandes e Fernandes, J.; Dias, N.; Engström, G.; Nilsson, J.; Stenström, K. Direct association between diet and the stability of human atherosclerotic plaque. Sci. Rep. 2015, 5, 15524. [Google Scholar] [CrossRef]
  12. Couto, E.; Boffetta, P.; Lagiou, P.; Ferrari, P.; Buckland, G.; Overvad, K.; Dahm, C.C.; Tjønneland, A.; Olsen, A.; Clavel-Chapelon, F.; et al. Mediterranean dietary pattern and cancer risk in the EPIC cohort. Br. J. Cancer 2011, 104, 1493–1499. [Google Scholar] [CrossRef] [Green Version]
  13. Gonzalez-Alonso, A.; Perez-Lopez, P.; Varela-Lopez, A.; Ramirez-Tortosa, M.C.; Battino, M.; Quiles, J.L. Experimental evidence on the role of different types unsaturated fats in the diet on ageing. Rev. Esp. Geriatr. Gerontol. 2015, 50, 285–288. [Google Scholar]
  14. Varela-Lopez, A.; Bullon, P.; Battino, M.; Ramirez-Tortosa, M.; Ochoa, J.J.; Cordero, M.D.; Ramirez-Tortosa, C.L.; Rubini, C.; Zizzi, A.; Quiles, J.L. Coenzyme Q protects against age-related alveolar bone loss associated to n-6 polyunsaturated fatty acid rich-diets by modulating mitochondrial mechanisms. J. Gerontol. A Biol. Sci. Med. Sci. 2015, 71, 593–600. [Google Scholar] [CrossRef] [Green Version]
  15. Visioli, F.; Franco, M.; Toledo, E.; Luchsinger, J.; Willett, W.C.; Hu, F.B.; Martinez-Gonzalez, M.A. Olive oil and prevention of chronic diseases: Summary of an International conference. Nutr. Metab. Cardiovasc. Dis. 2018, 28, 649–656. [Google Scholar] [CrossRef]
  16. Robles-Almazana, M.; Pulido-Moran, M.; Moreno-Fernandez, J.; Ramirez-Tortosa, C.; Rodriguez-Garcia, C.; Quiles, J.L.; Ramirez-Tortosa, M.C. Hydroxytyrosol: Bioavailability, toxicity, and clinical applications. Food Res. Int. 2018, 105, 654–667. [Google Scholar] [CrossRef] [PubMed]
  17. Vilaplana-Pérez, C.; Auñón, D.; García-Flores, L.A.; Gil-Izquierdo, A. Hydroxytyrosol and potential uses in cardiovascular diseases, cancer, and AIDS. Front. Nutr. 2014, 1, 18. [Google Scholar] [CrossRef] [Green Version]
  18. European Commission. Regulation EC No. 432/2012 establishing a list of permitted health claims made on foods, other than those referring to the reduction of disease risk and to children’s development and health. Off. J. Eur. Union 2012, L136, 1–40. Available online: https://eurlex.europa.eu/legalcontent/GA/TXT/?uri=CELEX:32012R0432 (accessed on 11 February 2019).
  19. Pichierri, M.; Peluso, A.M.; Pino, G.; Guido, G. Communicating the health value of extra-virgin olive oil: An investigation of consumers’ responses to health claims. Br. Food J. 2021, 123, 492–508. [Google Scholar] [CrossRef]
  20. International Olive Council. Determination of Biophenols in Olive Oils by HPLC. 2009 COI/T.20/Doc.No 29/1-8. Available online: https://www.oelea.de/downloads/COI-T20-DOC-29-2009-DETERMINATION-OF-BIOPHENOLS-IN-OLIVE-OILS-BY-HPLC.pdf (accessed on 15 February 2019).
  21. Nenadis, N.; Mastralexi, A.; Tsimidou, M.Z.; Vichi, S.; Quintanilla-Casas, B.; Donarski, J.; Bailey-Horne, V.; Butinar, B.; Miklavčič, M.; García González, D.L.; et al. Toward a harmonized and standardized protocol for the determination of total hydroxytyrosol and tyrosol content in virgin olive oil (VOO). Extraction solvent. Eur. J. Lipid Sci. Technol. 2018, 120, 1800099. [Google Scholar] [CrossRef] [Green Version]
  22. Tsimidou, M.Z.; Sotiroglou, M.; Mastralexi, A.; Nenadis, N.; García-González, D.L.; Toschi, T.G. In house validated UHPLC protocol for the determination of the total hydroxytyrosol and tyrosol content in virgin olive oil fit for the purpose of the health claim introduced by the EC regulation 432/2012 for “olive oil polyphenols. Molecules 2019, 24, 1044. [Google Scholar] [CrossRef] [Green Version]
  23. Ricciutelli, M.; Marconi, S.; Boarelli, M.C.; Caprioli, G.; Sagratini, G.; Ballini, R.; Fiorini, D. Olive oil polyphenols: A quantitative method by high-performance liquid-chromatography-diode-array detection for their determination and the assessment of the related health claim. J. Chromatogr. A 2017, 1481, 53–63. [Google Scholar] [CrossRef]
  24. Purcaro, G.; Codony, R.; Pizzale, L.; Mariani, C.; Conte, L. Evaluation of total hydroxytyrosol and tyrosol in extra virgin olive oils. Eur. J. Lipid Sci. Technol. 2014, 116, 805–811. [Google Scholar] [CrossRef]
  25. Hashemi, P.; Serenjeh, F.N.; Ghiasvand, A.R. Reversed-phase dispersive liquid—liquid microextraction with multivariate optimization for sensitive HPLC determination of tyrosol and hydroxytyrosol in olive oil. Anal. Sci. 2011, 27, 943. [Google Scholar] [CrossRef] [PubMed] [Green Version]
  26. Romero, C.; Brenes, M. Analysis of total contents of hydroxytyrosol and tyrosol in olive oils. J. Agric. Food Chem. 2012, 60, 9017–9022. [Google Scholar] [CrossRef]
  27. Bellumori, M.; Cecchi, L.; Innocenti, M.; Clodoveo, M.L.; Corbo, F.; Mulinacci, N. The EFSA health claim on olive oil polyphenols: Acid hydrolysis validation and total hydroxytyrosol and tyrosol determination in italian virgin olive oils. Molecules 2019, 24, 2179. [Google Scholar] [CrossRef] [Green Version]
  28. Olmo-García, L.; Fernández-Fernández, C.; Hidalgo, A.; Vílchez, P.; Fernández-Gutiérrez, A.; Marchal, R.; Carrasco-Pancorbo, A. Evaluating the reliability of specific and global methods to assess the phenolic content of virgin olive oil: Do they drive to equivalent results? J. Chromatogr. A 2018, 1585, 56–69. [Google Scholar] [CrossRef] [PubMed]
  29. Mohamed, M.B.; Guasmi, F.; Ali, S.B.; Radhouani, F.; Faghim, J.; Triki, T.; Kammoun, N.G.; Baffi, C.; Lucini, L.; Benincasa, C. The LC-MS/MS characterization of phenolic compounds in leaves allows classifying olive cultivars grown in South Tunisia. Biochem. Syst. Ecol. 2018, 78, 84–90. [Google Scholar] [CrossRef]
  30. Bartella, L.; Mazzotti, F.; Napoli, A.; Sindona, G.; Di Donna, L. A comprehensive evaluation of tyrosol and hydroxytyrosol derivatives in extra virgin olive oil by microwave-assisted hydrolysis and HPLC-MS/MS. Anal. Bioanal. Chem. 2018, 410, 2193–2201. [Google Scholar] [CrossRef]
  31. Monasterio, R.P.; Olmo-García, L.; Bajoub, A.; Fernández-Gutiérrez, A.; Carrasco-Pancorbo, A. phenolic compounds profiling of virgin olive oils from different varieties cultivated in mendoza, argentina, by using liquid chromatography−mass spectrometry. J. Agric. Food Chem. 2017, 65, 8184–8195. [Google Scholar] [CrossRef]
  32. Mazzotti, F.; Benabdelkamel, H.; Di Donna, L.; Maiuolo, L.; Napoli, A.; Sindona, G. Assay of tyrosol and hydroxytyrosol in olive oil by tandem mass spectrometry and isotope dilution method. Food Chem. 2012, 135, 1006–1010. [Google Scholar] [CrossRef]
  33. Bazoti, F.N.; Gikas, E.; Skaltsounis, A.L.; Tsarbopoulos, A. Development of a liquid chromatography–electrospray ionization tandem mass spectrometry (LC–ESI MS/MS) method for the quantification of bioactive substances present in olive oil mill wastewaters. Anal. Chim. Acta 2006, 573–574, 258–266. [Google Scholar] [CrossRef]
  34. Conte, L.; Bendini, A.; Valli, E.; Lucci, P.; Moret, S.; Maquet, A.; Lacoste, F.; Brereton, P.; García-González, D.L.; Moreda, W.; et al. Olive oil quality and authenticity: A review of current EU legislation, standards, relevant methods of analyses, their drawbacks and recommendations for the future. Trends Food Sci. Technol. 2020, 105, 483–493. [Google Scholar] [CrossRef]
  35. Bartella, L.; Mazzotti, F.; Sindona, G.; Napoli, A.; Di Donna, L. Rapid determination of the free and total hydroxytyrosol and tyrosol content in extra virgin olive oil by stable isotope dilution analysis and paper spray tandem mass spectrometry. Food Chem. Toxicol. 2020, 136, 111110. [Google Scholar] [CrossRef] [PubMed]
  36. Luque-Muñoz, A.; Tapia, R.; Haidour, A.; Justicia, J.; Cuerva, J.M. Direct determination of phenolic secoiridoids in olive oil by ultra-high performance liquid chromatography-triple quadruple mass spectrometry analysis. Sci. Rep. 2019, 9, 15545. [Google Scholar] [CrossRef] [Green Version]
  37. Termopoli, V.; Famiglini, G.; Palma, P.; Piergiovanni, M.; Cappiello, A. Atmospheric pressure vaporization mechanism for coupling a liquid phase with electron ionization mass spectrometry. Anal. Chem. 2017, 89, 2049–2056. [Google Scholar] [CrossRef] [PubMed]
  38. Termopoli, V.; Famiglini, G.; Palma, P.; Piergiovanni, M.; Rocio-Bautista, P.; Ottaviani, M.F.; Cappiello, A.; Saeed, M.; Perry, S. Evaluation of a liquid electron ionization liquid chromatography–mass spectrometry interface. J. Chromatogr. A 2019, 1591, 120–130. [Google Scholar] [CrossRef] [PubMed]
  39. European Commission. 2002/657/EC: Commission decision of 12 august 2002 implementing council directive 96/23/EC concerning the performance of analytical methods and the interpretation of results. Off. J. Eur. Commun. 2002, L221, 8–36. [Google Scholar]
  40. Rocío-Bautista, P.; Famiglini, G.; Termopoli, V.; Palma, P.; Nazdrajić, E.; Pawliszyn, J.; Cappiello, A. Direct coupling of bio-SPME to liquid electron ionization-MS/MS via a modified microfluidic open interface. J. Am. Soc. Mass Spectrom. 2021, 32, 262–269. [Google Scholar] [CrossRef] [PubMed]
Figure 1. Structures and LEI–MS spectra of (a) Tyr and (b) Htyr.
Separations 08 00173 g001
Figure 2. Matrix effect evaluation. Comparison of standard addition calibration curves: (a) Tyr in solvent (blue line), EVOO Marche (green line), and corn oil (yellow line); (b) Tyr in solvent (blue line) and EVOO Apulia (green line). (c) Htyr in solvent (blue line), EVOO Apulia (orange line), and corn oil (yellow line).
Separations 08 00173 g002aSeparations 08 00173 g002b
Table 1. Full scan, MS/MS parameters, and Q/q ratios (reference and experimental) of the selected phenolic compounds. Q/q ratios were calculated as the average of five injections at five calibration levels (three replicates each); relative standard deviation for solvent (Reference) and diluted EVOO samples (Experimental) are reported in parentheses.
CompoundQuantitative
Transition (Q)
CE (eV)Qualitative
Transition (q)
CE (eV) Reference   Q / q ± R S D ( % ) Experimental   Q / q ± R S D ( % )
Tyr138→10715138→77105.5 (10)5.7 (9)
Htyr154→12310154→77106.4 (5)6.8 (7)
Full scanm/zData sampleCyc/s
55–2507001.4
Table 2. Linear regression equations, LODs, and LOQs of free and hydrolyzed samples.
MatrixWorking Range (µg)FreeLODs (ng/mL)
TyrR2HtyrR2
EquationsEquations
Acetone0–8y = 2964x − 179.440.9942---0.9957TyrHtyr
EVOO Marchey = 2808.2x − 167.40.9981n.d---1030
Corn oily = 2924.2x − 171.40.9974y = 2282x + 89.240.9984LOQs (ng/mL)
Acetoney = 3324.7x −315.640.9922y = 2337.4x + 134.280.9957TyrHtyr
EVOO Apuliay = 3293.6x − 288.720.9910y = 2235x + 119.60.99975070
Hydrolyzed
Acetone y = 1968.5x + 8385.80.9993y = 1145.6x + 2605.10.9994
EVOO Marche0–80y = 1925.3x + 8121.10.9995y = 1136.4x + 2302.40.9997
Corn oily = 1959.8x + 8241.70.9978y = 1132.4x + 2285.30.9998
Acetoney = 2337.2x + 116390.9991y = 1636.7x + 4617.80.9999
EVOO Apuliay = 2309.7x + 115400.9992y = 1615.9x + 4406.30.9999
Acetoney = 1591.8x + 6979.60.9998y = 1446.8x + 3336.10.9984
EVOO Sardiniay = 1537.3x + 6593.10.9991y = 1406x + 3053.90.9986
Table 3. Matrix effects evaluation of the quantified EVOO samples.
CompoundMatrix Effects Evaluation (a)
Free TyrEVOO Marche95%
EVOO Apulia99%
Corn oil99%
Free HtyrEVOO Apulia96%
Corn oil97%
Hydrolyzed TyrEVOO Marche98%
Corn oil99%
EVOO Apulia99%
EVOO Sardinia96%
Hydrolyzed HtyrEVOO Marche99%
Corn oil99%
EVOO Apulia99%
EVOO Sardinia97%
(a) Ratio between real matrix, corn oil, and acetone slopes of the standard addition calibration curves * 100.
Table 4. Free and total content of Tyr and Htyr in the selected oil samples. Average value of three aliquots for each EVOO sample and relative standard deviation in parentheses. b.l.: below limit of quantification. The analyte total content in 20 mg of EVOO samples are also reported, following the 432/2012 EU Regulation.
SampleCompoundsFree Tyr–Htyr-mg/Kg (RSD%)Total Tyr–Htyr-mg/Kg (RSD%)Total Tyr–Htyr-mg/20 g (RSD%) (a)
ApuliaTyr
Htyr
9 (4)
5 (5)
80 (6)
44 (8)
5 (8)
MarcheTyr
Htyr
6 (7)
b.l.
67 (9)
32 (4)
4 (10)
SardiniaTyr
Htyr
b.l.
b.l.
69 (6)
35 (7)
4 (9)
(a) These values were calculated in accordance with the literature [35].
Publisher’s Note: MDPI stays neutral with regard to jurisdictional claims in published maps and institutional affiliations.

