Abstract
In this work, two online comprehensive two-dimensional liquid chromatography platforms, namely Hydrophilic interaction liquid chromatography × Reversed phase (HILIC × RP) and Reversed phase × Reversed Phase (RP × RP) coupled to mass spectrometry, were compared for the analysis of complex peptide samples. In the first dimension, a HILIC Amide and C18 Bioshell peptide (150 × 2.1 mm, 1.7 and 2.0 μm) columns were selected, while, in the second dimension, a short C18 (50 × 3.0 mm, 2.7 μm) Bioshell peptide column was used. Two C18 trapping columns (10 × 3.0 mm, 1.9 μm), characterized by high retention and surface area, were employed as modulation interface in both HILIC × RP and RP × RP methods. The LC × LC platforms were coupled to UV and tandem mass spectrometry detection and tested for the separation and identification of two gastro-intestinal digests of commercial microalgae formulations (Spirulina Platensis and Klamath). Their performances were evaluated in terms of peak capacity, maximum number and properties of identified phycocyanin peptides. Our results showed that the HILIC × RP approach provided the highest peak capacity values (nc HILIC × RP: 932 vs. nc RP × RP: 701) with an analysis time of 60 min, while the RP × RP approach was able to identify a slight higher number of phycocyanin derived peptides (HILIC × RP: 88 vs. RP × RP: 103). These results point out the flexibility and potential of HILIC × RP and RP × RP based on trapping modulation for peptide mapping approaches.
1. Introduction
Liquid chromatography coupled to mass spectrometry (LC-MS) represents the gold standard for the analysis of complex samples, such as in omics studies. These samples can contain hundreds or thousands of analytes with different chemical properties and their characterization is a challenging task. One-dimensional liquid chromatography coupled to mass spectrometry (1D-LC-MS) is not capable of providing an adequate resolving power [1] and, despite the advances of mass spectrometry, high resolution front-end separation techniques are still essential. Comprehensive two-dimensional liquid chromatography (LC × LC), in which the entire sample is subjected to two separation with different selectivity, has emerged as one of the best strategies for the analysis of very complex samples [2]. In particular, LC × LC has showed its potential in the field of peptidomics, where the complexity derives from the enormous number of peptides arising from enzymatic digestion. Among the different stationary phase combinations, Reversed phase × Reversed Phase (RP × RP) with different pH in the two dimensions is one of the most employed [3,4,5]. While RP × RP has shown impressive results in terms of peak capacity values and robustness, its orthogonality is only given from the mobile phase pH, and thus partially limited. Hydrophilic interaction chromatography (HILIC) is a powerful alternative to RP [6] and their combination has been reported to provide the highest degree of orthogonality in LC × LC [7]. The main obstacle to the HILIC × RP coupling is represented by the incompatibility of mobile phase strength in the two dimensions. In fact, the transfer of the highly organic HILIC mobile phase onto the second RP dimension leads to heavy negative effects on peak shape (peak distortion or sample breakthrough) and a dramatic loss of sensitivity. To circumvent these drawbacks, several strategies have been adopted in HILIC × RP, in particular, the employment of active solvent modulation, with and without trapping column-based modulators, in the analysis of partially digested monoclonal antibodies and histones [8,9]. Recently, also “total breakthrough” conditions were used in HILIC × RP approach and compared to RP × RP approach, with a loop-based modulator, in terms of peak capacity [10]. In this regard, we have recently demonstrated that the employment in the modulation interface of trapping columns, packed with highly retentive and efficient C18 sub-2 μm particles, with large surface area, delivered a sensible sensitivity increase with respect to conventional C18 trapping columns, showing a high potential in LC × LC-high resolution mass spectrometry (HRMS) for peptidomics [11]. Microalgae are gaining popularity as novel functional foods and nutraceuticals, given the high protein content and their related healthy properties. Despite this, there are still scarce data about the peptides that arise from the gastro-intestinal digestion of these matrices. In this regard, for the reason stated above, cutting edge analytical methods able to elucidate in detail their peptidomic profile are mandatory. The objective of the current work is to compare HILIC × RP and RP × RP platforms, with the same trapping columns modulation approach, coupled to high resolution mass spectrometry. In particular, emphasis has been given to the maximum number of identified peptides between the two combinations, which is the main objective of high resolution separations platforms in peptide mapping studies, as well as other system performance parameters, such as peak capacity and orthogonality. For practical application, two approaches have been employed for peptide mapping of the complex gastro-intestinal digests of two commercial microalgae dietary formulations namely Aphanizomenon flos-aquae (Klamath) and Arthrospira Platensis (Spirulina), which are among the top-sold products in the nutraceutical field. The obtained results, in particular the high peak capacity values in short time as well as the significant coverage of the proteins of interest (phycocyanins), raise the potential of LC × LC with trapping columns modulation for peptidomics applications as an interesting strategy in comparison to loop approaches, which are usually affected by sensitivity and solvent limitations.
2. Materials and Methods
2.1. Chemicals
Ultra-pure water (H2O) was obtained by a Direct-8 Milli-Q system (Millipore, Milan, Italy), LC–MS grade acetonitrile (MeCN) and additives formic acid (HCOOH), ammonium formate (HCOONH4) phosphoric acid (H3PO4) and Trifluoroacetic acid (TFA) were all purchased by VWR (Milan, Italy). Enzymes Pepsin, Chymotrypsin, Pancreatin, bile salts, all purchased by Sigma Aldrich (Milan, Italy). Klamath and Spirulina nutraceutical formulations (powders) were obtained by Farmalabor (Assago, Milan, Italy).
2.2. Sample Preparation
Protein extraction and gastro-intestinal (G.I) digestion were performed as previously developed [12,13,14]. In particular microalgae powders (15 g) were extract with 240 mL of 0.1 M sodium phosphate buffer (ratio w/v of 1:16), with 3 freeze-thaw cycles of 4 h (from −20 °C to 37 °C), finally the suspension was centrifuged and the supernatant recovered. For G.I, the sample in a concentration of 10 mg/mL was kept under stirring at 37 °C, the pH was adjusted to 2 with HCl 0.1 N and pepsin (enzyme/protein ratio 1:100 w/w) was added. The reaction was blocked after 2 h increasing the temperature to 90 °C for 10 min. The solvent was thus removed under reduced pressure, and 10 mL of a 10 mM HCOONH4 solution (pH adjusted to 7.5 with NH4OH), chymotrypsin, pancreatin bile salts were then added (same enzyme/protein ratio). The reaction, under stirring, was terminated after 2 h, by lowering the pH to 2 with TFA. Peptide digest was solubilized in 0.1% (v/v) aqueous TFA (final concentration 10 mg/mL), and loaded on a Strata® X Polymeric 100 mg/mL RP cartridge (Phenomenex® Castel Maggiore, Bologna, Italy), previously equilibrated in 0.1% TFA. After loading, the sample was eluted with MeCN:H2O:TFA (70:30:0.1 v/v/v).
2.3. Columns
In HILIC × RP analyses, an Acquity UPLCTM BEH Amide 150 mm × 2.1 mm, 1.7 μm (130 Å) (Waters, Millford, MA, USA) was used in first dimension (1D). For comparison purpose a Kinetex® HILIC 150 mm × 2.1 mm, 2.6 μm (100 Å) and a LunaTM HILIC 150 mm × 2.0 mm, 3.0 μm (200 Å) (Phenomenex®, Bologna, Italy) were also tested. In RP × RP analyses, a BIOshellTM Peptide ES C18 150 mm × 2.1 mm, 2.0 µm (160 Å) (Supelco) was used in 1D, which was also compared to a Discovery® BIO WidePore C18 150 mm × 1 mm, 5 μm (300 Å) (Supelco). In the second dimension (2D) a BIOshellTM Peptide ES C18 50 mm × 3.0 mm, 2.7 µm (160 Å) from Supelco (Bellefonte, PA, USA) was used for both platforms. In the modulation interface, two custom-made trapping columns 10 × 3.0 mm, which were house packed with TitanTM C18 1.9 μm (80 Å) monodisperse fully porous silica particles, kindly donated by Supelco to Professor Francesco Gasparrini, were used.
2.4. Instrumentation
(1D-LC) and LC × LC analyses were performed on a Shimadzu Nexera UHPLC (Shimadzu, Milan, Italy), consisting of a CBM-20A controller, four LC-30AD dual-plunger parallel-flow pumps, a DGU-20A5 degasser, an SPD-M20A PDA detector with a 2.5 μL flow cell, a CTO-20AC column oven, a SIL-30AC autosampler, an external oven (ThermaSphere TMTS-130 HPLC Column) was used for the 1D column. An additional LC-20AT (Shimadzu) pump was used to deliver the post 1D dilution flow by means of a stainless steel Tee union, 1/16 in. 0.15 mm bore (Vici-Valco® Houston, TX 77255, USA). The two dimensions were connected through an ultra high pressure 10 port-two position switching valve with micro-electric actuator (model FCV-12 AH, 1.034 bar, Shimadzu, Kyoto, Japan), placed inside the column oven. The trapping columns were connected to the valve by Viper capillaries of 100 × 0.130 mm I.D (Thermo Fisher Scientific, Milan, Italy). All connections were 0.130 mm I.D. and kept of the shortest length possible. Both dimensions and the valve switching were controlled by the LCMS solution® software (Version 5.54, Shimadzu). The LC × LC was coupled online to an LTQ-Orbitrap XL (Thermo Scientific, Bremen, Germany) equipped with an electrospray source operated in positive mode. The LC × LC data were visualized into two and three dimensions using Chromsquare® ver. 1.5.01 software (Chromaleont, Messina, Italy). LC × LC-MS/MS data were aligned by the open source MZmine2.
2.5. LC and HRMS Parameters
The two dimensions were optimized in previous experiments, detailed parameters are reported in supporting material. For LC × LC analyses the LC parameters were:
1D HILIC analyses were carried out with the following parameters: mobile phase was (A): 5 mM HCOONH4 in H2O (pH 6.02), (B): MeCN. 1D gradient: 0–15 min, 95–80% B, 15–60 min, 80–72% B, 60–62 min, 72–60% B, returning to initial conditions in 0.1 min. Flow rate was set at 0.1 mL/min, column oven was set at 40 °C. 4 μL were injected (70/30 MeCN/0.1% TFA in H2O).
1D RP analyses were carried out as follows: mobile phase was (A): 10 mM HCOONH4 in H2O (pH 9 adjusted with NH4OH), (B): MeCN. 1D gradient: 0–60 min, 2–30% B, returning to initial conditions in 0.1 min. Flow rate was set at 0.1 mL/min, column oven was set at 40 °C. 4 μL were injected (0.1% TFA in H2O).
2D RP mobile phase was (A) 0.1% H3PO4 (PDA detection) or HCOOH (MS detection) in H2O v/v, (B) MeCN. In 2D the gradient was operated in multi-segment shifting mode (see supporting material for detailed description). Flow rate was 2.2 mL/min. Column oven was set at 55 °C. PDA detection parameters were: sampling grate: 100 Hz, time constant 0.025 s, wavelength 220–214 nm. The modulation time was 45 s.
The flow from the 2D was split by a Tee union prior the electrospray (ESI) source (approximately 0.4 mL/min to MS). Detection was performed positive mode as follows: spray voltage was set at +4.5 kV, sheath gas arbitrary units 40, auxiliary gas arbitrary units 12, and capillary temperature 250 °C. MS/MS spectra were collected in data-dependent mode (DDA), over the m/z range of 300–2000, at 15,000 resolution. All MS/MS spectra were collected using a normalized collision energy of 35% and an isolation window of 2 m/z, minimum signal threshold 100, and monoisotopic precursor enabled. Ion trap and Orbitrap maximum ion injection times were set to 50 and 100 ms, respectively. Automatic gain control was set to 2 × 10⁵ for full Fourier transform mass spectrometry (FTMS) scan and 3 × 10⁴ ions for IT. Dynamic exclusion was enabled with a repeat count of 1 and a repeat duration of 30 s. Preview mode for FTMS master scan was enabled. Thermo RAW datafiles were converted in mzXML format by ProteoWizard open source software and elaborated with a free trial of Peaks 8.5 (Bioinformatic Solution, Waterloo, Canada) by using the (database: Aphanizomenon flos-aquae and Arthrospira Platensis, release UniProt 2017) mass accuracy tolerance set at 15 ppm for MS and 0.5 Da for MS/MS. The oxidation of methionine was selected as variable modification.
3. Results and Discussion
In peptide mapping approaches, the sample is usually subjected to trypsin enzymatic proteloysis to generate multiple peptides per protein, and for a complex sample, this results in hundreds or thousands of peptides. When multiple enzymes are used, such as during the gastro-intestinal digestion, this situation is further complicated by subsequent cleavages, and the exact number of derived peptides cannot be calculated. 1D-LC-MS is unable to provide adequate peak capacity values and, as result the MS is overwhelmed by coeluting peptides entering into the MS at the same time. LC × LC is one of the best strategies to simplify the sample prior to MS analysis, expanding the potential of the MS itself in terms of sensibility and identification capability [15].
3.1. Evaluation of Chromatographic Conditions in 1D (HILIC and RP) and 2D (RP)
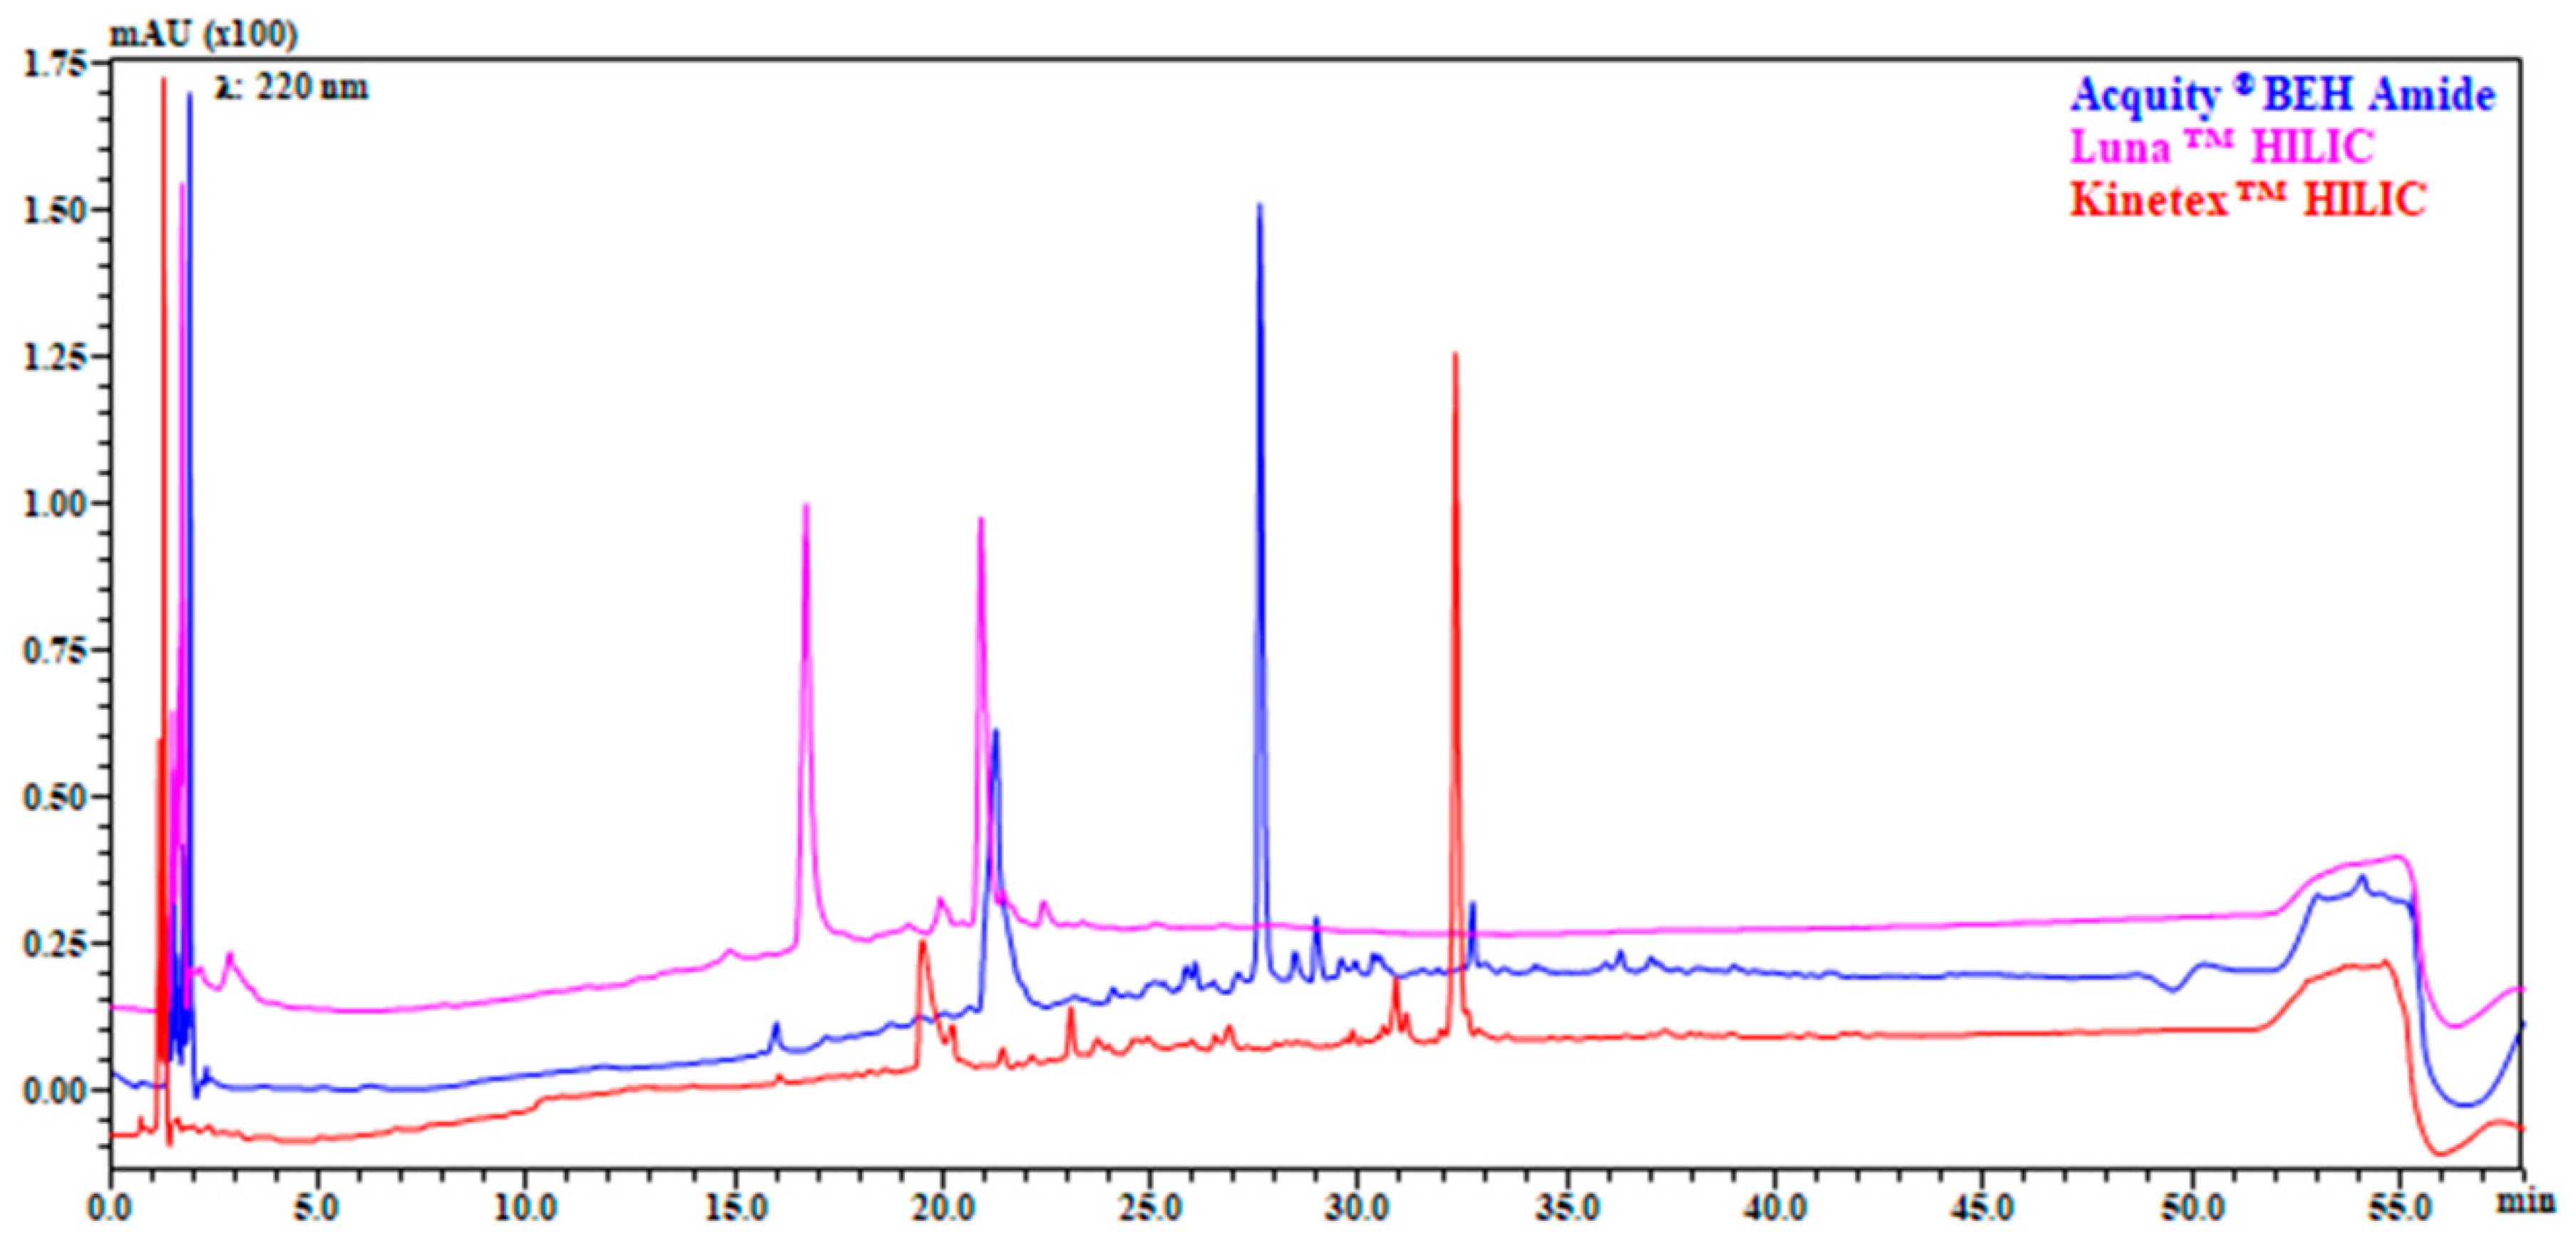
The selection of stationary phase, as well as the chromatographic method development is an essential aspect in LC × LC. In this study five columns were investigated as 1D (three HILIC and two RP). All the HILIC columns were characterized by same geometry (Length and internal diameter) but different chemistry (amide, bare silica, and diol) and particle size (fully or superficially porous particles). Contrariwise, RP columns were also different in geometry (2.1 mm vs. 1.0 mm I.D). Flow rate, buffer selection, column temperature, gradient, and injection volume were based on previously optimized conditions [11]. It can be observed from Figure 1, that reports the separation of the entire gastro-intestinal digest of Klamath formulation, how Amide stationary phase showed higher resolution and peak capacity (nc amide: 209, nc bare silica: 180, nc diol: 150), together with an increased retention, and a different selectivity over the elution window.
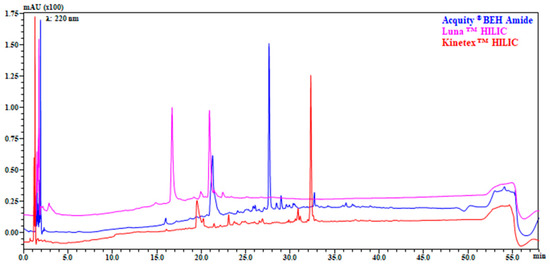
Figure 1.
Comparison of separation on three different HILIC columns: columns: Acquity® BEH Amide 150 mm × 2.1 mm, 1.7 μm (130 Å) (blue); LunaTM HILIC 150 × 2.1 mm, 3.0 μm (200 Å) (pink); KinetexTM HILIC 150 mm × 2.1 mm, 2.6 μm (100 Å) (red). Flow rate: 0.3 mL/min; mobile phase: Pump A: 5 mM HCOONH4 in H2O (pH 6.02), Pump B: MeCN; gradient: 0–2 min, isocratic at 98% B, 2–50 min, 98–60% B, 50–52 min, 60–30% B, 30% B held for 1.30 min, returning to initial conditions in 0.1 min. Column temperature: 40 °C, injection volume 2 μL. Detection: UV λ: 220 nm. Sample: Klamath G.I digest.
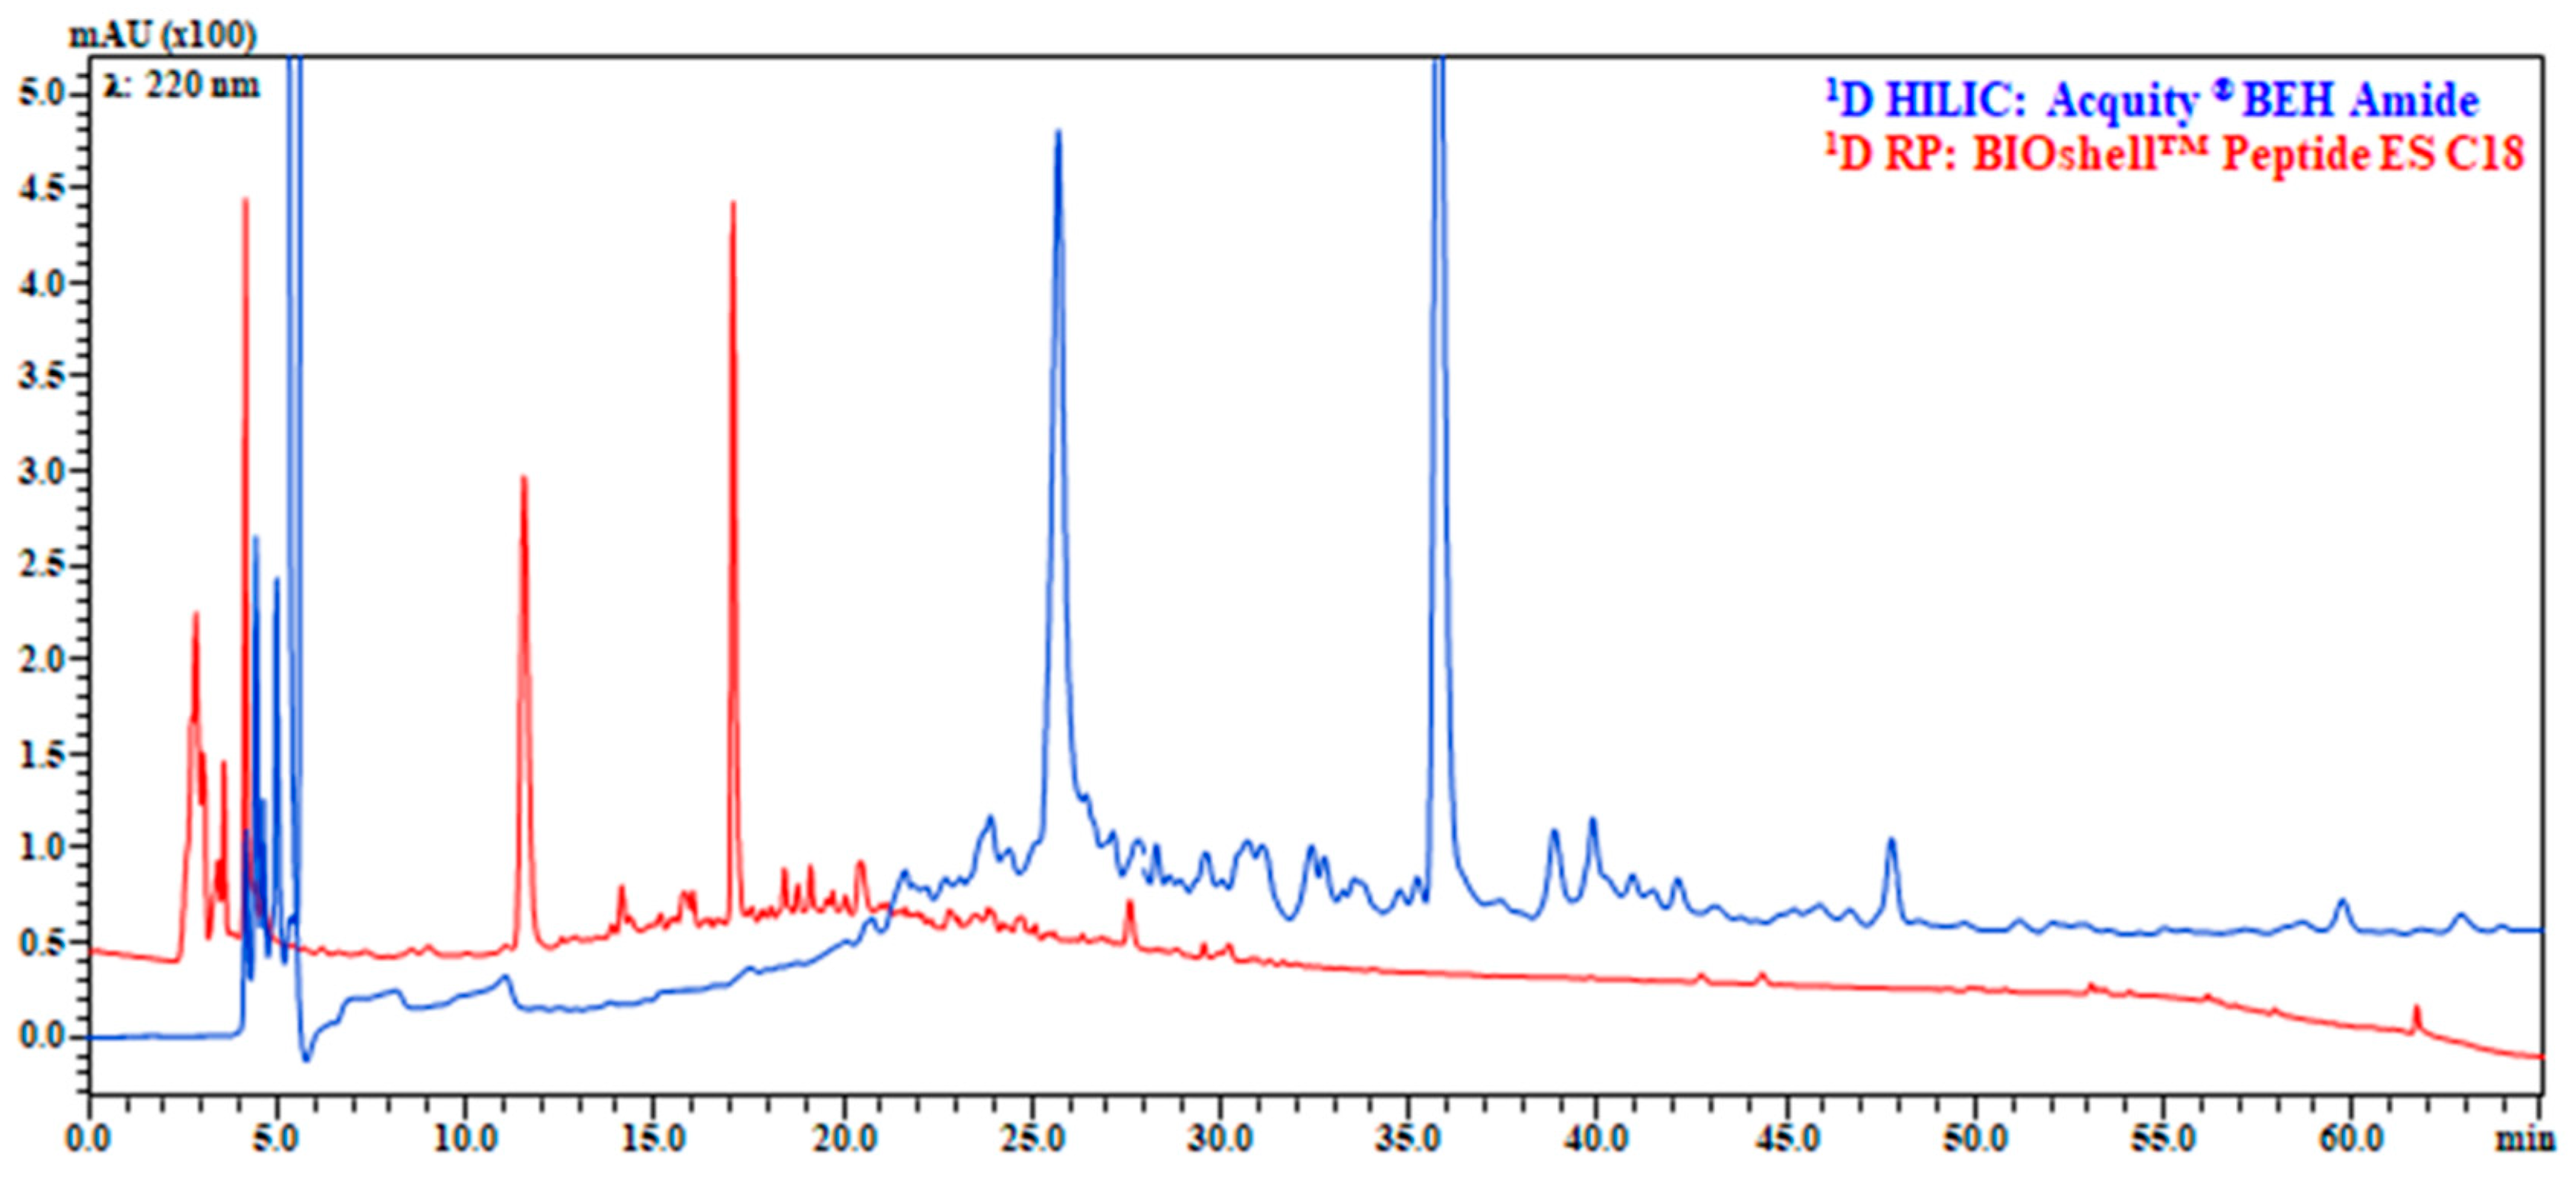
Differently from HILIC, in RP, we compared both a microbore and narrowbore column, in this case only basic pH was investigated, since selectivity can only be achieved by changes in charge on peptide functional groups [4]. While microbore columns are largely used in LC × LC to reduce the volume injected onto the 2D [2], they can be easily overloaded, furthermore, without a micro LC pump, the very low flow rate needed requires an additional flow splitter after the 1D mixer, which adds extra-column volume and gradient delay. As a result, the 2.1 mm I.D column outperformed the 1.0 mm I.D and was selected as candidate (Supplementary Figure S1a,b). Clearly in LC × LC some compromises should be made, such as adapt the flow rate and gradient to facilitate the sampling of peaks, thus HILIC and RP were further adapted lowering the flow rate and adjusting the gradient, the final results are depicted in Figure 2.
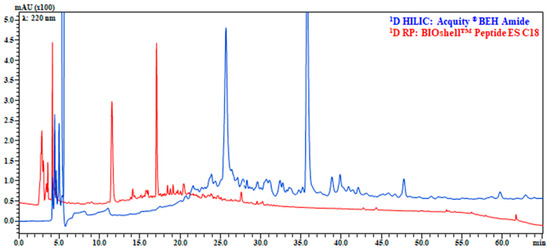
Figure 2.
Comparison of separation on Acquity® BEH Amide 150 mm × 2.1 mm, 1.7 μm (130 Å) (blue) and BIOshellTM Peptide ES C18 150 mm × 2.1 mm, 2.0 µm (160 Å) (red). 1D HILIC analyses conditions: mobile phase, Pump (A): 5 mM HCOONH4 in H2O (pH 6.02), Pump (B): MeCN; gradient, 0–15 min, 95–80% B, 15–60 min, 80–72% B, 60–62 min, 72–60% B, returning to initial conditions in 0.1 min; Flow rate, 0.1 mL/min; column, 40 °C; injection volume, 4 μL. 1D RP analyses conditions: mobile phase, Pump (A): 10 mM HCOONH4 in H2O (pH 9 adjusted with NH4OH), Pump (B): MeCN; gradient, 0–60 min, 2–30% B, returning to initial conditions in 0.1 min. Flow rate, 0.1 mL/min, column oven, 40 °C; injection volume, 4 μL. Enlargement of chromatograms in which the sample complexity can be better appreciated are reported in Figure S3.
The 2D RP separation was optimized with a mixture of five standard peptides ranging from a dipeptide to an octapeptide (Supplementary Figure S2). For UV analysis the acidic modifier was 0.1% phosphoric acid on the other hand 0.1% formic acid was employed only for MS detection. The employment of a core shell particle column especially designed for fast and efficient separation of peptide was adapted from a previous work [11], together with flow rate, column temperature, and modulation time, that have been kept fixed between HILIC × RP and RP × RP.
3.2. HILIC × RP and RP × RP with Trapping Modulation: System Performance Evaluation
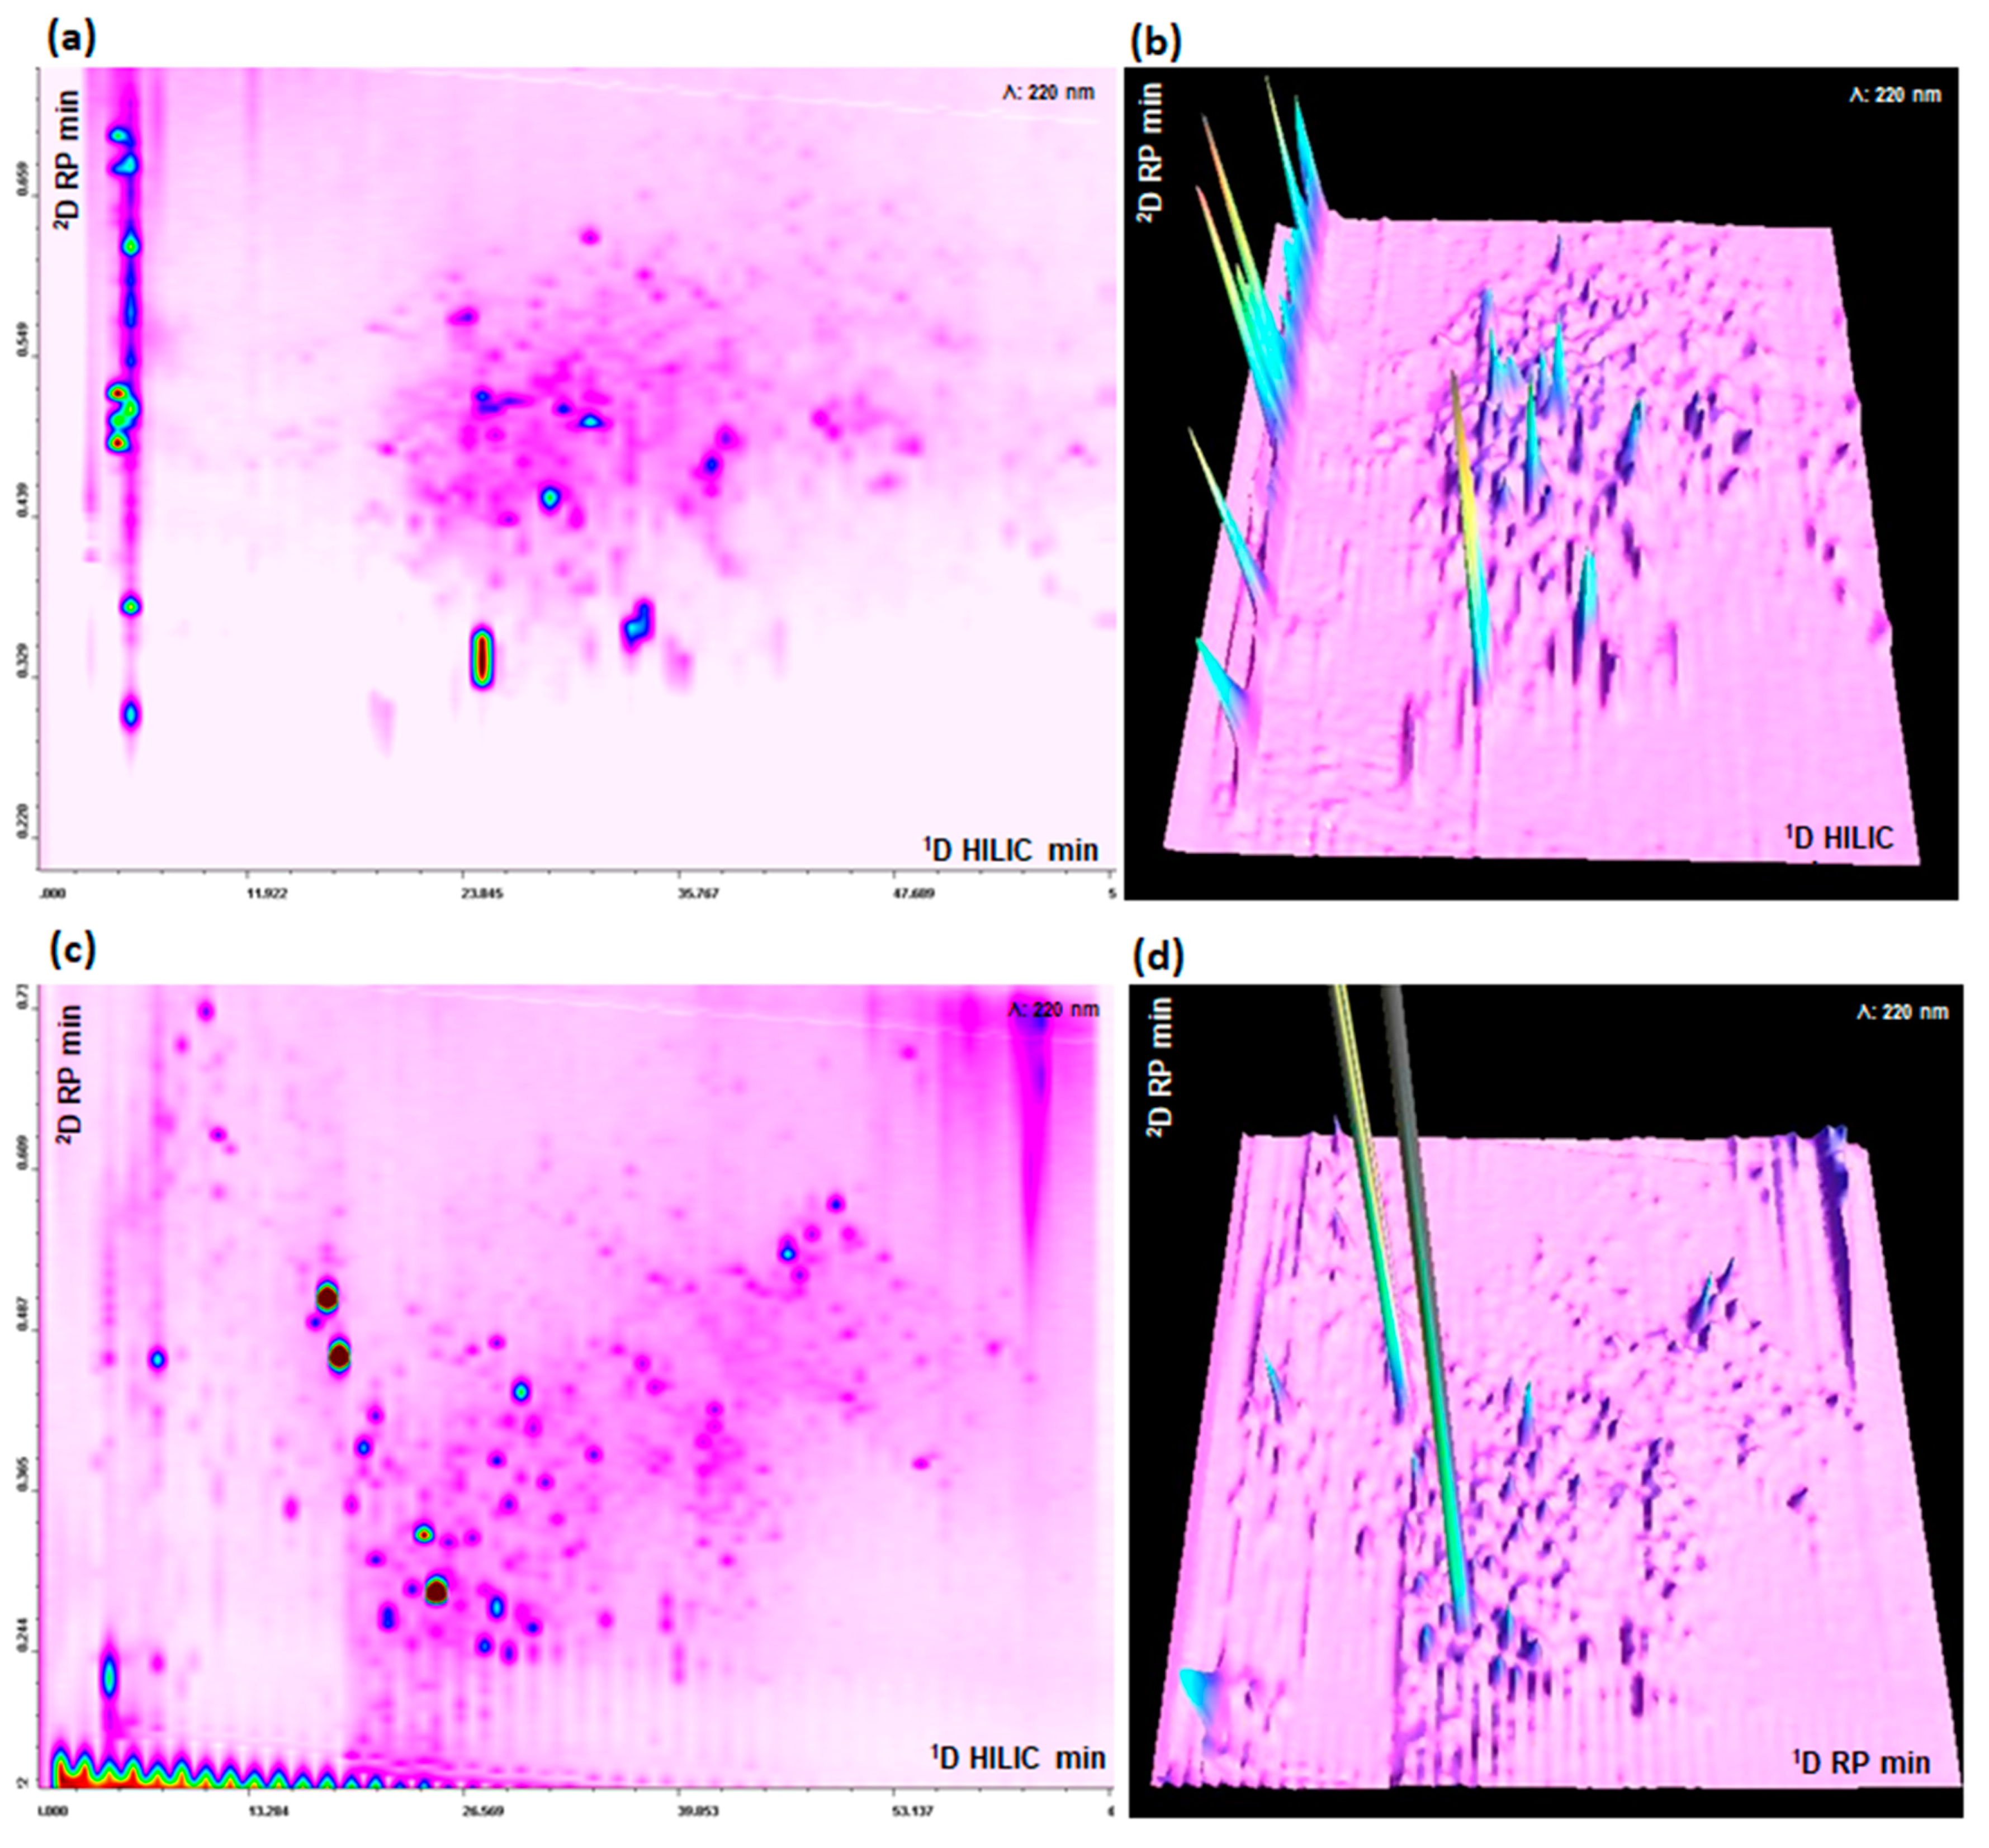
In HILIC × RP, the transfer of the acetonitrile rich mobile phase is the main drawback and, as stated before, different approaches can be used to overcome this challenge. While the amount of organic solvent transferred in RP × RP is lower, at least at the beginning of 1D gradient, poor peak focusing can still occur resulting in reduced sensibility and peak distortion. Among the possible approaches, active solvent modulation has been recently proposed also for peptide mapping [16]. In this regard, based on our previously developed HILIC × RP system we demonstrated that the employment in the modulation interface of highly efficient and retentive trapping columns is highly beneficial [11]. With the aim to compare both techniques for peptide mapping, we used the same trapping modulation interface also in a RP × RP approach. The dilution flow ratio prior the trapping was 1:10 for HILIC × RP and was adapted to the different percentage of acetonitrile among the two set-ups, with a final ratio of 1:2 for RP × RP (data not shown). Trapping columns were operated in forward flush mode, to extend system lifetime, given the high backpressure generated by the 1.9 μm particles. The 2D and 3D-UV and MS plot relative to the separation obtained with the HILIC × RP and RP × RP approaches are depicted in Figure 3a–d respectively.
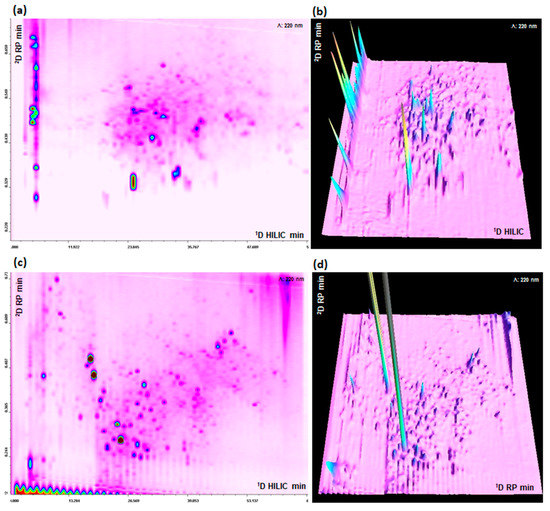
Figure 3.
(a,b) HILIC × RP-UV (220 nm) 2D and 3D plots. (c,d) RP × RP-UV (220 nm) 2D and 3D plots. Sample: Microalgae G.I digest.
Sharp and symmetrical peaks were obtained with both approaches, the difference in peak distribution across the 2D separation space is clearly related to the different orthogonality of the methods. In RP × RP, peaks tend to be more concentrated along a diagonal line, even if the shifted gradient help to maximize the 2D space occupation [17], on the contrary in HILIC × RP there is a better, and partially random, occupation of 2D separation area. The performance of the two LC × LC platforms are summarized in Table 1. The peak capacity were calculated taking into account both undersampling and orthogonality. For both 1D HILIC and RP, peak capacity has been calculated with Equation (1).
where tr,l and tr,f are the retention times of the last and first eluting peaks in the 2D maps, and 1wavg is the average 4σ peak width (1D) of five peaks across the 2D space, and covering the whole separation window. The 2D RP peak capacity was calculated according to Equation (2):
where 2tg is the 2D gradient time, without the re-equilibration time and 2wavg is the average 2D 4σ peak width, relative to the same five peaks considered for the 1D calculation. The theoretical peak capacity of the two LC × LC systems was calculated as follows:
and subsequently corrected for the undersampling effect [18] with the Equation (4).
in which the term β is the correction factor described in the Equation (5):
where 2tc is second dimension cycle time, and w the average 1D peak width. This value must be corrected taking into account the correlations between the two dimensions. The asterisk method [19] has been employed for the estimation of the orthogonality (A0). The maximum value of A0 = 0.70 was obtained with the HILIC × RP system, which is as expected higher than the RP × RP (0.59), where the selectivity is only given from the different mobile phase pH, and thus limited. Interestingly, these values are very similar to the model of Gilar [7]. Finally, the values of 932 and 701 were obtained for HILIC × RP and RP × RP. It should be noted that we fixed the total analysis time to 60 min, and the employment of longer gradients in 1D, which is very common in peptide mapping, can lead to higher peak capacity values.
nc2D = nc1 × nc2

Table 1.
Performances of HILIC × RP and RP × RP approaches. Peak capacities values are corrected taking into account undersampling and orthogonality.
3.3. Comparison of HILIC × RP and RP × RP Coupled to Tandem Mass Spectrometry for Peptide Mapping
While a huge number of peptides belonging to different phycobiliproteins have been detected by both approaches, in this study we focused only on phycocyanins, since these proteins are the most interesting for human health [14], representative spectra are reported in Figure S4.
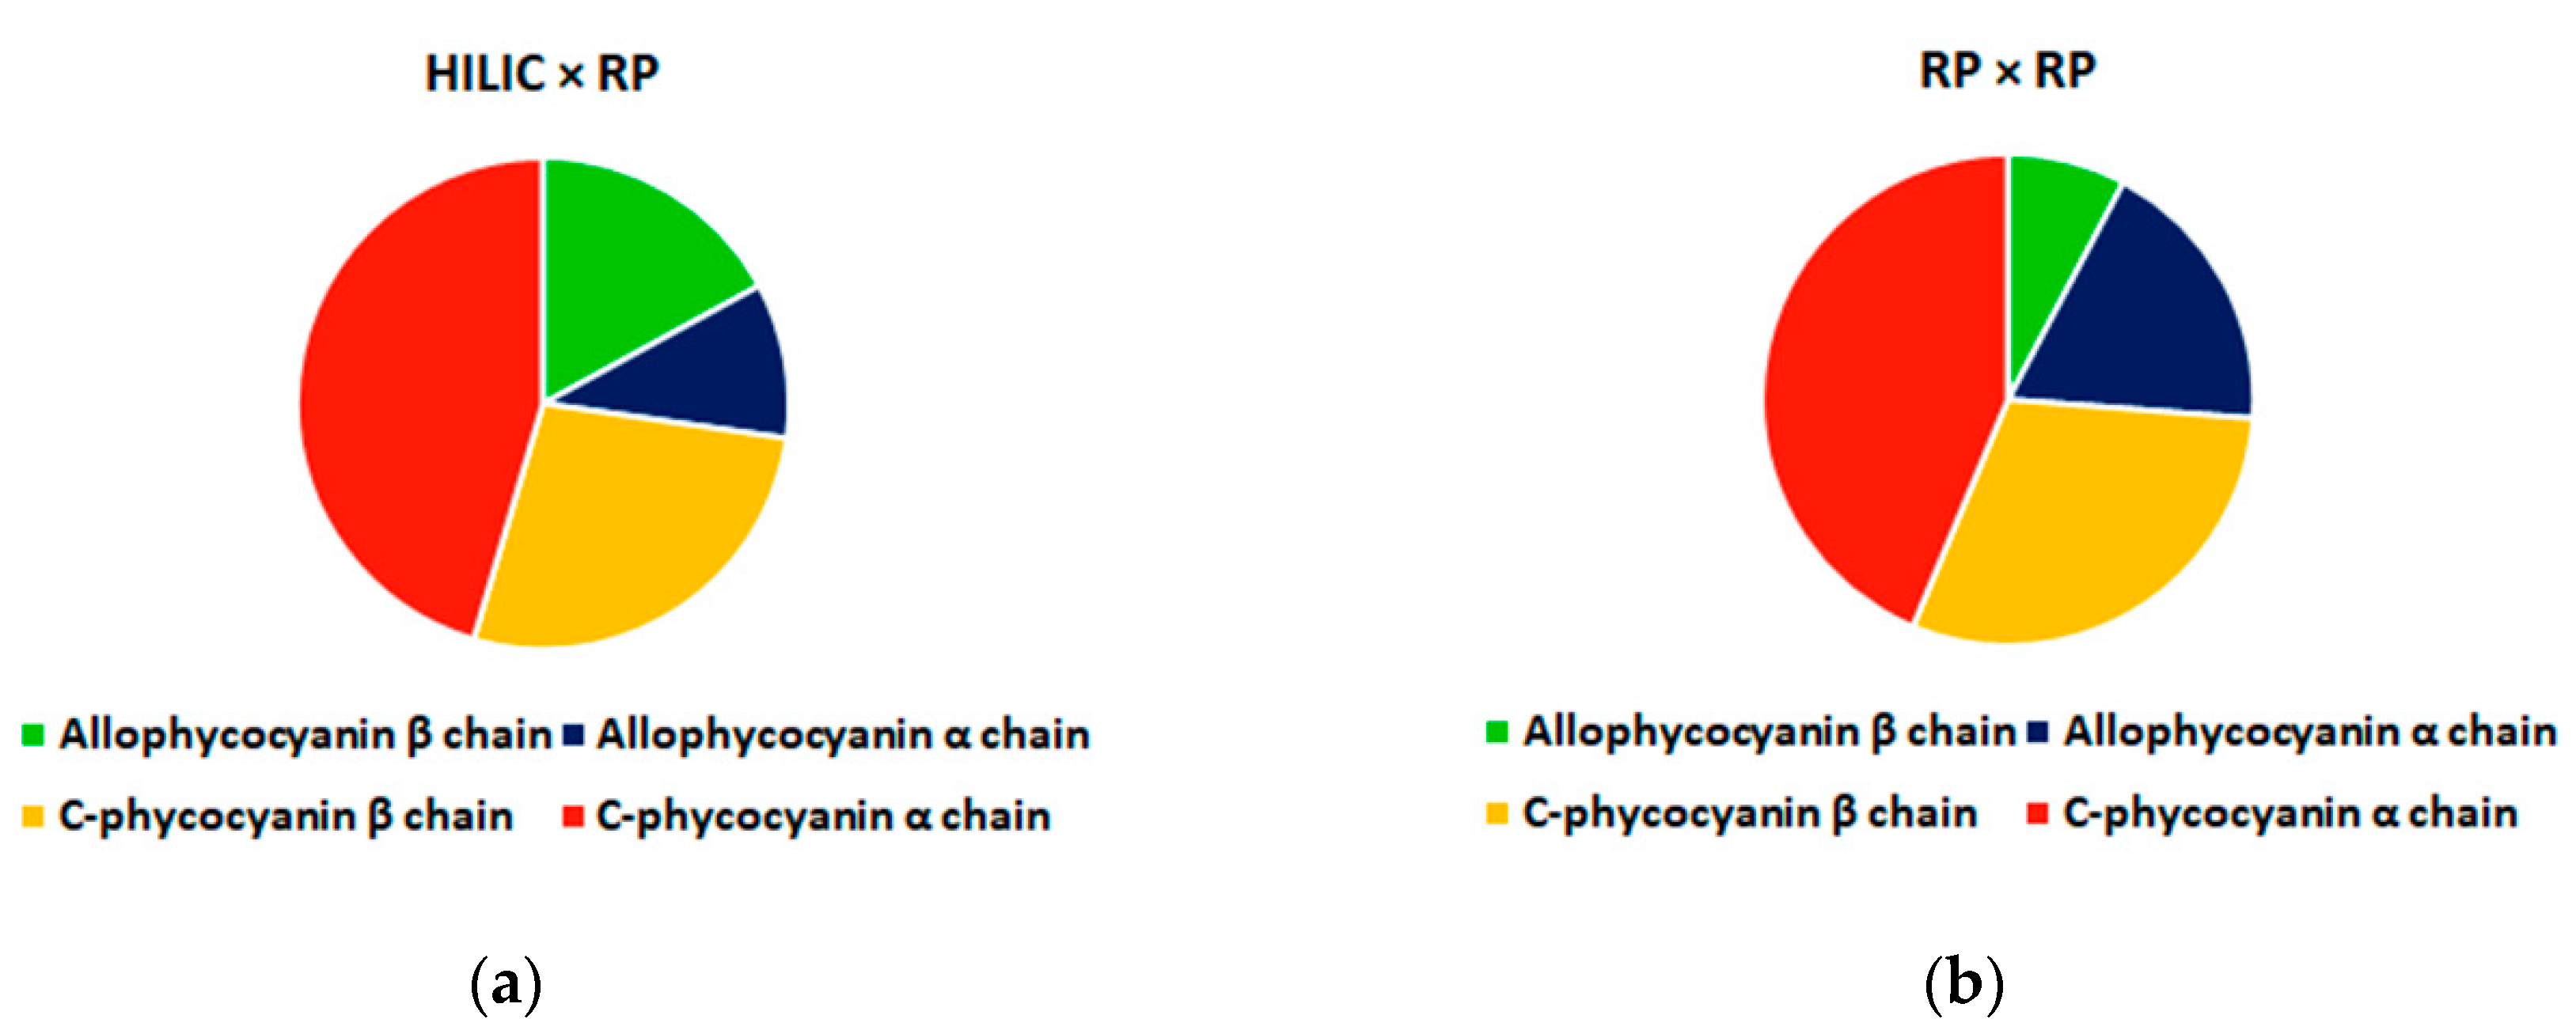
One of the main challenges in the coupling of LC × LC to MS is the narrow peak widths, and the acquisition speed of the Orbitrap is not suited for this task, thus the resolution should be drastically reduced for data dependent acquisition. Despite this mass accuracy was well below 5 ppm (average −2.76 ppm, see supporting material). Figure 4 reports the origin of peptides detected with the two approaches, and, as can be observed in both approaches the half of identified peptides (HILIC × RP: 46%, RP × RP: 44%) came from C-phycocyanin alpha chain, a similar value was obtained for C-phycocyanin beta chain (HILIC × RP: 27%, RP × RP: 30%) while opposite values were obtained from Allophycocyanin peptides (alpha: HILIC × RP: 10%, RP × RP: 18% and beta: HILIC × RP: 17%, RP × RP: 8%).
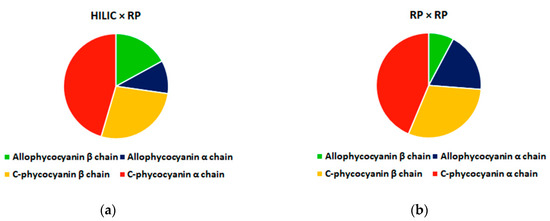
Figure 4.
Origin of phycocyanin-derived peptides detected in microalgae G.I digests with HILIC × RP (a) and RP × RP (b) approaches.
The highest number of peptides, without considering de novo sequencing peptides, was detected obtained with the RP × RP approach (103 vs. 88), the detailed list of peptides identified is reported in Supplementary Table S1. The difference among the two approaches can be related to the chemical nature of some peptides that, because of the effect of highly eluotropic 1D mobile phase, cannot be efficiently retained even with the high retentive trapping columns, and thus are lost as breakthrough effect in the HILIC × RP approach
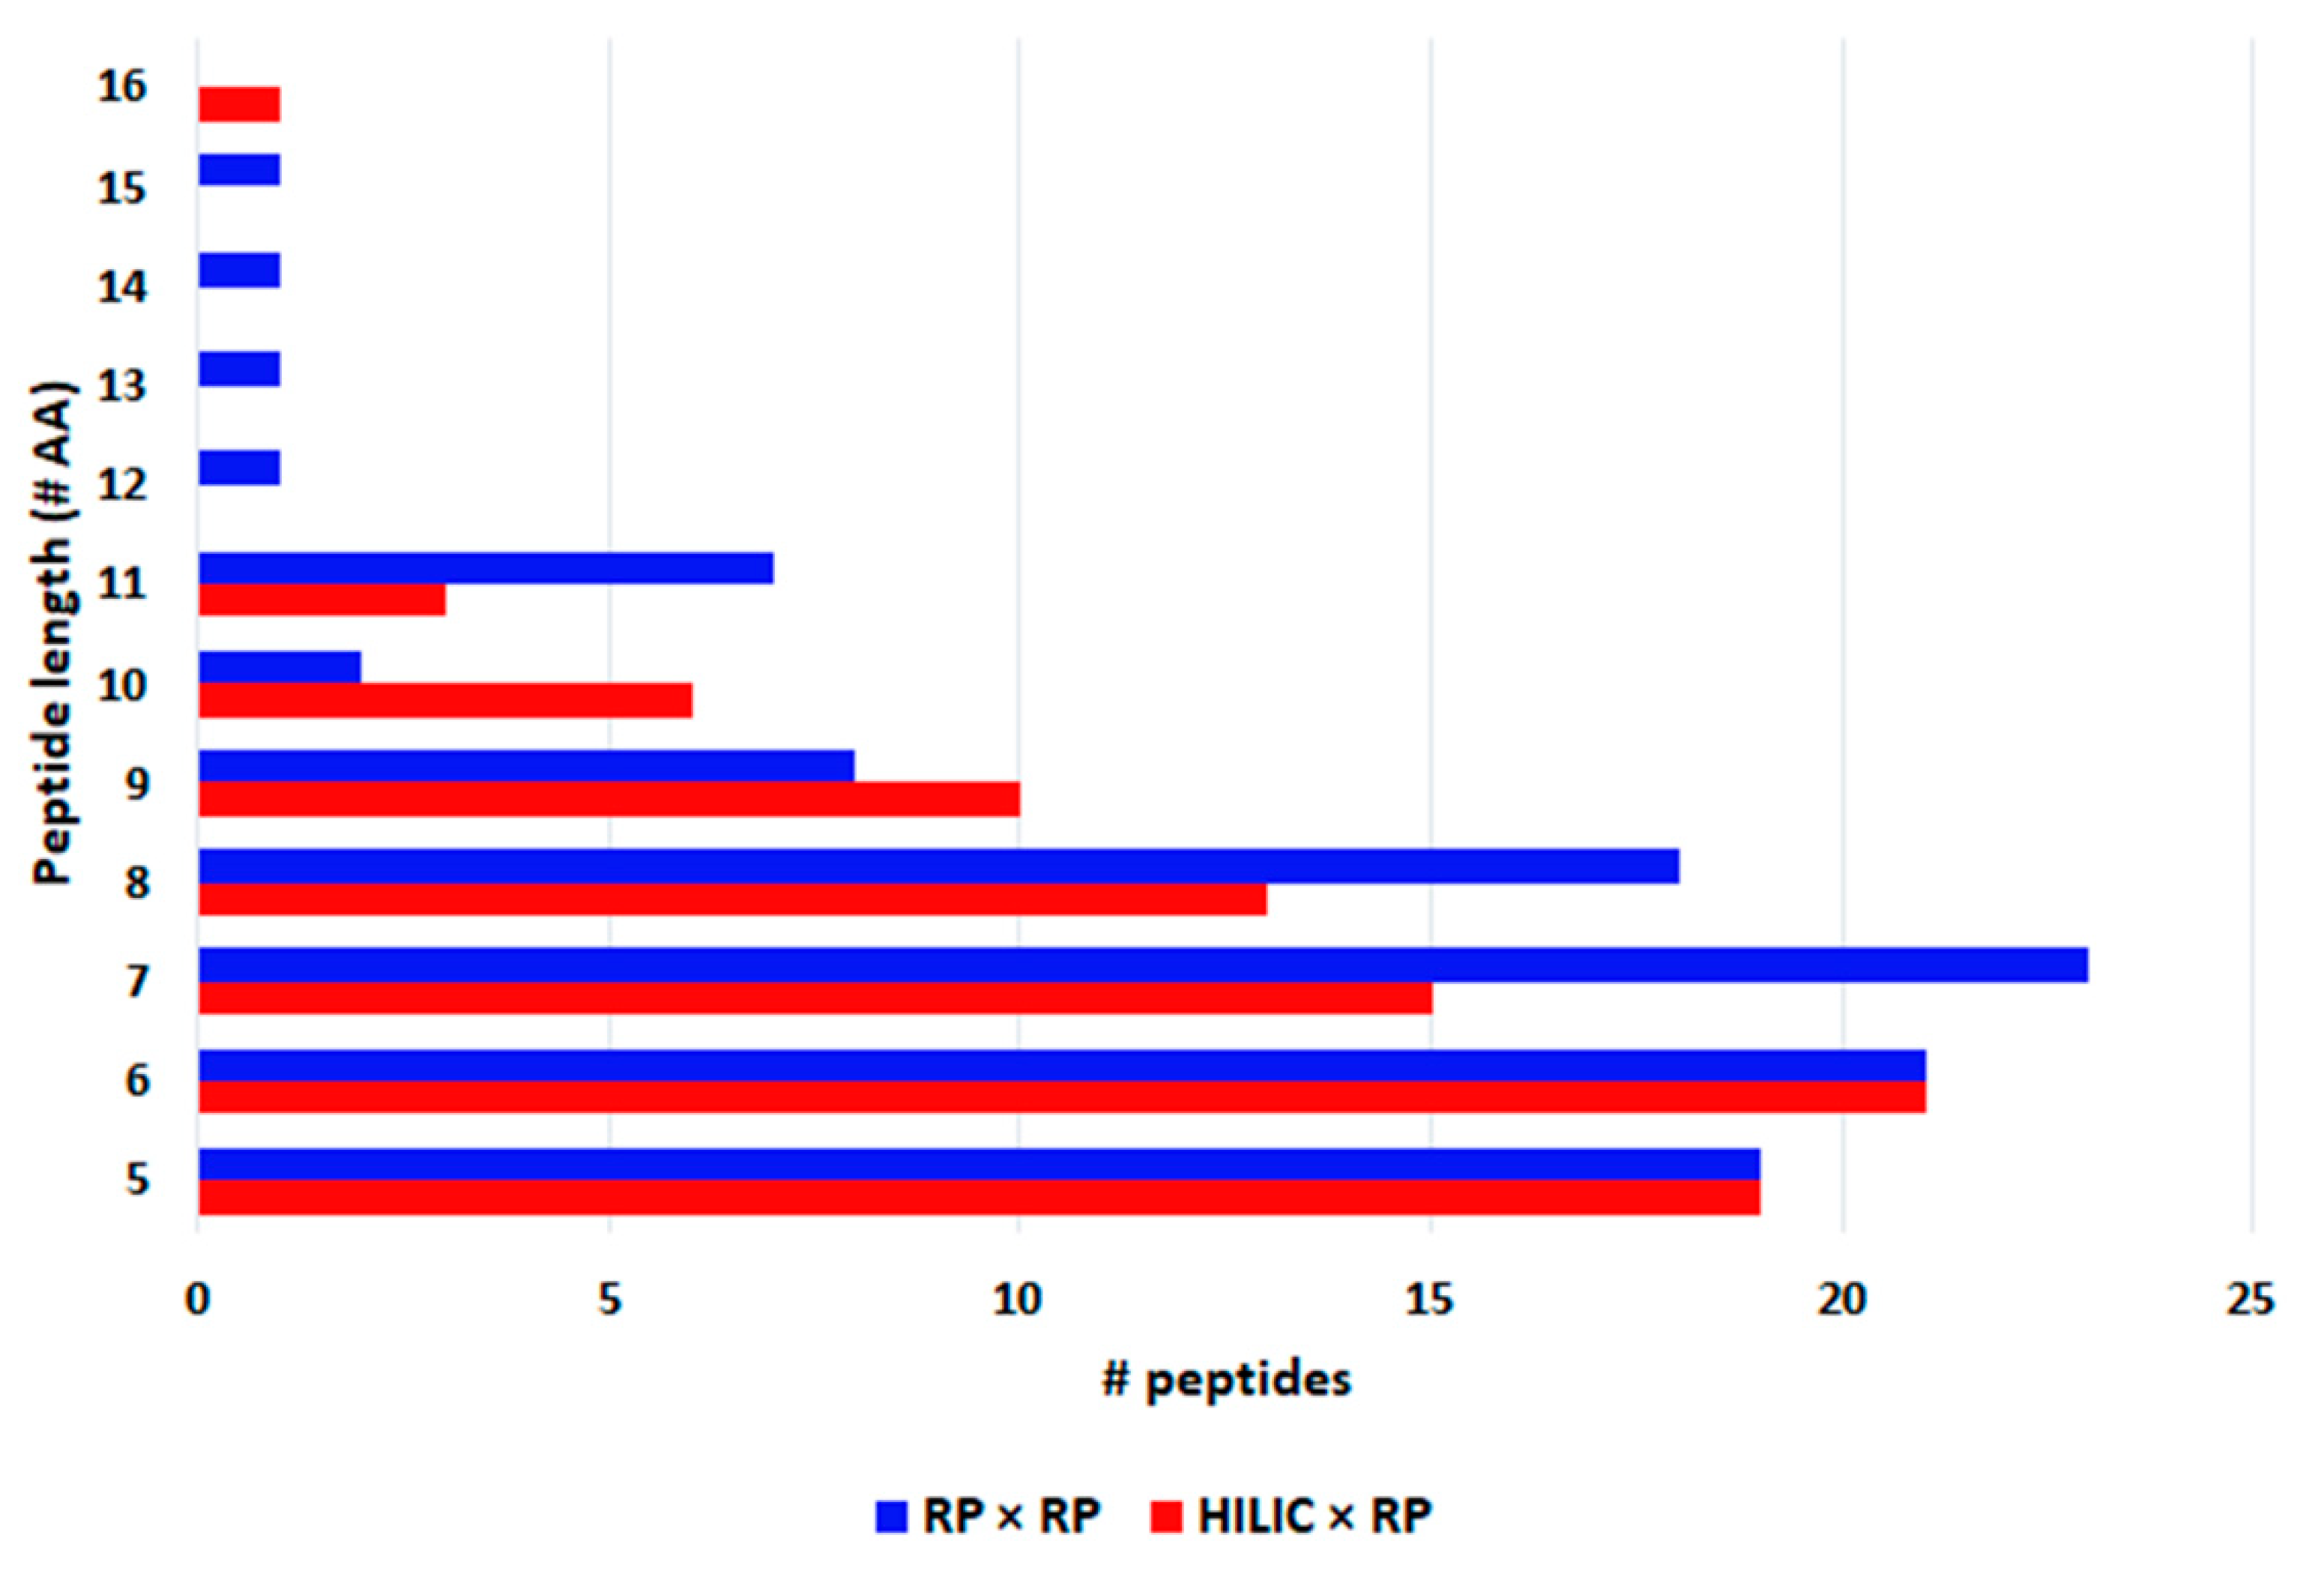
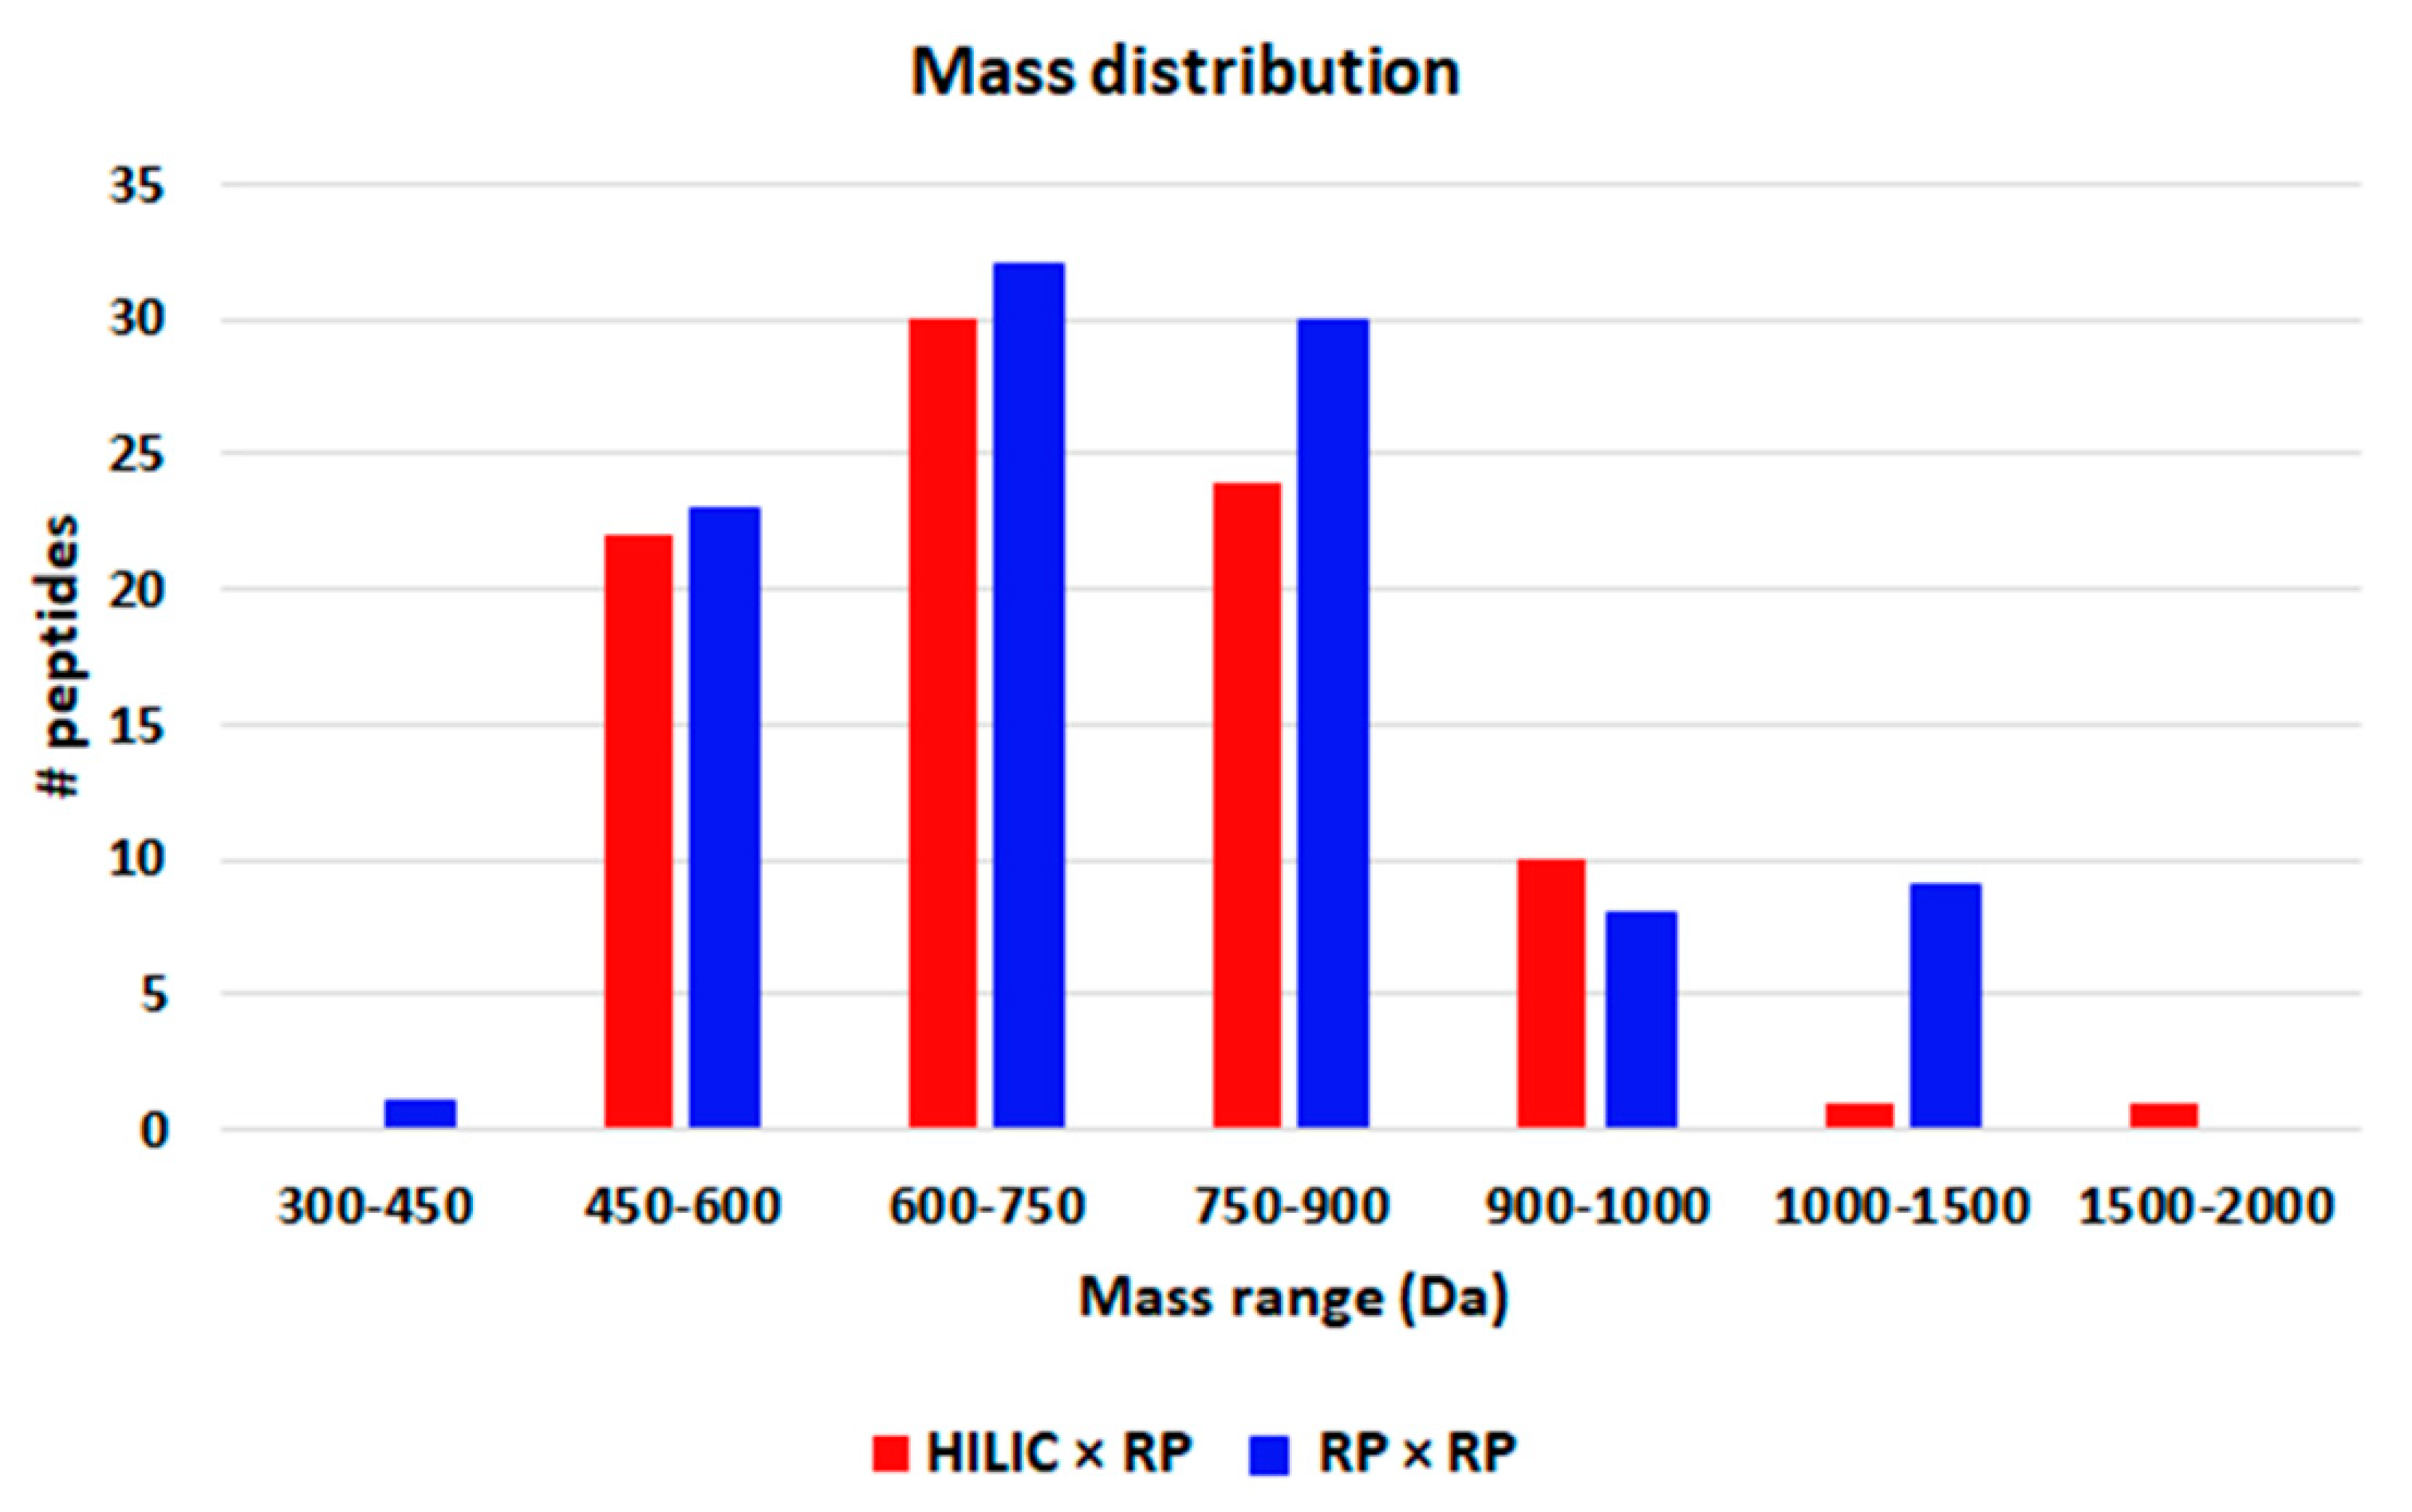
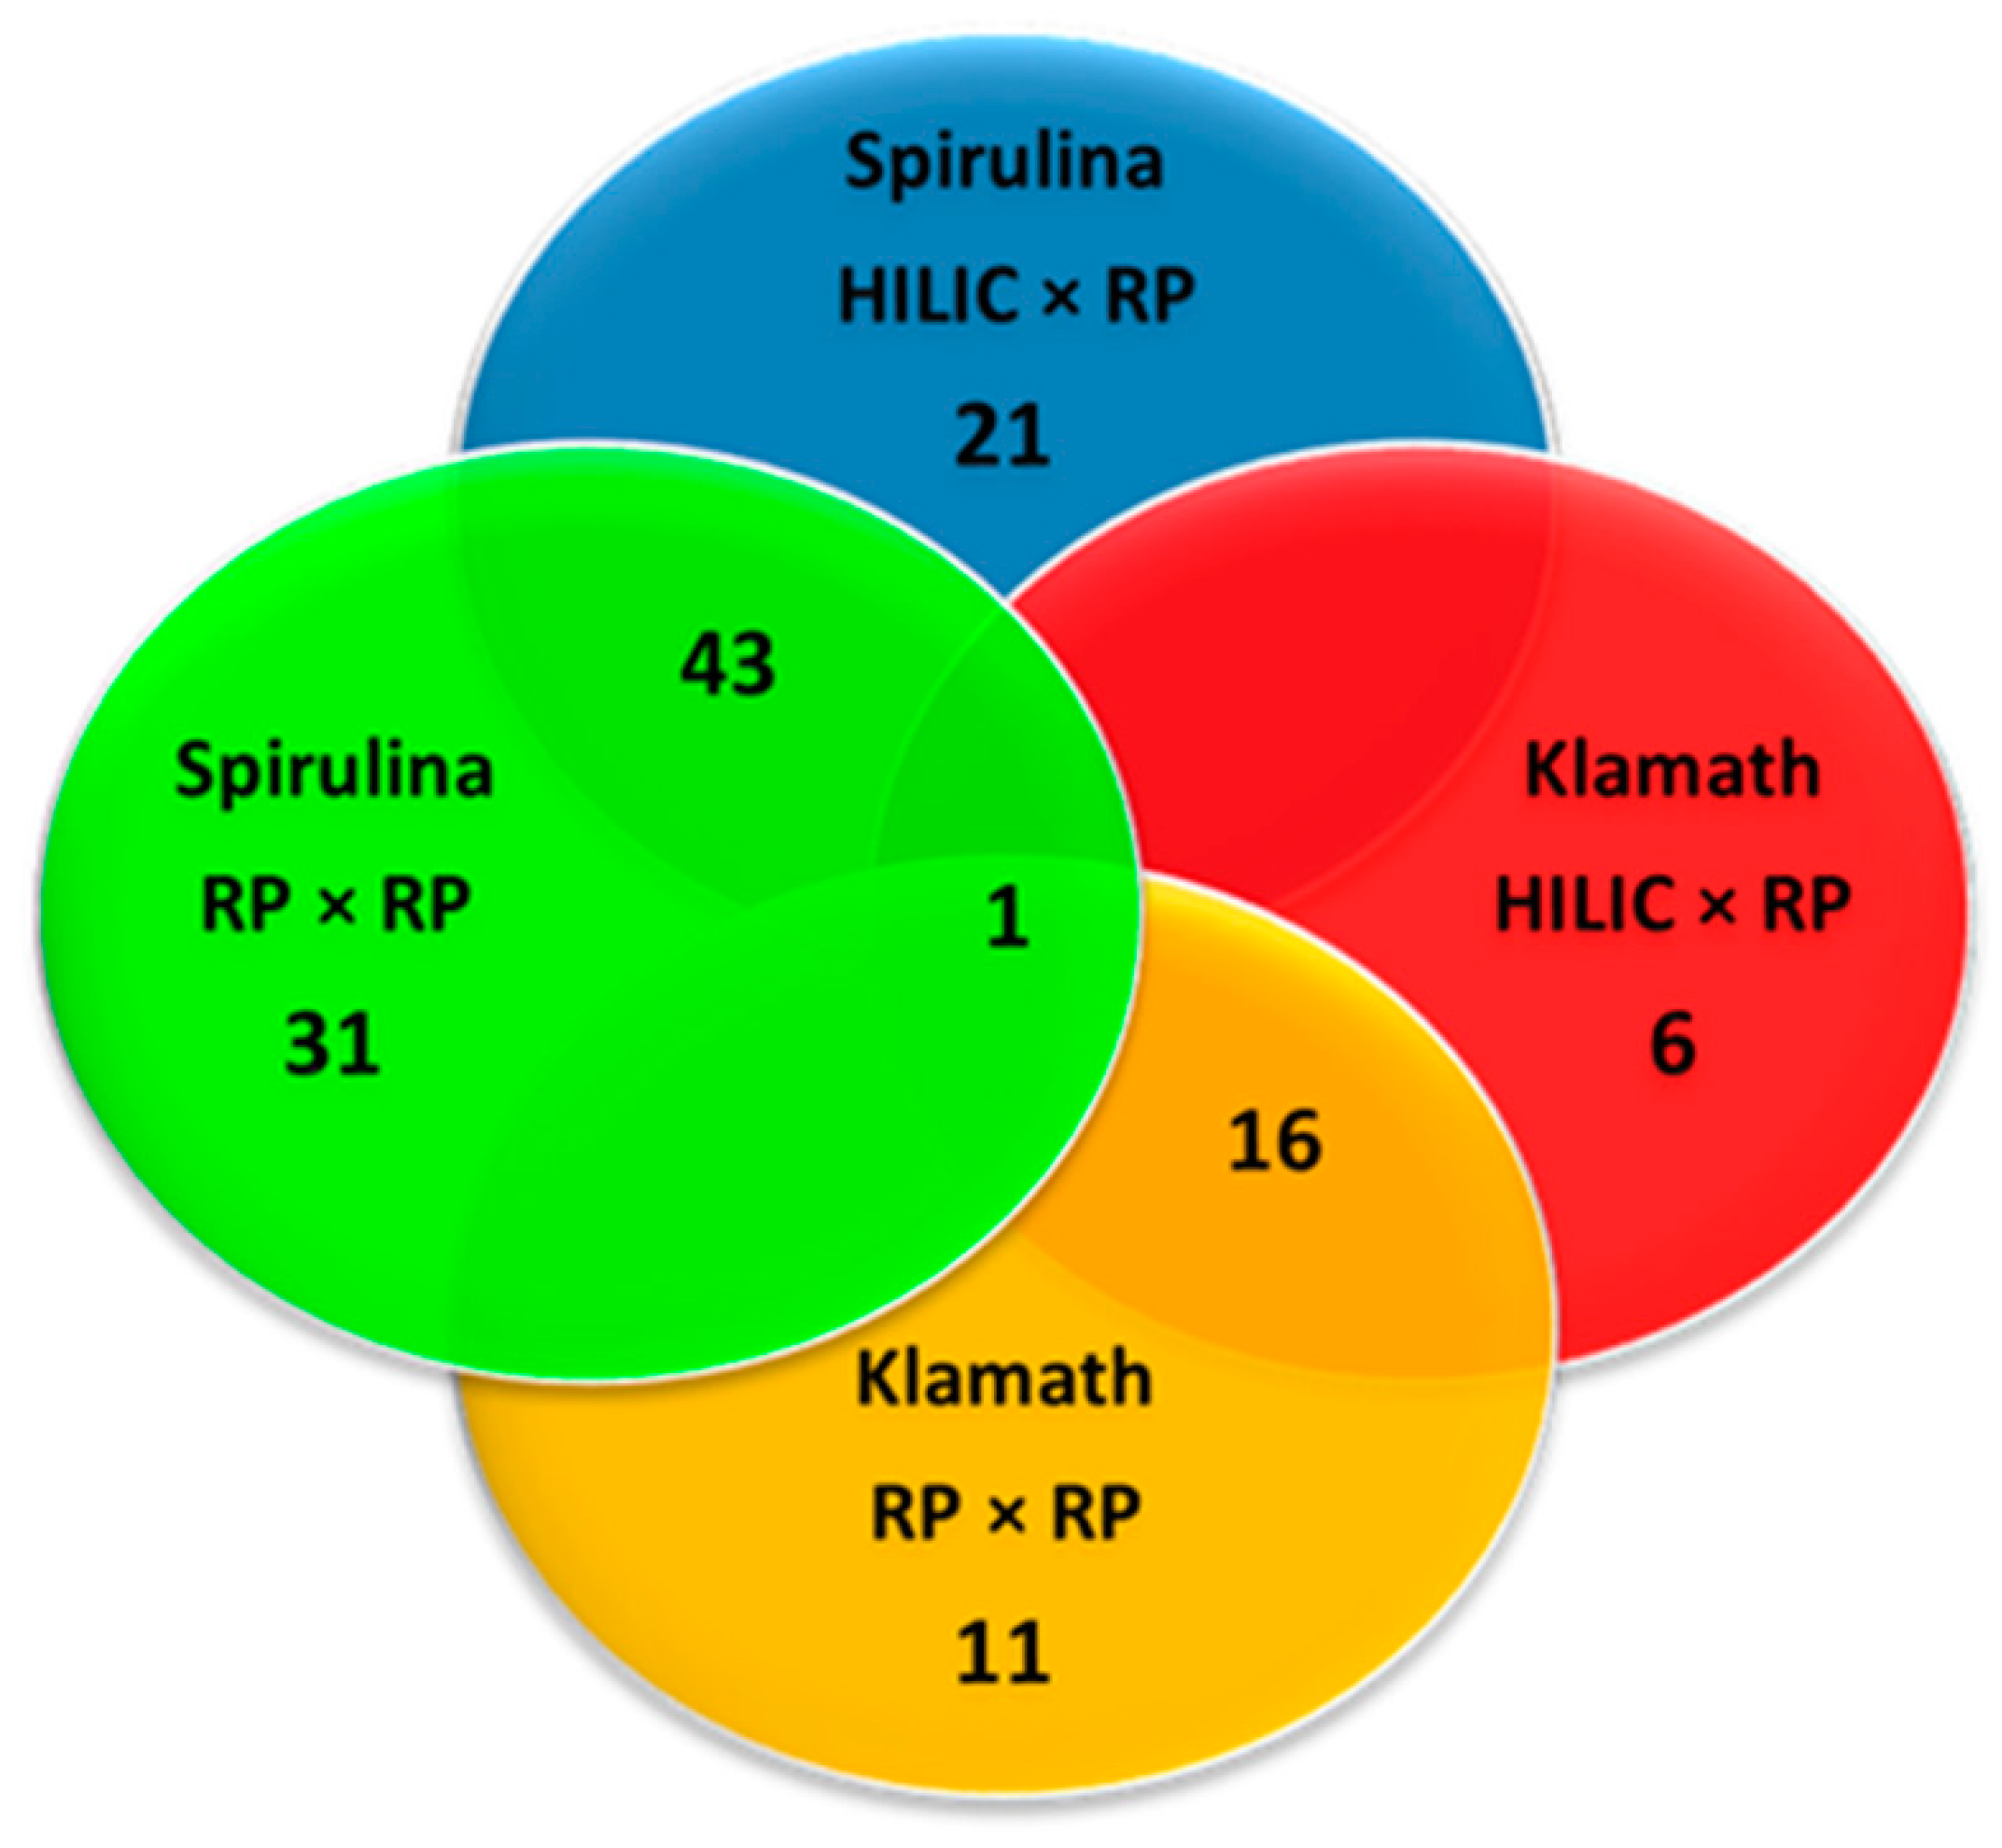
The largest part of peptides were comprised between penta and octapeptides (Figure 5) and their molecular weight ranged between 417 and 1678 Da (Figure 6), as can be appreciated very similar results were obtained with the two approaches. In fact, for both Spirulina and Klamath peptides, a high degree of overlap between the identifications with the two separation approaches was obtained, with ≥ 60% in common between the two techniques (Figure 7).
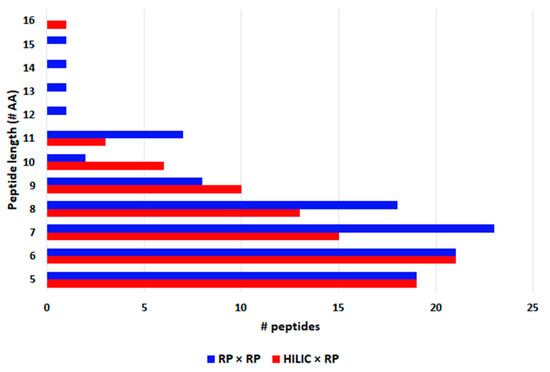
Figure 5.
Peptide length of phycocyanin-derived peptides detected in microalgae G.I digests with HILIC × RP (red) and RP × RP (blue) approaches.
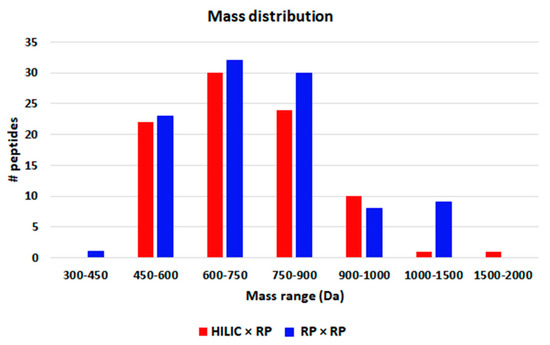
Figure 6.
Mass distribution of peptides detected in microalgae G.I digests with HILIC × RP (red) and RP × RP (blue) approaches.
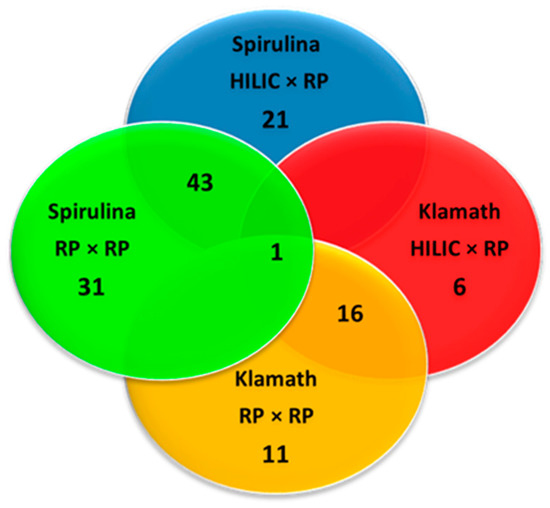
Figure 7.
Venn diagram showing the overlap between the peptides identified in microalgae G.I digests with HILIC × RP and RP × RP approaches. Color legend: red, HILIC × RP applied to Klamath G.I digest; blue, HILIC × RP applied to Spirulina G.I digest; yellow, RP × RP applied to Klamath G.I digest; green, RP × RP applied to Spirulina G.I digest.
The suitability of HILIC in online 2D-LC coupling has been demonstrated in several papers. In particular, with respect to the employment of strong cation exchange (SCX) as 1D for neuropeptides [20] as well as for phosphopeptides [21]. In this work, we carried out a direct comparison between HILIC × RP and RP × RP with a trapping columns modulation interface, even though for a limited number of proteins. These data evidence that both strategies are highly suitable and flexible for peptide mapping. Modifications such as the scale down to capillary or nano-LC conditions could further boost the sensitivity, while the employment of faster MS devices could result in higher identification capability. The comparison of a non-trapping (loop) modulation interface with the current strategy will be presented in a subsequent paper.
4. Conclusions
Microalgae represent a growing market in the nutraceutical field, especially for the high protein content, and the bioactivity which is related to the peptides derived from their hydrolysis. While the healthy properties are constantly being reported in literature, there is a lack of knowledge about the nature of G.I derived peptides, thus peptidomic approaches are necessary. Comprehensive LC × LC has a great potential in peptide mapping, but can suffer from sensitivity and solvent incompatibility problems related to the modulation process. In this work we focused on this aspect, and by means of a recently developed trapping columns modulation interface we described a comparison between HILIC × RP and RP × RP for the peptide mapping of microalgae formulations. Both methods showed that the employment of two highly retentive trapping columns as modulation interface deliver high peak focusing and boost sensitivity and efficiency. The results showed similar performances between the two strategies, with slightly better identification capability for the RP × RP setup. It is noteworthy that both setups provided high peak capacity in relative short time for bottom-up approaches and a good coverage of phycocyanins, which were the main target of this study. These data highlight the potential of trapping column modulation with both stationary phase combinations and further enforce the flexibility and potential of LC × LC for complex sample analysis such as peptide gastro-intestinal digests.
Supplementary Materials
The following are available online at https://www.mdpi.com/2297-8739/7/2/25/s1, Figure S1: Comparison of separation on two different RP columns: columns: (a): BIOshellTM Peptide ES C18 150 mm × 2.1 mm, 2.0 μm. Flow rate: 0.1 mL/min; gradient: 0–50 min, 5–50% B, 50–60 min, 50–99% B, 99% B held for 1 min, returning to initial conditions in 0.1 min. (b) Discovery® BIO WidePore C18 150 mm × 1 mm, 5 μm (300 Å). Flow rate: 0.06 mL/min; gradient: 0–60 min, 2–30% B, 60–65 min, 30–99% B, 99% B held for 1 min, returning to initial conditions in 0.1 min. Mobile phase: 10 mM HCOONH4 in H2O (pH 8.07 adjusted with NH4OH), (B): MeCN, column temperature: 30 °C, injection volume 2 μL. Detection: UV λ 220–214 nm. Sample: Klamath G.I digest. Figure S2: 2D RP of a mixture of five standard peptides. Column: BIOshellTM Peptide ES C18 50 mm × 3.0 mm, 2.7 μm (160 Å). Flow rate: 2.2 mL/min. Mobile phase: 0.1% H3PO4 (B): MeCN, column temperature: 50 °C, injection volume 2 μL. Detection: UV λ 220–214 nm. Sample: (1) Gly-Tyr (2) Val-Tyr-Val (3) Met-Enkephaline (4) Leu-Enkephaline (5) Angiotensin II. Figure S3. Enlargement of 1D HILIC (blu) and 1D RP (red) chromatograms in which complexity of Klamath G.I digest can be better appreciated. 1D HILIC analyses conditions: column, Acquity® BEH Amide 150 mm × 2.1 mm, 1.7 μm (130 Å); mobile phase, Pump (A): 5 mM HCOONH4 in H2O (pH 6.02), (B): MeCN; gradient, 0–15 min, 95–80% B, 15–60 min, 80–72% B, 60–62 min, 72–60% B, returning to initial conditions in 0.1 min; Flow rate, 0.1 mL/min; column, 40 °C; injection volume, 4 μL. 1D RP analyses conditions: column, BIOshellTM Peptide ES C18 150 mm × 2.1 mm, 2.0 µm (160 Å); mobile phase, (A): 10 mM HCOONH4 in H2O (pH 9 adjusted with NH4OH), Pump (B): MeCN; gradient, 0–60 min, 2–30% B, returning to initial conditions in 0.1 min. Flow rate, 0.1 mL/min, column oven, 40 °C; injection volume, 4 μL. Figure S4: (a–f). MS/MS spectra revealing identification of peptides from Spirulina (a–c) and Klamath (d–f) G.I digest; Table S1: Complete list of peptide identified in the different samples with HILIC × RP and RP × RP approaches with Database search.
Author Contributions
Conceptualization, E.S. (Eduardo Sommella) and E.S. (Emanuela Salviati); methodology, E.S. (Emanuela Salviati); software, V.D.S.; validation, E.S. (Eduardo Sommella), E.S. (Emanuela Salviati); formal analysis, E.S. (Emanuela Salviati); investigation, E.S. (Eduardo Sommella), S.M.; resources, P.C.; data curation, E.S. (Eduardo Sommella), F.G.; writing—original draft preparation, E.S. (Eduardo Sommella); writing—review and editing, P.C.; visualization, S.M.; supervision, F.G.; project administration, P.C.; funding acquisition, P.C. All authors have read and agreed to the published version of the manuscript.
Funding
This research received no external funding.
Acknowledgments
The authors would like to kindly thank Francesco Gasparrini for the trapping columns gift.
Conflicts of Interest
The authors declare no conflict of interest.
References
- Lv, W.; Shi, X.; Wang, S.; Xu, G. Multidimensional liquid chromatography-mass spectrometry for metabolomic and lipidomic analyses. Trends Anal. Chem. 2019, 120, 115302. [Google Scholar] [CrossRef]
- Dugo, P.; Cacciola, F.; Kumm, T.; Dugo, G.; Mondello, L. Comprehensive multidimensional liquid chromatography: Theory and applications. J. Chromatogr. A 2008, 1184, 353–368. [Google Scholar] [CrossRef] [PubMed]
- Donato, P.; Cacciola, F.; Sommella, E.; Fanali, C.; Dugo, L.; Dachà, M.; Campiglia, P.; Novellino, E.; Dugo, P.; Mondello, L. Online comprehensive RPLC × RPLC with mass spectrometry detection for the analysis of proteome samples. Anal. Chem. 2011, 83, 2485–2491. [Google Scholar] [CrossRef] [PubMed]
- Sommella, E.; Pepe, G.; Ventre, G.; Pagano, F.; Manfra, M.; Pierri, G.; Ismail, O.H.; Ciogli, A.; Campiglia, P. Evaluation of two sub-2 m stationary phases, core-shell and totally porous monodisperse, in the second dimension of on-line comprehensive two dimensional liquid chromatography, a case study: Separation of milk peptides after expiration date. J. Chromatogr. A 2015, 1375, 54–61. [Google Scholar] [CrossRef]
- Sandra, K.; Steenbeke, M.; Vandenheede, I.; Vanhoenacker, G.; Sandra, P. The versatility of heart-cutting and comprehensive two-dimensional liquid chromatography in monoclonal antibody clone selection. J. Chromatogr. A 2017, 1523, 283–292. [Google Scholar] [CrossRef]
- Boersema, P.J.; Mohammed, S.; Heck, A.J.R. Hydrophilic interaction liquid chromatography (HILIC) in proteomics. Anal. Bioanal. Chem. 2008, 391, 151–159. [Google Scholar] [CrossRef]
- Gilar, M.; Olivova, P.; Daly, A.E.; Gebler, J.C. Orthogonality of separation in two-dimensional liquid chromatography. Anal. Chem. 2005, 77, 6426–6434. [Google Scholar] [CrossRef]
- Stoll, D.R.; Harmes, D.C.; Staples, G.O.; Potter, O.G.; Dammann, C.T.; Guillarme, D.; Beck, A. Development of Comprehensive Online Two-Dimensional Liquid Chromatography/Mass Spectrometry Using Hydrophilic Interaction and Reversed-Phase Separations for Rapid and Deep Profiling of Therapeutic Antibodies. Anal. Chem. 2018, 90, 5923–5929. [Google Scholar] [CrossRef]
- Gargano, A.F.G.; Shaw, J.B.; Zhou, M.; Wilkins, C.S.; Fillmore, T.L.; Moore, R.J.; Somsen, G.W.; Paša-Tolić, L. Increasing the Separation Capacity of Intact Histone Proteoforms Chromatography Coupling Online Weak Cation Exchange-HILIC to Reversed Phase LC UVPD-HRMS. J. Proteome Res. 2018, 11, 3791–3800. [Google Scholar] [CrossRef]
- Chapel, S.; Rouvière, F.; Heinisch, S. Pushing the limits of resolving power and analysis time in on-line comprehensive hydrophilic interaction × reversed phase liquid chromatography for the analysis of complex peptide samples. J. Chromatogr. A 2019. [Google Scholar] [CrossRef]
- Sommella, E.; Salviati, E.; Merciai, F.; Manfra, M.; Bertamino, A.; Gasparrini, F.; Novellino, E.; Campiglia, P. Online comprehensive hydrophilic interaction chromatography × reversed phase liquid chromatography coupled to mass spectrometry for in depth peptidomic profile of microalgae gastro-Intestinal digests. J. Pharm. Biomed. Anal. 2019, 175, 112783. [Google Scholar] [CrossRef] [PubMed]
- Sommella, E.; Conte, G.M.; Salviati, E.; Pepe, G.; Bertamino, A.; Ostacolo, C.; Sansone, F.; Del Prete, F.; Aquino, R.P.; Campiglia, P. Fast profiling of natural pigments in different Spirulina (Arthrospira platensis) dietary supplements by DI-FT-ICR and evaluation of their antioxidant potential by pre-column DPPH-UHPLC assay. Molecules 2018, 23, 1152. [Google Scholar] [CrossRef] [PubMed]
- Pepe, G.; Sommella, E.; Ventre, G.; Scala, M.C.; Adesso, S.; Ostacolo, C.; Marzocco, S.; Novellino, E.; Campiglia, P. Antioxidant peptides released from gastrointestinal digestion of “Stracchino” soft cheese: Characterization, in vitro intestinal protection and bioavailability. J. Func. Foods 2016, 26, 494–505. [Google Scholar] [CrossRef]
- Carrizzo, A.; Conte, G.M.; Sommella, E.; Damato, A.; Ambrosio, M.; Sala, M.; Scala, M.C.; Aquino, R.P.; De Lucia, M.; Madonna, M.; et al. Novel potent decameric peptide of Spirulina platensis reduces blood pressure levels through a PI3K/AKT/eNOS-Dependent mechanism. Hypertension 2019, 73, 449–457. [Google Scholar] [CrossRef]
- Donato, P.; Cacciola, F.; Mondello, L.; Dugo, P. Comprehensive chromatographic separations in proteomics. J. Chromatogr. A 2011, 1218, 8777–8790. [Google Scholar] [CrossRef]
- Stoll, D.R.; Lhotka, H.R.; Harmes, D.C.; Madigan, B.; Hsiao, J.J.; Staples, G.O. High resolution two-Dimensional liquid chromatography coupled with mass spectrometry for robust and sensitive characterization of therapeutic antibodies at the peptide level. J. Chromatogr. B 2019, 121832, 1134–1135. [Google Scholar] [CrossRef]
- Sommella, E.; Pagano, F.; Salviati, E.; Chieppa, M.; Bertamino, A.; Manfra, M.; Sala, M.; Novellino, E.; Campiglia, P. Chemical profiling of bioactive constituents in hop cones and pellets extracts by online comprehensive two-dimensional liquid chromatography with tandem mass spectrometry and direct infusion Fourier transform ion cyclotron resonance mass spectrometry. J. Sep. Sci. 2018, 41, 1548–1557. [Google Scholar] [CrossRef]
- Filgueira, M.R.; Huang, Y.; Witt, K.; Castells, C.; Carr, P.W. Improving peak capacity in fast on line comprehensive two-dimensional liquid chromatography with post first dimension flow splitting. Anal. Chem. 2011, 83, 9531–9539. [Google Scholar] [CrossRef]
- Camenzuli, M.; Schoenmakers, P.J. A new measure of orthogonality for multidimensional chromatography. Anal. Chim. Acta 2014, 838, 93–101. [Google Scholar] [CrossRef]
- Mihailova, A.; Malerød, H.; Wilson, S.R.; Karaszewski, B.; Hauser, R.; Lundanes, E.; Greibrokk, T. Improving the resolution of neuropeptides in rat brain with on-line HILIC-RP compared to on-Line SCX-RP. J. Sep. Sci. 2008, 31, 459–467. [Google Scholar] [CrossRef]
- Di Palma, S.; Mohammed, S.; Heck, A.J.R. ZIC-cHILIC as a fractionation method for sensitive and powerful shotgun proteomics. Nat. Protoc. 2012, 7, 2041–2055. [Google Scholar] [CrossRef] [PubMed]
© 2020 by the authors. Licensee MDPI, Basel, Switzerland. This article is an open access article distributed under the terms and conditions of the Creative Commons Attribution (CC BY) license (http://creativecommons.org/licenses/by/4.0/).

