Abstract
The performance of a vibratory shear-enhanced process (VSEP) combined with an appropriate membrane unit for the treatment of simulated or industrial tannery wastewaters was investigated. The fundamental operational and pollution parameters were evaluated, i.e., the membrane type, the applied vibration amplitude, as well as the removal rates (%) of tannins, chemical oxygen demand (COD), Ntotal, turbidity and color. Regarding the system’s treatment efficiency, specific emphasis was given towards the removal of organics (expressed as COD values), suspended solids (SS), conductivity (as an index of dissolved solids’ presence) and total nitrogen. The removal of organic matter in terms of COD exceeded 75% for all the examined cases. The quality of treated wastewater was affected not only by the membrane specific type (i.e., the respective pore diameters), but also by the applied vibration amplitude. Furthermore, an average 50% removal rate, regarding the aforementioned parameters, was observed both for the simulated and the industrial tannery wastewaters during the microfiltration (MF) experiments. That removal rate was further increased up to 85%, when ultrafiltration (UF) was applied, and up to 99% during the Reverse Osmosis (RO) experiments, considering the maximum applied vibration amplitude (31.75 mm).
1. Introduction
The leather tanning industry is a globalized industry and the European Union (EU) tanners are highly dependent on access to raw materials and export markets. The EU tanning industry is still the world’s largest leather supplier in the international market. This is despite the shrinkage of the EU share in the relevant world markets, due to the development of the leather industry in other regions of the world, such as Turkey, China, India, Pakistan, Brazil and Ethiopia [1]. Tanning is an important process for transforming rawhides into several leather goods, which are used daily by the consumers. The process of turning hides into leather can be divided into four subsequent treatment phases, i.e., beamhouse operation, tanyard process, retanning and finishing [2]. Nevertheless, for each end-product (e.g., shoes, jackets, bags, couches, chairs etc.), the relevant tanning process is rather specific and the kind and amount of the respectively produced wastes may vary significantly. However, an average amount of wastewater in the range of 30–35 m3 is usually produced per ton of raw processed material, noting that acids, alkalis, chromium salts, tannins, solvents, sulfides, dyes, auxiliaries and many other chemical compounds, which are used during the processing of leathers, are not completely used/removed with the treated items and, therefore, remain in the produced effluents.
The characteristics of tannery wastewaters can differ significantly among various tannery units, depending on the size/capacity of the specific industry (usually small- and medium-sized enterprises, SMEs), as well as on the applied chemicals, the amount of water used and the type of final product. The presence of several substances can increase substantially the values of fundamental pollution parameters, such as chemical oxygen demand (COD) (average concentration 6,200 mg/L), TDS (average total dissolved solids concentration 87,000 mg/L) etc. [3]. The high COD and SS (suspended solids) loadings in these wastewaters can pose an important economic problem for tanneries, since these parameters have been extensively used by most water/wastewater companies as major indices for the effluent quality, and thus, they are frequently controlled [4].
Therefore, specific consideration should be addressed to re-evaluate the physico-chemical and bacteriological quality of tannery effluents prior to their disposal in the aqueous environment. Various processes have been commonly implemented to treat wastewater from tannery industries, such as biological [3,5,6,7,8,9], oxidation [10,11,12], chemical processes including coagulation/flocculation [13,14] etc. Additionally, membrane technologies, such as ultrafiltration (UF) and reverse osmosis (RO), can be effectively combined with the conventional tannery wastewater treatment processes to improve their efficiencies. However, the use of membranes for this application was rather limited, at least until few years ago, due to the relatively higher cost of associated capital equipment and consumables. Nevertheless, there has recently been a significant reduction in the cost of membrane systems, which is probably due to the development of more efficient manufacturing processes and the increased competition in the respective market, making the use of membranes for industrial wastewater treatment processes more attractive.
Relevant experiments have been conducted since the late 1950s, which included mostly membranes of natural origin. Following nearly 60 years of rapid advancement, today the membrane-based processes are already implemented in numerous industrial applications, presenting substantial benefits. Cassano et al. [15] described the use of nanofiltration (NF) in order to improve chromium recovery from spent chromium tanning baths and RO to desalinate the water discharged from filter presses after Cr(III) precipitation. The quality of produced RO permeate was satisfactory, for being re-used in washing operations. Suthanthararajan et al. [16] studied a pilot-scale membrane system (with capacity 1 m3/h), which comprised NF and RO membrane units and several pre-treatment operations. When using the RO membrane, the maximum TDS removal rate was more than 98% and the permeate recovery rate was about 78%. This permeate was shown to have very low TDS concentration and may be reused for the wet finishing process in tanneries. Mendoza-Roca et al. [17] studied the reuse of UF permeate on the quality of final leather, as well as the comparison among different types of membrane cleaning procedures. The results showed that the final quality of the skin was not affected by the use of UF permeate for the unhearing process.
Bhattacharya et al. [18] studied the treatment of high-strength tannery wastewater (COD 5,680 mg/L and BOD 759 mg/L) by using ceramic microfiltration (MF) membranes. This study proposed a two-step treatment unit, which involved MF followed by RO. The treated water was appropriate for reuse in the tanning process, as the values of organic parameters in the effluent were found below the respective control concentrations. Kaplan et al. [19] investigated the treatment of highly polluted tannery wastewater by using three different ceramic MF and UF membrane modules in a cross-flow lab-scale unit. The wastewater samples were received from a tannery outflow in the industrial area of Isparta (Turkey). During these experiments the permeate flow was reduced, although the cake layer on the surface of membrane was appropriately removed by the application of chemical cleaning procedures. Despite the fouling issues, the membranes were able to achieve 95% color removal, while COD removal rate ranged between 58% and 90% for all the applied pressures. Rambabu and Velu [20] investigated the treatment of tannery wastewater by using modified poly-ether-sulfone (PES) membranes. The permeability was significantly increased after the use of modified membranes, although the removal rates of BOD5, COD, TDS, chlorides, sulfates, oils and fats ranged in rather moderate levels.
The vibratory shear-enhanced process (VSEP) is a membrane-separation technology, which was invented in 1987 and patented in 1989. VSEP applies vibration to a membrane in order to increase the separation efficiency and reduce membrane fouling. The application of high shear stresses on the membrane surface results in the removal of the greater part of solids and foulants, i.e., of the substances which are primarily responsible for membrane fouling. It has to be noted also that depending on the applied pressure and the filtration rate, the thickness of cake layer formation can vary. Membranes with different pore diameters/operations (i.e., MF, UF, NF and RO) have been considered for application in the VSEP system. The plate-and-frame configuration, which is the simplest module for packing flat sheet membranes, is typically used in most setups [21]. VSEP filtration has been previously applied in several cases, such as for the treatment of landfill leachates [22], the removal of humic acids in the presence of inorganic particles (clays) from synthetic aqueous dispersions, the treatment of simulated/contaminated surface waters [23], the purification of pulp and mill paper re-circulation water, the treatment of yeast dispersions and bovine albumin solutions, the process of dairy waters and the separation of casein micelles from skimmed milk [24,25,26,27].
The objective of the present study was to evaluate and compare the performance of a VSEP lab-scale unit, when using different membrane types (MF, UF and RO), in terms of major contaminants removal during the treatment of simulated or industrial tannery wastewaters.
2. Materials and Methods
2.1. Simulated Tannery Wastewater
The synthetic tannery wastewater (COD 2,000 mg/L) was prepared by dissolving 1.5 g/L tannic acid, 7.0 g/L sodium chlorate, 8.0 g/L sodium sulfate, 2.0 g/L ammonium chloride and 0.1 g/L sodium dodecyl sulfate (SDS) in the tap water of Thessaloniki city (Greece) [28]. These reagents (obtained from Panreac Chemical Company, Barcelona, Spain) were stirred by means of a mechanical agitator for 1 h in a feed tank, made from high-density poly-ethylene (PE). Real tannery wastewaters were received from a nearby medium-sized industrial plant, located at the major industrial area of Sindos (Thessaloniki, Greece).
2.2. Membrane Types
Nine different membranes were evaluated in this study, i.e., three MF membranes (made of Teflon), four UF membranes (made of regenerated cellulose) and two RO membranes (made of polyamide/polyester).The membranes used were flat-disks with an effective membrane area of about 0.05 m2. For the membrane support a polycarbonate track-etched drainage cloth, made of polypropylene, was also applied. The specific membrane characteristics, as provided by the manufacturing company, are summarized in Table 1. Prior to each experiment, the pure water flux (PWF) was determined for all these membranes in order to evaluate and compare better the performance of each membrane; the experimentally determined values were found to be consistent with the reported values from the manufacturing company.

Table 1.
Major physico-chemical properties of the nine membranes examined in the present study, as indicated by the manufacturer of the vibratory shear-enhanced process (VSEP) treatment system (New Logic International, Concord, USA).
2.3. Analytical Methods
The permeate flow rate was recorded at certain time intervals during each experiment with a calibrated volumetric cylinder and a timer. Moreover, a thermocouple was used into the feed tank in order to monitor the temperature throughout the experiments. The concentration of humic substances (used as common representative of natural organic matter, NOM) in the samples was estimated with a Shimadzu spectrophotometer (Shimadzu Instruments, MD, USA) after measuring the ultraviolet (UV) absorbance at 254 nm. Moreover, the removal of tannins, NOM and aromatic compounds was estimated from the reduction of UV absorbance measurements at 700, 254 and 220 and 275 nm, respectively. All samples were measured at natural pH value, i.e., without adjustment, after the addition of the respective sample into a quartz cell and the comparison with another cell, which contained deionized water and was used as a reference.
The color was measured at the wavelength of 455 nm, according to the Standard Methods for the Examination of Water and Wastewater (APHA) (1992), which were also applied for the determination of COD, Ntotal, NO3− and NH4+ [29]. Color was measured with a HACH spectrophotometer at 455 nm, according to the respective APHA guideline (Method No. 2120C), and was reported as platinum–cobalt (PtCo) units, i.e., the color produced by 1 mg Platinum/L in the form of chloro-platinate complex ion. The pH values of feed and permeate were measured with a pH meter (Jenway, model 3540, Essex, UK). The suspended solids concentration was evaluated by using a Hachturbidimeter (Hach), while the total organic compounds were measured by a total organic carbon (TOC) analyzer (Shimadzu, MD, USA).
The removal efficiency of a specific component (pollutant) by any membrane is defined as:
where R is the removal efficiency of the membrane for a given pollutant at a defined hydrostatic pressure and feed concentration, whereas Cp and Co are the concentrations of the rejected components in the permeate and in the feed, respectively.
2.4. Vibratory Shear-Enhanced Process (VSEP) Module
The VSEP membrane filtration module (Figure 1) was a relatively small pilot-scale module, manufactured by New Logic International (USA), and its characteristics and operation has been previously described in detail [23]. The module consisted of an annular membrane (2) with an area of 503 cm2, in a circular housing (1), placed at the top of a vertical shaft (3), acting as a torsion spring. This shaft amplifies the vibrations, which are generated at the bottom plate by an eccentric drive motor (4). The membrane oscillated azimuthally in its own plane with the examined amplitudes being 0, 6.35, 12.7, 19.05, 25.4 and 31.75 mm. The shear stress, which is created on the surface of membrane, is produced by the inertia of the fluid, as in the case of Stokes layer near an oscillating plate [24,25,26].
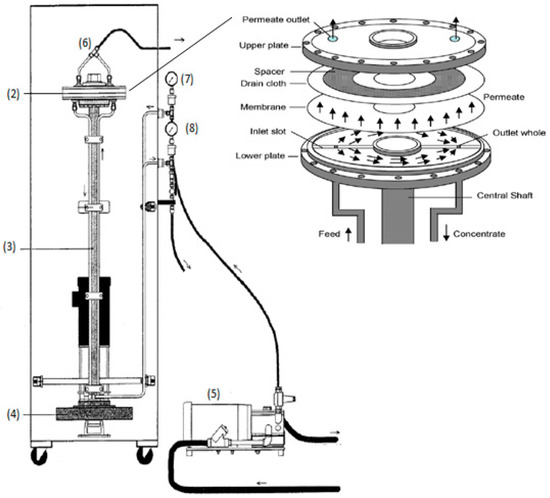
Figure 1.
VSEP module: (1) circular housing, (2) annular membrane, (3) vertical shaft, (4) eccentric drive motor, (5) volumetric diaphragm pump, (6) top of the housing, (7) flow limiter, (8) control valve.
The VSEP module was fed by a volumetric diaphragm pump (5) from a stirred tank, containing the test feed/tannery wastewater in this case. Permeate was received from a valve at the top of the housing (6) and collected into a beaker at atmospheric pressure. The concentrated slurry was returned through the “process out” line, as shown in Figure 1. The return flow passed through the flow limiter (7) and the control valve (8), which allowed the fine adjustment of outlet pressure. Inlet and outlet pressures were measured by Validyne analog gauges in order to determine the trans-membrane pressure (TMP).
3. Results and Discussion
3.1. Microfiltration (MF) Experiments
During the MF experiments, three membranes (made of teflon) were tested with average pore diameters 0.1, 0.45 and 1.0 μm. The TMP was kept constant at around 5 bars (as recommended by the manufacturer), while the vibration amplitude varied from 6.35 to 31.75 mm.
Filtration is characterized as “dead-end”, when the flow is applied perpendicular to the membrane surface. Particles that are smaller than the effective membrane pore size can pass through the membrane as permeate, while particles that are larger build up and result in the formation of a cake layer on the membrane surface. Filtration is characterized as “cross-flow”, when the flow is applied tangentially across the membrane surface. In this case, as the feed flows across the membrane surface, the permeate passes through the membrane, while the concentrate or retentate accumulates at the opposite side of the membrane. This tangential flow creates a shear stress on the surface of the membrane, which in turn can reduce fouling. Because the cross-flow operation is capable of removing most of the formed cake layer from the surface of membrane, the permeate flux does not decrease as fast as in the case of dead-end filtration. Cross flow filtration also offers the benefit of an increased membrane lifespan by preventing irreversible fouling.
In order to examine the influence of VSEP system on the treatment of tannery wastewater, 50 L were fed into the membrane module. Permeate was discharged, while the retentate during the first series of experiments was thrown out (i.e., using a “dead-end” operational mode). By contrast, during the second series of experiments, the retentate was re-circulated to the feed tank (i.e., using a “cross-flow” operational mode) and, therefore, led to the gradual increase of pollutants’ content with the increase of treatment (operational) time, i.e., the semi-batch operation mode was employed in the latter case. TMP was maintained constant and the permeate flow rate was recorded at regular intervals. The final tannery wastewater volume after each filtration experiments (by applying the semi-batch treatment) was equal to 0.5 L, resulting in95% of volume recovery for the case of MF. The rejection (removal) of tannins, NOM and aromatic compounds was estimated from the reduction of UV absorbance measurements at 700, 254 and 220 and 275 nm, respectively, while the rejection of particles was estimated from the respective turbidity measurements.
In all cases it was observed that the permeate flux was stabilized after about 20 min of filtration. The results of MF by using the 0.45 µm membrane after 30 min of VSEP system operation are presented in Table 2.

Table 2.
Removal (%) of major pollution parameters (total organic carbon (TOC), chemical oxygen demand (COD), Ntotal and tannins), when the microfiltration (MF) process was applied for the treatment of simulated tannery wastewaters.
Although MF is usually applied for the rejection of suspended solids, it was found that the TOC, COD, Ntotal and tannins removal rates were also quite significant in dead-end (DEP) as well as in cross-flow (CFP) operating modes (see Table 2 and Figure 2). Moreover, it was found that the higher amplitude of vibration affected positively not only the quality of the filtered wastewater, but also the feeding rate of the system (data not presented), in all the examined cases of MF membranes. Specifically, at the maximum vibration amplitude, the lower concentrations of pollutants in the produced filtrate were determined (with RTOC = 52%, RCOD = 55%, RNtotal = 42%, Rtannins = 40%). The same conclusion was reached by other investigators as well [30], who treated different wastewaters with the VSEP system, comparing two vibrational amplitudes, of which the maximum one produced the best treatment results.
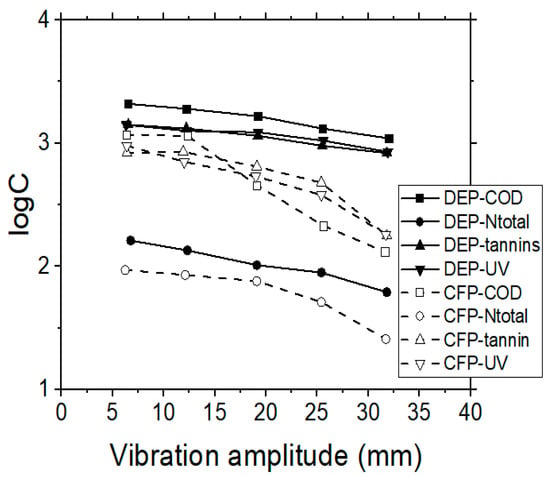
Figure 2.
Effect of vibration amplitude on COD, Ntotal, ultraviolet (UV) 254 nm and tannins concentrations, when performing MF membrane experiments, during dead-end (DEP) or cross-flow (CFP) operating modes.
In addition, more experiments were performed with wastewaters having different (initial) concentrations of pollutants, i.e., lower (7 mg/L) or higher (50 mg/L) total nitrogen content. In the experiments with the lower initial nitrogen concentration (7 mg/L), the removal by the MF membranes was 75%, while with the higher initial nitrogen concentration (50 mg/L) the removal was only 25%. Consequently, the MF is particularly advantageous for the removal of particulate matter (turbidity), while it is not so effective for the removal of soluble pollutants (e.g., Ntotal). The removal efficiency of particulate matter, when using the 0.45 µm membrane, is 20% higher than that of the 1.0 µm membrane and 20% lower than that of the 0.1 µm membrane, respectively. Microfiltration, by using the membrane with pore diameter 0.1 µm, gave the best removal results of particulate pollutants, as well as of the other studied parameters, such as turbidity, UV254nm absorption, color and tannins.
However, it is expected that as the pore diameter of the membrane decreases, the permeate flow rate is also reduced. In the present study this behavior was consequently observed, i.e., the membrane having the largest pore diameter in comparison with the membrane with the smallest pore diameter. The 0.45 µm membrane exhibited 20% lower flow rate than the 1.0 µm membrane, and the 0.1 µm presented 20% and 40% lower flow rates than the 0.45 µm and 1.0 µm membranes, respectively (Figure 3). On the contrary, it was observed that the permeate flow decreased as the operational time increased, due to the creation of a fouling layer on the membrane surface. In the particular vibrating membrane system, it was observed that the permeate flow rate was reduced for a period of about 1 h and then it was stabilized until the end of the experiment (Figure 3), i.e., the permeate flow rate was found to change over (operation) time. A power regression model, which is of the general form y = axb, was used to describe this behavior, indicated as the solid lines in Figure 3. The b factor for the three examined membranes (1.0, 0.45 and 0.1 µm as “nominal” pore diameters) was defined as −0.101, −0.120 and −0.090, respectively.
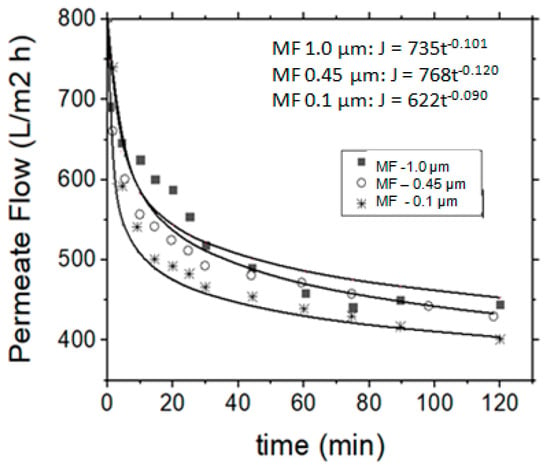
Figure 3.
Permeate flow rate variation (or flux) vs. operation time, regarding the application of MF process for the treatment of simulated tannery wastewaters.
3.2. Ultrafiltration (UF) Experiments
In this case the effectiveness of four different membranes, made from regenerated cellulose, was evaluated. The regenerated cellulose is more hydrophilic and, therefore, suitable for the separation of respective compounds, such as carbohydrates or tannins. Dissolved organics, e.g., humic acids, proteins, carbohydrates and tannins, are the most serious foulants and they are more difficult substances to remove. Hydrophilic membranes have been found less prone to fouling by organic colloids [31,32]. Preliminary experiments were initially carried out for each membrane type in order to determine the critical TMP values within the respective pressure range as recommended by the manufacturer. During the UF experiments, the TMP was raised every 10 min, until the permeate flux reached an equilibrium stage, where it became independent of TMP. This critical TMP value was selected as the operational pressure and was determined at 14 bars (Figure 4).
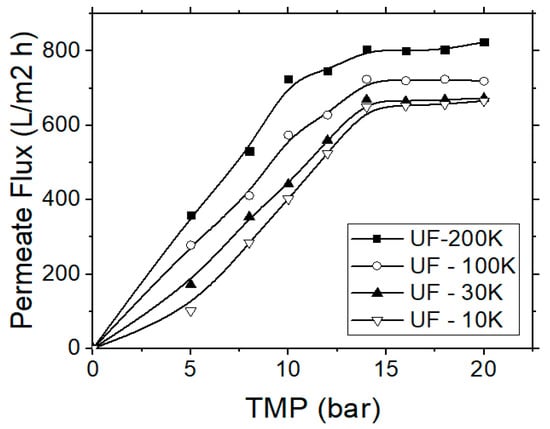
Figure 4.
Permeate flux variation vs. the applied trans-membrane pressure (TMP) for the application of the ultrafiltration (UF) process, regarding the treatment of simulated tannery wastewater.
The treatment of (simulated) tannery wastewater by using UF membranes was found to produce better results regarding the removals of organics, nitrogen, turbidity and tannins content when compared with the previous MF experiments. Figure 5 shows the (total) nitrogen removal rate for each membrane type, starting from the membrane with the largest molecular weight cut-off (MWCO) to the membrane with the smallest one (i.e., 200, 100, 30 and 10 MWCO). Nitrogen removal during the UF experiments was not found particularly high, although it surpassed the respective values of MF process, reaching 75% by applying the optimal pressure (14 bars) and the highest vibration amplitude. Zouboulis and Petala [23] observed a slight increase of humic substances removal rate when increasing the vibration amplitude (i.e., the shear rate on the membrane surface). The increase of vibration amplitude can induce higher shear stresses on the surface of membrane, which corresponds to an increase of particle–particle collisions; thus, to an increase of shear diffusion that forces the particles away from the membrane surface and back to the bulk solution. Furthermore, the reduction of concentration polarization in this case is expected also to lower the concentration of contaminants at the membrane surface and their diffusive transfer through the membrane.
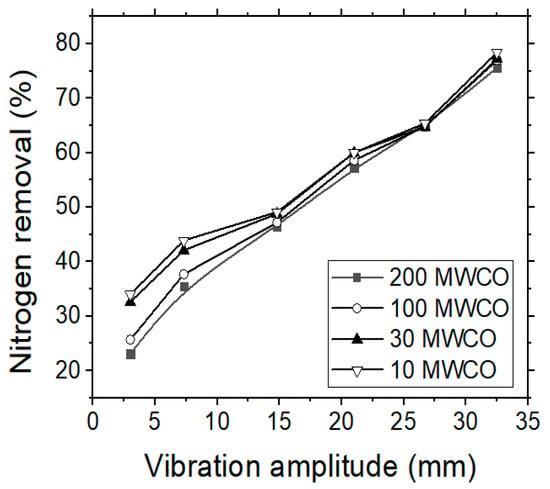
Figure 5.
VSEP treatment of simulated tannery wastewaters; the effect of vibration amplitude on the Ntotal removal (%) rate by applying four different UF membranes.
Moreover, in all these examined cases the permeate flux decreased abruptly during the initial 15 min of each experiment (Figure 6), and stabilized after 40 min of operational time, while the retentate stream was continuously re-introduced into the feed tank (following the semi-batch operational mode). The application of 30 and 10 kDa MWCO membranes during the UF experiments, showed that the 30 kDa membrane is more efficient, although the removal capacities of examined pollution parameters for both membranes were rather similar, but the 30 kDa membrane enabled higher permeate fluxes. Figure 6 depicts the variation of permeate flux with the operational time for the used four different UF membranes. The permeate flow rate, as in the case of MF, is linked to the respective time. The b factor of the aforementioned power regression model for the 200 and 100 kDa membranes is almost equal (−0.077 and −0.076) and the same was observed for the cases of 30 and 10 kDa membranes (−0.096 and −0.092).
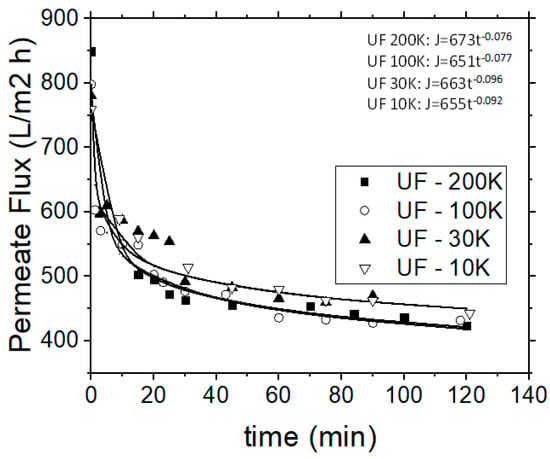
Figure 6.
Permeate flow rate variation vs. operational time for the UF process.
Considering the quality of permeate, tannins were rejected by over 85% during the UF process, when using the 200 or 30 kDa membranes, while their removal was even higher than 92% by using the 10 kDa membrane (Figure 7). Both permeate flux and permeate quality was stabilized for all the examined cases after the first 40 min of operational time. In addition, the experimental data indicate that tannins’ rejection rate was almost independent from the initial feed concentration; thus, it was considered that the retention of tannins was depended mostly on the specific MWCO membrane used, which in turn can affect the steric hindrance and the adsorption capacity, as well as the porosity of the formed cake layer near the membrane surface. It can be assumed that in these cases, the fraction of tannins which passed through the membrane was of lower molecular weight.
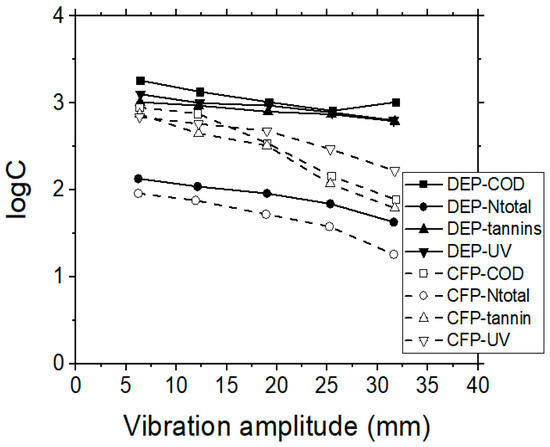
Figure 7.
VSEP treatment of simulated tannery wastewaters; the effect of vibration amplitude (mm) on COD, Ntotal, UV 254 nm and tannins residual concentrations, when performing UF membrane experiments, by applying dead-end (DEP), or cross-flow (CFP) operational modes.
3.3. Reverse Osmosis (RO) Experiments
The efficiency of RO process on tannins and organic content removal was also examined, by using a polyamide/polyester membrane. The TMP was adjusted to 20 bars after preliminary experiments, which were performed in order to determine the critical operational TMP within the respective pressure range, as recommended by the manufacturer. The flux decline was recorded every 3 min during each experiment. The permeate flux was initially influenced by the feed quality and the filtration operational time, when the system operated in the semi-batch mode (i.e., by applying the retentate re-circulation), but it reached an equilibrium stage after 20 min of operation. The results obtained by the RO membranes, with respect to vibrational amplitude and permeate flux, corresponded with the previously examined MF and UF membranes (data not shown). The removal capacities of contaminants by using the RO membranes for dead-end and cross-flow operation modes are depicted in Figure 8. In all cases, the cross-flow process shows better results, both for the quality of permeate, as well as for the hydrodynamic behavior of the examined system.
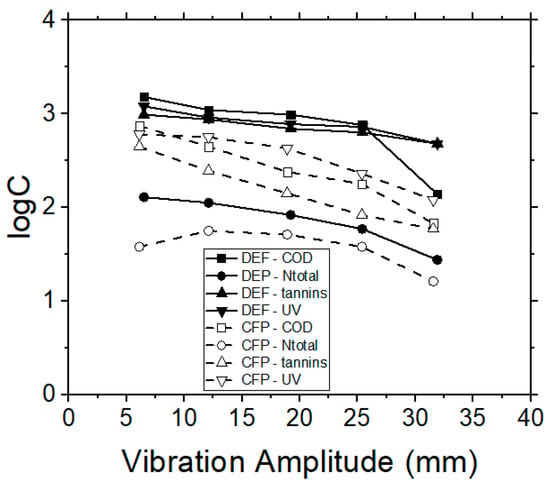
Figure 8.
VSEP treatment of simulated tannery wastewaters; effect of vibration amplitude on COD, Ntotal, UV 254 nm (NOM) and tannins concentrations, when performing RO membrane experiments, during dead-end (DEP) or cross-flow (CFP) operational modes.
3.4. Comparing the Membrane Processes by Treating Real Industrial Tannery Wastewater
Relevant membrane filtration experiments were subsequently conducted, by using real industrial tannery wastewater in dead-end and cross-flow operation modes and by applying 3 membrane processes (MF, UF and RO). During the dead-end flow mode the raw water feed passes directly through the membrane, in contrast to the cross-flow filtration mode, which employs a high velocity of the raw water feed, flowing in parallel over (and across) the membrane surface. The TMP was kept constant and the permeate flow rate was recorded at regular time intervals. Vibration amplitude was set to 0.025 mm, according to preliminary experiments. The permeate fluxes were stabilized after a certain period of time and the system reached equilibrium conditions after approximately 50 min of filtration time in dead-end mode and after 60 min in cross-flow modes (Figure 9). This was attributed to the capability of the VSEP unit to develop high shear stresses on the membrane surface due to vibration.
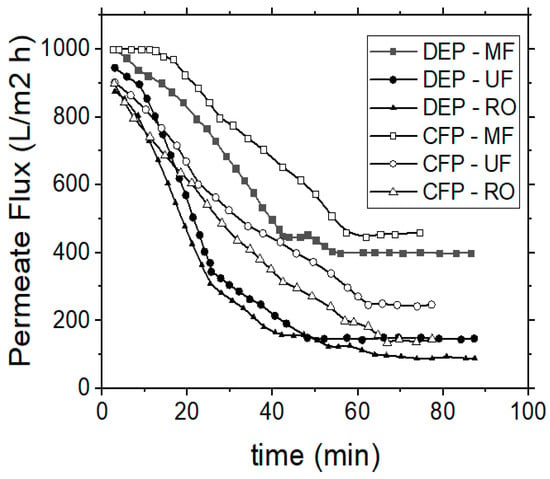
Figure 9.
Treatment of real industrial tannery wastewaters; permeate flux variation vs. operational time during dead-end (DEP) or cross-flow (CFP) operation modes.
Regarding the results obtained (quantitative removal of major pollution parameters) by the VSEP treatment system, they can be considered as satisfactory (Table 3), considering that they were obtained by applying a single (one-step) direct treatment process. In combination with appropriate pre- or post-treatment techniques (biological or physico-chemical, according to the relevant literature) further improvement of these results can be expected.

Table 3.
Characteristics of real industrial tannery wastewater before and after the application of the VSEP treatment process.
3.5. Theoretical Considerations and Calculation of Mass Transfer Coefficient
Initially, the effect of vibration amplitude on the permeate flow rate was examined without the recirculation of concentrate. Thus, according to Equations (2) and (3) [24,25,26], the average and maximum shear rate was determined (Table 4):
where d is the peak to peak vibration amplitude at the periphery of the membrane (m), F is the vibration frequency (Hz) and ν is the kinematic viscosity of the fluid (m2 s−1).

Table 4.
Average and maximum shear rate of the studied VSEP system.
The average and maximum shear rates are proportional, depending on the amplitude of the membranes’ vibration (Figure 10), whereas the permeate flow rate increases exponentially and in relation to the vibration amplitude and to the average shear rate. The relationship between the permeate flow rate with the vibrational amplitude and the shear rate was also determined, according to Equations (4) and (5), and the results obtained were found to be consistent with the relevant published research studies [24,25,26,33].
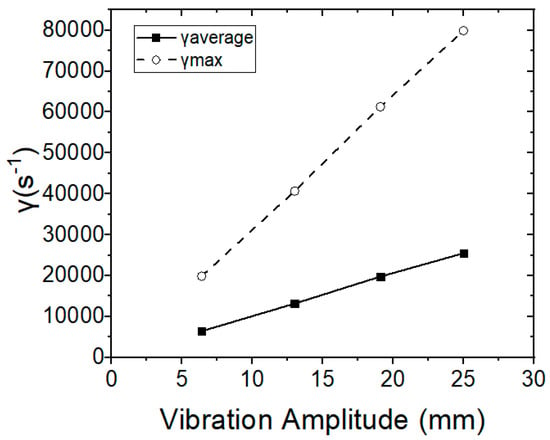
Figure 10.
Average and maximum shear rates in relation to vibration amplitude.
The mass transfer coefficient was subsequently determined in the synthetic and industrial tannery wastewaters by using the 10K UF membrane. The mass balance concept in the membrane filtration processes can be described with the following equation:
where Cp is the concentration of solute in the permeate, Cm is the concentration of solute on the membrane surface, Cb is the concentration of solute in the bulk, Jv is the volumetric flux of pure water and k is the mass transfer coefficient.
The rejection characteristics of membranes are further discussed, by using the observed rejection rate (Robs.), as well as the real rejection rate (Rreal), according to Equations (7) and (8) [34]:
By using these equations, Equation (6) can be rewritten as:
In this Equation (9) a reasonable value for α can be set and then a linear relationship between and can be obtained. Rreal can be obtained by extrapolating the linear plots of vs. and then, k is obtained from the following equation:
From the slope of the straight line connecting the average shear rate and the term, the mass transfer coefficient can be subsequently determined. For the experiments using synthetic tannery wastewater the mass transfer coefficient was found to be 1.7 × 10⁻³.
3.6. Finding the Main Membrane Fouling Mechanism
The mathematical modeling of flux decline during membrane filtration can provide a better understanding of membrane fouling, as well as contribute to appropriate predictive tools for the successful scale-up or scale-down of filtration systems. The main empirical models, which are used in order to explain the permeate flux behavior and to determine the involved (main) fouling mechanisms are the Hermia models [35]. Hermia developed four empirical models which include four major types of fouling, i.e., (i) the complete pore blocking, (ii) the intermediate blocking, (iii) the standard blocking, and (iv) the cake layer formation. The parameters of these models represent a physical meaning and correspond to the respective fouling mechanism(s) [36]. Hermia’s models were originally developed for the dead-end filtration operational mode and were based on the constant pressure filtration laws. However, despite the different sets of applied mass and momentum equations for dead-end and cross-flow filtration operation models, several researchers have applied Hermia’s models to describe also the cross-flow filtration operational mode.
Hermia’s model is expressed by the following general differential Equation (11):
Noting that V is the accumulated permeate volume (m3), t is the filtration time (s) and K and n are the phenomenological coefficient and the general index, respectively, both depending on the type of fouling (K is a unit dependent on the parameter n in Equation (11)). In the following sections the aforementioned models will be shortly presented.
3.6.1. Complete Pore Blocking Model (n = 2)
When the particles to be separated are larger than the membrane’s pore size, then there is a pore blockage, due to pore obstruction and sealing. Hermia concluded that in this case the parameter n is equal to 2. For n = 2, Equation (11) is expressed in terms of permeate flux vs. time, according to the following equation [37]:
Noting that Jp is the permeate flux (L/m2h), J0 is the initial permeate flux (L/m2h) and Kc (m−1) is the equation constant.
The parameter Kc can be described as a function of blocked membrane surface, per unit of total permeate volume KA, and as a function of the initial permeate flux J0, as shown in Equation (13) [38]. As a result, the active membrane area is reduced; due to the pores being completely blocked [39].
3.6.2. Standard Blocking Model (n = 3/2)
When the solute’s molecular size is smaller than the membrane pore size, then the pore blocking possibly occurs inside the pores [40]. This model considers that the separated particles can be either adsorbed or deposited on the walls of the membrane’s pores. Therefore, the available (free) volume of membrane pores decreases proportionally to the permeate volume, which passes through the membrane. As a result, the cross sectional area of the membrane pore decreases with time, and consequently the membrane resistance increases [39]. It is considered that the pores’ lengths and diameters are relatively constant along the entire membrane surface. Considering these hypotheses, Hermia [35] concluded that the parameter n is equal to 3/2 in this case. Considering the respective blocking (fouling) mechanism, the permeate flux can be expressed as a function of time, according to Equation (14):
The parameter Ks can be calculated, according to Equation (15):
Noting that KB is a parameter that represents the decrease of cross-sectional area of membrane pores per unit of total permeate volume (s−1), J0 is the initial permeate flux (L/m2h), A is the membrane surface (m2) and A0 is the membrane porous surface (m2).
3.6.3. Intermediate Blocking Model (n = 1)
When the size of particles is similar to the membrane’s pore size, the intermediate blocking mechanism may take place. As in the case of complete pore blocking model, this model considers that solid particles (or even macromolecules) that at any time reach an open pore, might block it. Nevertheless, a dynamic situation of the blocking/unblocking state may also occur. Also, the particles may bridge a pore by blocking the opening, but not completely seal it [39]. Considering these hypotheses, Hermia [35] concluded that the parameter n in this case is equal to 1. Other researchers [40] expressed the permeate flux as a function of time, resulting in Equation (16):
Noting that Jp is the permeate flux (L/m2h) and J0 is the initial permeate flux (L/m2h), the parameter Ki (m−1) can be expressed as a function of blocked membrane surface per unit of total permeate volume, i.e., as KA (Equation (17)). The area of membrane surface that is not blocked diminishes with time [41]. As a result, the probability of a molecule blocking/fouling a membrane pore is continuously decreasing with time.
3.6.4. Cake Layer Formation Model (n = 0)
As in the case of pore blocking model, in this case the solute molecules are larger than the membrane pore size, and they cannot penetrate through them [41]. In this model, a cake layer is formed on the surface. Nevertheless, when the concentration of solute molecules is considerable, they can be deposited on the surface or on the previously deposited layers, resulting in the formation of multiple layers. For the cake layer formation model, the permeate flux is given as a function of time by the (linearized) Equation (18):
The parameter Kgl can be defined, according to Equation (19):
Noting that KD represents the cake layer area per unit of total permeate volume (1/m3), Rg is the cake layer resistance (m−1) and Rm is the hydraulic membrane resistance (m−1).
3.6.5. Application of Hermia’s Model for the Indication of Major Fouling Mechanism, When Treating Simulated or Real Industrial Tannery Wastewater by the VSEP System
Figure 11 illustrates the results obtained after processing the experimental data for the synthetic, as well as for the real industrial tannery wastewater. The slope of the straight line in the case of synthetic and of industrial tannery wastewater was 0.88 and 0.68, respectively. Therefore, the intermediate blocking model describes the results of the present research better in comparison with the other models.

Figure 11.
Presentation of the experimental data following the Hermia’s model in order to find the (major) mechanism of membrane fouling during the application of VSEP for the treatment of simulated or real industrial wastewater.
4. Conclusions
The aim of the present study was the treatment of simulated and industrial tannery wastewater by using a vibratory shear-enhanced process (VSEP) system. A variety of parameters affecting the rejection efficiency of pollutants were studied, such as the specific membrane separation process (MF, UF, RO), the different membrane type for each case, and the applied vibration amplitude. The main conclusions of the study are the following:
- As the vibration amplitude increased, the respective fouling phenomena were restricted.
- The system’s hydrodynamic behavior was satisfying, because the permeate flux remained almost constant, even during the cross-flow filtration mode, and even when the feed stream contained progressively higher concentrations of contaminants, due to the recirculation of retentate in the feed tank.
- A higher rejection rate was observed during the UF process, by using the 10 K membrane, as well as during the RO process.
- The rejection of components/pollutants increased with the increase of vibration amplitude, due to the enhancement of shear diffusion.
- The organic matter removal in terms of COD values exceeded 75% for all the examined cases. Furthermore, UF membranes had similar COD removal rates (about 80%–87%), while the MF membrane retained 65% COD and the RO was even more efficient (reaching up to 96% COD removal).
- Although the operation of VSEP and the application of higher TMPs during the MF and UF processes enhanced the membrane-fouling mitigation, the operation of the treatment system was still satisfactory.
- The theoretical calculations showed that the most likely fouling mechanism is the intermediate blocking, according to Hermia’s classification system.
Author Contributions
Conceptualization, A.I.Z. and E.N.P.; methodology, A.N. and A.I.Z.; validation, A.I.Z., E.N.P. and A.N.; formal analysis, E.N.P. and A.N.; investigation, A.I.Z., E.N.P. and A.N.; data curation, A.N.; writing—original draft preparation, E.N.P. and A.N.; writing—review and editing, A.I.Z. and E.N.P.; visualization, E.N.P.; supervision, A.I.Z.
Funding
This research received no external funding.
Acknowledgments
Thanks are due to the Central Tannery Wastewaters Treatment facility in the industrial area at Sindos Thessaloniki (Greece) and especially to N. Apostolidis, P. Karamanolis (Chemical Engineers), D. Liantas and P. Sidiropoulos (technicians) for their valuable help.
Conflicts of Interest
The authors declare no conflict of interest.
Abbreviations
| A | Membrane surface (m2) |
| A0 | Membrane porous surface (m2) |
| Cb | Concentration of the solute in the bulk |
| Cm | Concentration of the solute at the membrane surface |
| Co | Concentration of rejected components in the feed |
| Cp | Concentration of rejected components in the permeate |
| d | Peak to peak vibration amplitude at the periphery of membrane (m) |
| F | Vibration frequency (Hz) |
| J | Permeate flow rate (L/m2h) |
| J0 | Initial permeate flux (L/m2h) |
| Jv | Pure water flux (L/m2h) |
| k | Mass transfer coefficient |
| K | Phenomenological coefficient |
| KA | Parameter that represents the blocked membrane surface per unit of the total permeate volume (m−1) |
| KB | Parameter that represents the decrease in the cross-sectional area of the membrane pores per unit of the total permeate volume (s−1) |
| Kc | Constant that corresponds to the complete pore blocking model (m−1) |
| KD | Parameter that represents the cake layer area per unit of the total permeate volume (m−3) |
| Kgl | Constant that corresponds to the cake layer formation model (s/m6) |
| Ki | Constant that corresponds to the intermediate blocking model (m−1) |
| Ks | Constant that corresponds to the standard blocking model (s−3) |
| n | General index depending on type of fouling |
| t | Filtration time (min) |
| R | Percentage removal efficiency of the membrane for a given pollutant at a defined hydrostatic pressure and feed solution concentration (%) |
| Robs | Observed rejection (%) |
| Rreal | Real rejection (%) |
| R2 | Outer radius of annular membrane (cm) |
| R1 | Inner radius of annular membrane (cm) |
| Rg | Cake layer resistance (m−1) |
| Rm | Hydraulic membrane resistance (m−1) |
| u | Water flow velocity inside the fiber (m s−1) |
| V | Accumulated permeate volume (L) |
| Maximum shear rate (s−1) | |
| γ | Average shear rate (s−1) |
| ν | Kinematic viscosity of the fluid (m2 s−1) |
References
- Orhon, D.; AtesGenceli, E.; Cokgor, E.U. Characterization and modeling of activated sludge for tannery wastewater. Water Environ. Res. 1999, 71, 50–63. [Google Scholar] [CrossRef]
- Lofrano, G.; Meriç, S.; Zengin, G.E.; Orhon, D. Chemical and biological treatment technologies for leather tannery chemicals and wastewaters: A review. Sci. Total Environ. 2013, 461–462, 265–281. [Google Scholar] [CrossRef] [PubMed]
- Durai, G.; Rajasimman, B. Biological treatment of tannery wastewater—A review. J. Environ. Sci. Technol. 2011, 4, 1–17. [Google Scholar] [CrossRef]
- Song, Z.; Williams, C.J.; Edyvean, R.G.J. Characteristics of the tannery wastewater. In Proceedings of the Icheme Research Event, Newcastle, UK, 7–8 April 1998. [Google Scholar]
- Sabumon, P.C. Perspectives on Biological Treatment of Tannery Effluent. Adv. Recycl. Waste Manag. 2016. [Google Scholar] [CrossRef]
- Ahn, D.H.; Chung, Y.C.; Yoo, Y.J.; Pak, D.W.; Chang, W.S. Improved treatment of tannery wastewater using zoogloea ranigera and its extracellular polymer in an activated sludge process. Biotechnol. Lett. 1996, 18, 917–922. [Google Scholar] [CrossRef]
- Wiemann, M.; Schenk, H.; Hegemann, W. Anaerobic treatment of tannery wastewater with simultaneous sulphide elimination. Water Res. 1998, 32, 774–780. [Google Scholar] [CrossRef]
- Farabegoli, G.; Carucci, A.; Majone, M.; Rolle, E. Biological treatment of tannery wastewater in the presence of chromium. J. Environ. Manag. 2004, 71, 345–349. [Google Scholar] [CrossRef]
- Haydar, S.; Aziz, J.A.; Ahmad, M.S. Biological Treatment of Tannery Wastewater Using Activated Sludge Process. Pak. J. Eng. Appl. Sci. 2009, 1, 61–66. [Google Scholar]
- Sivagami, K.; Sakthivel, K.P.; Nambi, I.M. Advanced oxidation processes for the treatment of tannery wastewater. J. Environ. Chem. Eng. 2017. [Google Scholar] [CrossRef]
- Schrank, S.G.; Jos, H.J.M.; Moreira, R.F.P.; Schroder, H.F. Fentons oxidation of various—based tanning materials. Desalination 2003, 50, 411–423. [Google Scholar]
- Dogruel, S.; Ates, G.E.; Germirli, B.F.; Orhon, D. Ozonation of nonbiodegradable organics in tannery wastewater. J. Environ. Sci. Health 2004, 39, 1705–1715. [Google Scholar] [CrossRef]
- Shegani, G. Treatment of Tannery Effluents by the Process of Coagulation. Int. J. Environ. Chem. Ecol. Geol. Geophys. Eng. 2014, 8, 240–244. [Google Scholar]
- Chowdhury, M.; Mostafa, M.G.; Biswas, T.K.; Saha, A.K. Treatment of leather industrial effluents by filtration and coagulation processes. Water Resour. Ind. 2013, 3, 11–22. [Google Scholar] [CrossRef]
- Cassano, A.; Criscuoli, A.; Drioli, E.; Molinari, R. Clean operations in the tanning industry: Aqueous degreasing coupled to ultrafiltration. Clean Prod. Process. 1999, 1, 257–263. [Google Scholar] [CrossRef]
- Suthanthararajan, R.; Chitra, K.; Ravindranath, E.; Umamaheswari, B.; Rajamani, S.; Ramesh, T. Anaerobic Treatment of Tannery Wastewater with Sulfide Removal and Recovery of Sulfur from Wastewater and Biogas. J. Am. Leather Chem. As. 2004, 99, 67–72. [Google Scholar]
- Mendoza-Roca, J.A.; Galiana-Aleixandre, M.V.; Lora-Garcia, J.; Bes-Pia, A. Purification of tannery effluents by ultrafiltration in view of permeate reuse. Sep. Purif. Technol. 2010, 70, 296–301. [Google Scholar] [CrossRef]
- Bhattacharya, P.; Roy, A.; Sarkar, S.; Ghosh, S.; Majumdar, S.; Chakraborty, S.; Mandal, S.; Mukhopadhyay, A.; Bandyopadhyay, A. Combination technology of ceramic microfiltration and reverse osmosis for tannery wastewater recovery. Water Resour. Ind. 2013, 3, 48–62. [Google Scholar] [CrossRef]
- Kaplan-Bekaroglu, S.S.; Gode, S. Investigation of ceramic membranes performance for tannery wastewater treatment. Desalin. Water Treat. 2016, 57, 17300–17307. [Google Scholar] [CrossRef]
- Rambabu, K.; Velu, S. Modified polyethersulfone ultrafiltration membrane for the treatment of tannery wastewater. Int. J. Environ. Studies 2016, 73, 819–826. [Google Scholar] [CrossRef]
- Hasan, K.S.; Visvanathan, C.; Ariyamethee, P.; Chantaraaumporn, S.; Moongkhumklang, P. Vibratory shear enhanced membrane process and its application in starch wastewater recycle. Songklanakarin J. Sci. Technol. 2002, 24, 899–906. [Google Scholar]
- Zouboulis, A.I.; Petala, M.D. Performance of VSEP vibratory membrane filtration system during the treatment of landfill leachates. Desalination 2008, 222, 165–175. [Google Scholar] [CrossRef]
- Petala, M.D.; Zouboulis, A.I. Vibratory shear enhanced processing membrane filtration applied for the removal of natural organic matter from surface waters. J. Memb. Sci. 2006, 269, 1–14. [Google Scholar] [CrossRef]
- AlAkoum, O.; Jaffrin, M.Y.; Ding, L.; Paullier, P.; Vanhoutte, C. An hydrodynamic investigation of microfiltration and ultrafiltration in a vibrating membrane module. J. Membr. Sci. 2002, 197, 37–52. [Google Scholar] [CrossRef]
- AlAkoum, O.; Ding, L.; Chotard-Ghodsnia, R.; Jaffrin, M.Y.; Gesan-Guiziou, G. Casein micelles separation from skimmed milk using a VSEP dynamic filtration module. Desalination 2002, 144, 325–330. [Google Scholar] [CrossRef]
- AlAkoum, O.; Jaffrin, M.Y.; Ding, L.H.; Frappart, M. Treatment of dairy process waters using a vibrating filtration system and NF and RO membranes. J. Membr. Sci. 2004, 235, 111–122. [Google Scholar] [CrossRef]
- Available online: www.vsep.com (accessed on 3 April 2019).
- Panniza, M.; Cerisola, G. Electrochemical oxidation as a final treatment of synthetic tannery wastewater. Environ. Sci. Technol. 2004, 38, 5470–5475. [Google Scholar] [CrossRef]
- APHA; AWWA; WPCF. Standard Methods for the Examination of Water and Waste Water, 19th ed.; American Public Health Association, American Water Works Association, Water Environment Federation: Washington, DC, USA, 1992. [Google Scholar]
- Huuhilo, T.; Vaisanen, P.; Nuortila-Jokinen, J.; Nystrom, M. Influence of shear on flux in membrane filtration of integrated pulp and paper mill circulation water. Desalination 2001, 141, 245–258. [Google Scholar] [CrossRef]
- Ulbricht, M. State-of-the-art and perspectives of organic materials for membrane preparation. In Comprehensive Membrane Science and Engineering; Drioli, E., Giorno, L., Fontananova, E., Eds.; Elsevier Science: Amsterdam, The Netherlands, 2017; pp. 85–120. [Google Scholar]
- Hilal, N.; Ogunbiyi, O.O.; Miles, N.J.; Nigmatullin, R. Methods Employed for Control of Fouling in MF and UF Membranes: A Comprehensive Review. Sep. Sci. Technol. 2005, 40, 1957–2005. [Google Scholar] [CrossRef]
- Bian, R.; Yamamoto, K.; Watanabe, Y. The effect of shear rate on controlling the concentration polarization and membrane fouling. Desalination 2000, 131, 225–236. [Google Scholar] [CrossRef]
- Akamatsu, K.; Ishizaki, K.; Yoshinaga, S.; Nakao, S.-I. Mass transfer coefficient of tubular ultrafiltration membranes under high-flux conditions. AICHE J. 2018, 64. [Google Scholar] [CrossRef]
- Hermia, J. Constant pressure blocking filtration lows: Application to power-low non-newtonian fluids. Trans. Inst. Chem. Eng. 1982, 60, 183–187. [Google Scholar]
- VincentVela, M.C.; Blanco, S.A.; Garcia, J.L.; Rodriguez, E.B. Analysis of membrane pore blocking models applied to the ultrafiltration of PEG. Sep. Purif. Technol. 2008, 62, 489–498. [Google Scholar]
- Hwang, K.J.; Liao, C.Y.; Tung, K.L. Effect of membrane pore size on the particle fouling in membrane filtration. Desalination 2008, 234, 16–23. [Google Scholar] [CrossRef]
- Lim, A.L.; Bai, R. Membrane fouling and cleaning in microfiltration of activated sludge wastewater. J. Membr. Sci. 2003, 216, 279–290. [Google Scholar] [CrossRef]
- Salahi, A.; Abbasi, M.; Mohammadi, T. Permeate flux decline during UF of oily wastewater: Experimental and modelling. Desalination 2010, 251, 153–160. [Google Scholar] [CrossRef]
- Mohammadi, T.; Kazemimoghadam, M.; Saadabadi, M. Modeling of membrane fouling and flux decline in reverse osmosis during separation of oil in water emulsions. Desalination 2003, 157, 369–375. [Google Scholar] [CrossRef]
- Hwang, K.-J.; Lin, T.-T. Effect of morphology of polymeric membrane on the performance of cross-flow microfiltration. J. Membr. Sci. 2002, 199, 41–52. [Google Scholar] [CrossRef]
© 2019 by the authors. Licensee MDPI, Basel, Switzerland. This article is an open access article distributed under the terms and conditions of the Creative Commons Attribution (CC BY) license (http://creativecommons.org/licenses/by/4.0/).