Abstract
High-alumina fly ash may potentially be a valuable source of Ga with a concentration of Ga at 80 mg/kg. Direct adsorption and enrichment of Ga from sulfuric acid leach liquor of high-alumina fly ash is developed in this study. The H-type chelating resin with two carboxy groups exhibited the best adsorption capacity for Ga. The maximum adsorption capacity for Ga was 55 mg/g resin with an adsorption time of 24 h, an initial Ga concentration of 500 mg/L, an adsorption temperature of 55 °C, and an initial acid concentration of 0.1 mol/L. The adsorption process of Ga was in good fit with the Langmuir isotherm and pseudo-second-order reaction kinetics model. The chemical adsorption rate was controlled by an internal diffusion mechanism. The resin had a high selectivity for Ga3+ with a Kd over 3600 compared with Fe2+, Al3+, K+, Ca2+, and Mg2+. The adsorption mechanism was found to be the ion exchange reaction between Ga and H of carboxy and hydroxyl groups. The concentration of Ga in sulfuric acid leach liquor from high-alumina fly ash achieved enrichment from 200 mg/L to 2 g/L. It is an attractive medium for large-scale Ga extraction from high-alumina fly ash.
1. Introduction
Gallium (Ga) is an important semiconductor raw material and is characterized by a low melting point (39 °C) and a high boiling point (3000 °C) [1]. Ga and its compounds are widely used in various fields, such as catalysis, medicine, materials, and communication [2,3,4,5]. The global demand for Ga increases at a rate of 7.4% per year, and in 2021 the production capacity of primary low-purity gallium was estimated to be 774,000 kg in the world [6,7,8]. The increasing demand for Ga promotes a search for new resources. High-alumina fly ash (HAFA), as a kind of bulk industrial solid waste, is a potential resource of aluminum and gallium [9,10]. As is reported, the content of Ga in HAFA is 80–200 mg/kg in the central part of Inner Mongolia and the northwestern part of the Shanxi Province in China, which is higher than the average grade of industrial extraction of Ga (30 mg/kg) [11,12,13,14]. Therefore, extracting valuable metals such as Al, Si, and Ga from HAFA has attracted increasing attention.
Compared with the alkali extracting method, the acid extracting method features a simpler process, less slag discharge, and diversified products and has become a hot research topic [15]. Meanwhile, the acid extraction method has shortcomings, such as corrosion of equipment, higher impurity in the acid leach liquor, etc. The dissolution rate of Ga in the fly ash by the acid method is about 80% or higher, and the concentration of it is about 10–30 mg/L [16,17,18]. Acid leach liquor has many impurity ions, such as Al3+, Fe2+, K+, and Mg2+. Thus, the leaching liquor needs to be enriched and separated before use. The main methods of enrichment of Ga from acid leach liquor are fractional precipitation [19], solvent extraction [20,21], and adsorption [22]. At present, adsorption is widely used in the alkali and acid method due to its simple process and good cyclability [23,24,25,26,27,28,29]. Massoud et al. [29] synthesized a novel polyacrylic acid-dimethyl aminoethyl ester/Fe2O3 hybridization polymer resin by ray irradiation, but its selectivity to In ion is higher than that to Ga ion in acetic acid. Due to the hydroxyl groups on the surface of Fe2O3 nanoparticles, the selectivity for In3+ in acetic acid medium with pH = 5 is higher than that for Ga3+. Xiong et al. [30] prepared a carboxyl functionalized material from rice hulls to separate Ga in acids. While under strong acidic conditions, the hydrogen ions in the solution compete with the Ga(OH)2+ and Ga(OH)2+ to form a competitive adsorption, thereby decreasing the adsorption rate of gallium. Meanwhile, the selectivity factor for Ga/Fe3+ and Ga/Al3+ is lower than 1 at pH 1~4 for the carboxyl-functionalized material. Meng et al. [31] synthesized P507 and TBP attached to the silica-based materials, and in a pH of 3.3 sulfuric acid solution, it simultaneously exhibits excellent adsorption capacity with 64.2 mg/g, and super-high separation ability is over 1600. However, the silica-based materials have poor stability under acidic conditions, the structure of resin is easy to collapse, and the suitable pH value for resin is more than 3. So the core contradiction of acidic gallium adsorption is the competition form H+ and the selectivity of the material for impurity ions.
A number of studies had investigated the enrichment of Ga from sulfuric acid leach liquor (pH > 2); the main form of Ga in sulfuric acid leach liquor was GaOH2+ and Ga(OH)2+ [32,33]. However, Ga is leached by sulfuric acid with a low value of pH (pH < 2) from the ash, and the main form of Ga in sulfuric acid leach liquor was Ga3+ when the value of pH was lower than 2, and even negative. Meanwhile, the concentration of Al in acid leach liquor is about 2000 times that of Ga and the chemical property of Al is similar to that of Ga. So the acidic condition and impurity element will increase the difficulty to the recovery of Ga from the acid leach liquor of HAFA.
This study mainly aims to adsorb Ga from sulfuric acid leach liquor of HAFA to obtain a well material and clarify the adsorption property under the conditions of highly acidic solutions and the coexistence of various impurity elements. The initial concentration of Ga was investigated through a static adsorption experiment using three types of resin with different functional groups to screen a high adsorption capacity for Ga. The adsorption conditions, including reaction time, temperature, and acid concentration, were optimized. Based on the results, the adsorption isotherm and kinetic studies of Ga were simulated to determine the adsorption reaction process. The selectivity of the resin was judged by the adsorption rate of the resin to Ga in a solution containing impurity ions. The adsorption mechanism of resin towards Ga is characterized by Fourier transform infrared spectroscopy (FTIR) and X-ray photoelectron spectroscopy (XPS). Finally, the screened resin exhibited high adsorption capacity and was enriched in the column adsorption to meet the demanding requirement of selective recovery of Ga from sulfuric acid leach liquor of HAFA.
2. Materials and Methods
2.1. Materials
Three kinds of typical resins, namely, H-type chelating resin A, Na-type chelating resin B, and H-type resin C, were used. The physical properties of the resins are shown in Table 1. From the functional structure, the effective functional groups may be carboxy and hydroxyl groups. For the pretreatment process, the resins were initially soaked in deionized water for 24 h. The water was prepared with ultra-pure water resistance >18.2 MΩ using Cascada III.I 20. The sulfuric acid leach liquor was prepared by Ga metal with a purity of 99.999% and sulfuric acid obtained from Beijing Chemical Works. Sulfates with analytical grade were obtained from Shanghai Sinopharm Group Chemical Reagent Co. LTD (Shanghai, China).

Table 1.
Typical properties of resins.
2.2. Static Adsorption
Experiments of static adsorption equilibrium were carried out using a conical flask in a thermostatic oscillator with the feed solution/resin ratio of 200 mL/g. The static adsorption of three kinds of resins with the concentration of Ga ranging from 10 mg/L to 200 mg/L in sulfate solution were compared to obtain the suitable kind of resin. The adsorption property of resin A under different times, temperatures, initial Ga concentrations and initial acid concentrations were investigated. The feed solution samples of the static experiments were collected after filtration using a 0.45 μm filter at different time points, and the concentration of Ga in the liquid phase was analyzed. The activated and adsorption-saturated resins were dried at room temperature for 24 h and ground for analysis.
Adsorption capacity qt (mg/g), adsorption efficiency η (%) and distribution coefficient Kd (mL/g) of Ga at the equilibrium state were calculated by Equations (1)–(3):
where C0, Ct, and Ce (mg/L) are the initial concentration, at different times, and equilibrium concentration of Ga in the liquid, respectively; V (mL) is the volume of the feed solution, and M (g) is the precise weight of the resin.
The adsorption isotherm of Ga was analyzed using the Langmuir and Freundlich models [28], which are represented as Equations (4) and (5):
where qe (mg/g) is the adsorption capacity at equilibrium concentration Ce (mg/L); kL (L/mg) is the isothermal adsorption constant related to the Langmuir; qm (mg/g) is the maximum adsorption capacity obtained by Langmuir model fitting; and kF (mg(1−1/n)·L1/n/g) and n are also the constants of Freundlich.
The adsorption kinetics of Ga was analyzed using the Langmuir kinetics, since the rate equation becomes the Langmuir isotherm equation at equilibrium, that is, when the net rate is zero. When the initial concentration of the solution is large enough so that C can be approximated as constant, for example, C = C0, the Langmuir kinetic expression becomes the pseudo-first-order rate equation model [34]. When a mathematical approximation of the integrated form of the Langmuir kinetic rate law is a pseudo-second-order model. After the exact integrated form of the kinetic rate law and simplifying the equation, the exact froms of the Langmuir, pseudo-first-order, and pseudo-second-order models are represented as Equations (6)–(8) [35,36]. The exact integrated form of Langmuir kinetics can be calculated by Equations (9)–(11).
where θ is the fraction coverage and θe is the equilibrium fraction coverage; M (g) is the precise weight of the resin; qm (mg/g) is the maximum adsorption capacity obtained by Langmuir model fitting; and Q is a key parameter (0 ≤ Q ≤ 1) for deriving the pseudo-first-order and pseudo-second-order model. The pseudo-first-order and pseudo-second-order models can be obtained from Equation (6) at Q→0 and Q→1 limits; ka [L/(mg·h)] is the adsorption rate constant; qe (mg/g) is the equilibrium adsorption capacity; qt (mg/g) is the adsorption capacity at time t; and k1 (h−1) and k2 [g/(mg·h)] are the pseudo-first-order and pseudo-second-order reaction rate constants, respectively.
According to the kinetic data at different temperatures of Ga adsorbed onto resin A, the activation energy, Ea, was calculated by the Arrhenius equation, stated as Equation (12):
where k is the adsorption reaction rate constant at different temperatures T (K), R is the universal gas constant (8.314 J mol−1 K−1), A is the pre-exponential factor, and Ea (J/mol) is the activation energy.
The adsorption thermodynamics of Ga was analyzed to obtain enthalpy change ∆H0, entropy change ∆S0, Gibbs free energy ∆G0 of adsorption, and absolute temperature in K. Data of Ga adsorbed of resin At equilibrium at different temperatures, they were used to calculate according to Equations (13) and (14):
where ∆H0 (J/mol), ∆S0 (J mol−1 K−1), and ∆G0 (J/mol) are the enthalpy change, entropy change, and Gibbs free energy, R is the universal gas constant (8.314 J mol−1 K−1), and Kd (mL/g) is the adsorption distribution coefficient at different temperatures T (K).
The adsorption rate control mechanism of Ga was analyzed using external diffusion at the surface-solution boundary and internal diffusion models through Equations (15) and (16):
where C0 and Ct (mg/L) are the initial and equilibrium concentrations of Ga at different times in the liquid respectively; qe and qt (mg/g) are the equilibrium capacity and adsorption capacity at time t; kf (cm/h) is the external diffusion coefficient; D (cm2/h) is the internal diffusion coefficient; and d (cm) is the mean particle diameter (0.1 cm).
Once the external and internal diffusion are both determined for the adsorption process, the Biot number BN can be estimated from Equation (17) [37]:
where kf (cm/h), d (cm), and D (cm2/h) are as mentioned above.
The selectivity coefficient of the resin to coexisting metal ions was determined by the Qureshi method. About 1 g of the resin was placed into a conical flask, and 200 mL of the solution with 100 mg/L Ga3+, Al3+, K+, Mg2+, Fe2+, and Ca2+ were obtained. The solution acidity was adjusted to 0.1 mol/L, and the temperature was controlled at 55 °C. The concentration of each ion in the solution at different time points was analyzed. The Selectivity coefficient of metal ions concerning Ga also can be determined from Equation (18):
where Kd,Ga (mL/g) is the distribution coefficient of Ga and Kd,Me (mL/g) is the distribution coefficient of other ions, including Al3+, K+, Mg2+, Ca2+ and Fe2+.
2.3. Characterization of Samples
The element content in the liquid phase was analyzed by inductively coupled plasma optical emission spectrometer (ICP-OES, Perkin–Elmer Avio 200, Waltham, MA, USA). The properties of activated and saturated resins were analyzed by Fourier Transform Infra-Red spectra (FTIR, Bruker Tensor 27, Ettlingen, Germany) and X-ray photoelectron spectra (XPS, Thermo Fisher Scientific ESCALAB 250Xi, Waltham, MA, USA).
3. Results and Discussion
3.1. Screening of Resin
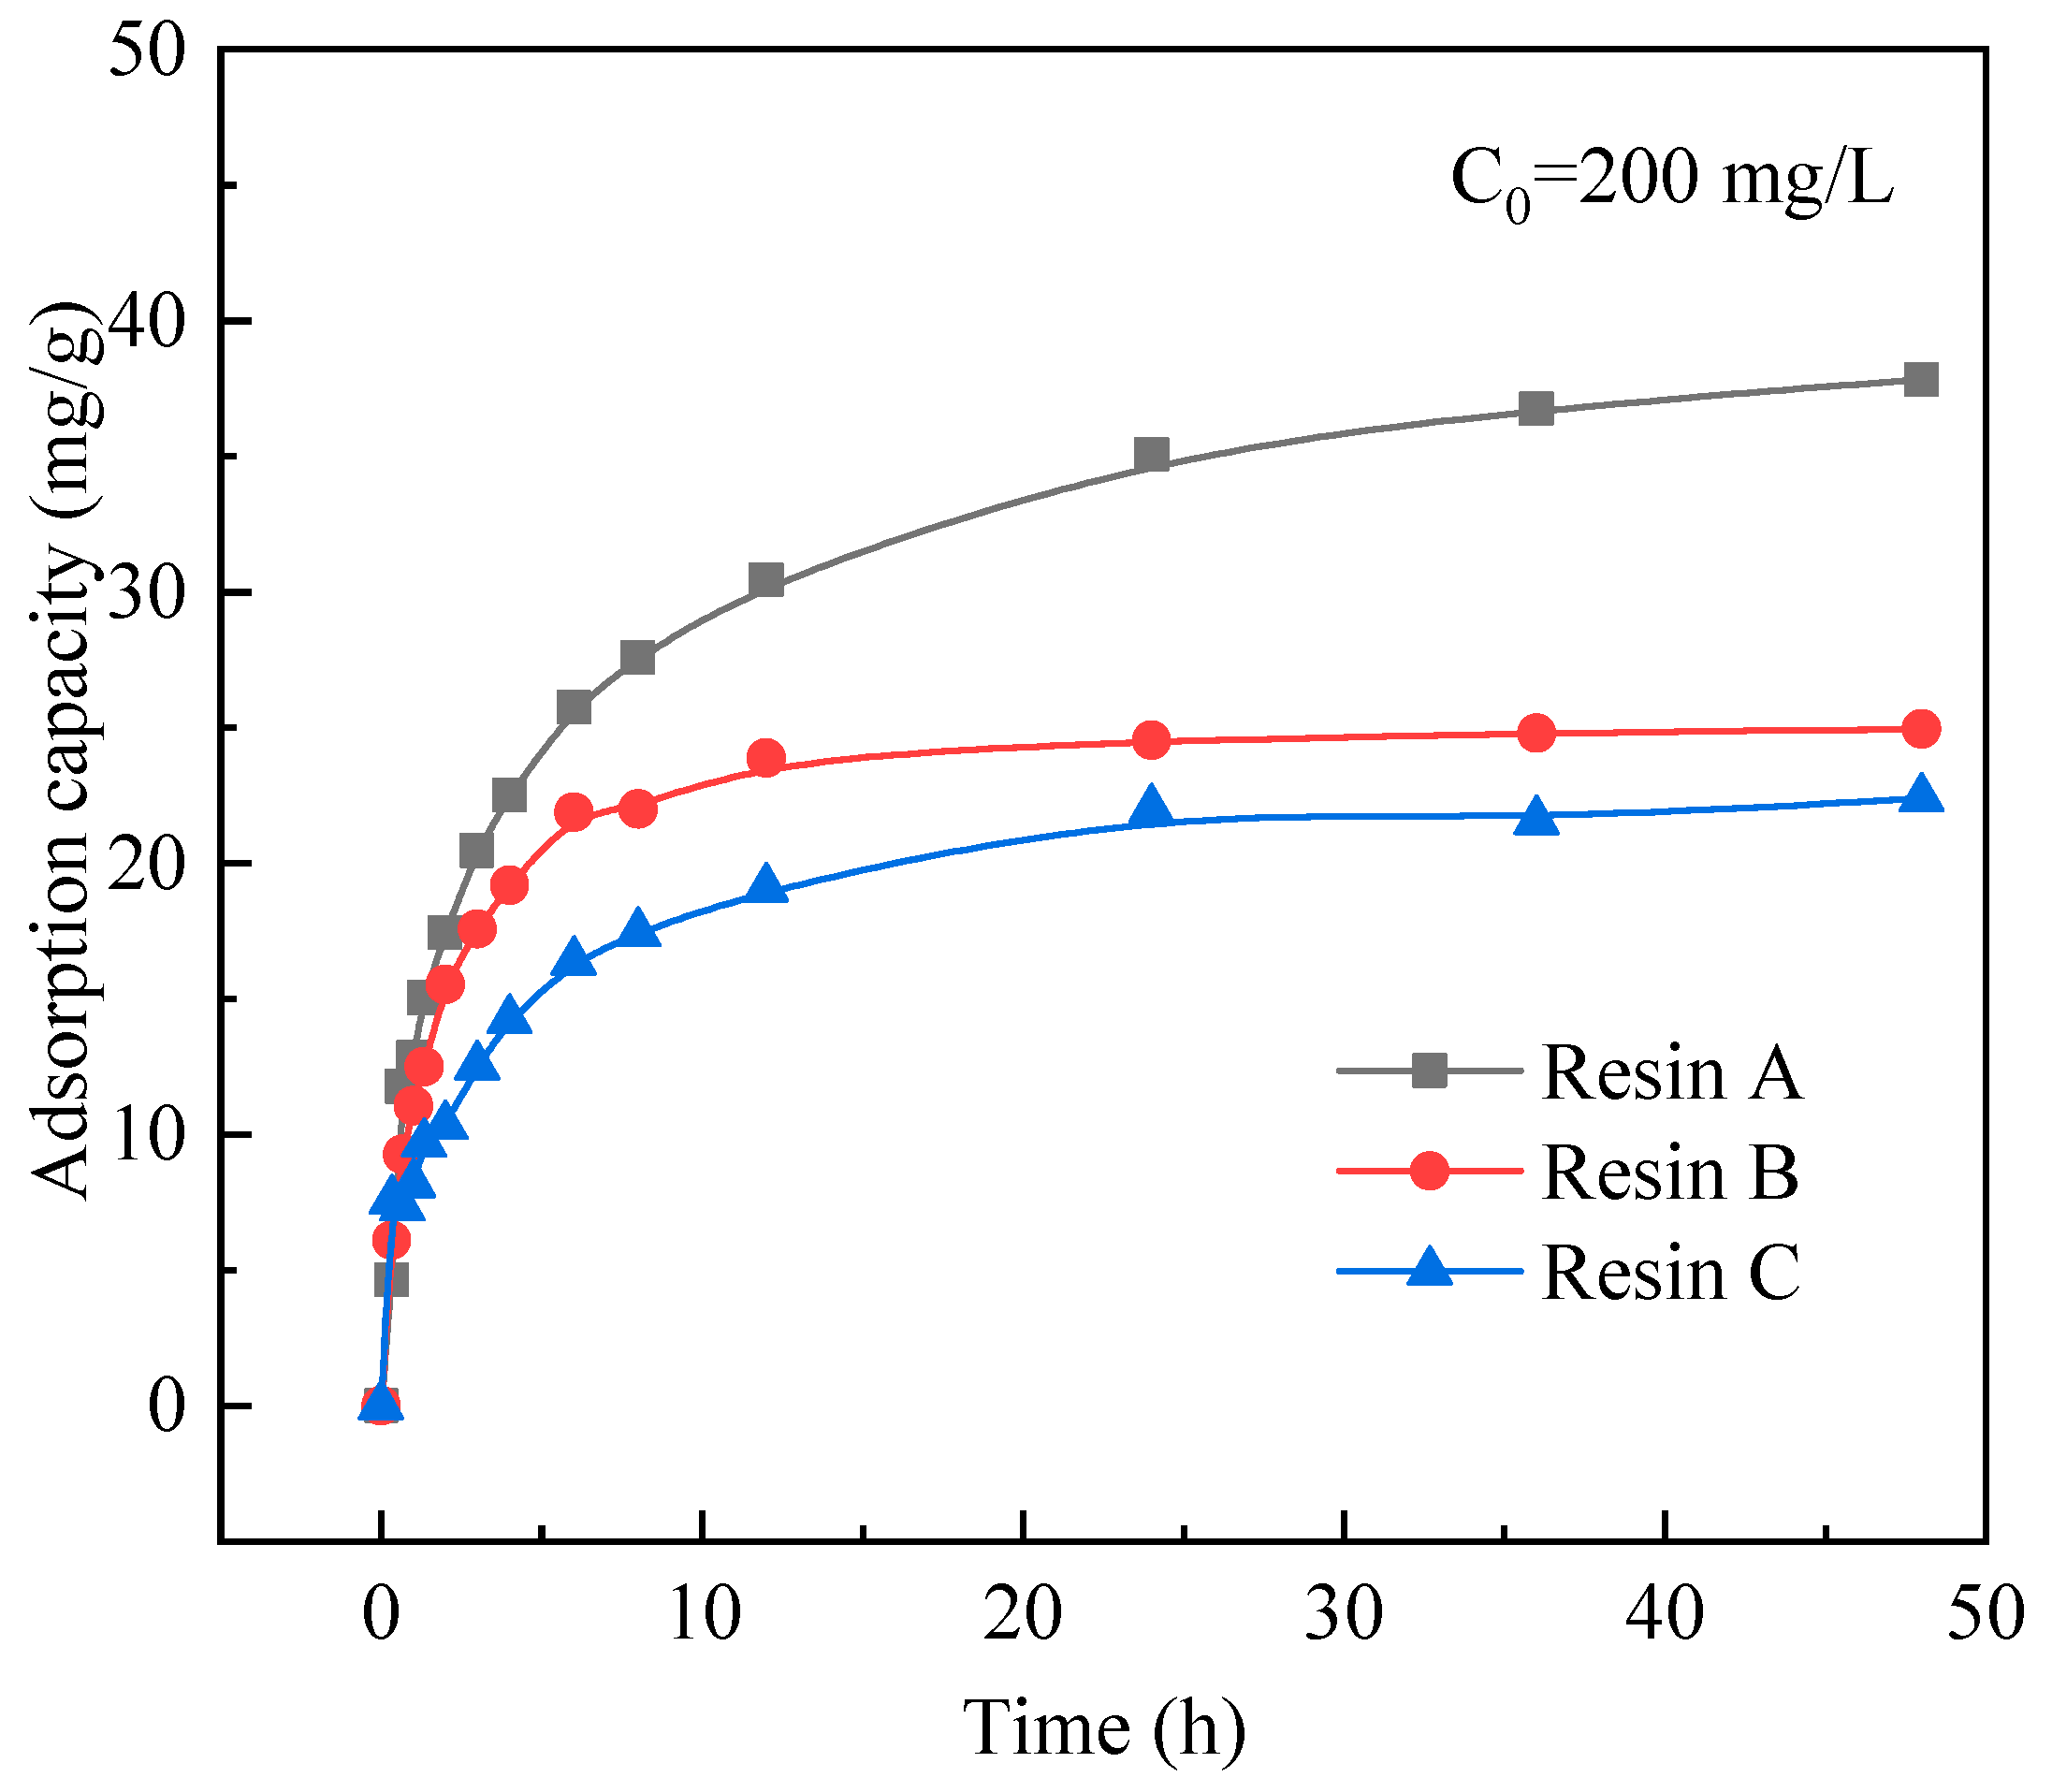
The static adsorption for three types of resins were carried out with different initial concentrations of Ga at 55 °C for 24 h and acid concentration (CH+) at 0.1 mol/L. After comparing the adsorption capacity of three types of resins for Ga, a suitable resin was selected for the next experiment. The results are shown in Figure 1 and Table 2. It can be seen from Figure 1 that the equilibrium time is 24 h for the adsorption of three types of resins. When the initial concentration of Ga increases from 10 mg/L to 200 mg/L, the largest adsorption capacity of the three resins was resin A, and the adsorption capacity of Ga followed the order: resin A > resin B > resin C. Therefore, the best resin for adsorption of Ga from sulfuric acid solution is resin A.
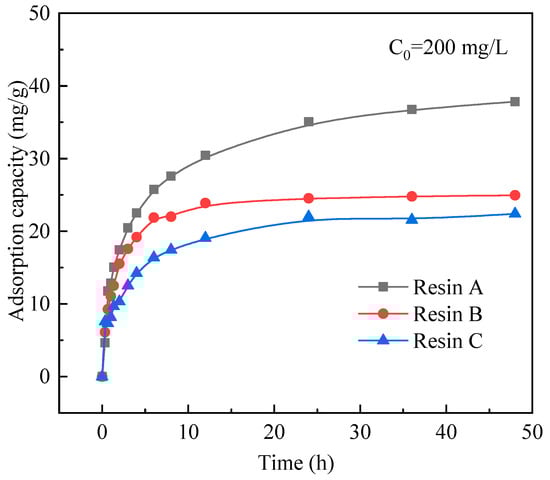
Figure 1.
Effect of time on three kinds of resin adsorption towards Ga in sulfuric acid solution. (L/S: 200 mL/g, C0: 200 mg/L, temperature: 55 °C, CH+: 0.1 mol/L).
Table 2.
Adsorption capacities of the three kinds of resins with different initial concentrations of Ga (L/S: 200 mL/g, temperature: 55 °C, CH+: 0.1 mol/L, time: 24 h).
3.2. Adsorption Behaviors of Resin A
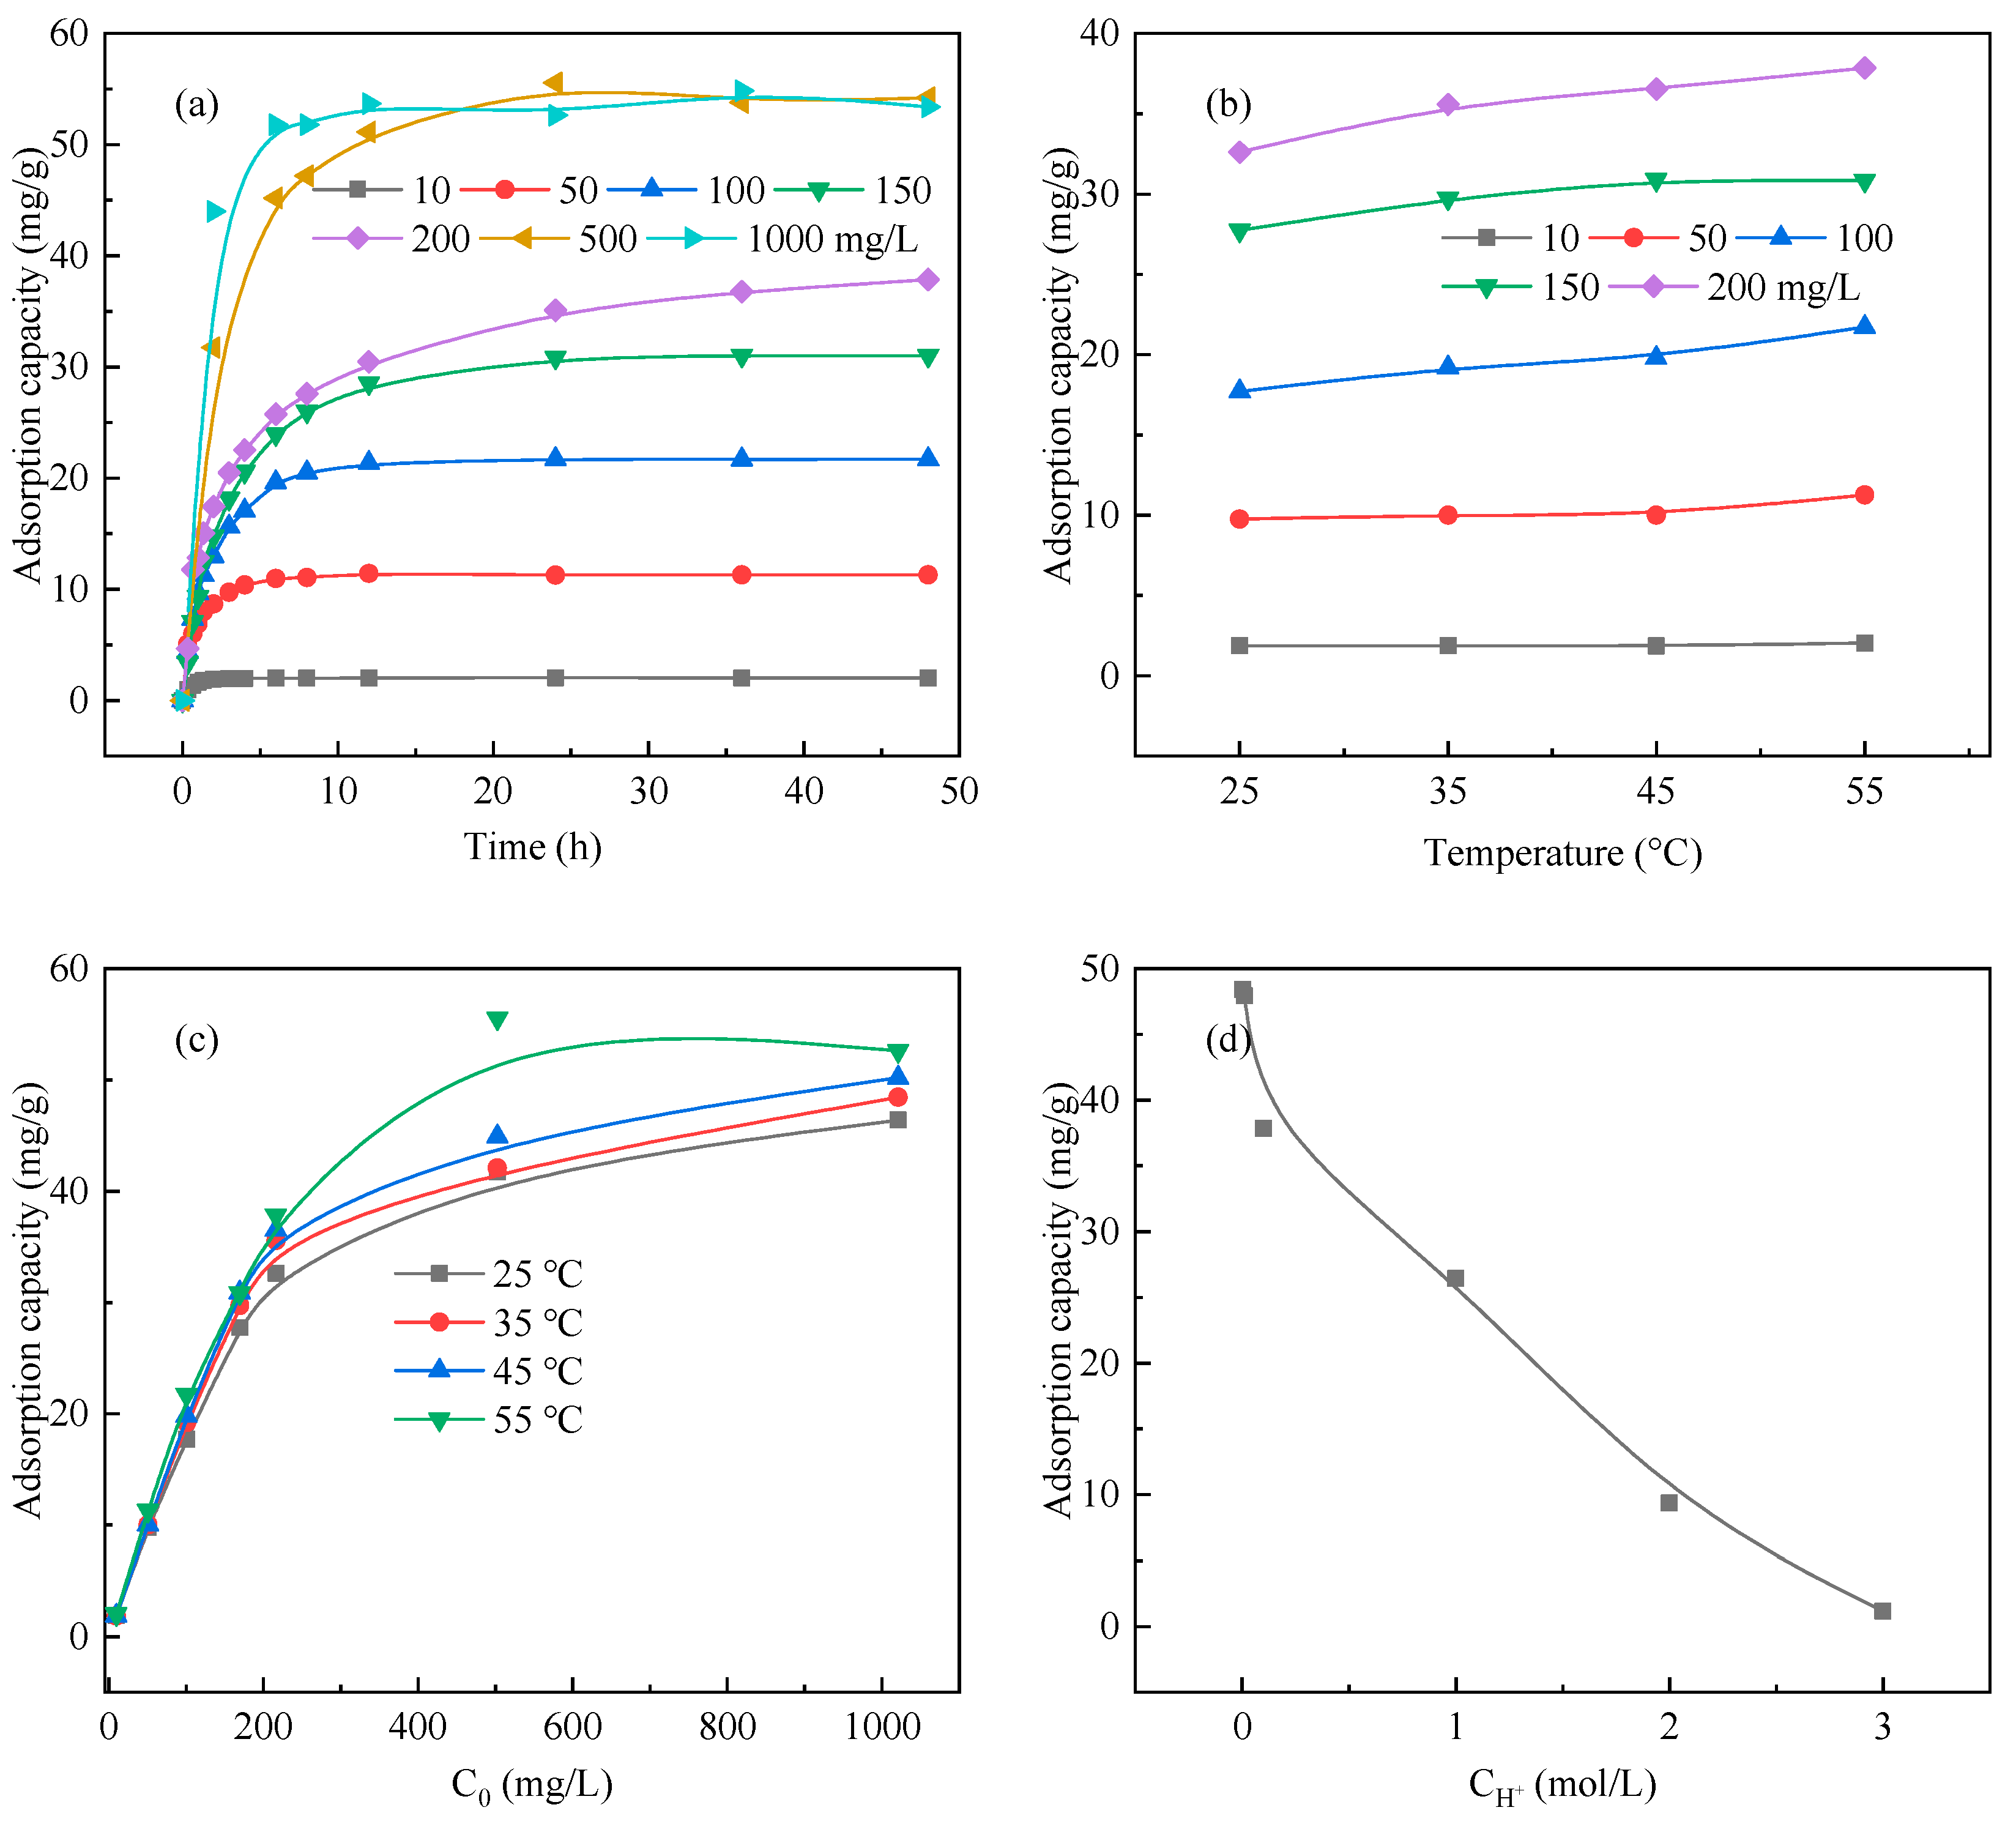
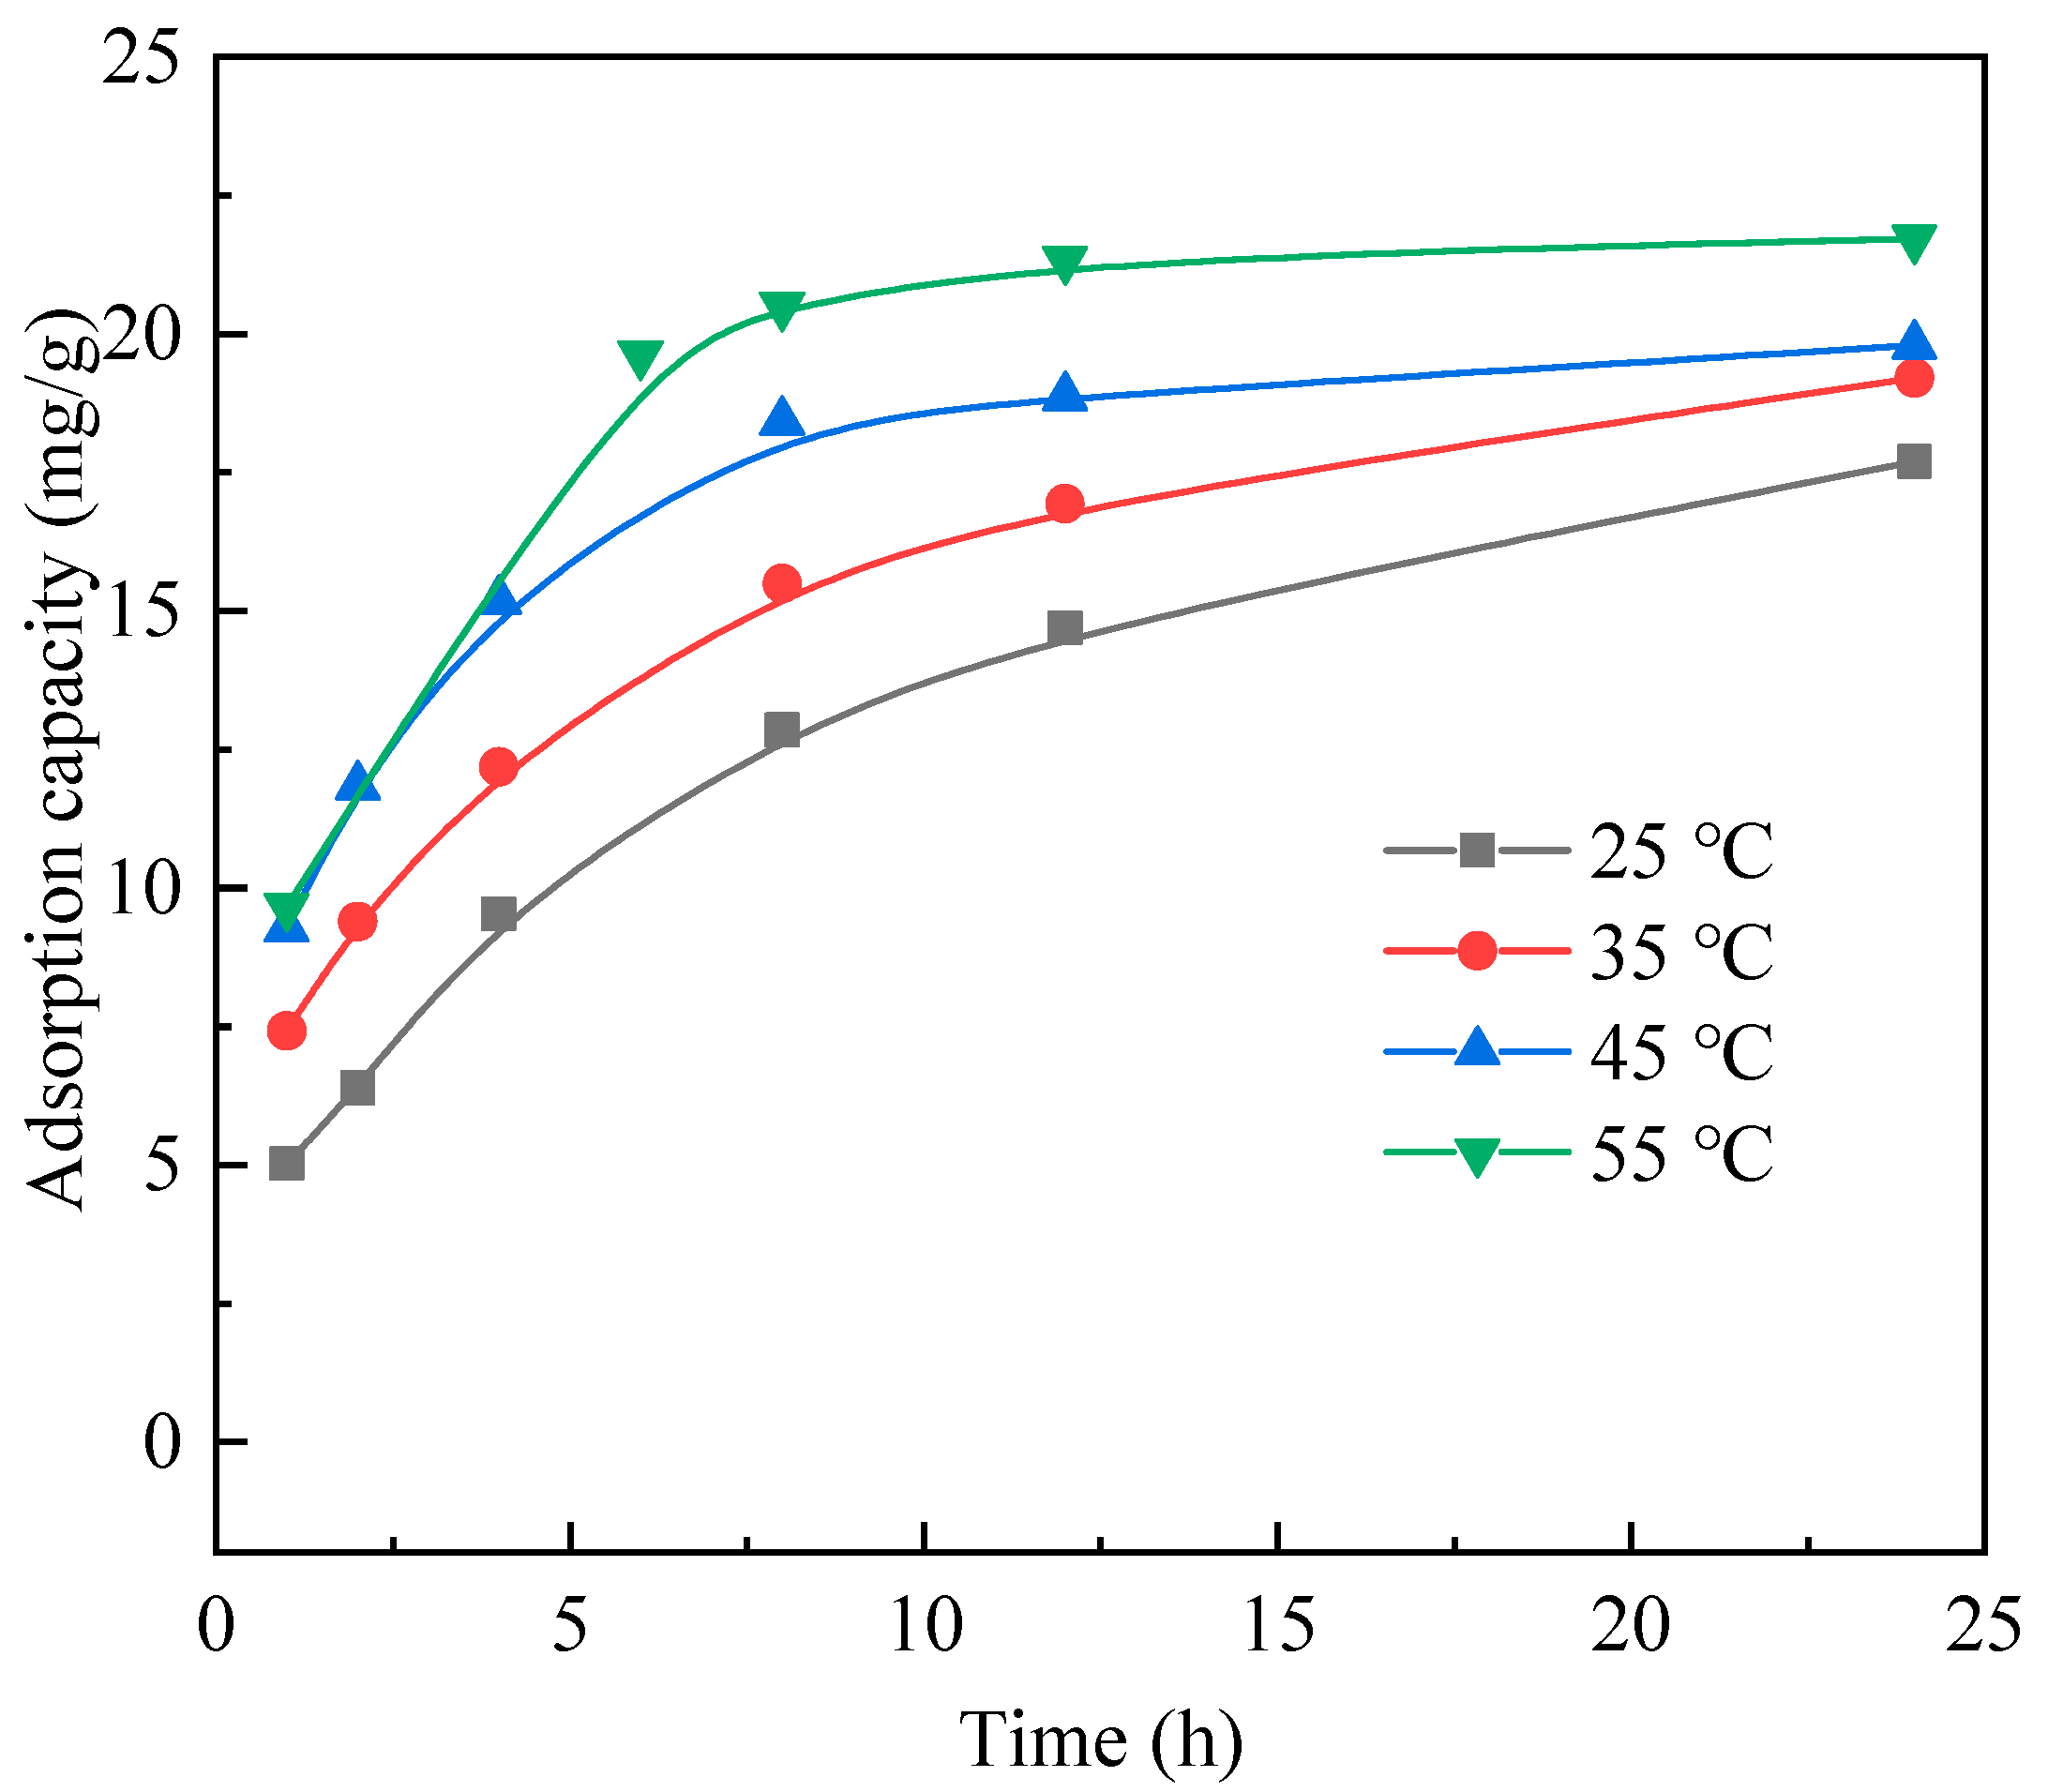
Experiments were performed to investigate the adsorption behaviors of resin A with the different times, temperatures, initial concentrations of Ga, and initial acid concentrations in sulfuric acid solution. The effect of contact time of Ga with different initial concentration for resin A was investigated to determine both adsorption kinetic and equilibrium times. As shown in Figure 2a, when the adsorption time was 24 h, the adsorption capacities of resin A achieved the equilibrium state and gradually increased when the initial concentration of Ga varied from 10 mg/L to 500 mg/L. When the initial concentration of Ga was at 500–1000 mg/L, the adsorption capacity of the resin A achieved the maximum adsorption capacity of 55 mg/g. Figure 2b shows the change in the adsorption capacity of resin A with different temperatures. When the initial concentration of Ga was larger than 50 mg/L, temperature showed an obvious effect on the adsorption capacity of resin A. The adsorption capacity of Ga increased with increasing temperature from 25 to 55 °C, indicating that the chelate process of Ga was accelerated with an increase of temperature.
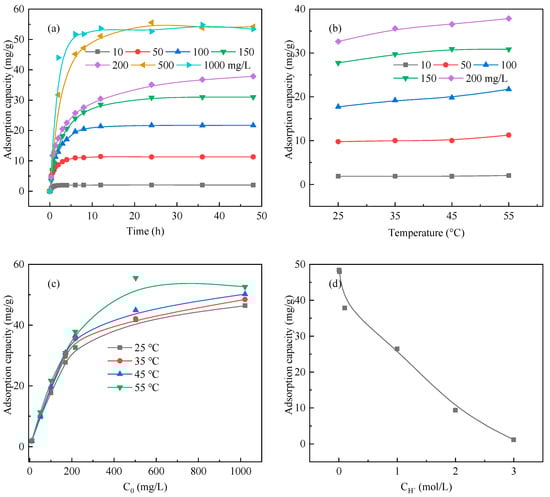
Figure 2.
Change in the adsorption capacity of resin A as a function of time (a), temperature (b), initial Ga concentration (c), and initial acid concentration (d).
It is necessary to determine the influence of the initial concentration of Ga since the concentration is highly variable during the HAFA leaching process. Figure 2c shows the effect of initial Ga concentration on the adsorption capacity with different temperatures. The adsorption capacity of Ga for resin A increased from 2 to 55 mg/g with the increasing of Ga concentration from 10 to 1000 mg/L, with 0.1 mol/L initial acid concentration. The initial acid concentration plays an important role in the adsorption of Ga on resin A. As shown in Figure 2d, the adsorption capacity of Ga decreased with an increasing initial acid concentration (CH+). After circulation of the sulfuric acid leaching liquor from HAFA, the CH+ is controlled at about 0.1 mol/L. In this system, the ion state for Ga is Ga3+ and GaOH2+ [31]. When CH+ increased from 0.1 mol/L to 3 mol/L, the predominant ion state for Ga was 100% Ga3+, which inhibited Ga3+ from forming water-soluble hydrolysis species and the dehydrogenation of carboxy groups, leading to lower adsorption capacity of Ga. As reported [29], the functional groups of the resin under strong acidic conditions were protonated and showed strong electrostatic repulsion, leaving few ionized groups for binding gallium. Meanwhile, the hydrogen ions in the solution compete with the Ga(OH)2+ and Ga(OH)2+ to form a competitive adsorption [30], thereby decreasing the adsorption rate of gallium. In a word, the resin A is positively charged and repulse Ga3+ due to the protonation at high initial acid concentration; the adsorption repulsion decreases and enhances the ability of Ga ion binding with the initial acid concentration decrease.
3.3. Adsorption Thermodynamics
To evaluate the adsorption capacity of resin A, isotherms of resin A are analyzed by the Langmuir and Freundlich models. The adsorption equilibrium data at 25 °C, 35 °C, 45 °C, and 55 °C from Figure 2c are shown in Figure 3, which is derived from the equilibrium concentration Ce plotted against the adsorption capacity qe. The experimental maximum adsorption capacities (qm,exp) at 55 °C are 55.54 mg/g. It can be seen that the qm increased obviously with temperature, which means that the adsorption ability of resin A is higher with a higher temperature. This is mainly caused by the enhanced protonation of carboxyl functional groups from resin A at elevated temperature.
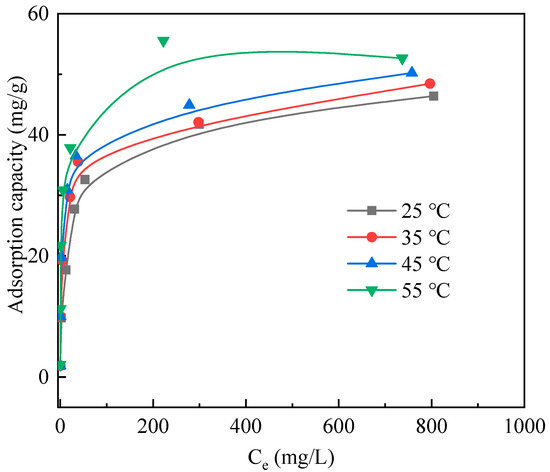
Figure 3.
Adsorption isotherm on resin A towards Ga (L/S: 200 mL/g, CH+: 0.1 mol/L).
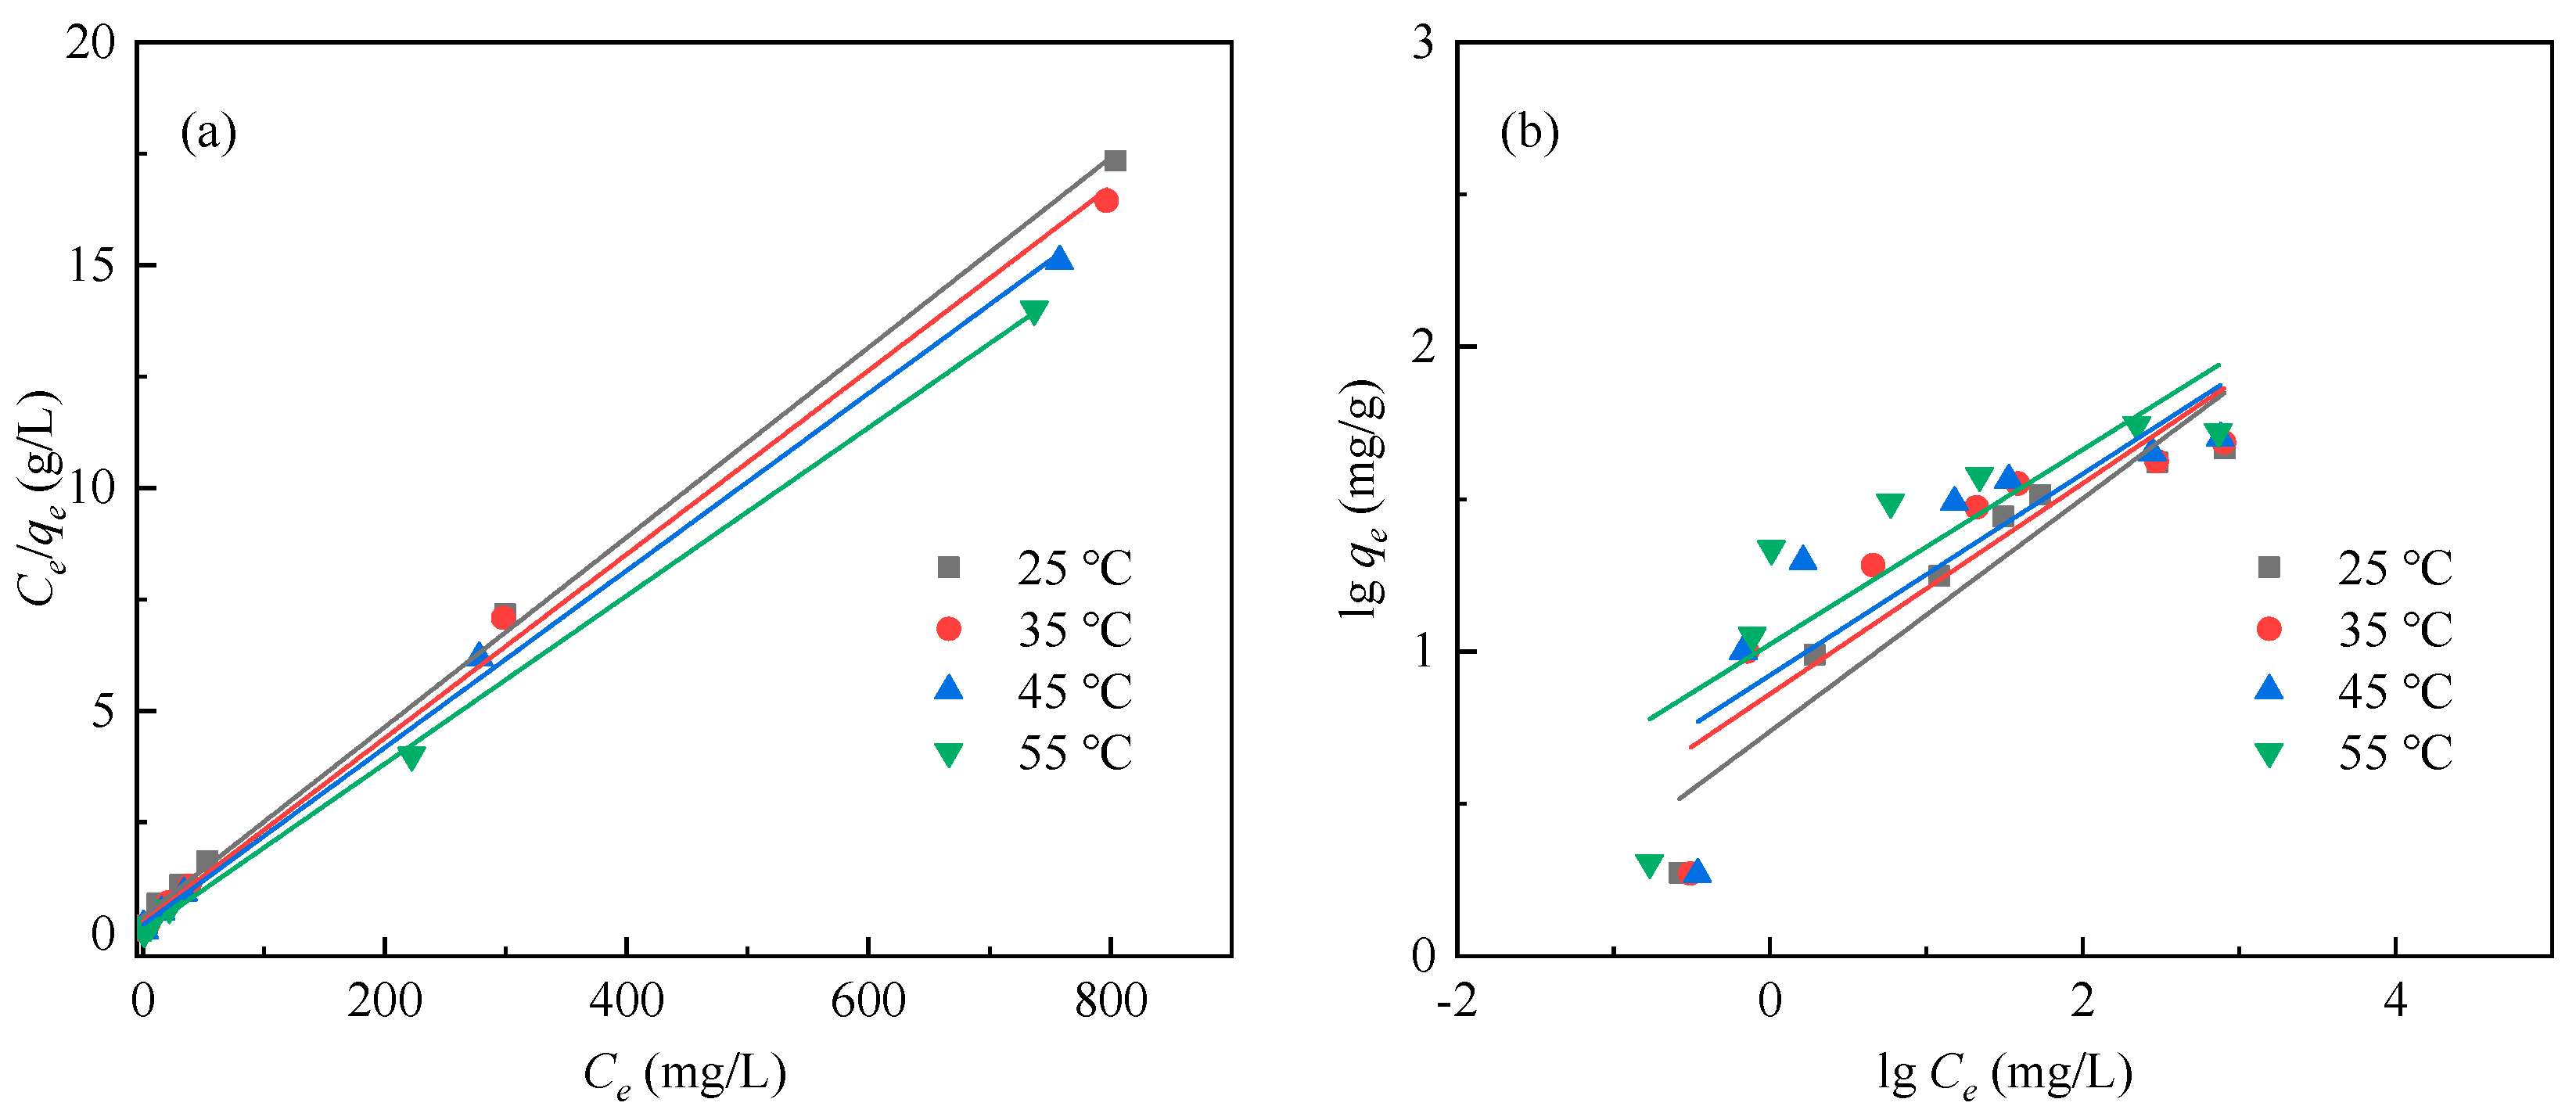
The simulated results according to Equations (4) and (5) are shown in Figure 4 and Table 3. Table 3 shows the values of both Langmuir and Freundlich model parameters from the fitted linear versions with corresponding correlation coefficients (R2). The R2 in the Langmuir model is better than that of Freundlich, indicating that the adsorption process of Ga onto resin A is dominantly monolayer chemisorption. The maximum theoretical adsorption capacities (qm) of resin A at 55 °C were 53.05 mg/g, which was closer to the experimental value, indicating that the adsorption of Ga by resin A was more inclined to monolayer adsorption.
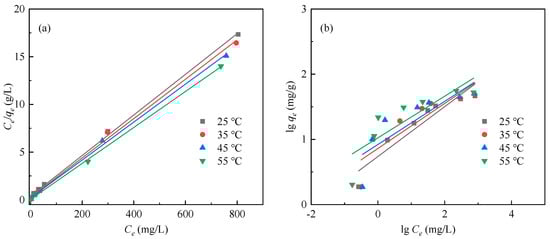
Figure 4.
Langmuir (a) and Freundlich (b) isotherms of Ga adsorption by resin A. (L/S: 200 mL/g, CH+: 0.1 mol/L).
Table 3.
Adsorption isotherms fitting parameters of resin A for adsorption of Ga at different temperatures. (L/S: 200 mL/g, CH+: 0.1 mol/L).
3.4. Adsorption Kinetics
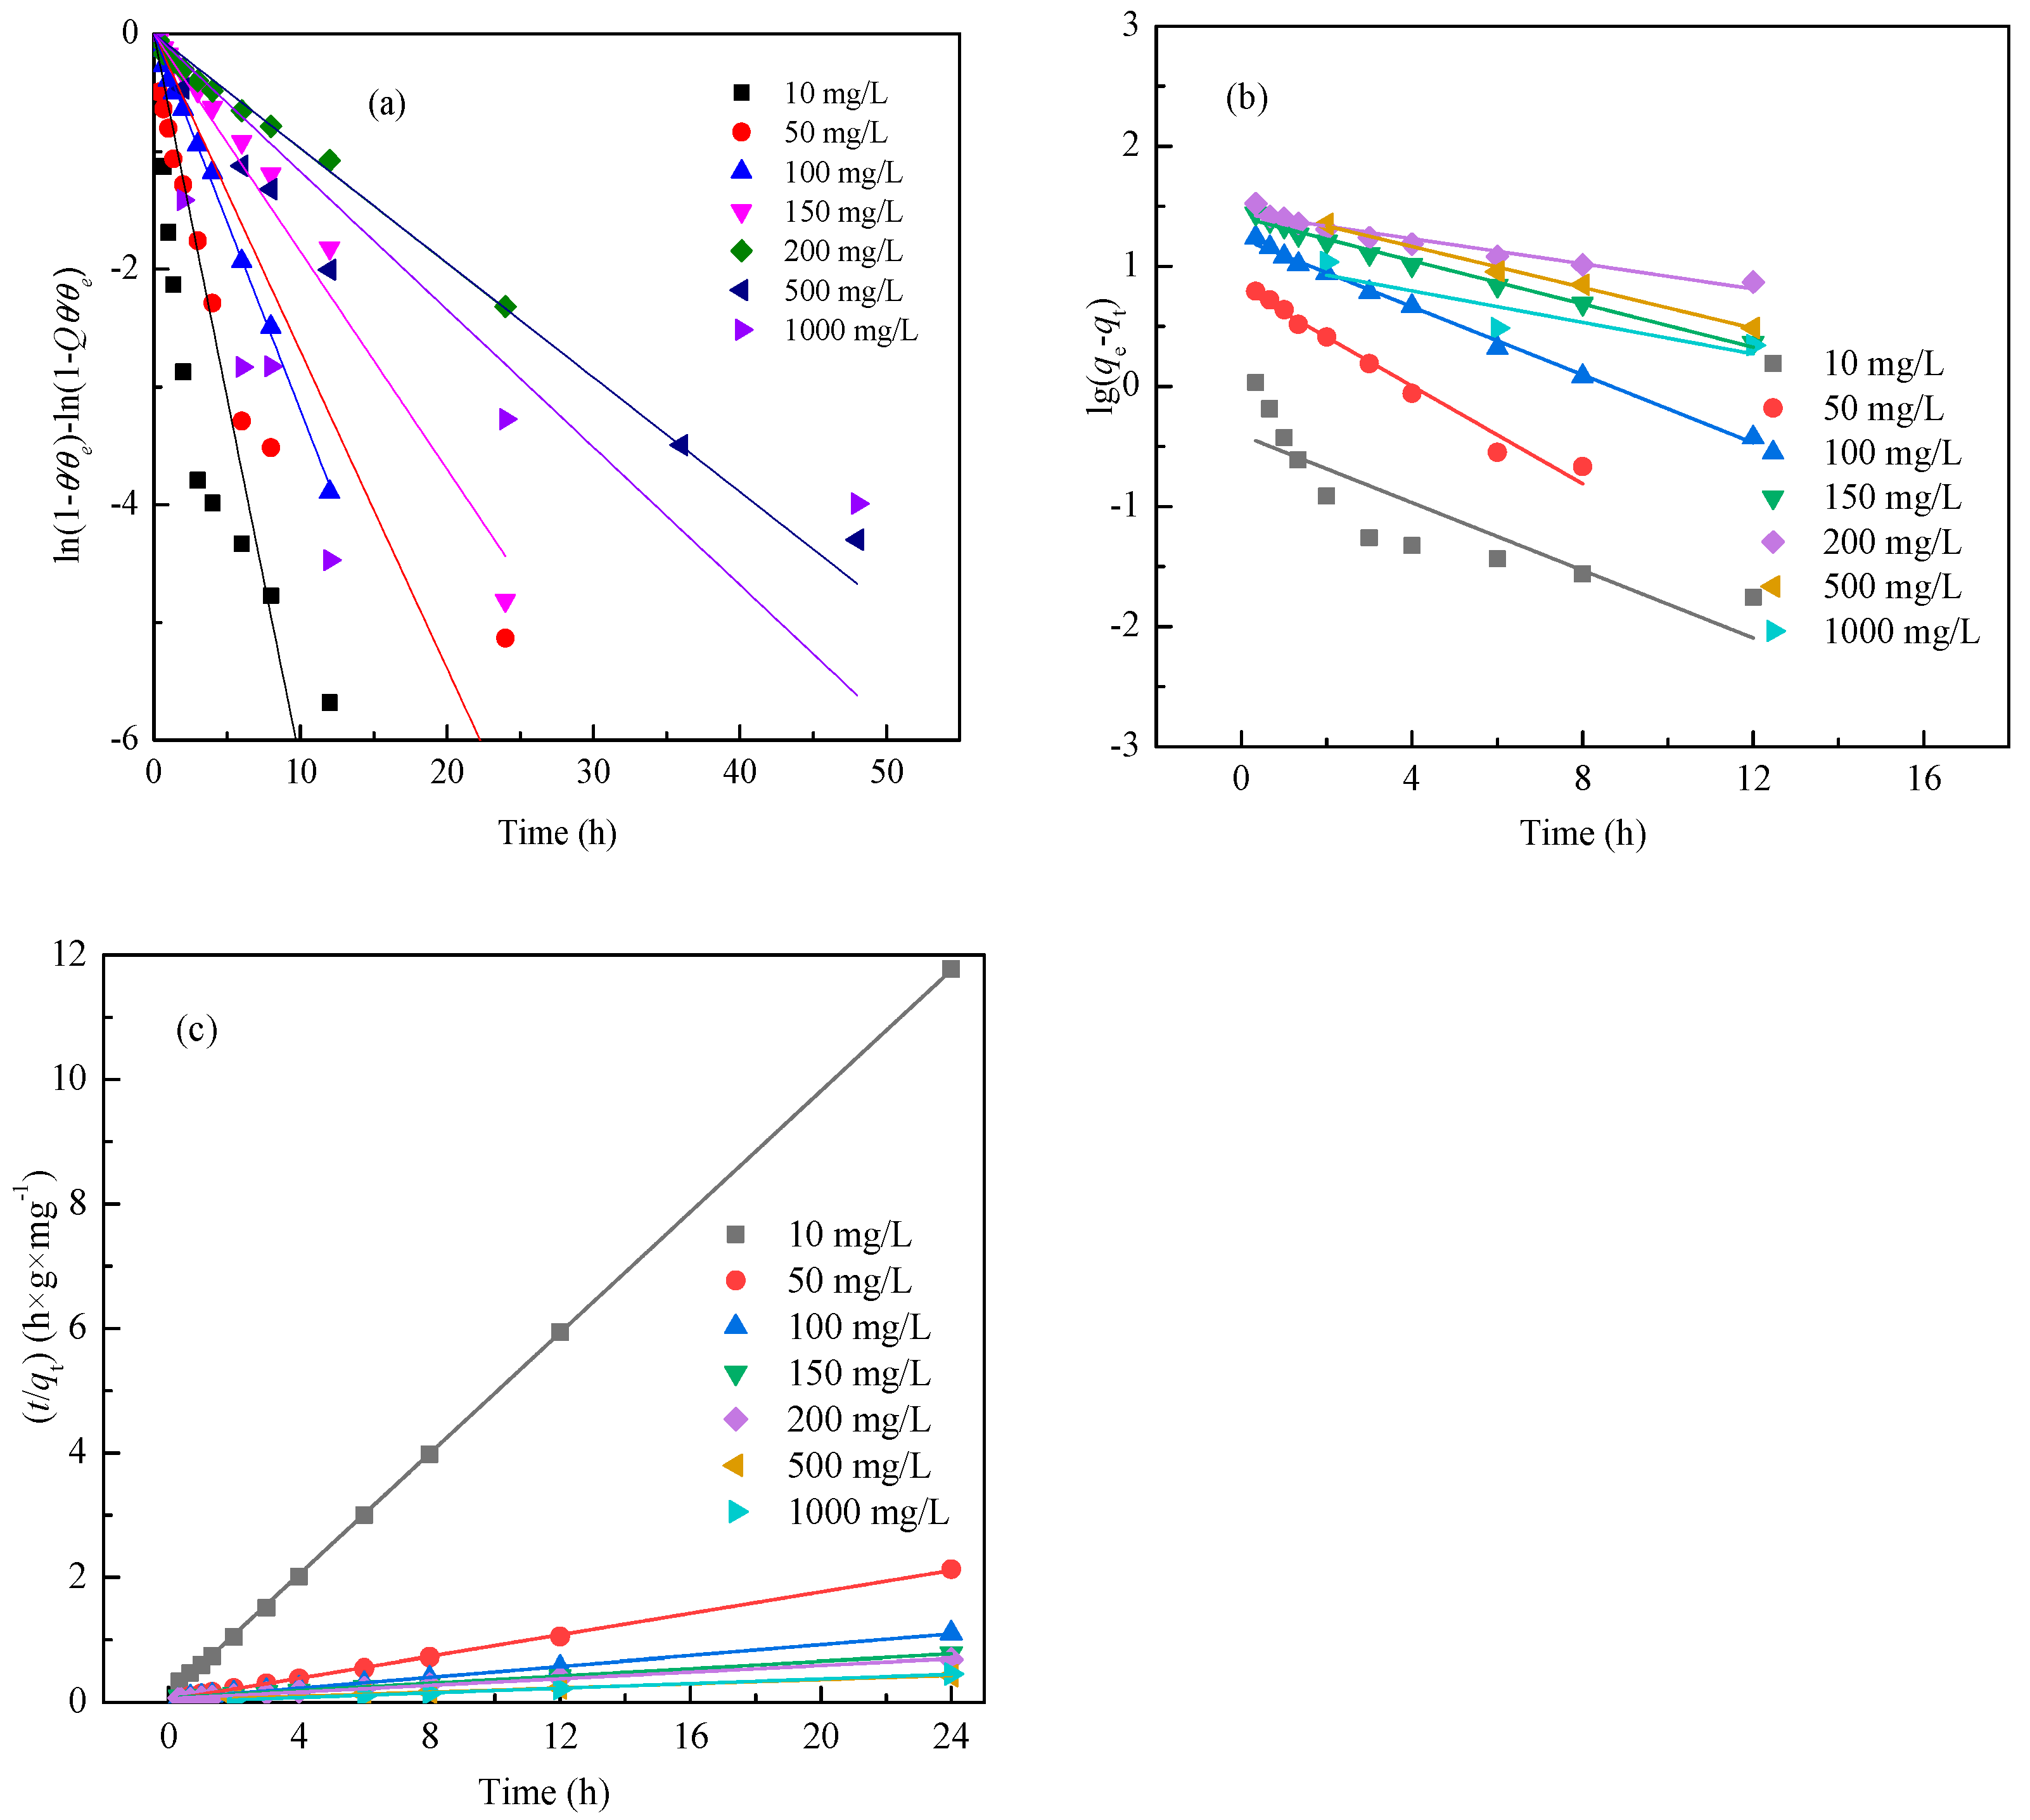
To understand the adsorption abilities of resin A towards Ga, kinetics data under different adsorption times with 0.1 mol/L initial acid concentration, 55 °C temperature, and different initial Ga concentrations from Figure 2a are analyzed by the Langmuir, pseudo-first-order, and pseudo-second-order models. The simulated results according to Equations (6)–(11) are shown in Figure 5 and Table 4. As observed, adsorption of Ga with different initial Ga concentrations followed the pseudo-second-order kinetic model (R2 > 0.99), indicating that the adsorption mechanism might be mainly a chemical adsorption process. Furthermore, the equilibrium adsorption capacity of Ga could be calculated by the pseudo-second-order kinetic model as shown in Table 4, which was fairly near the experimental equilibrium adsorption capacities (qe,exp).
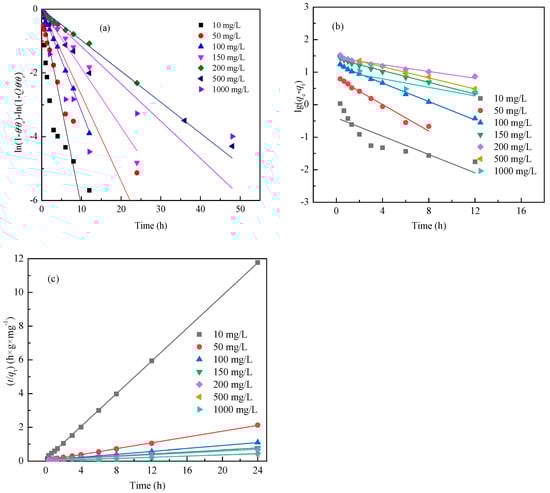
Figure 5.
Kinetic plots of Ga adsorption from the (a) exact form of Langmuir, (b) pseudo-first-order, and (c) pseudo-second-order models (L/S: 200 mL/g, temperature: 55 °C, CH+ = 0.1 mol/L).
Table 4.
Adsorption kinetic constant obtained from the exact form of the Langmuir, pseudo-first-order, and pseudo-second-order models of resin A for adsorptions of Ga at different initial Ga concentration (L/S: 200 mL/g, temperature: 55 °C, CH+: 0.1 mol/L).
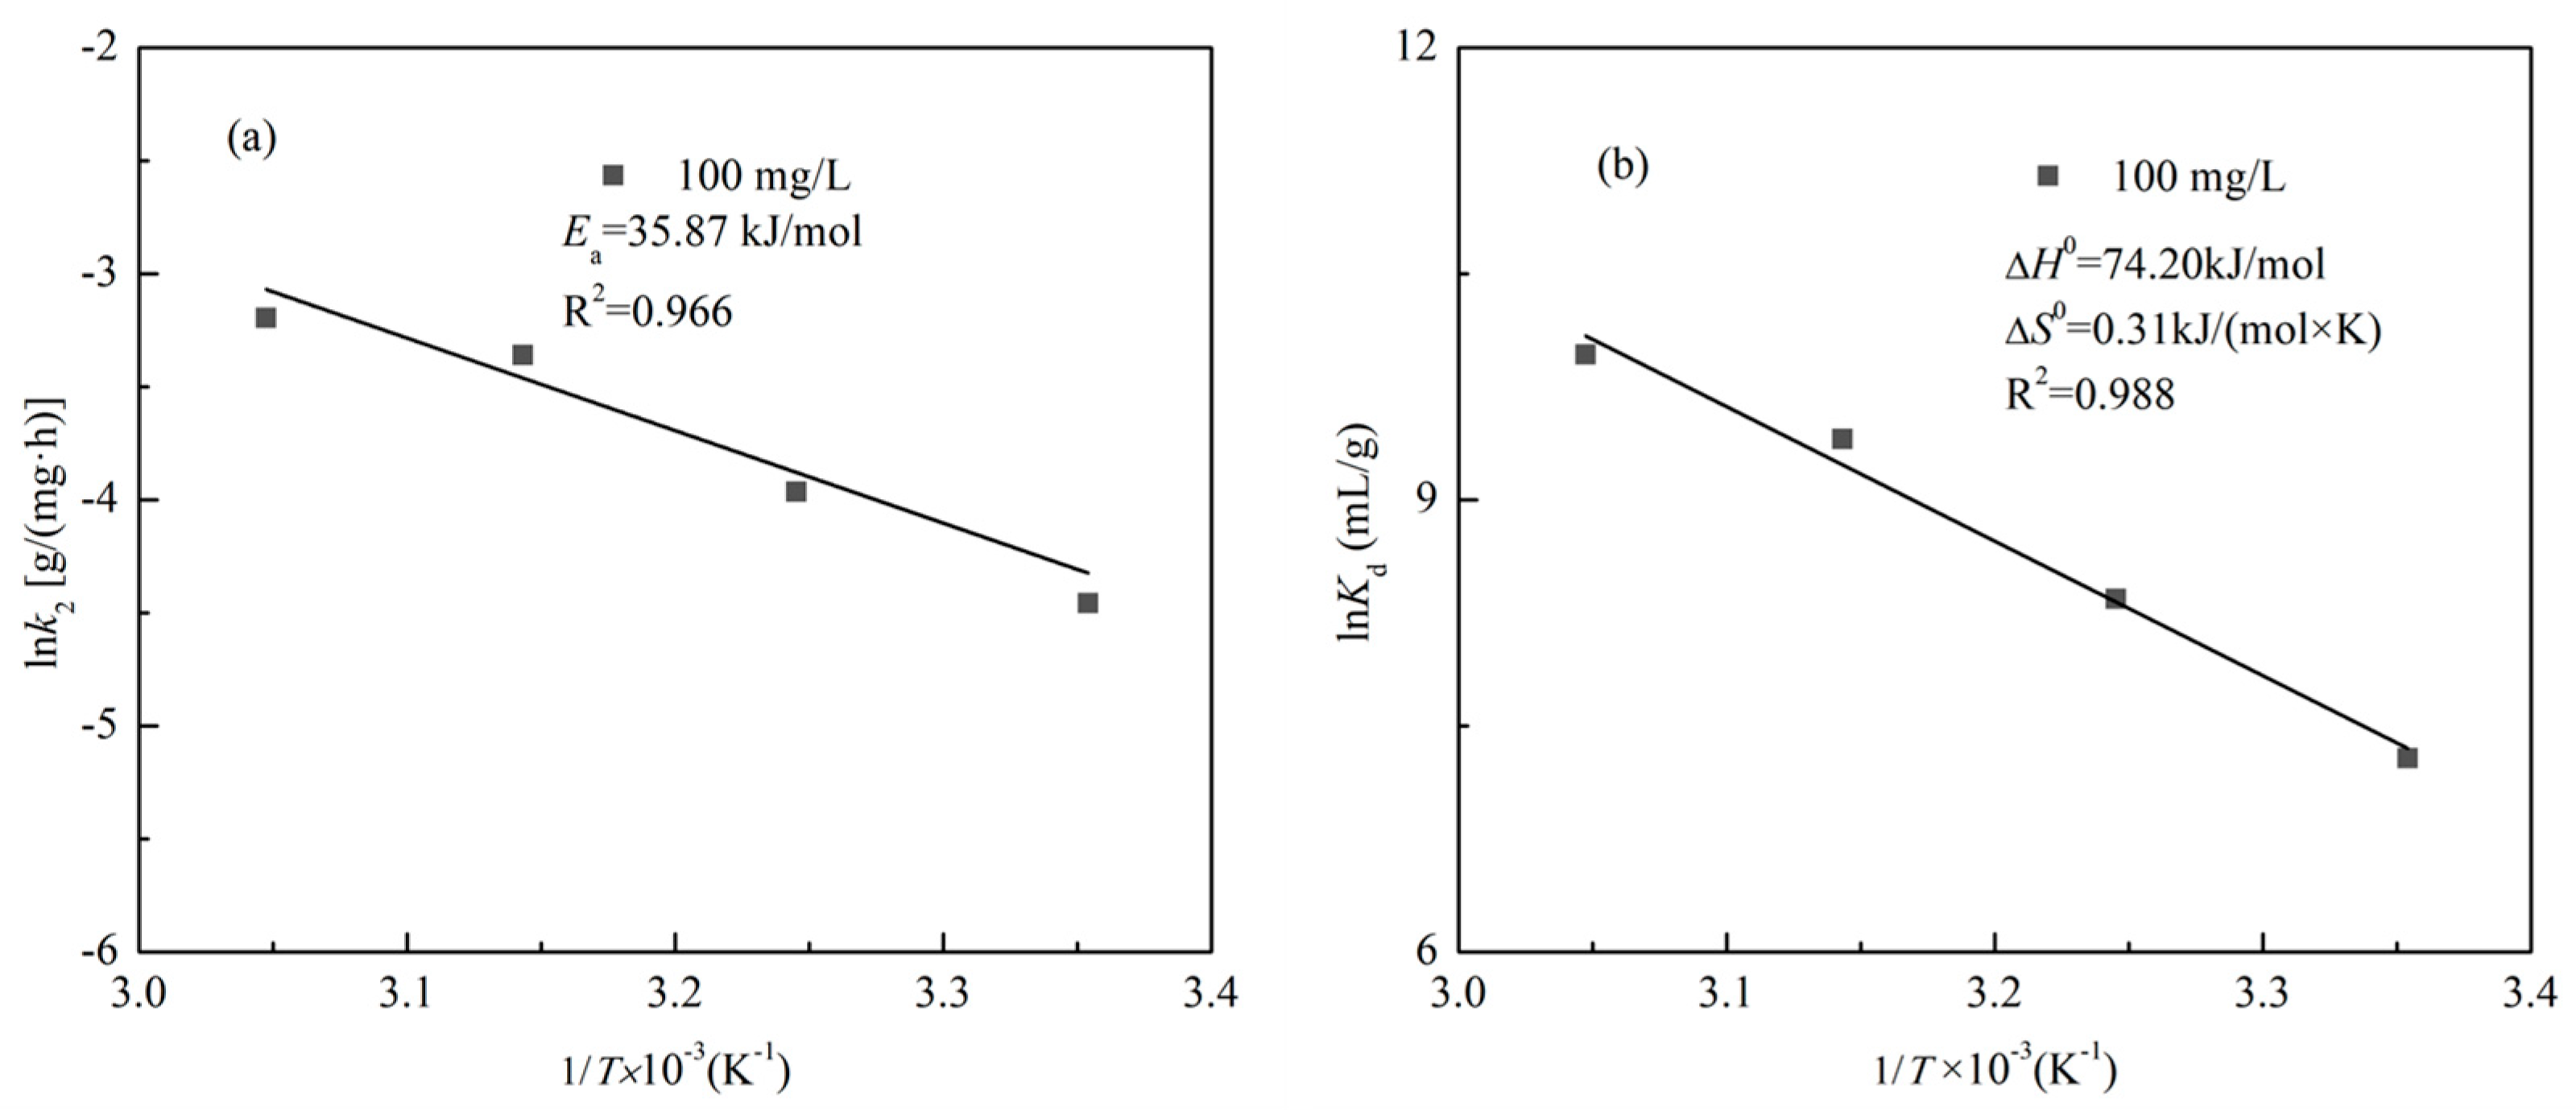
As the adsorption kinetic followed the pseudo-second-order model, the effect of adsorption time of Ga on resin A with constant initial Ga concentration (100 mg/L), initial acid concentration (0.1 mol/L) and different temperatures was investigated to determine adsorption rate and activation energy (Ea). From Figure 6, the data was simulated by Equation (8), and the pseudo-second-order reaction rate constant k2 for adsorption of Ga in the range of 25 to 55 °C. The increased adsorption rate constant indicated that the resin A has more affinity for Ga with increasing temperature. The Ea value of Ga adsorption onto resin A was calculated from the Arrhenius equation according to Equation (12) in Figure 7a. In sulfuric acid leach liquor, the Ea value of Ga was obtained as 34.03 kJ/mol, meaning the adsorption of Ga on resin A belongs to chemical adsorption.
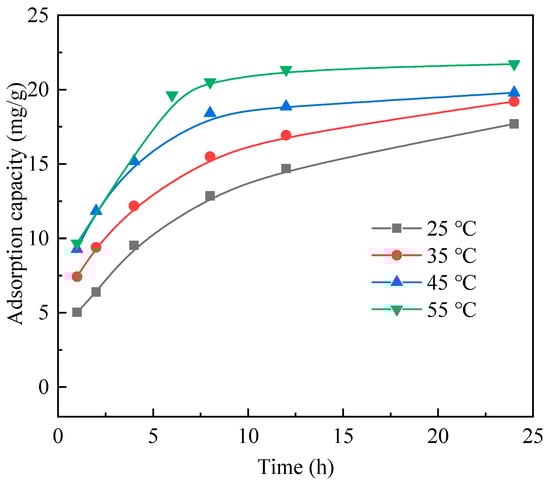
Figure 6.
Effect of time on resin A adsorption towards Ga in sulfuric acid solution under different temperatures. (L/S: 200 mL/g, C0: 100 mg/L, CH+: 0.1 mol/L).
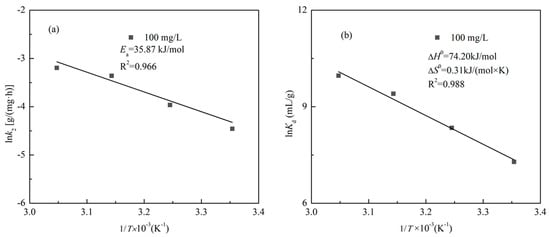
Figure 7.
Plot of Ga adsorption (a) for Arrhenius plot from the pseudo-second-order kinetic model and (b) ln Kd vs. 1/T (L/S: 200 mL/g, C0: 100 mg/L, CH+: 0.1 mol/L).
Figure 7b showed the enthalpy change ∆H0 and entropy change ∆S0 of the Ga adsorption process with constant initial Ga concentration (100 mg/L), initial acid concentration (0.1 mol/L), and different temperatures according to Equation (13). The values of ∆H0 and ∆S0 were obtained as 74.20 kJ/mol and 0.31 kJ/(mol∙K). The positive value of ∆H0 and ∆S0 indicated the endothermic nature of the adsorption process with an increased randomness. The Gibbs free energy ∆G0 of adsorption was calculated by Equation (14), and the negative value of ∆G0 when the adsorption temperature varied from 25 to 55 °C indicated a spontaneous adsorption process for Ga.
3.5. Adsorption Rate Control Mechanism
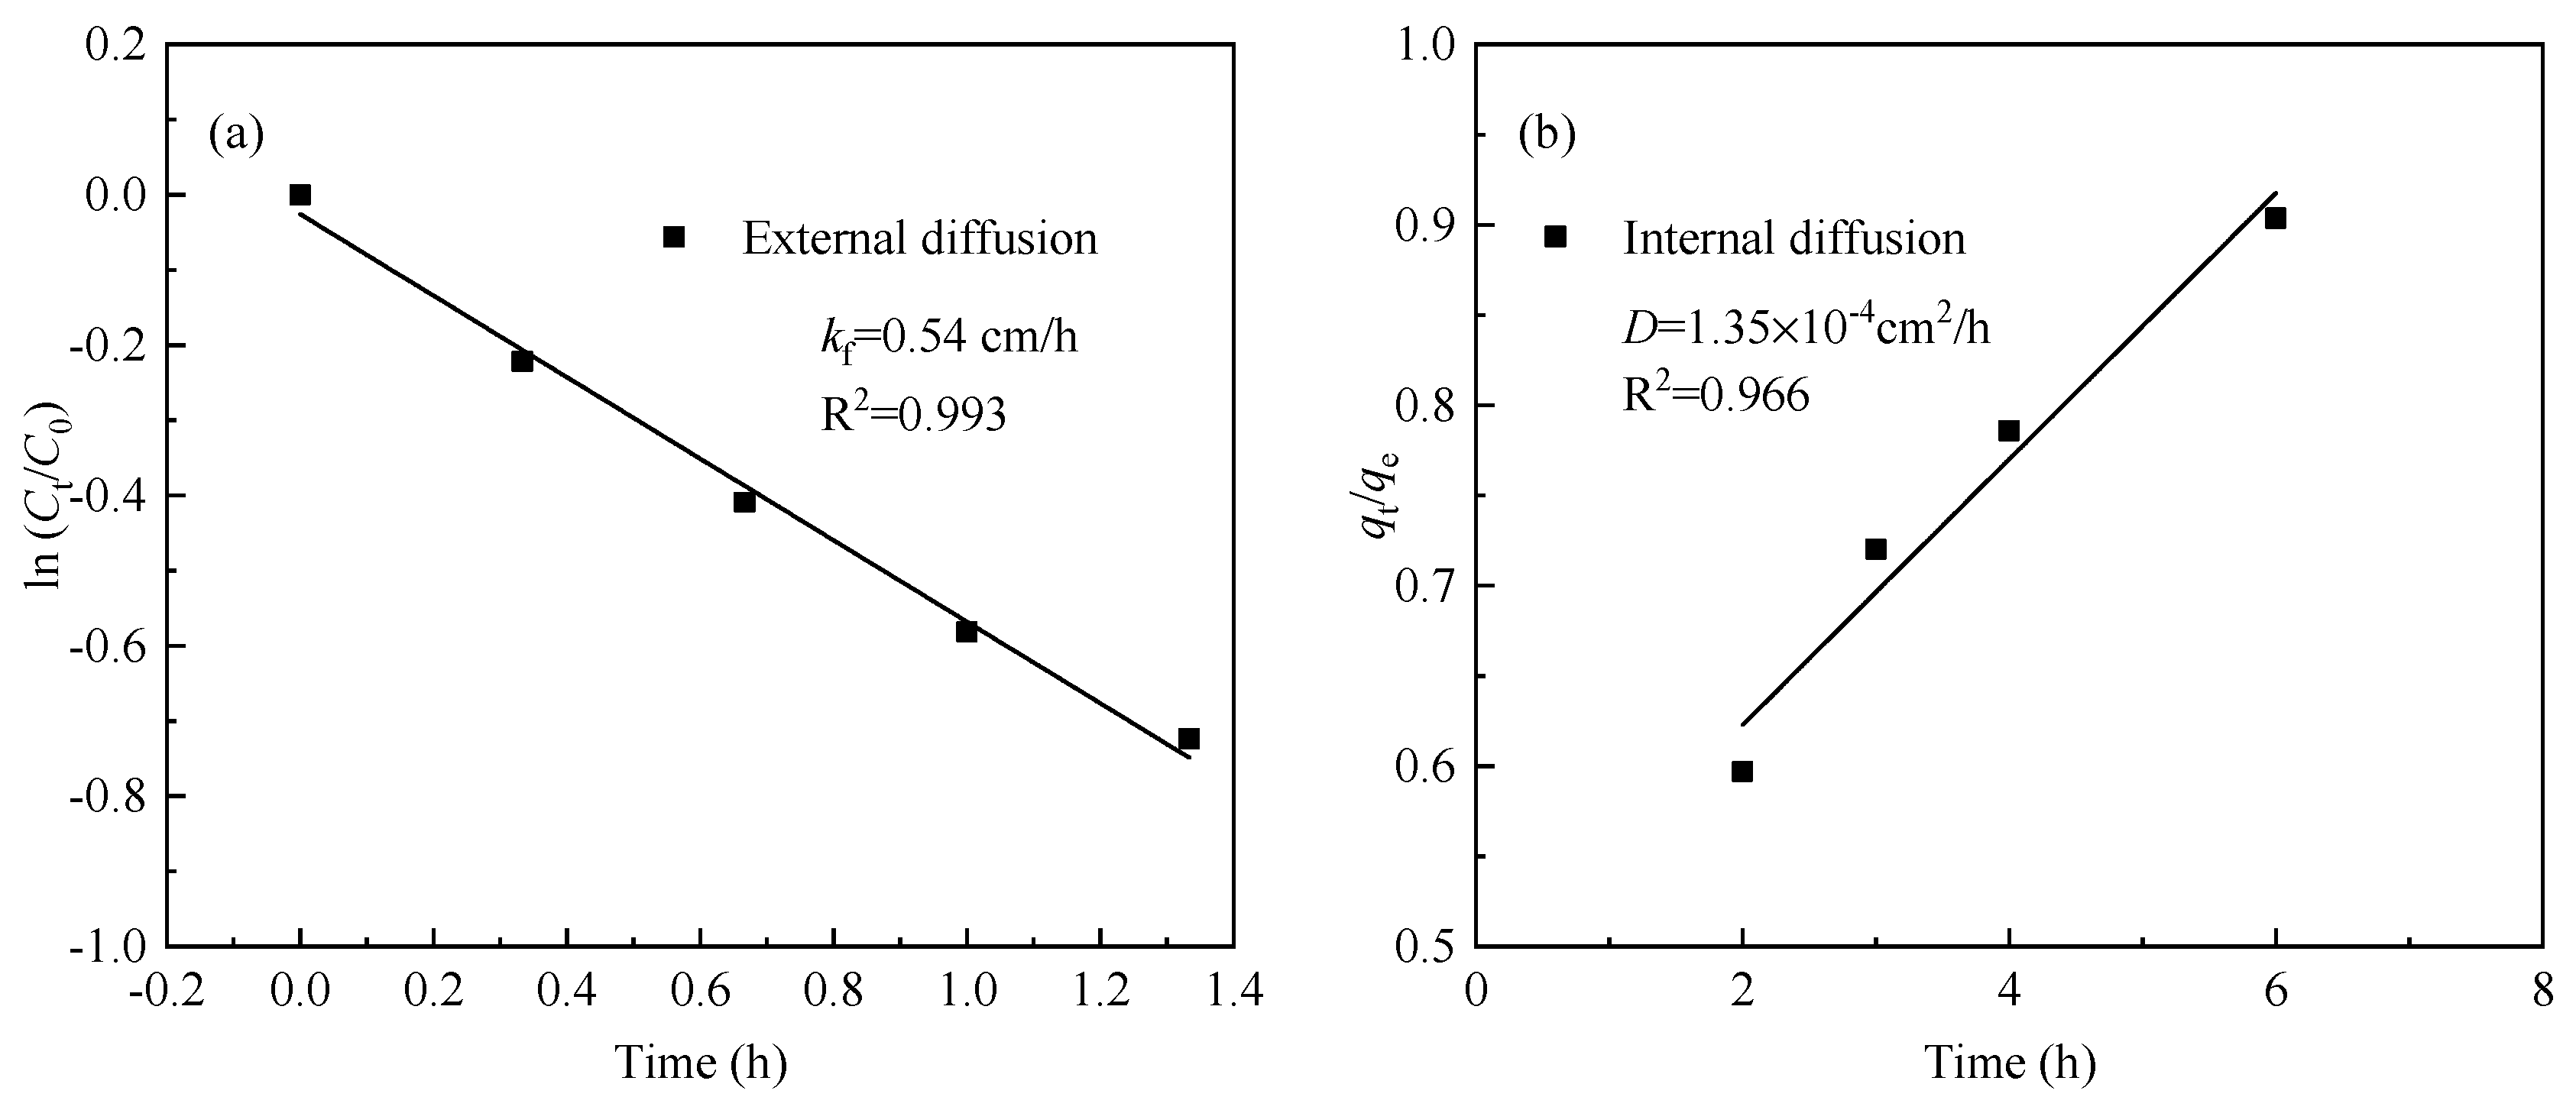
A diffusion model is used to simulate the adsorption rate of Ga adsorption onto resin A due to external diffusion, at the surface-solution boundary and internal diffusion which is the rate determining step for most cases of adsorption. From Figure 2a, the adsorption profile of Ga with 100 mg/L fell into two main regions, including the external diffusion region (0–1.3 h) and the internal diffusion region (2–6 h). According to Equations (15) and (16), the rate determining step of the resin chemical adsorption process of Ga is shown in Figure 8. The external diffusion coefficient kf and internal diffusion coefficient D were obtained, and the Biot number BN for Ga adsorption onto resin A was 400. When the value of BN is >100, indicating that the adsorption process of Ga is mainly controlled by the internal diffusion mechanism [38].
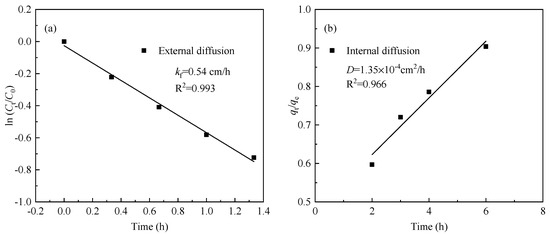
Figure 8.
External diffusion coefficient (a) and internal diffusion coefficient (b) of resin A for adsorption of Ga (L/S: 200 mL/g, C0: 100 mg/L, temperature: 55 °C, CH+: 0.1 mol/L).
3.6. Effect of Ca2+, K+, Al3+, Mg2+ and Fe2+ on Ga3+ Adsorption
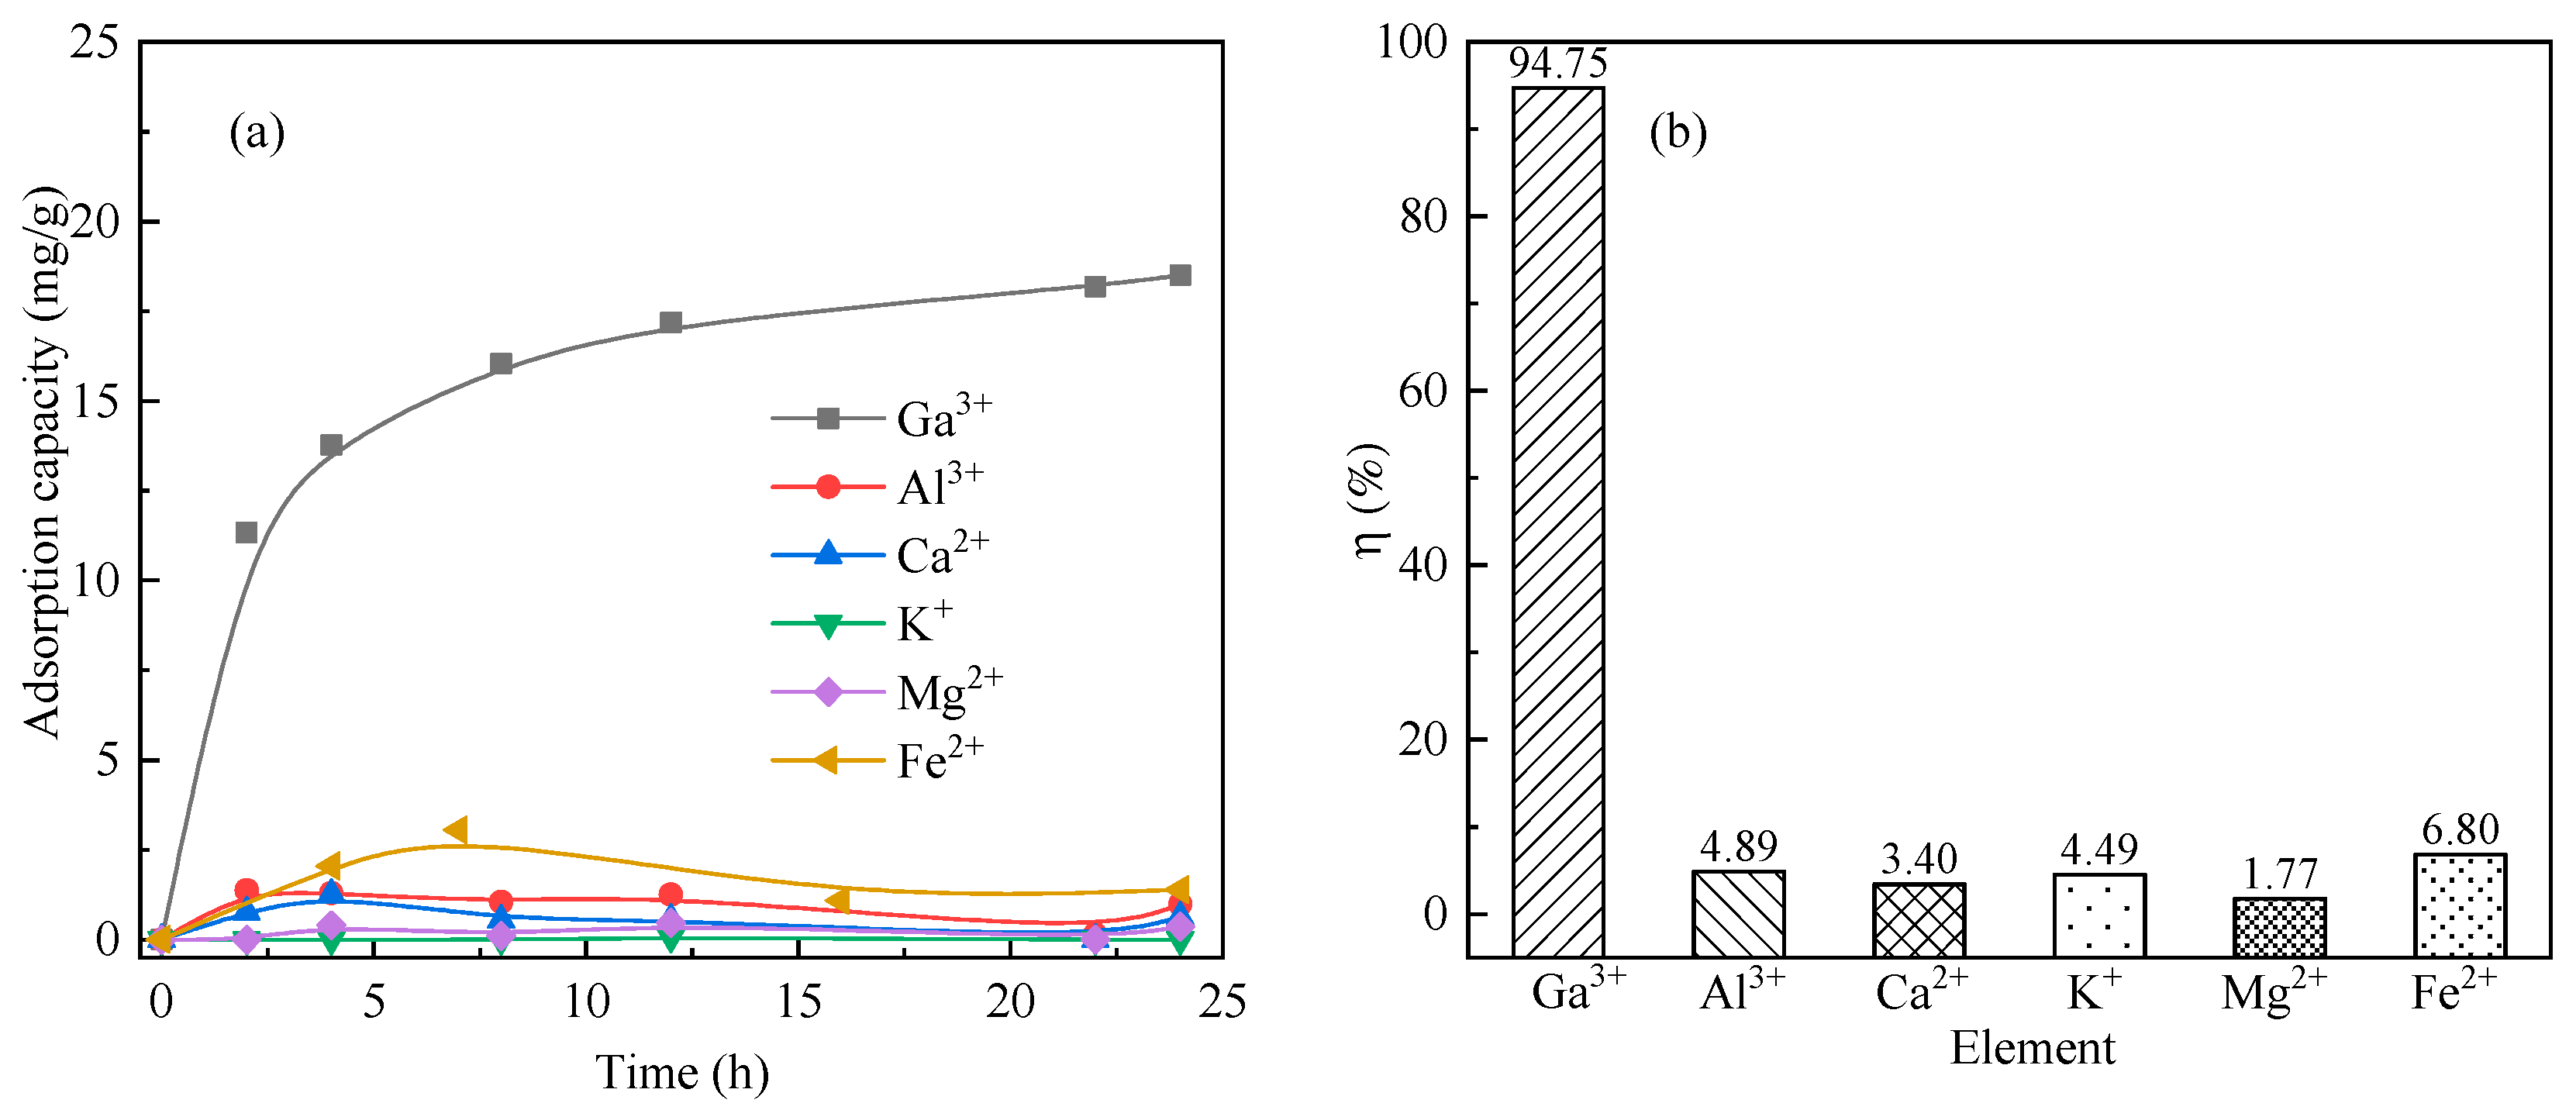
Figure 9a shows the relationship between the adsorption of metal elements and the adsorption time. The adsorption capacities of Ca2+, K+, Al3+, Mg2+ and Fe2+ did not increase with increasing time, while for Ga, it increased to 18.49 mg/g, a slightly decrease compared with the system of only Ga (21.72 mg/g) in Table 4. The adsorption capacity of Ga increases with the adsorption time, and the adsorption efficiency η reaches 94.75% in Figure 9b. However, the adsorption efficiencies of Ca2+, K+, Al3+, Mg2+ and Fe2+ were as low as 7%.
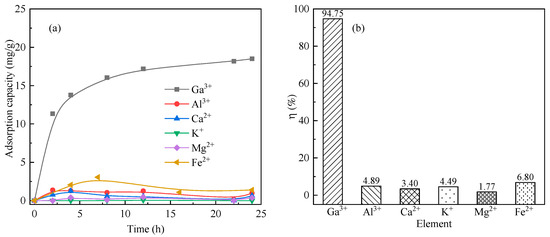
Figure 9.
Adsorption of Ga3+, Al3+, Ca2+, K+, Mg2+, and Fe2+ ions (a) adsorption capacity at different times and (b) adsorption efficiency. (L/S: 200 mL/g, C0: 100 mg/L, temperature: 55 °C, CH+: 0.1 mol/L).
The selectivity of gallium in sulfuric acid leaching solution is shown in Table 5. The distribution coefficients Kd,Me of various coexisting ions on the resin followed the order of Ga3+ >> Fe2+ > Al3+ > K+ > Ca2+ > Mg2+; the distribution coefficient Kd of Ga was 3611.36, which was 247 times that of Fe2+. In comparison with other elements, the distribution coefficient Kd,Ga of Ga is the maximum value. The larger the value of the distribution coefficient, the more the element of gallium tends to be distributed in resin A in the equilibrium state, which means that the stronger the adsorption capacity of the gallium for the resin A, the higher the affinity. The selectivity coefficient of metal ions concerning Ga was much higher than 1, indicating high selectivity between Ga and other ions. Hence, the resin A had a high selectivity to Ga with little interference from other ions, including Ca2+, K+, Al3+, Mg2+ and Fe2+. It can be used to adsorb Ga in sulfuric acid leaching solution.
Table 5.
Comparison of Ga3+, Al3+, Ca2+, K+, Mg2+, and Fe2+ ions adsorption. (L/S: 200 mL/g, temperature: 55 °C, CH+: 0.1 mol/L, time: 24 h).
3.7. Adsorption Mechanism
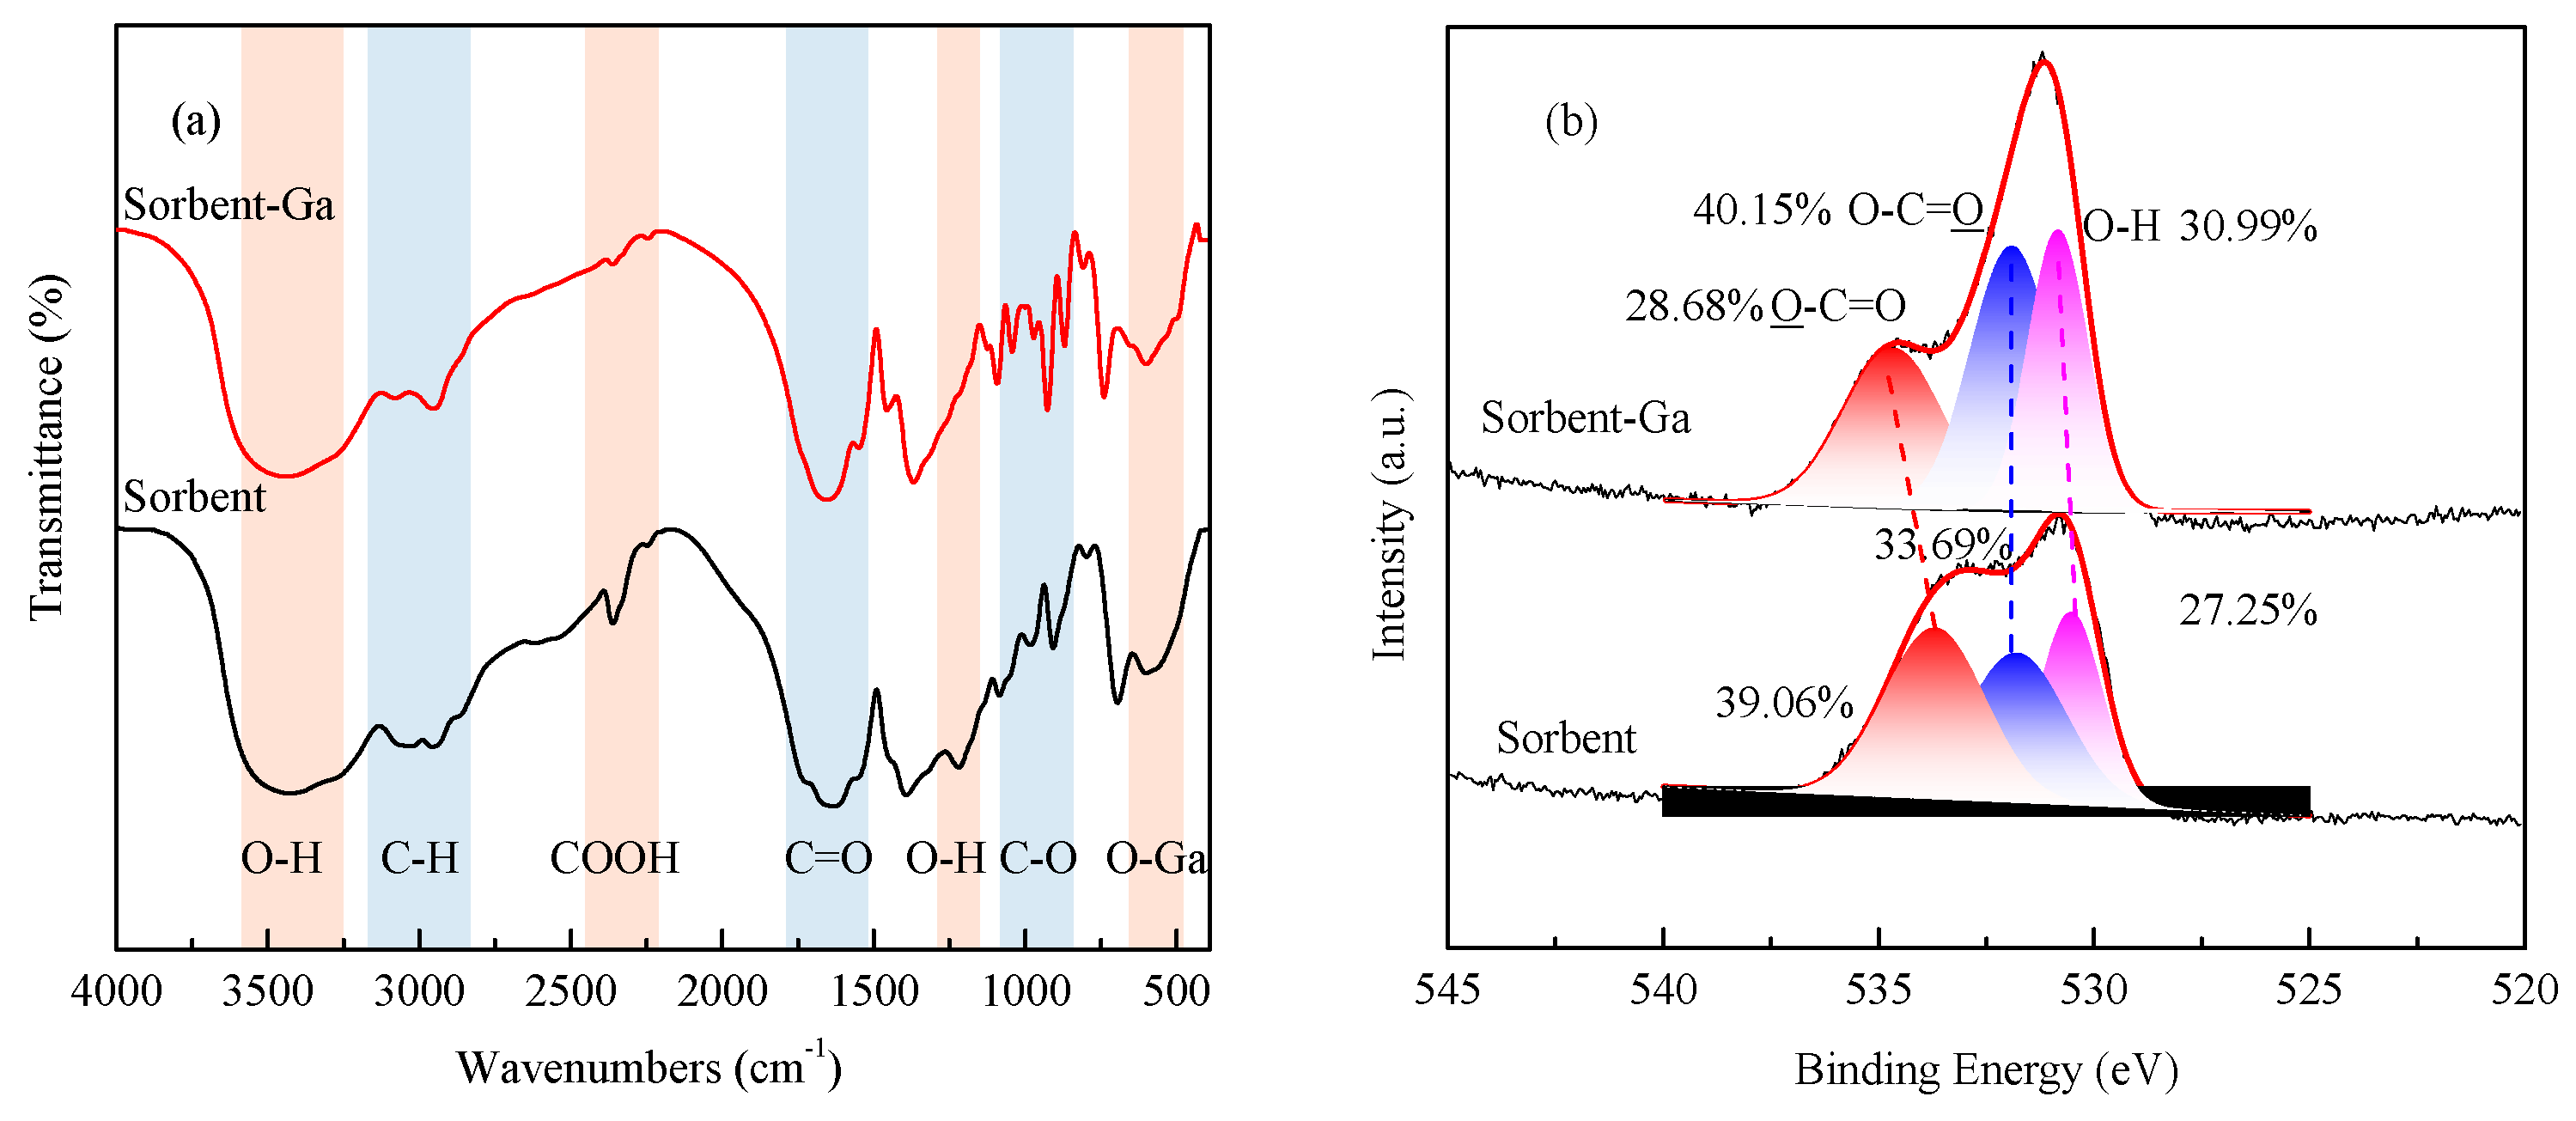
To study the organic components conversion and the functional groups of materials, FTIR and XPS spectra analysis of the resin after activation and saturated adsorption is shown in Figure 10. The four characteristic bands were usually present in IR spectra of the carboxylic acid functional group due to the asymmetric and symmetric stretching of O-H, C=O, and C-O at 3150–3300 cm−1, 1215 cm−1, 1660 cm−1, and 1045 cm−1 [39]. After saturated adsorption of Ga, the peak of the O-H and carboxylic acid functional groups weakened and even disappeared at 1215 cm−1 and 2360 cm−1. During the reaction process, the stretching vibration peak of Ga-O at 597 cm−1 appeared and gradually increased. Thus, Ga could react with the H+ ion of the -OH group and the -COOH group for ion exchange.

Figure 10.
(a) FTIR and (b) XPS spectra of the resin A sorbent after activation and saturated adsorption.
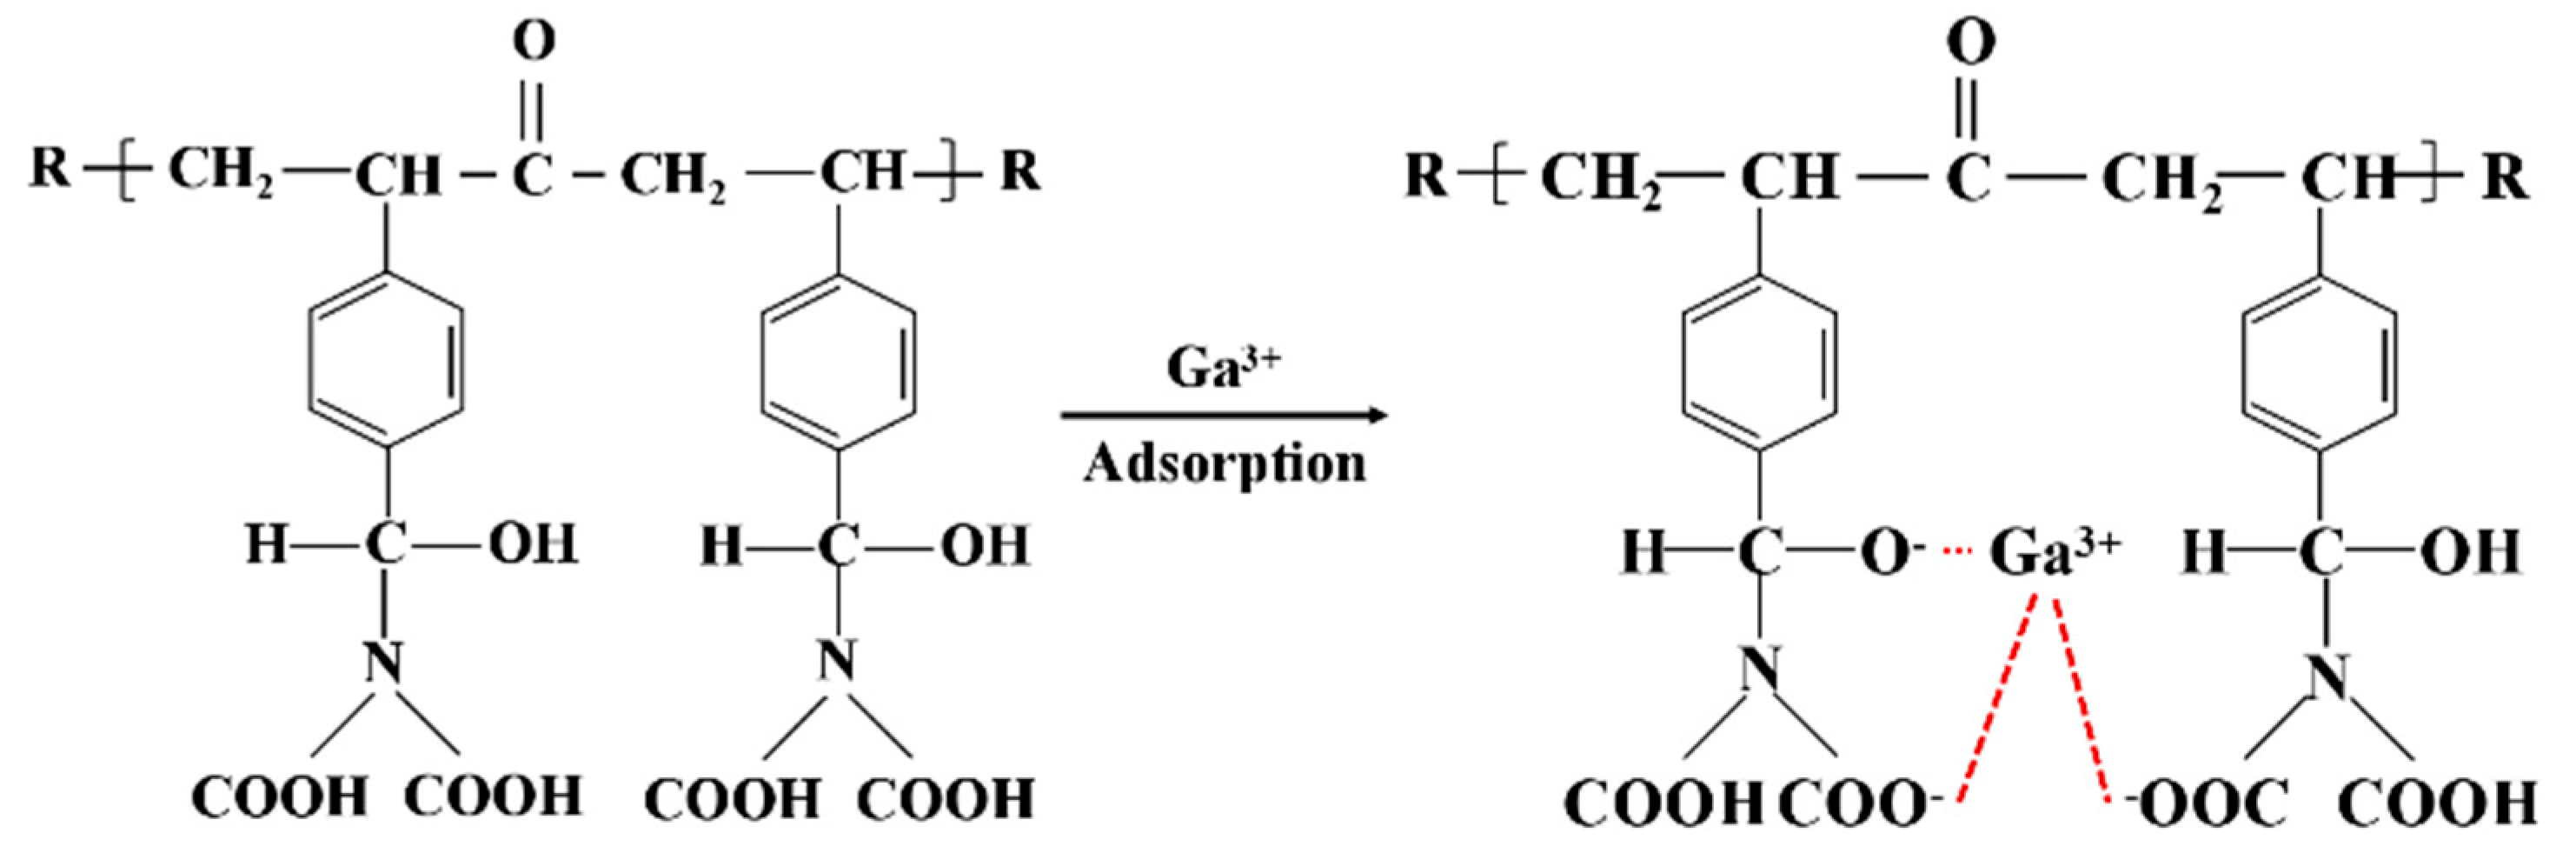
Changes in the O1s XPS spectra after activation and saturated adsorption of Ga were compared in Figure 10b. When binding energies were at 530.55, 531.80, and 533.65 eV [22], the O1s energy spectrum can be decomposed into single groups O-H, O=C, and C-O, respectively. After saturated adsorption of Ga, the C-O and O-H peaks are shifted to higher binding energies of about 0.30 eV (C-O) and 1.05 eV (O-H) in the Ga-saturated adsorption spectrum because bonding with the Ga3+ caused a reduction of the electron density of the O. Meanwhile, the peak area of O=C is higher after saturated adsorption. Because Ga could react with the H+ ion of the -OH group and the -COOH group for ion exchange and form the coordinate of a donor O atom from the carboxylic acid and hydroxyl functional group with Ga3+, the peak area of O=C increases to 40.15% and C-O decreases to 28.68%. While for the peak area of O-H, due to the protonation under strong acidic conditions, it shows an increase. So it also showed the strong electrostatic repulsion, leaving few ionized groups for binding gallium. The result is consistent with the FTIR analysis, which demonstrates that the Ga3+ reacts with the O to form O-Ga. Therefore, the adsorption mechanism of Ga on resin A in sulfuric acid solution is that the-COOH and -OH functional groups interact with Ga3+ and formed a Ga-O bond.
The adsorption reaction of Ga is given in Figure 11.
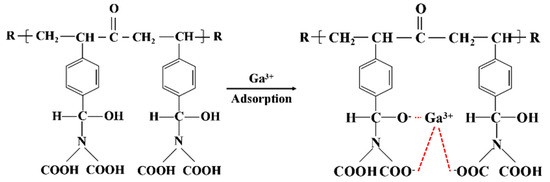
Figure 11.
Adsorption reaction of Ga on the resin in acid solution.
4. Conclusions
Resin A exhibits good adsorption capacity for Ga under the conditions of highly acidic solutions and the coexistence of various impurity elements. The optimum resin type was resin A with hydroxyl and carboxyl functional groups, and the maximum gallium adsorption capacity of the resin was 55 mg/g. The distribution coefficient Kd of Ga3+ was 3611.36 in sulfuric acid leaching solution containing various impurities, including Al3+, Ca2+, K+, Mg2+, and Fe2+ ions, at an initial acid concentration 0.1 mol/L, 55 °C for 24 h. The behavior of resin A for adsorption of Ga can be explained such that it is a single-layer adsorption controlled by chemical reaction adsorption, and the adsorption process is mainly controlled by the internal diffusion mechanism. It is speculated from the FTIR and XPS analysis that the Ga3+ may coordinate with a donor O atom from carboxylic acid and hydroxyl functional groups. This study demonstrated that carboxylic acid and hydroxyl functional groups in sulfuric acid leaching solution have excellent properties for the adsorption of Ga3+.
Author Contributions
Conceptualization, S.L. and X.H.; methodology, W.W. and Z.S.; formal analysis, Z.S.; writing—original draft preparation, W.W., C.W. and Z.S.; validation, Z.S., H.L.; writing—review and editing, S.L. and Z.M.; methodology, Z.S.; supervision, H.L.; project administration, H.L.; funding acquisition, X.H. and H.L. All authors have read and agreed to the published version of the manuscript.
Funding
This work was finally funded by financial support from the National Key Research and Development Program of China (2021YFC2902603) and the National Nature Science Foundation of China (U1810205).
Data Availability Statement
The data presented in this study are available on request from the corresponding author.
Conflicts of Interest
The authors declare no conflict of interest.
References
- Lu, F.; Xiao, T.; Lin, J.; Ning, Z.; Long, Q.; Xiao, L.; Huang, F.; Wang, W.; Xiao, Q.; Lan, X.; et al. Resources and extraction of gallium: A review. Hydrometallurgy 2017, 174, 105–115. [Google Scholar] [CrossRef]
- Banerjee, S.R.; Pomper, M.G. Clinical applications of Gallium-68. Appl. Radiat. Isot. 2013, 76, 2–13. [Google Scholar] [CrossRef] [PubMed]
- Clarkin, O.M.; Wu, B.; Cahill, P.A.; Brougham, D.F.; Banerjee, D.; Brady, S.A.; Fox, E.K.; Lally, C. Novel injectable gallium-based self-setting glass-alginate hydrogel composite for cardiovascular tissue engineering. Carbohydr. Polym. 2019, 217, 152–159. [Google Scholar] [CrossRef] [PubMed]
- Harvey, A.; Backes, C.; Gholamvand, Z.; Hanlon, D.; McAteer, D.; Nerl, H.C.; McGuire, E.; Seral-Ascaso, A.; Ramasse, Q.M.; McEvoy, N.; et al. Preparation of Gallium Sulfide Nanosheets by Liquid Exfoliation and Their Application As Hydrogen Evolution Catalysts. Chem. Mater. 2015, 27, 3483–3493. [Google Scholar] [CrossRef]
- Liu, J.; Zhang, W.; Song, D.; Ma, Q.; Zhang, L.; Zhang, H.; Zhang, L.; Wu, R. Investigation of aluminum–gallium co-doped zinc oxide targets for sputtering thin film and photovoltaic application. J. Alloys Compd. 2013, 575, 174–182. [Google Scholar] [CrossRef]
- Zhang, G.; Li, Y.; Wu, Y. pH controlled synthesis of UV excited host-sensitized luminescence in Dy3+ doped Ga2O3. J. Lumin. 2019, 212, 29–37. [Google Scholar] [CrossRef]
- Lovik, A.N.; Restrepo, E.; Muller, D.B. The global anthropogenic gallium system: Determinants of demand, supply and efficiency improvements. Environ. Sci. Technol. 2015, 49, 5704–5712. [Google Scholar] [CrossRef] [PubMed]
- Frenzel, M.; Ketris, M.P.; Seifert, T.; Gutzmer, J. On the current and future availability of gallium. Resour. Policy 2016, 47, 38–50. [Google Scholar] [CrossRef]
- Yao, Z.T.; Ji, X.S.; Sarker, P.K.; Tang, J.H.; Ge, L.Q.; Xia, M.S.; Xi, Y.Q. A comprehensive review on the applications of coal fly ash. Earth-Sci. Rev. 2015, 141, 105–121. [Google Scholar] [CrossRef]
- Du, Y.; Sun, J.; Yang, H.; Yan, L. Recovery of Gallium in the Alumina Production Process from High-Alumina Coal Fly Ash. Rare Met. Mater. Eng. 2016, 45, 1893–1897. [Google Scholar]
- Fang, Z.; Gesser, H.D. Recovery of gallium from coal fly ash. Hydrometallurgy 1996, 41, 187–200. [Google Scholar] [CrossRef]
- Ma, Z.; Zhang, S.; Zhang, H.; Cheng, F. Novel extraction of valuable metals from circulating fluidized bed-derived high-alumina fly ash by acid–alkali–based alternate method. J. Clean. Prod. 2019, 230, 302–313. [Google Scholar] [CrossRef]
- Chelgani, S.C. Investigating the occurrences of valuable trace elements in African coals as potential byproducts of coal and coal combustion products. J. Afr. Earth Sci. 2019, 150, 131–135. [Google Scholar] [CrossRef]
- Ma, Z.; Shan, X.; Cheng, F. Distribution Characteristics of Valuable Elements, Al, Li, and Ga, and Rare Earth Elements in Feed Coal, Fly Ash, and Bottom Ash from a 300 MW Circulating Fluidized Bed Boiler. ACS Omega 2019, 4, 6854–6863. [Google Scholar] [CrossRef] [PubMed]
- Liu, Y.; Guo, Z.; Wang, Y.; Chen, D.; Zhang, Y. Gallium recovery process technology in acid system. Light Met. 2018, 6, 20–24. [Google Scholar] [CrossRef]
- Zheng, F.W.; Sun, C.; Chen, F.J.; Guo-Bin, L.I.; Yi, S.U. A review of extracting alumina from fly ash. Mod. Chem. Ind. 2018, 38, 37–41. [Google Scholar] [CrossRef]
- Gong, B.; Tian, C.; Xiong, Z.; Zhao, Y.; Zhang, J. Mineral changes and trace element releases during extraction of alumina from high aluminum fly ash in Inner Mongolia, China. Int. J. Coal Geol. 2016, 166, 96–107. [Google Scholar] [CrossRef]
- Lu, F.; Xiao, T.; Lin, J.; Li, A.; Long, Q.; Huang, F.; Xiao, L.; Li, X.; Wang, J.; Xiao, Q.; et al. Recovery of gallium from Bayer red mud through acidic-leaching-ion-exchange process under normal atmospheric pressure. Hydrometallurgy 2018, 175, 124–132. [Google Scholar] [CrossRef]
- Wang, Y. Study on influence factors of leaching rate of gallium from fly ash in Jungar area. Glob. Geol. 2014, 33, 730–734. [Google Scholar]
- Wang, J.; Bao, Y.; Ma, R.; Li, Y.; Gong, L.; Zhang, Y.; Niu, Z.; Xin, B. Gallium recovery from aluminum smelting slag via a novel combined process of bioleaching and chemical methods. Hydrometallurgy 2018, 177, 140–145. [Google Scholar] [CrossRef]
- Liu, F.; Liu, Z.; Li, Y.; Wilson, B.P.; Liu, Z.; Zeng, L.; Lundström, M. Recovery and separation of gallium(III) and germanium(IV) from zinc refinery residues: Part II: Solvent extraction. Hydrometallurgy 2017, 171, 149–156. [Google Scholar] [CrossRef]
- Zhou, X.; Zhang, Z.; Kuang, S.; Li, Y.; Ma, Y.; Li, Y.; Liao, W. Recovery of Ga(III) from chloride solutions by solvent extraction with Cextrant 230. Hydrometallurgy 2019, 185, 76–81. [Google Scholar] [CrossRef]
- Zhao, Z.; Yang, Y.; Xiao, Y.; Fan, Y. Recovery of gallium from Bayer liquor: A review. Hydrometallurgy 2012, 125–126, 115–124. [Google Scholar] [CrossRef]
- Zhang, K.; Liu, Z.; Liu, Y.; Cao, H.; Zhu, W. Recovery of gallium from strong acidic sulphate leach solutions of zinc refinery residues using a novel phosphate ester extractant. Hydrometallurgy 2019, 185, 250–256. [Google Scholar] [CrossRef]
- Li, S.; Wu, W.; Li, H.; Hou, X. The direct adsorption of low concentration gallium from fly ash. Sep. Sci. Technol. 2015, 51, 395–402. [Google Scholar] [CrossRef]
- Lu, S.; Chen, L.; Hamza, M.F.; He, C.; Wang, X.; Wei, Y.; Guibal, E. Amidoxime functionalization of a poly(acrylonitrile)/silica composite for the sorption of Ga(III)—Application to the treatment of Bayer liquor. Chem. Eng. J. 2019, 368, 459–473. [Google Scholar] [CrossRef]
- Selvi, P.; Ramasami, M.; Samuel, M.H.P.; Adaikkalam, P.; Srinivasan, G.N. Recovery of Gallium from Bayer Liquor Using Chelating Resins in Fixed-Bed Columns. Ind. Eng. Chem. Res. 2004, 43, 2216–2221. [Google Scholar] [CrossRef]
- Zhao, Z.; Li, X.; Chai, Y.; Hua, Z.; Xiao, Y.; Yang, Y. Adsorption Performances and Mechanisms of Amidoxime Resin toward Gallium(III) and Vanadium(V) from Bayer Liquor. ACS Sustain. Chem. Eng. 2015, 4, 53–59. [Google Scholar] [CrossRef]
- Massoud, A.; Mahmoud, H.H. Evaluation of Hybrid Polymeric Resin Containing Nanoparticles of Iron Oxide for Selective Separation of In(III) from Ga(III). J. Inorg. Organomet. Polym. Mater. 2017, 27, 1806–1815. [Google Scholar] [CrossRef]
- Xiong, Y.; Cui, X.; Wang, D.; Wang, Y.; Lou, Z.; Shan, W.; Fan, Y. Diethanolamine functionalized rice husk for highly efficient recovery of gallium(III) from solution and a mechanism study. Mater. Sci. Eng. C Mater. Biol. Appl. 2019, 99, 1115–1122. [Google Scholar] [CrossRef] [PubMed]
- Meng, J.J.; He, C.L.; Li, Y.J.; Zhou, J.; Li, J.; Zheng, C.H.; Zhao, J.; Fujita, T.; Ning, S.Y.; Wei, Y.Z. Enhanced adsorption and separation of gallium using silica-based P507-TBP/SiO2–P adsorbent from sulfuric acid solution. Microp. Mesoporous Mater. 2021, 314, 110859. [Google Scholar] [CrossRef]
- Liu, J.S.; Chen, H.; Chen, X.Y.; Guo, Z.L.; Hu, Y.C.; Liu, C.P.; Sun, Y.Z. Extraction and separation of In(III), Ga(III) and Zn(II) from sulfate solution using extraction resin. Hydrometallurgy 2006, 82, 137–143. [Google Scholar] [CrossRef]
- Zhang, Y.; Zhu, L.; Wang, Y.; Lou, Z.; Shan, W.; Xiong, Y.; Fan, Y. Preparation of a biomass adsorbent for gallium(III) based on corn stalk modified by iminodiacetic acid. J. Taiwan Inst. Chem. Eng. 2018, 91, 291–298. [Google Scholar] [CrossRef]
- Chatterjee, A.; Schiewer, S. Multi-resistance kinetic models for biosorption of Cd by raw and immobilized citrus peels in batch and packed-bed columns. Chem. Eng. J. 2014, 244, 105–116. [Google Scholar] [CrossRef]
- Ezzati, R.; Ezzati, S.; Azizi, M. Exact solution of the Langmuir rate equation: New Insights into pseudo-first-order and pseudo-second-order kinetics models for adsorption. Vacuum 2024, 220, 112790. [Google Scholar] [CrossRef]
- Elwakeel, K.Z.; El-Bindary, A.A.; Kouta, E.Y.; Guibal, E. Functionalization of polyacrylonitrile/Na-Y-zeolite composite with amidoxime groups for the sorption of Cu(II), Cd(II) and Pb(II) metal ions. Chem. Eng. J. 2018, 332, 727–736. [Google Scholar] [CrossRef]
- Guibal, E.; Milot, C.; Tobin, J.M. Metal-anion sorption by chitosan beads: Equilibrium and kinetics studies. Ind. Eng. Chem. Res. 1998, 37, 1454–1463. [Google Scholar] [CrossRef]
- Yu, L.L.; Jiang, L.N.; Wang, S.Y.; Sun, M.M.; Li, D.Q.; Du, G.M. Pectin microgel particles as high adsorption rate material for methylene blue: Performance, equilibrium, kinetic, mechanism and regeneration studies. Int. J. Biol. Macromol. 2018, 112, 383–389. [Google Scholar] [CrossRef] [PubMed]
- Long, H.; Zhao, Z.; Chai, Y.; Li, X.; Hua, Z.; Xiao, Y.; Yang, Y. Binding Mechanism of the Amidoxime Functional Group on Chelating Resins toward Gallium(III) in Bayer Liquor. Ind. Eng. Chem. Res. 2015, 54, 8025–8030. [Google Scholar] [CrossRef]


Disclaimer/Publisher’s Note: The statements, opinions and data contained in all publications are solely those of the individual author(s) and contributor(s) and not of MDPI and/or the editor(s). MDPI and/or the editor(s) disclaim responsibility for any injury to people or property resulting from any ideas, methods, instructions or products referred to in the content. |
© 2025 by the authors. Licensee MDPI, Basel, Switzerland. This article is an open access article distributed under the terms and conditions of the Creative Commons Attribution (CC BY) license (https://creativecommons.org/licenses/by/4.0/).