Article

Kinetic, Isotherm, and Thermodynamic Modeling of Methylene Blue Adsorption Using Natural Rice Husk: A Sustainable Approach

1
Department of Health Management and Enhancement, Open University of Kaohsiung, No. 436, Daye North Rd., Siaogang District, Kaohsiung City 81249, Taiwan
2
Department of Medical Science and Biotechnology, I-Shou University, No. 8, Yida Rd., Jiaosu Village, Yanchao District, Kaohsiung City 82445, Taiwan
*
Author to whom correspondence should be addressed.
Separations 2025, 12(8), 189; https://doi.org/10.3390/separations12080189
Submission received: 22 June 2025 / Revised: 11 July 2025 / Accepted: 16 July 2025 / Published: 22 July 2025
(This article belongs to the Section Environmental Separations)

Abstract

The discharge of synthetic dyes in industrial wastewaters poses a serious environmental threat as they are difficult to degrade naturally and are harmful to aquatic organisms. This study aimed to evaluate the feasibility of using clean untreated rice husk (CRH) as a sustainable and low-cost adsorbent for the removal of methylene blue (MB) from synthetic wastewater. This approach effectively avoids the energy-intensive grinding process by directly using whole unprocessed rice husk, highlighting its potential as a sustainable and cost-effective alternative to activated carbon. A series of batch adsorption experiments were conducted to evaluate the effects of key operating parameters such as initial dye concentration, contact time, pH, ionic strength, and temperature on the adsorption performance. Adsorption kinetics, isotherm models, and thermodynamic analysis were applied to elucidate the adsorption mechanism and behavior. The results showed that the maximum adsorption capacity of CRH for MB was 5.72 mg/g. The adsorption capacity was stable and efficient between pH 4 and 10, and reached the highest value at pH 12. The presence of sodium ions (Na+) and calcium ions (Ca2+) inhibited the adsorption efficiency, with calcium ions having a more significant effect. Kinetic analysis confirmed that the adsorption process mainly followed a pseudo-second-order model, suggesting the involvement of a chemisorption mechanism; notably, in the presence of ions, the Elovich model provided better predictions of the data. Thermodynamic evaluation showed that the adsorption was endothermic (ΔH° > 0) and spontaneous (ΔG° < 0), accompanied by an increase in the disorder of the solid–liquid interface (ΔS° > 0). The calculated activation energy (Ea) was 17.42 kJ/mol, further supporting the involvement of chemisorption. The equilibrium adsorption data were well matched to the Langmuir model at high concentrations (monolayer adsorption), while they were accurately described by the Freundlich model at lower concentrations (surface heterogeneity). The dimensionless separation factor (RL) confirmed that the adsorption process was favorable at all initial MB concentrations. The results of this study provide insights into the application of agricultural waste in environmental remediation and highlight the potential of untreated whole rice husk as a sustainable and economically viable alternative to activated carbon, which can help promote resource recovery and pollution control.

1. Introduction

Although dyes have been utilized since antiquity, the development of synthetic dyes did not emerge until the 19th century [1]. These dyes, more affordable and easier to produce than natural dyes, rapidly became widespread in industries such as food, rubber, leather, printing, and textiles [2]. However, the dyeing process generates significant amounts of wastewater containing residual dyes. This effluent poses a major environmental threat, as it can contain toxic chemicals harmful to aquatic life and other organisms. Moreover, these dyes can obstruct sunlight, inhibit photosynthesis, and cause toxicity and mortality in aquatic organisms [3]. Furthermore, most synthetic dyes are resistant to natural degradation and persist in the environment.
The increasing global population has led to a growing demand for clean water. Therefore, the efficient removal of water contaminants, particularly dyes from industrial effluents, is a critical environmental priority. A range of technologies have been developed for dye removal from wastewater, broadly categorized based on their underlying mechanisms into physical, chemical, and biological methods [4,5,6]. Among the diverse techniques available for pollutant removal from wastewater, adsorption stands out as a frequently employed technology due to its simplicity, effectiveness, and versatility. Adsorption, a surface phenomenon, involves the transfer of a substance (adsorbate) from a fluid phase (liquid or gas) to a solid surface (adsorbent). Activated carbon is frequently considered for this process. The adsorbent serves as the material that facilitates adsorption. The primary factor influencing the selection of adsorbents is the efficiency of adsorption. Other notable considerations include the cost of the adsorbent and its environmental impact. There are many adsorbents that meet some of the aforementioned requirements. Activated carbon is frequently considered an adsorbent, but its high cost limits its application. As a result, researchers are actively seeking adsorbents that fulfill the aforementioned criteria. Biosorbents, a promising category of adsorbents, are derived from agricultural by-product waste, food processing waste, or naturally abundant and low-cost materials. Biosorbents are more economically viable and environmentally friendly than activated carbon. Biosorbents, particularly those derived from agricultural waste, have emerged as a promising category due to their abundance, renewability, non-toxicity, and simple pretreatment requirements. The following provides a succinct overview of diverse biosorbents and their potential applications in the field of wastewater treatment: Azolla pinnata [7]; fava bean peel waste [8]; pomelo fruit peel [9]; Banana Peels [10]; particulate durian peel waste [11]; Black Tea Wastes [12]; orange peel [13]; hazelnut shell [14]; lignocellulosic biosorbent of sunflower stem-pith [15]; Atemoya Peel [16] and palm spathe [17]. The potential of agricultural residues as adsorbents for dye removal is evidenced by the high removal efficiency obtained in these experimental trials. This discovery lends support to the feasibility of employing agricultural residues in the process of dye removal.
Taiwan, where rice is a dietary staple, generates an estimated 1,300,000 tons of rice husks annually [18]. Compositional analysis of rice husks indicates that they comprise approximately 8.11% water, 21.44% lignin, 32.24% cellulose, 21.34% hemicellulose, 1.82% extractives, and 15.05% mineral ash, with SiO2 being the predominant mineral component [19]. These components, especially lignin and cellulose, contain functional groups such as hydroxyl and carboxyl groups that can contribute to dye adsorption. Therefore, rice husk is a prominent, abundant, and readily available resource in Taiwan, making it a valuable and locally sourced adsorbent. The selection of rice husk in this study is not only based on its low cost and sustainability, but also on its unique advantage of local abundance and substantial reserves in Taiwan, aligning with both economic and environmental protection goals.
This research aims to assess the viability of using whole clean rice husk (CRH) as a cost-effective adsorbent for removing methylene blue (MB) from synthetic wastewater under varying initial dye concentrations, contact times, pH levels, ion concentrations, and temperatures. Furthermore, it interprets the adsorption data to clarify the underlying mechanism governing MB uptake onto CRH. Adsorption isotherm and kinetic models were employed to systematically analyze the experimental results and elucidate the biosorption process. Batch adsorption parameters, encompassing both kinetic and equilibrium aspects, were determined and analyzed by fitting to diverse models for a comprehensive description of the behavior of MB’s absorption onto CRH. The kinetic and equilibrium parameters obtained in this study offer critical insights into the adsorption rate and underlying mechanism of MB removal using CRH. By investigating the feasibility of utilizing unprocessed whole rice husk as an adsorbent, this work not only minimizes energy consumption associated with mechanical grinding but also presents a more sustainable strategy for dye removal. Furthermore, it highlights the potential of agricultural byproducts as cost-effective and efficient biosorbents for wastewater treatment. This research thus contributes to both environmental sustainability and resource optimization, particularly within the framework of Taiwan’s agricultural sector.

2. Materials and Methods

2.1. Preparation of Adsorbent

In this research, untreated rice husk was sourced from local rice mills in Taiwan. The collected rice husk underwent thorough washing with distilled water several times until the water used for rinsing ran clear, removing soluble contaminants and surface residues. Following this, the rice husk was further rinsed with reverse-osmosis (RO) water and then dried overnight in an oven at 358.15 ± 5 K (85 ± 5 °C). The dried clean rice husk (CRH) was then securely stored in airtight plastic containers for subsequent experimental applications [20].

2.2. Preparation of Dye Solution

In this investigation, methylene blue (MB) was selected as the model adsorbate, characterized by the molecular formula C16H18N3SCl and a molecular weight of 373.9 g/mol. A 1000 mg/L stock solution was prepared by dissolving a precisely weighed amount of MB in distilled water. Working solutions with varying concentrations were then obtained through serial dilution of the stock solution using reverse-osmosis (RO) water. To maintain experimental consistency and ensure data reliability, all reagents and chemicals used in this study were of analytical grade.

2.3. Batch Adsorption Experiments

To examine the impact of the initial methylene blue (MB) concentration, experiments were conducted using initial MB concentrations ranging from 10 to 100 mg/L at 298.15 K. These solutions were agitated in 500 mL bottles containing 100 mL of MB solution and 2 g of CRH at the natural pH of the dye solution (approximately pH 5.5), while maintaining a shaking speed of 125 rpm. The influence of pH on the adsorption processes was investigated by adjusting the initial pH of the solutions from 2 to 12 with 0.1 N HCl and 0.1 N NaOH solutions. At 298.15 K, 100 mL of a 50 mg/L MB solution and 2 g of CRH were agitated in a 500 mL bottle at 125 rpm. To study the influence of temperature on the adsorption processes, experiments were conducted at 278.15 K, 298.15 K, 308.15 K, and 323.15 K. This was achieved by agitating a mixture of 100 mL of a fixed initial concentration (50 mg L−1) of MB solution and 2 g of CRH in a 500 mL bottle using a temperature-controlled shaker operating at 125 rpm. Furthermore, to investigate the impact of salt concentration, adsorption processes were carried out using NaCl solutions of 0, 0.05, and 1 mol L−1 at the natural pH of the dye solution (approximately pH 5.5). A 100 mL solution of methylene blue (MB) at an initial concentration of 50 mg/L was mixed with 2 g of CRH in a 500 mL bottle and agitated at 125 rpm and 298.15 K. At predetermined time intervals, samples were withdrawn from the shaker, followed by filtration to remove solid particles. The residual MB concentration at time t was quantified based on absorbance measurements using a UV-Vis spectrophotometer (Hitachi U-1800, Tokyo, Japan) at 660 nm, which corresponds to the maximum absorbance wavelength of MB [20]. Equations (1) and (2) were used to calculate the amount of MB adsorbed at a given time (qt, mg g−1) and at equilibrium (qe, mg g−1), respectively [20]:
q t   =   C i C t V M
q e = C i C e V M
The mathematical expressions presented in this study incorporate various parameters to describe the adsorption process. Specifically, Ci, Ct, and Ce denote the initial, time-dependent, and equilibrium concentrations of methylene blue (MB) in the aqueous phase, expressed in milligrams per liter (mg/L). Meanwhile, V and M represent the volume of the MB solution (L) and the mass of the dry adsorbent (g), respectively.

2.4. Kinetics of Adsorption

To examine the correlations between the adsorption rate and the underlying mechanisms of methylene blue (MB) adsorption on CRH, different adsorption kinetics models were investigated [21]. The experimental data derived from experiments on the batch absorption of methylene blue (MB) onto CRH were analyzed using three distinct kinetic models. These models included the pseudo-first-order kinetic equation, the pseudo-second-order kinetic equation, and the Elovich equation.

2.4.1. Pseudo-First-Order Kinetic Model

The pseudo-first-order kinetic equation for solid–liquid sorption systems is represented as follows [20,22,23,24]:
log ( q e q t ) = log ( q e ) K 1 2.303 t
Within the pseudo-first-order kinetic model, the rate constant is denoted as K1 (min−1), while the parameters qt, qe, and t have been previously defined. The values of K1 and qe are derived from the slope and intercept, respectively, of the linear plot of log(qeqt) versus t.

2.4.2. Pseudo-Second-Order Kinetic Model

The pseudo-second-order kinetics model was first introduced by Ho in 1995, as per the existing literature [25]. This equation has since been widely utilized in multiple studies involving the kinetics of contaminant adsorption experiments. In the case of the adsorption of MB onto CRH, the model offers insights into the interaction mechanism between the adsorption agent and the adsorbent [26]. The pseudo-second-order kinetic model can be formally defined as follows [27]:
t q t = 1 K 2 q e 2 + 1 q e t
The definition of the initial sorption rate, h (mg/gmin), is as follows:
h = K 2 q e 2
Equation (5) becomes the following:
t q t = 1 h + 1 q e t
When plotting t/qt against t using Equation (6), a straight line is obtained with an intercept of 1/h and a slope of 1/qe.

2.4.3. Elovich Model

To characterize the heterogeneity of the biosorbent active sites and the adsorption behavior of MB on CRH, the Elovich equation was applied in this study. The primary objective was to ascertain whether the adsorption of MB on the CRH surface transpired without desorption, and whether the surface coverage exhibited an increase while the adsorption rate gradually decreased over time. Furthermore, the Elovich equation was used to investigate the distribution of heterogeneous adsorption sites on CRH [28]. The Elovich kinetic model can be expressed in its integrated form as follows [29,30]:
q t = 1 β ln ( α β ) + 1 β ln ( t )
As defined earlier, qt and t represent the amount of MB adsorbed at a specific time t and the time variable, respectively, while β denotes the desorption constant (g·mg−1). A plot of qt against ln(t) yields a linear correlation. The slope of this plot corresponds to (1/β), with the intercept being equal to (1/β) multiplied by ln(α·β).

2.5. Adsorption Isotherms

A mathematical equation that can express the equilibrium state between the amount of MB adsorbed on a solid phase (qe) and the residual MB concentration in the liquid phase (Ce) is called an adsorption isotherm [31]. The adsorption isotherm provides crucial information for comprehending the practical design and operation of adsorption systems. A broad range of isothermal equations has been developed over the years to delineate the equilibrium attributes of adsorption. In the present investigation, the experimental data were analyzed using Langmuir, Freundlich, and Temkin isotherms to evaluate the impact of each model and determine the associated isotherm parameters.

2.5.1. Langmuir Isotherm

The equation for the Langmuir isotherm can be expressed as stated in reference [32,33,34]:
C e q e = 1 K L q max + C e q max
In the context previously described, Ce represents the equilibrium concentration of MB in the solution (expressed in milligrams per liter), while qe indicates the amount of MB adsorbed onto the solid phase at equilibrium (measured in milligrams per gram). Additionally, qmax denotes the maximum adsorption capacity that can be attained at equilibrium (also in milligrams per gram), and KL refers to the adsorption equilibrium constant (measured in liters per milligram).
As previously discussed, the relationship between the equilibrium concentration of the dye in the bulk solution (Ce) and the amount of dye adsorbed onto the adsorbent (qe) can be described by a linear plot of Ce/qe against Ce. The slope of this plot is 1/qmax and the intercept is 1/(KLqmax). To further evaluate the nature of the adsorption process, a dimensionless constant, known as the separation factor “RL” was introduced by Webber and Chakravorti. The RL value is determined using the initial dye concentration in the liquid phase (Ci), measured in milligrams per liter (mg/L), and the previously defined adsorption equilibrium constant (KL) [32].
R L = 1 1 + k L C i
Based on the calculated RL value, four possibilities for the adsorption process are identified: (i) favorable adsorption when 0 < RL < 1, (ii) unfavorable adsorption when RL > 1, (iii) linear adsorption when RL = 1, and (iv) irreversible adsorption when RL = 0 [35].

2.5.2. Freundlich Isotherm

The Freundlich empirical isotherm equation, which fits the experimental data satisfactorily, is given by the following [20,32,33,36]:
ln q e = ln k F + 1 n ln C e
In the equation, qe and Ce represent the quantity of the adsorbate adsorbed and the equilibrium concentration of the adsorbate in the bulk solution, respectively, as described earlier. The Freundlich model introduces two constants, KF and n, which indicate the relative adsorption capacity of the adsorbent and the intensity of adsorption, respectively.
Consequently, plotting the natural logarithm of qe against the natural logarithm of Ce results in a linear relationship with a slope of 1/n and an intercept of ln KF.

2.5.3. Temkin Isotherm

The Temkin isotherm model is generally expressed as shown in Equation (11), as cited in the specified reference [37]:
q e = R T B T ln A T + R T B T ln C e
This equation features various parameters such as qe, Ce, BT, AT, R, and T. In the equation, qe and Ce are as defined previously. The Temkin constant, also known as BT, is associated with adsorption heat and is expressed in units of J·mol−1. The Temkin isotherm constant, AT, is expressed in units of L·g−1. The universal gas constant, R, is approximately 8.314 J·mol−1·K−1, and T represents the temperature in Kelvin.

3. Results and Discussion

3.1. Effect of MB Initial Concentration

3.1.1. Effect of MB Initial Concentration on Dye Adsorption

Natural waste materials used in adsorption experiments are often ground into fine particles before being used to absorb dyes. This grinding process is energy-intensive. To reduce energy consumption, this study utilized rice husks as adsorbents without any grinding after being washed and dried. Adsorption tests typically first examine the effects of time and adsorbate concentration. Figure 1 shows the impacts of time and dye concentration on adsorption. The data indicate that higher initial concentrations of MB led to a more rapid attainment of adsorption equilibrium. The initial dye concentration affects the initial rate of adsorption and the time required to reach equilibrium. Higher concentrations result in a faster initial adsorption rate and higher equilibrium capacity. While the rate of approach to equilibrium is faster, the time to reach equilibrium for the maximum capacity at higher concentrations may not necessarily be shorter. This behavior can be explained by the mass transfer driving force concept, where a higher initial dye concentration creates a stronger driving force for adsorption [38]. The initial dye concentration serves as a key driving force that mitigates the mass transfer resistance between the solid and liquid phases. This driving force for adsorption arises from the concentration gradient of the dye between the liquid and solid phases. When the initial dye concentration is higher, there is a greater difference in concentration between the two phases, which leads to a faster rate of adsorption. Additionally, higher initial dye concentrations provide more dye molecules available for adsorption. Increased initial dye concentrations provide more dye molecules for adsorption onto the rice husk surface. This results in a greater amount of dye being adsorbed [39].

3.1.2. Effect of MB Initial Concentration on Adsorption Kinetics

Adsorption kinetic models provide valuable insights into equilibrium uptake and elucidate the mechanisms governing adsorbate binding. The present study conducted experiments at ambient temperature and natural pH. Several kinetic equations, including pseudo-first-order, pseudo-second-order, and Elovich models, were employed to examine the kinetics of MB adsorption onto CRH. The Linearized forms of these models were applied to examine the adsorption rate of methylene blue (MB) and explore the potential stages involved in the uptake process. Fitting the experimental data to these kinetic models enabled the determination of parameters related to the adsorption mechanism, rate-controlling steps, and kinetics of MB binding to the CRH adsorbent [40]. The simulated trend lines (Figure 1) and the low R2 values presented in Table 1 suggest that the pseudo-first-order kinetic model fails to provide an accurate representation of the experimental data.
The pseudo-second-order model is predicated on the assumption that adsorption adheres to pseudo-second-order kinetics, where the rate is directly proportional to the square of the unoccupied site density. Model calculations indicate that equilibrium adsorption capacities (qe) closely match experimental values across the examined initial MB concentrations. Linear regression of t/qt versus t produces excellent fits (R2 ≈ 1), signifying the model’s precision in characterizing adsorption behavior. The concentration of methylene blue has a profound impact on the adsorption capacity and rate. As the initial concentration increases, both the rate of adsorption and the equilibrium adsorption capacity increase. This trend is consistent with adsorption kinetics principles: a higher concentration gradient accelerates the diffusion of adsorbate molecules to the adsorbent surface, enhancing adsorption. The pseudo-second-order rate constants (k2) denote the rate at which the adsorption reaction occurs, with higher values indicating a faster adsorption rate. Comparative analysis of the pseudo-second-order rate constants (k2) at different MB concentrations allowed for evaluation of the initial concentration’s impact on the adsorption rate. The values of k2 declined with increasing initial MB concentrations, suggesting that the overall reaction rate constant per available site decreased, possibly due to the increasing influence of mass transfer resistance at higher concentrations or changes in the rate-limiting step. Higher MB levels hastened site saturation. The initial adsorption rate (h) increased with increasing concentration and then decreased with increasing concentration. The increase in the initial adsorption rate can be attributed to the higher initial concentration providing more reactants, thereby promoting the adsorption process. However, when the concentration continued to increase and the initial adsorption rate decreased, factors such as adsorption site saturation or competitive adsorption may have been at play. The good agreement between the experimental qe and calculated qe indicates that the system closely adheres to pseudo-second-order kinetics. The model captures the k2 and h dependence on initial adsorbate concentration. Overall, the pseudo-second-order model excellently describes the kinetics across the concentration range studied for this rice husk–MB system. The model’s conformity to assumptions and the quality of the fit parameters support the idea of a chemisorption mechanism involving valency forces through electron sharing or exchange between the adsorbent and adsorbate [41].
Experimental data indicate that qt increases with ln(t) for all initial MB concentrations, suggesting consistency with Elovich kinetics. However, the linear regression fits exhibit a moderate fit (R2 = 0.82~0.89), signifying a deviation from the ideal Elovich behavior. The Elovich parameter α diminishes significantly as MB concentration increases (Table 1), which might indicate that while the total number of available molecules increases with concentration, the initial rate related to the number of available sites behaves differently, possibly due to rapid initial site saturation or changes in initial accessibility. Conversely, β displays a decreasing trend with concentration (Table 1). This suggests that resistance to desorption becomes greater or binding becomes stronger at higher MB loads. Although the Elovich model partially captures the adsorption behavior, the moderate fits suggest that it does not fully represent the kinetics.

3.2. Effect of Solution pH

3.2.1. Effect of Solution pH on Dye Adsorption

Among the environmental factors affecting dye adsorption, solution pH is an important factor influencing the adsorption capacity. To explore the influence of pH on adsorption, the initial pH of the dye solution was set from 2 to 12, while keeping other environmental factors and the amount of adsorbate constant. The experimental results are shown in Figure 2. The low adsorption capacity at pH 2 (0.763 mg/g) indicates that under acidic conditions, the adsorption capacity is at its minimum. This phenomenon may be attributed to the high competition for adsorption sites by H+ ions. Methylene blue (MB) is a cationic dye, and in a strongly acidic environment, the surface of the adsorbent (rice husk) becomes positively charged due to protonation, leading to electrostatic repulsion between the adsorbent and MB, which results in poor adsorption efficiency. Additionally, the high concentration of H+ ions may compete with MB for adsorption sites, making it difficult for MB to bind with the rice husk, further reducing the adsorption capacity. As the pH increased to 4, the adsorption capacity significantly rose to 2.363 mg/g. This increase can be attributed to the reduced competition from H+ ions, allowing MB to adsorb more readily onto the surface of the rice husk. Concurrently, the surface charge of the adsorbent gradually decreased, which also diminished electrostatic repulsion, facilitating easier adsorption of MB. When the pH further increased to 6, the adsorption capacity slightly rose to 2.368 mg/g, indicating that near-neutral conditions are most favorable for adsorption. At this point, the surface charge of the rice husk approached neutrality or became weakly negative, achieving an optimal balance in the attractive forces between the adsorbent and MB. At pH 8 and pH 10, the adsorption capacity showed a slight increase (with a maximum adsorption capacity of approximately 2.404 mg/g). This may have been due to the rice husk surface becoming more negatively charged, enhancing the electrostatic attraction with the positively charged MB. Additionally, there were still sufficient adsorption sites available, so the adsorption efficiency did not significantly decline. However, despite the increase in pH, the rate of increase in adsorption capacity tended to plateau. This could be because the solubility or chemical properties of MB changed at higher pH levels, causing it to no longer rely solely on electrostatic interactions for binding with the adsorbent. Under conditions of pH 12, the adsorption capacity further rose to 2.556 mg/g, representing the highest capacity observed in the tested pH range. Possible explanations include the complete deprotonation of acidic functional groups on the rice husk surface at pH 12, resulting in a strong negative charge that maximized the electrostatic attraction between MB and the adsorbent. The higher concentration of OH ions or changes in solution chemistry at this elevated pH might also influence dye speciation or interactions with the surface, potentially facilitating adsorption. Alternatively, at a high pH, MB molecules could potentially form molecular aggregates, which enhances adsorption capacity. In the literature search, it was found that some studies on the effect of the initial pH value of the adsorbent and the dye solution on the adsorption capacity of the adsorbent have similar results [42,43,44,45,46,47].

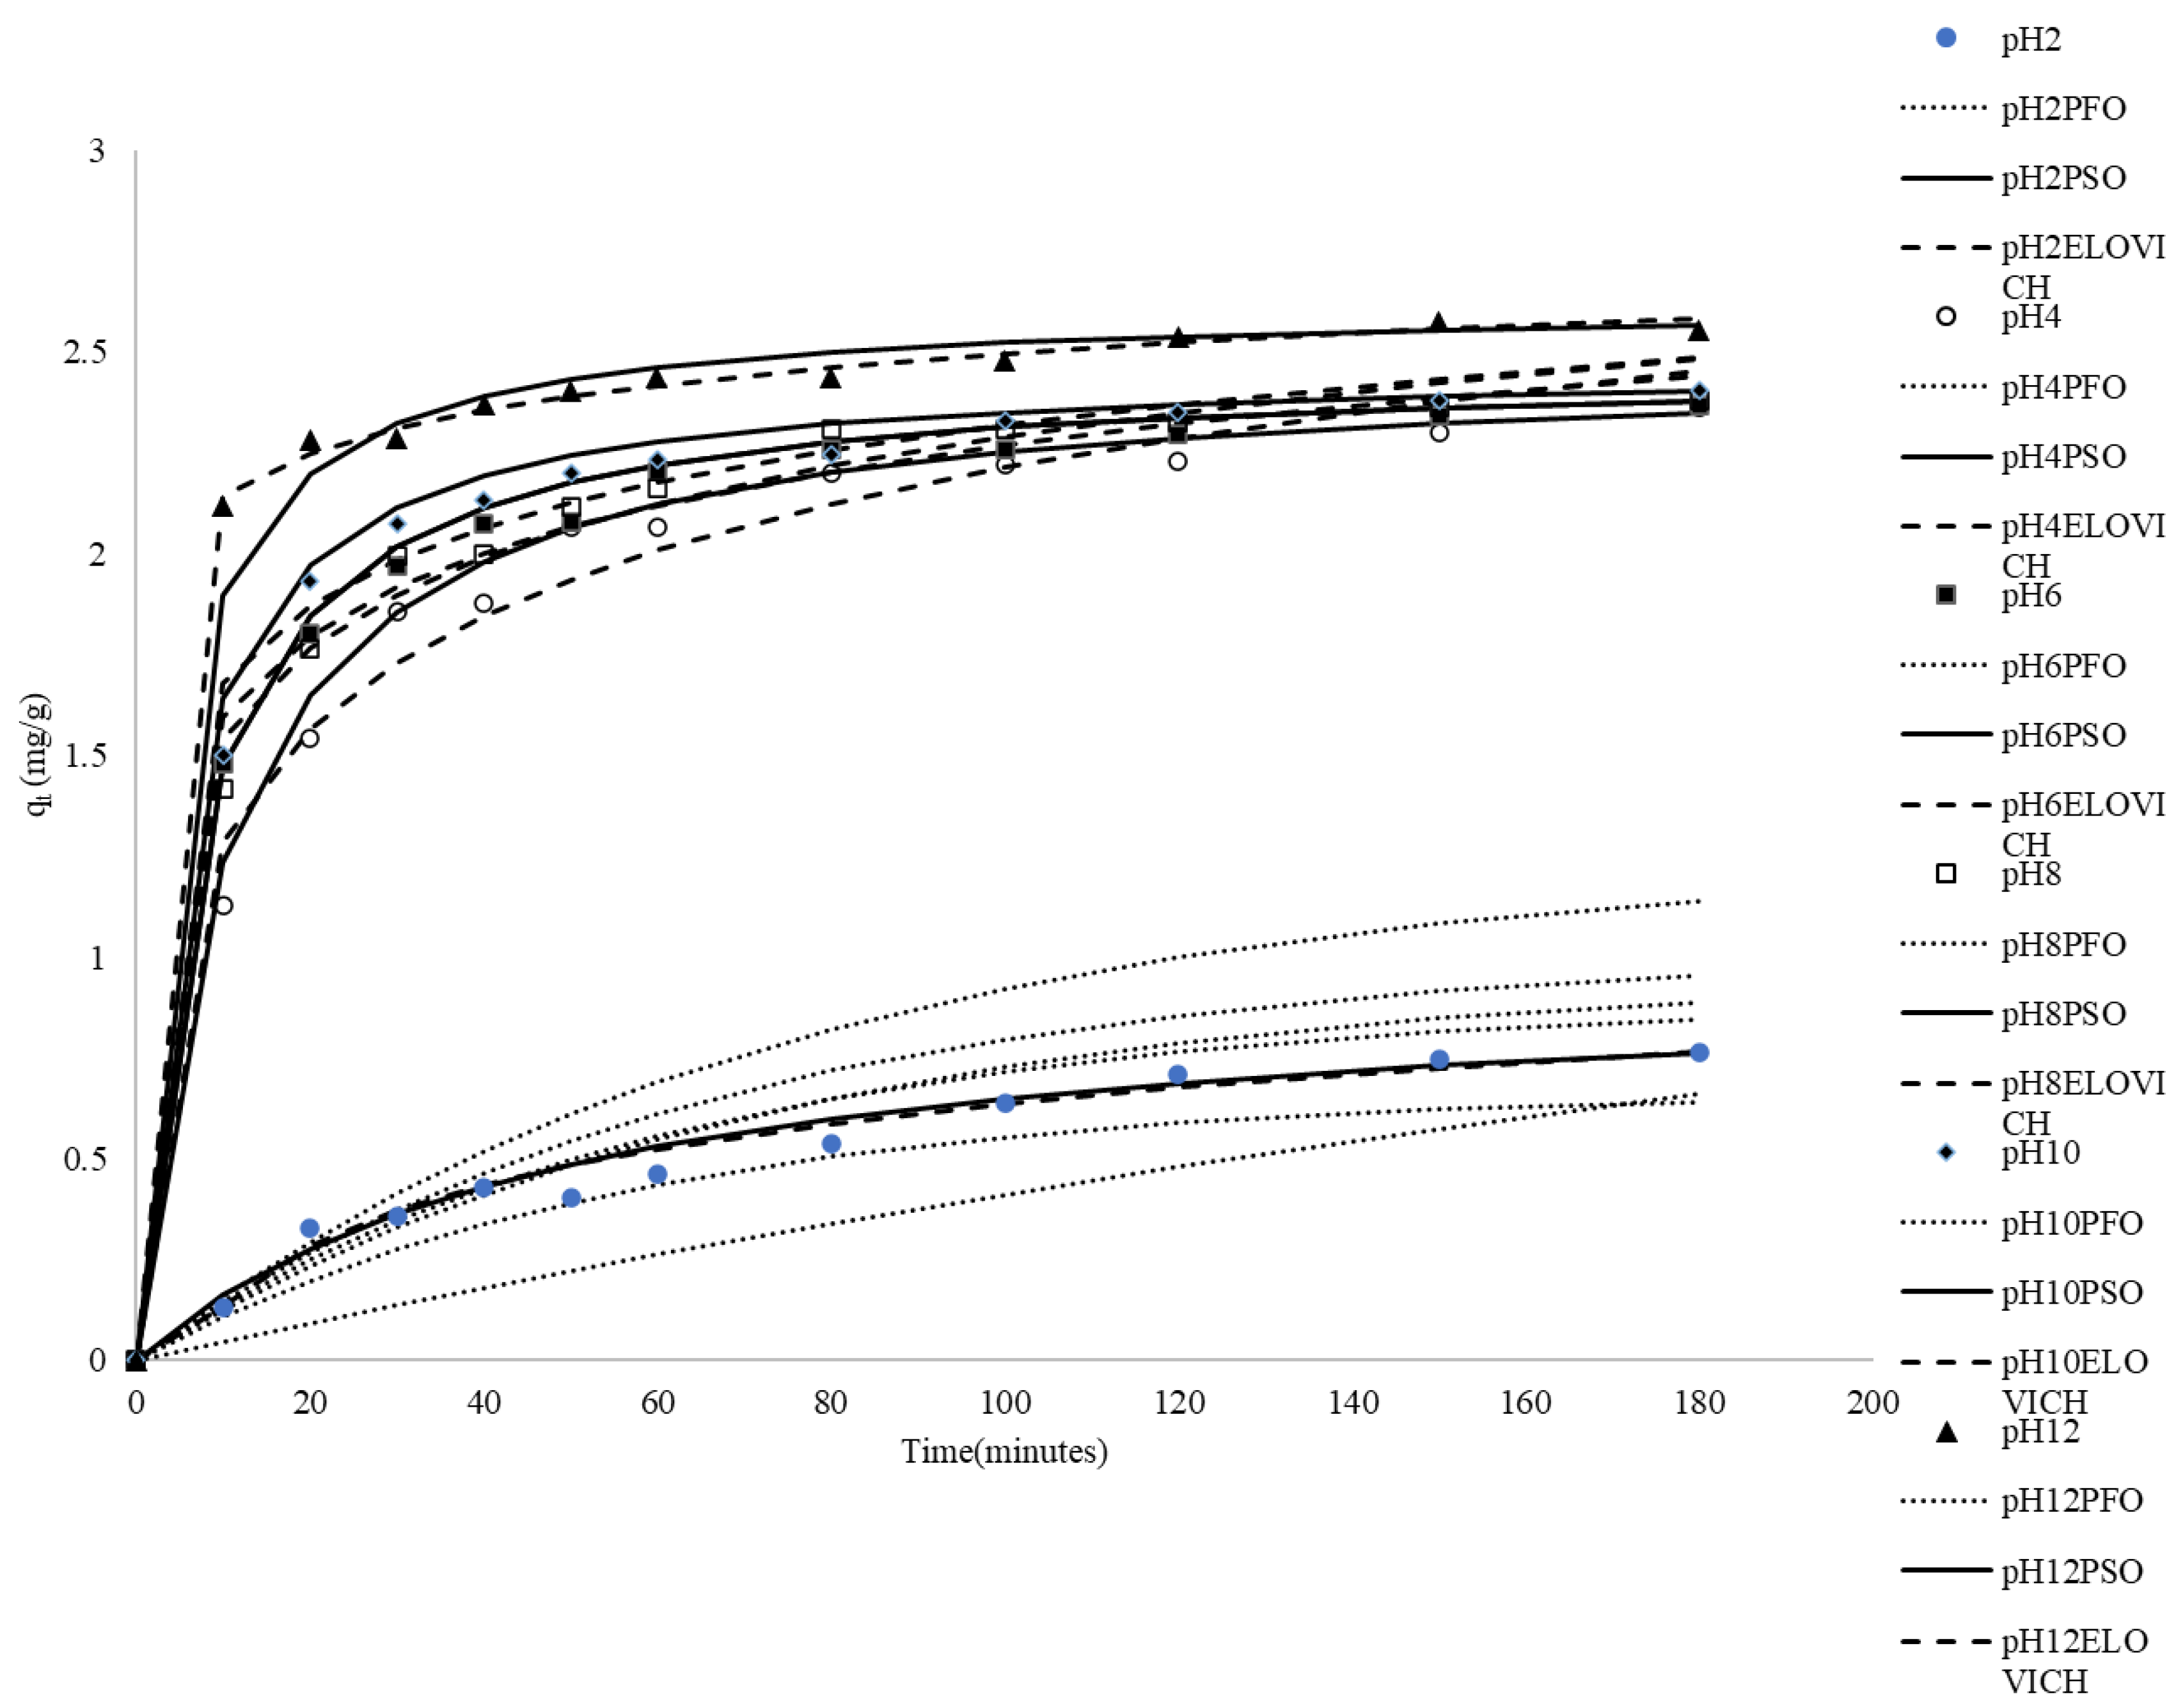
3.2.2. Effect of Solution pH on Adsorption Kinetics

As shown in Table 2, the qe,mod values derived from the pseudo-first-order kinetic model exhibited notable discrepancies when compared to the experimentally determined qe,exp values. Additionally, the correlation coefficients obtained were relatively low. These findings indicate that the adsorption behavior of MB onto CRH cannot be accurately described by the pseudo-first-order rate equation.
The plots of t/qt versus t were used to calculate the pseudo-second-order constant, the correlation coefficients, and the equilibrium adsorption density, qe,mod. The calculated kinetic constants, correlation coefficients, and equilibrium adsorption capacities (qe,mod) are presented in Table 2. Table 2 reveals that the correlation coefficients determined using the pseudo-second-order kinetic model across various initial pH values are remarkably high. Furthermore, the qe,mod values predicted by the pseudo-second-order model closely align with the experimentally measured q values. These findings demonstrate that the pseudo-second-order kinetic model is suitable for estimating both the amount of MB adsorbed at different contact time intervals and the equilibrium adsorption capacity under varying initial pH conditions.
It can be found in Table 2 that the values of β between pH 2 and 4 decrease with the increase in the pH value, and most of the values of β at pH 4–12 increase with the increase in the pH value. This result shows that the kinetics related to desorption or surface energy distribution (represented by β) change with increasing pH values. The decrease in β between pH 2 and 4 suggests strengthened binding or reduced heterogeneity effects, while the increase in β at pH 4–12 might suggest an increased influence of heterogeneity or changes in rate-limiting steps.

3.3. Effect of Ionic Strength

3.3.1. Effect of Ionic Strength on Dye Adsorption

There are various types of suspended solids and salts in textile and dyeing industry wastewater. Therefore, it is important to investigate whether inorganic salts affect the adsorption process of methylene blue on rice husk. In this study, 0.05 mole/L NaCl, 1 mole/L NaCl, 0.05 mole/L CaCl2 and 1 mole/L CaCl2 were added to MB solution as salt representatives. From Figure 3, it can be observed that the presence and concentration of Na+ and Ca2+ ions have a notable impact on the adsorption capacity of rice husks for methylene blue. Higher concentrations of these ions significantly reduce the qt values, with Ca2+ ions having a greater impact than Na+ ions. The reason may be that Na+ ions and Ca2+ ions compete with MB for the same binding sites on CRH in solution. In addition, the increased ionic strength due to the presence of Na+, Ca2+, and Cl ions can lead to charge screening effects at the adsorbent surface, weakening the electrostatic attraction between the positively charged MB molecules and the negatively charged CRH surface. Alternatively, Cl ions can interact with MB+ ions to form ion pairs in solution, effectively reducing the concentration of free MB+ available for adsorption [48,49]. The greater the concentration of the same salt, the more serious the impact; the impact of CaCl2 is also greater than that of NaCl. Ca2+ (CaCl2) contributes more to ionic strength and has a higher positive charge than Na+, leading to a greater negative effect on adsorption at the same concentration [50]. Similar effects of ions on adsorption have been reported in the literature [51,52,53,54,55].

3.3.2. Effect of Ionic Strength on Adsorption Kinetics

It can be seen in Table 3 that the R2 values for the pseudo-second-order equation are higher than the R2 values for the pseudo-first-order one. Figure 3 also shows that the pseudo-first-order model failed to accurately predict the entire sorption period.
It can be seen in Table 3 that the R2 for the pseudo-second-order equation is between 0.92 and 0.99 by using the pseudo-second-order kinetic model to analyze the experimental data. The conditions tested include no added ions, and the addition of 0.05 M Na+, 1 M Na+, and 0.05 M Ca2+, and 1 M Ca2+. The high r2 values indicate a very good fit of the pseudo-second-order kinetic model. Furthermore, the theoretically calculated equilibrium adsorption capacity (qe,mod) is close to the experimentally determined value (qe,exp). As shown in Figure 3, the pseudo-second-order kinetic model demonstrated excellent predictive ability over the entire adsorption duration. These analyses clearly demonstrate that the adsorption mechanism of methylene blue (MB) on CRH can be described by pseudo-second-order kinetics. This suggests that the adsorption of methylene blue onto rice husk is primarily governed by chemisorption.
The Elovich equation has been effectively used to predict sorption kinetics, which are characterized by a rapid initial adsorption rate that slows down significantly in the later stages of the process. Figure 3 shows that the simulation path of the Elovich model is comparable to that of the pseudo-second-order kinetic model. In the absence of ions, the pseudo-second-order kinetic model simulation path is slightly better. However, the fitting effect of the Elovich model is slightly better than that of the pseudo-second-order kinetic model in the presence of ions, likely because it is more suitable for describing heterogeneous adsorption processes, especially with multiple influencing factors such as ions. The Elovich model assumes that the adsorption rate decreases over time and is related to the amount adsorbed, which enables it to better capture complex adsorption behavior [56].

3.4. The Effect of Temperature

3.4.1. The Effect of Temperature on Dye Adsorption

Temperature plays a fundamental role in governing the adsorption kinetics, mass transfer mechanisms, and overall uptake efficiency of the system. Figure 4 comprehensively depicts the temporal evolution of methylene blue (MB) adsorption behavior at various temperatures. The experimental results demonstrate a progressive increase in MB uptake with extended contact duration until reaching a plateau, indicating the establishment of kinetic equilibrium between the adsorption of MB molecules from the aqueous phase onto rice husk and their subsequent desorption from the adsorbent surface.
At 278.15 K, the qt values start from 0 and gradually rise, reaching a maximum of 2.37 mg/g at 180 min. The adsorption process is relatively slow and takes some time to reach equilibrium (qe). At this temperature, the lower kinetic energy of the methylene blue molecules and the rice husk results in slower diffusion rates. At 298.15 K, the qt values also start from 0 and increase more rapidly compared to those at 278.15 K, reaching qe at 180 min. Higher temperatures provide more kinetic energy, enhancing the diffusion of methylene blue molecules into the rice husk pores. At 308.15 k, the qt values show an even faster increase, reaching qe at 180 min. At 323.15 K, the qt values exhibit the highest increase, reaching 2.52 mg/g at 180 min. The adsorption process of 323.15 K is the fastest among all temperatures, and equilibrium is achieved very quickly. The high qt values at 323.15 K suggest that the adsorption capacity of rice husk is maximized, highlighting the strong endothermic nature of the adsorption process. As shown in Figure 4, the adsorbed amount of dye increases with temperature, clearly indicating that the adsorption process is endothermic.

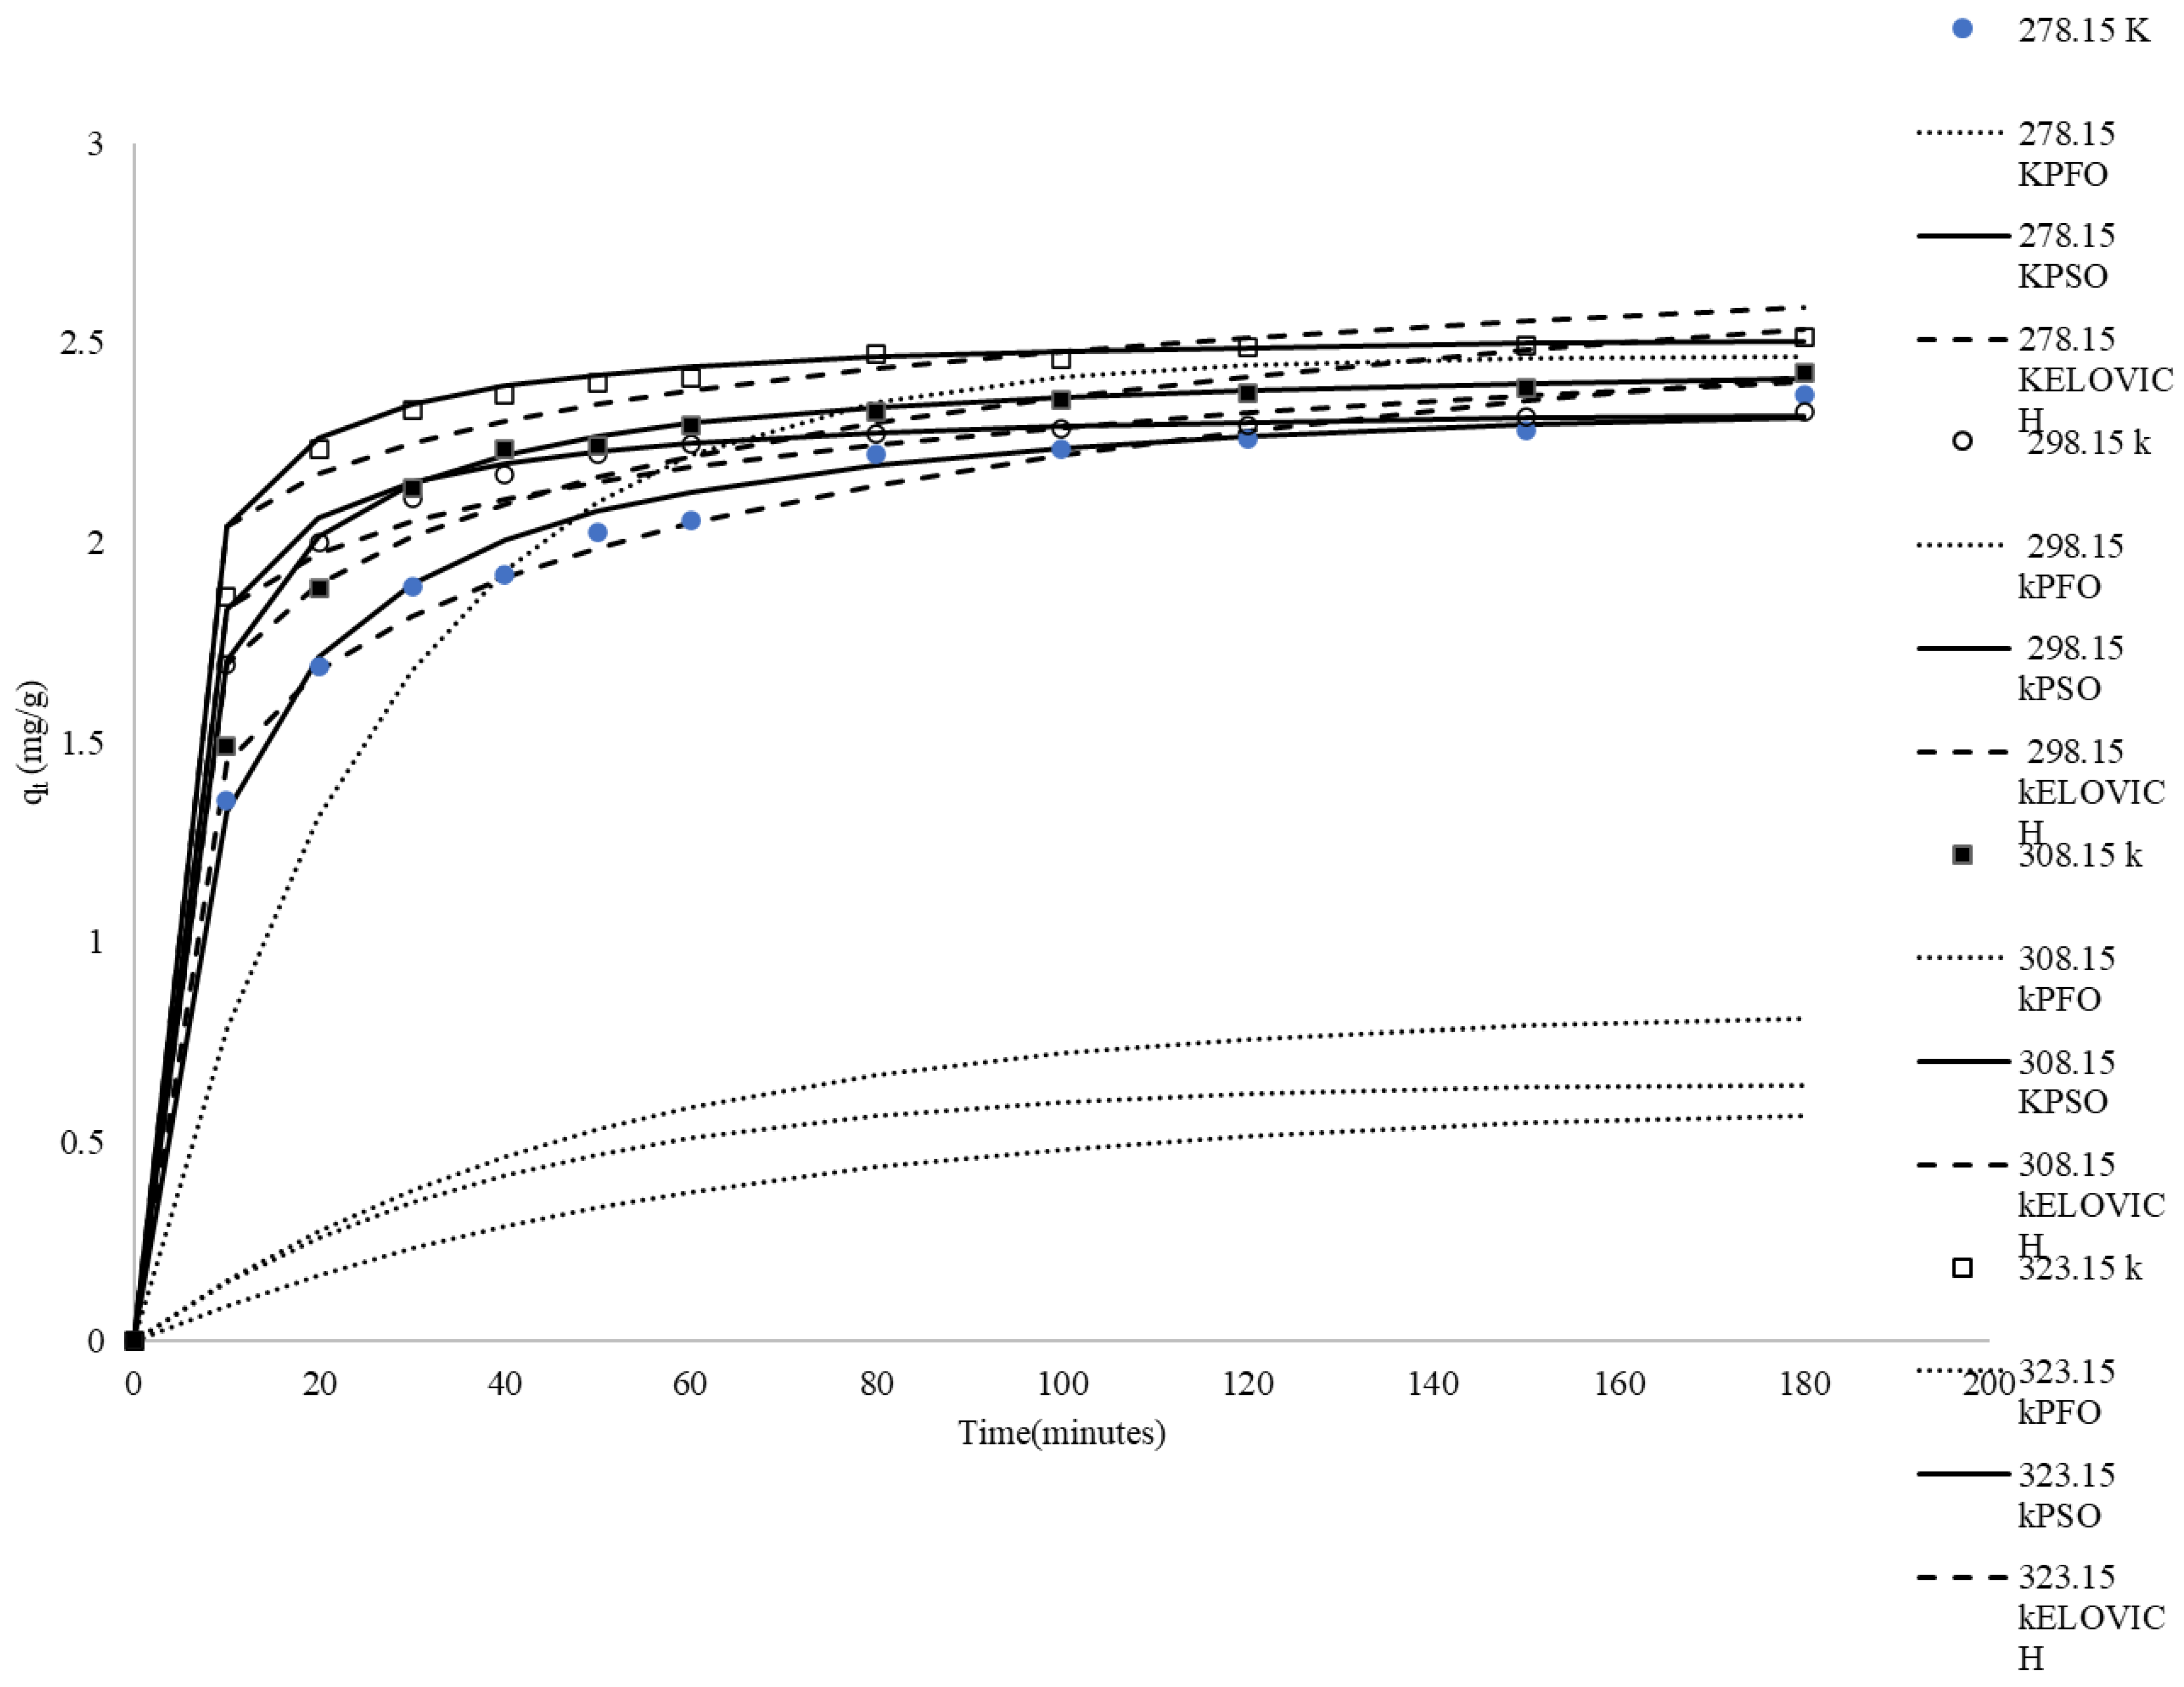
3.4.2. The Effect of Temperature on Absorption Kinetics

In this study, the pseudo-first-order, pseudo-second-order, and Elovich kinetic models were applied to experimental data obtained at different temperatures to confirm which is the most appropriate adsorption kinetic model for the effect of temperature on the adsorption of MB by rice husk. To assess the ability of different kinetic models to correlate with experimental results, Figure 4 shows the fitted plots from each kinetic model along with the experimental data for MB adsorption onto RH across a range of temperatures. Table 4 provides the calculated kinetic constants and the values of correlation coefficients.
The correlation coefficients (R2) for the pseudo-first-order kinetics ranged from 0.71 to 0.87 (Table 4), indicating poor correlation. Figure 4 shows values that are significantly different from the experimental values. These results suggest that the adsorption of MB on CRH is not an ideal pseudo-first-order reaction.
The pseudo-second-order kinetic model’s linear plots of t/qt versus time had very high correlation coefficients, nearly equal to unity. In addition, the calculated qe,mod values from the pseudo-second-order kinetic model were very close to the experimental qe,exp values under all conditions (Figure 4). These findings indicate that the adsorption of MB from the solution onto CRH follows a second-order dynamic model. The data in Table 4 also show that the value of the rate constant K2 generally increased with temperature, ranging from 0.05 g mg−1 min−1 at 278.15 K to 0.16 g mg−1 min−1 at 323.15 K. The temperature dependence of the specific adsorption reaction rate constant (K2) can be described using the Arrhenius equation [57]:
lnK 2 = lnA o E a RT
The parameter Ao represents a temperature-independent factor known as the “frequency coefficient”, while Ea denotes the activation energy (J/mol). The universal gas constant is given as R = 8.314 J/(mol K), and T corresponds to the absolute temperature in Kelvin (K). The magnitude of Ea can indicate the type of adsorption. Physisorption is characterized by readily reversible reactions, quick equilibrium attainment, and low energy requirements. Due to the inherently weak intermolecular interactions governing physisorption, the activation energy associated with this process typically remains below 4.2 kJ/mol [58,59,60]. Chemisorption is a highly specific process that requires significantly stronger interactions compared to physisorption. Consequently, its activation energy corresponds to the enthalpy change in the chemical reaction, typically ranging from 8.4 to 83.7 kJ/mol [58,59,60]. Figure 5 shows a linear relationship between ln K2 and 1/T. The slope of the ln K2 versus 1/T plot was used to calculate Ea, which turned out to be 17.42 kJ/mol. The study’s findings on the impact of temperature suggest that chemisorption is involved in MB’s sorption on CRH [61,62].
The correlation coefficients (R2) for the Elovich model exhibit a decreasing trend with increasing temperature, ranging from 0.97 at 278.15 K to 0.82 at 323.15 K, as presented in Table 4. The coefficients of determination and the simulation curves in Figure 4 indicate that the Elovich equation could not adequately fit these experimental data compared to the pseudo-second-order model.

3.4.3. Thermodynamic Analysis

Thermodynamic analysis refers to the study of energy conversion and material changes during the adsorption process. This analysis helps us understand the reversibility of the adsorption process and evaluates the feasibility and stability of the adsorption process. Therefore, changes in enthalpy (ΔH°), entropy (ΔS°), and Gibbs free energy (ΔG°) should be carefully evaluated for their impact on the distribution coefficient of a substance between the solid and liquid phases. In this study, activation energy and ΔG°, ΔH°, and ΔS° were used to evaluate the adsorption process. Experiments at various conditions were used to determine the adsorption process thermodynamic parameters using the equations below [63,64]:
K d = q e C e
log ( K d ) = Δ S o 2 . 303 R Δ H o 2 . 303 RT
Δ G o = Δ H o T Δ S o
The distribution coefficient (Kd), expressed in Lg−1, represents the ratio of the adsorbed amount of methylene blue (qe) to its equilibrium concentration in solution (Ce). The ideal gas constant (R) is given in J mol−1 K−1, while the absolute temperature (T) is expressed in Kelvin (K).
To evaluate the thermodynamic parameters governing the adsorption process, a plot of the natural logarithm of the distribution coefficient (log Kd) against the reciprocal of the absolute temperature (1/T) was constructed, as illustrated in Figure 6. The enthalpy change (ΔH°) and entropy change (ΔS°) were subsequently determined from these data and are presented in Table 5. The observed positive entropy change (ΔS°) for methylene blue adsorption onto CRH suggests an increase in translational entropy due to the displacement of solvent molecules by adsorbate ions. This enhancement in randomness compensates for the entropy reduction associated with the adsorption process. Furthermore, the positive enthalpy change (ΔH°) confirms the endothermic nature of the process, signifying that energy input is necessary to overcome the attractive forces between dye molecules and promote their adherence to the adsorbent surface. The thermodynamic feasibility of the adsorption process is further corroborated by the negative values of the Gibbs free energy change (ΔG°) at all examined temperatures (Table 5). The increasingly negative ΔG° values with rising temperatures indicate greater spontaneity of the adsorption process at elevated temperatures. This trend signifies a favorable interaction between methylene blue and the CRH adsorbent, leading to a spontaneous process. The positive ΔH° indicates that energy is absorbed during adsorption, likely in order to overcome the desolvation of dye molecules and/or surface functional groups or for the purpose of structural changes. The spontaneity of the adsorption process (ΔG° < 0), particularly at higher temperatures where ΔG° becomes more negative, is primarily driven by the favorable increase in entropy (ΔS° > 0), which compensates for the endothermic enthalpy change [65,66].

3.5. Adsorption Isotherms

Adsorption isotherms serve as a fundamental tool for characterizing the interactions between the adsorbate and the adsorbent [67]. The experimental data were fitted using several mathematical models, including Langmuir, Freundlich, and Temkin models. The isotherm constants determined at different initial MB concentrations are summarized in Table 6. To evaluate the applicability of these models, the theoretical isotherms were compared with the experimental data for MB adsorption onto CRH, as illustrated in Figure 7.
The Langmuir model was employed to determine the maximum adsorption capacity (qmax) of CRH for MB, representing the theoretical maximum amount of dye that can be adsorbed onto the adsorbent. The Langmuir constant, KL, reflects the affinity between the adsorbent and adsorbate. Table 6 summarizes the calculated qmax and KL values. The dimensionless separation factor, RL, was calculated and plotted against the initial MB concentration in Figure 8. The RL values (Figure 8) were found to be between 0 and 1 for all initial concentrations, indicating favorable adsorption of MB onto CRH [39]. Furthermore, the adsorption process was observed to be more favorable at higher initial dye concentrations.
The Freundlich isotherm, initially an empirical model, has been widely applied to describe adsorption onto heterogeneous surfaces with varying adsorption site energies [68]. The Freundlich constant, n, is an empirical parameter that reflects the heterogeneity of the adsorbent surface and the intensity of adsorption. A value of n greater than unity typically indicates favorable adsorption. The results presented in Table 6 confirm that MB adsorption onto CRH is favorable, as the calculated n values are greater than one [69].
A comparison of the theoretical isotherms reveals that both the Langmuir and Freundlich models provide a better fit to the experimental data than the Temkin model. During the adsorption process, the experimental data are more consistent with the Freundlich isotherm at low concentrations and begin to be more consistent with the Langmuir isotherm when the concentration increases. This is due to the basic assumptions and applicable scenarios of the two models. The Freundlich isotherm is an empirical formula that assumes that the adsorbent surface has different adsorption sites with different adsorption energies. This model is particularly effective at low concentrations because it can describe the diversity and heterogeneity of adsorption energies on the adsorbent surface. At low concentrations, the adsorption process is often affected by the surface adsorption site, and the Freundlich model can well describe this situation. The Langmuir isotherm assumes that the adsorbent surface has uniformly distributed adsorption sites with the same adsorption energy, and each site can only adsorb one molecule. This model is more applicable at high concentrations because as the concentration increases, the adsorption sites gradually become saturated, and the Langmuir model can describe the limiting behavior of this monolayer adsorption. Therefore, when the initial concentration is low, the adsorption process is mainly limited by the heterogeneity and diversity of the adsorbent surface. At this point, the Freundlich model can more accurately describe the adsorption behavior. However, as the concentration increases, the adsorption sites gradually become saturated, in which case the Langmuir model is more suitable for describing the limiting behavior of monolayer adsorption [70,71,72,73].
Table 7 outlines a comparative evaluation of the MB adsorption efficiency exhibited by the CRH synthesized in this work against previously documented adsorbents reported in the literature [74]. The data clearly highlight that CRH holds substantial potential as an effective sorbent for cationic dye removal, outperforming or equating favorably to various other inexpensive biosorbents and activated carbon-based materials that have been earlier recommended for the extraction of methylene blue from aqueous environments.

3.6. Limitations and Future Perspectives

Although the untreated rice husk used in this study is cost-effective, sustainable, and abundant in source, and does not require additional grinding to save energy consumption, it still has some potential limitations under certain specific conditions or when facing complex wastewater compositions.

3.6.1. Effect of pH and Performance Limitations in Acidic Environments

The results showed that the adsorption capacity of CRH for methylene blue (MB) was the lowest at pH 2 (0.763 mg/g). This is mainly attributed to the electrostatic repulsion between the adsorbent surface and the cationic dye MB due to protonation in a strong acidic environment. In addition, high concentrations of H+ ions will also compete with MB for adsorption sites, further reducing the adsorption efficiency. Although the adsorption capacity remains relatively stable and effective between pH 4 and 10 and reaches its highest point at pH 12, this indicates that the application of CRH in the treatment of extremely acidic wastewater may be limited.

3.6.2. Negative Effects of Ionic Strength

Actual industrial wastewater usually contains a variety of dissolved salts. This study found that the presence of Na+ and Ca2+ ions in the solution significantly inhibited the adsorption efficiency of MB, among which the effect of Ca2+ was more significant. This may be because Na+ and Ca2+ ions compete with MB for binding sites on CRH, or because the increase in ionic strength causes a charge shielding effect on the adsorbent surface, weakening the electrostatic attraction between the positively charged MB molecules and the negatively charged CRH surface. In addition, Cl ions may also form ion pairs with MB+ ions in solution, effectively reducing the concentration of free MB+ that can be adsorbed. Although the Elovich model provides a better fit in the presence of ions, indicating the heterogeneity of the adsorption process, the presence of ions does reduce the overall adsorption efficiency.

3.6.3. Complexity and Temperature Dependence of Adsorption Mechanism

Thermodynamic analysis in this study showed that the adsorption process of MB on CRH is endothermic (ΔH° > 0), which means that the adsorption amount increases with increasing temperature. Although this is favorable at higher temperatures, if applied to lower-temperature environments, its adsorption efficiency may be relatively low, or additional energy input may be required to maintain high adsorption efficiency. In addition, although the pseudo-second-order kinetic model can describe the adsorption process well in most cases, suggesting a chemical adsorption mechanism, the Elovich model provides better predictions of experimental data in the presence of ions. This change in model fit suggests that the adsorption mechanism of CRH is not single and universally applicable, and its behavior may be more complex under different wastewater compositions.

3.6.4. Adsorption Capacity and Surface Properties

Isotherm studies show that at higher concentrations, the Langmuir model fits the data well, suggesting monolayer coverage on a uniform surface, but at lower concentrations, the Freundlich model provides a more accurate description, indicating the influence of surface heterogeneity. Although the RL values confirm that the adsorption process is feasible, this difference in model fit at different concentrations also indicates the heterogeneity of CRH surface adsorption sites, which may limit its uniform and efficient performance over a very wide range of concentrations.

3.6.5. Application Stage and Optimization Space

Current research is mainly carried out at a laboratory scale, and its performance in actual complex wastewater treatment and its potential to be scaled up to a pilot plant still need to be further verified. This study also clearly pointed out that future work should focus on optimizing adsorption conditions, exploring the effects of different wastewater components, and developing chemical modification methods to improve the adsorption capacity of rice husks. This indirectly suggests that untreated rice husk, while feasible, may not achieve optimal performance in some aspects, especially when treating real industrial wastewaters with multiple complex components, where its adsorption capacity or efficiency may not be as good as chemically modified or more expensive adsorbents.
In summary, although untreated rice husk shows great potential as a low-cost adsorbent, its performance may be limited when faced with extreme pH conditions, high-ionic-strength wastewater, or application scenarios that require higher adsorption capacity. These findings pave the way for future research on how to further optimize the adsorption performance of CRH for a wider range of practical applications.

4. Conclusions

This study demonstrates the feasibility of using untreated rice husk (CRH) as a cost-effective and sustainable adsorbent for the removal of methylene blue (MB) from wastewater. The main findings are summarized as follows:
  • Adsorption performance is affected by operating parameters: The adsorption capacity for MB was lowest at pH 2, but relatively stable and effective between pH 4 and 10, and reached the highest at pH 12. The presence of ions in the solution inhibited the adsorption efficiency, with Ca2+ having a more significant effect. The adsorption capacity increased with increasing initial dye concentration and temperature, indicating that the adsorption process is endothermic.
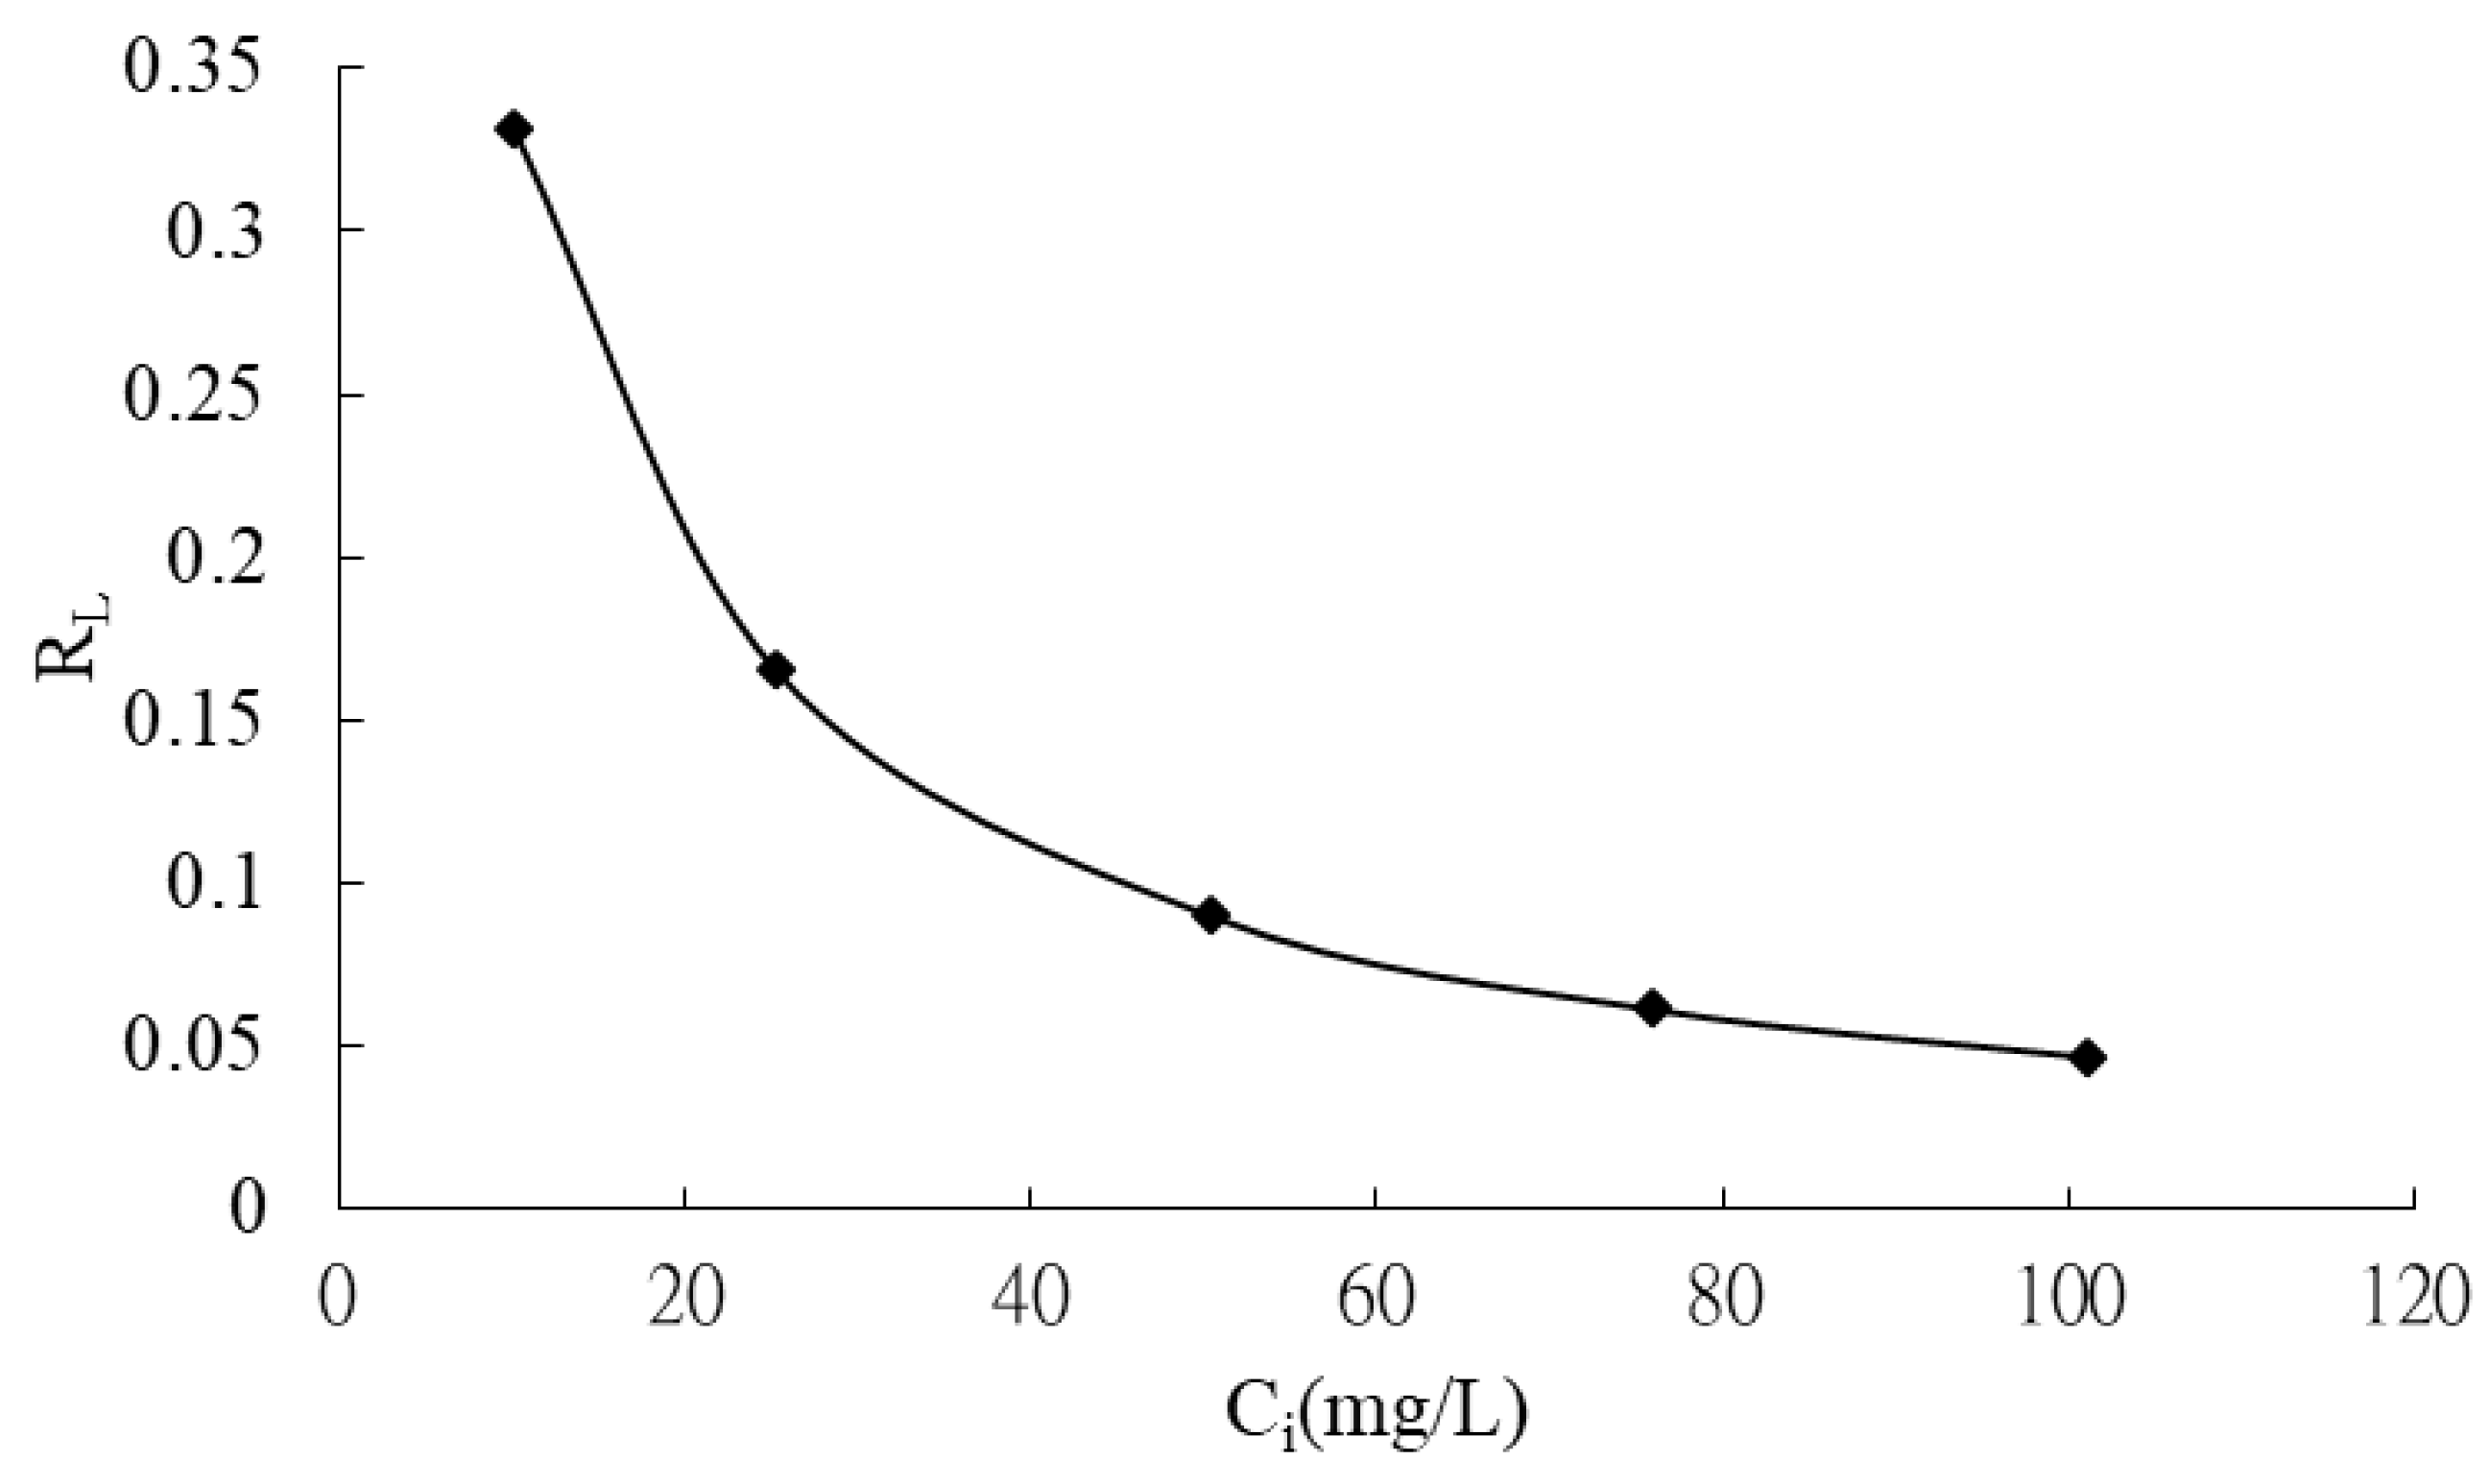
  • Adsorption mechanism and model: Kinetic studies showed that the adsorption process was best fitted by a pseudo-second-order kinetic model, suggesting the presence of a chemical adsorption mechanism. However, in the presence of ions, the Elovich model provided better predictions of the data. The equilibrium adsorption data agreed well with the Langmuir isotherm model at higher concentrations, indicating monolayer coverage on a uniform surface, while at lower concentrations, the Freundlich isotherm model provided a more accurate description, suggesting the influence of surface heterogeneity. The calculated dimensionless separation factor (RL) confirmed that the adsorption process was favorable at all initial MB concentrations. Thermodynamic analysis further supported that the process was spontaneous (ΔG° < 0) and endothermic (ΔH° > 0), accompanied by an increase in the solid–liquid interface disorder (ΔS°). The activation energy (Ea) of 17.42 kJ/mol also supported the involvement of chemical adsorption.
This study highlights the great potential of untreated rice husk as a sustainable and cost-effective alternative to activated carbon. Its direct use avoids the energy-consuming grinding process and promotes the resource recovery and pollution control of agricultural waste. These findings provide important insights into the use of agricultural byproducts for environmental remediation.

Author Contributions

Conceptualization, Y.-T.H. and M.-C.S.; methodology, Y.-T.H. and M.-C.S.; software, Y.-T.H. and M.-C.S.; validation, Y.-T.H. and M.-C.S.; formal analysis, Y.-T.H. and M.-C.S.; investigation, Y.-T.H. and M.-C.S.; resources, Y.-T.H. and M.-C.S.; data curation, M.-C.S.; writing—original draft preparation, Y.-T.H.; writing—review and editing, M.-C.S.; visualization, M.-C.S.; supervision, Y.-T.H.; project administration, Y.-T.H.; funding acquisition, Y.-T.H. and M.-C.S. All authors have read and agreed to the published version of the manuscript.

Funding

This research received no external funding.

Data Availability Statement

The research data is not stored online, so if you need research data, you can ask the author for it.

Acknowledgments

The authors would like to acknowledge the Bioprocess Engineering and Fermentation Laboratory personnel in Department of Medical Science and Biotechnology, I-Shou University, for their assistance during experiment operation.

Conflicts of Interest

The authors declare no conflict of interest.

References

  1. Haji, A.; Ashraf, S.; Nasiriboroumand, M.; Lievens, C. Environmentally friendly surface treatment of wool fiber with plasma and chitosan for improved coloration with cochineal and safflower natural dyes. Fibers Polym. 2020, 21, 743–750. [Google Scholar] [CrossRef]
  2. Wang, X.; Jiang, J.; Gao, W. Reviewing textile wastewater produced by industries: Characteristics, environmental impacts, and treatment strategies. Water Sci. Technol. 2022, 85, 2076–2096. [Google Scholar] [CrossRef] [PubMed]
  3. Dutta, S.; Adhikary, S.; Bhattacharya, S.; Roy, D.; Chatterjee, S.; Chakraborty, A.; Banerjee, D.; Ganguly, A.; Nanda, S.; Rajak, P. Contamination of textile dyes in aquatic environment: Adverse impacts on aquatic ecosystem and human health, and its management using bioremediation. J. Environ. Manag. 2024, 353, 120103. [Google Scholar] [CrossRef] [PubMed]
  4. Nachiyar, C.V.; Rakshi, A.; Sandhya, S.; Jebasta, N.B.D.; Nellore, J. Developments in treatment technologies of dye-containing effluent: A review. Case Stud. Chem. Environ. Eng. 2023, 7, 100339. [Google Scholar] [CrossRef]
  5. Kallawar, G.A.; Bhanvase, B.A. A review on existing and emerging approaches for textile wastewater treatments: Challenges and future perspectives. Environ. Sci. Pollut. Res. 2024, 31, 1748–1789. [Google Scholar] [CrossRef] [PubMed]
  6. Wang, R.-F.; Deng, L.-G.; Li, K.; Fan, X.-J.; Li, W.; Lu, H.-Q. Fabrication and characterization of sugarcane bagasse–calcium carbonate composite for the efficient removal of crystal violet dye from wastewater. Ceram. Int. 2020, 46, 27484–27492. [Google Scholar] [CrossRef]
  7. Kooh, M.R.R.; Thotagamuge, R.; Chau, Y.-F.C.; Mahadi, A.H.; Lim, C.M. Machine learning approaches to predict adsorption capacity of Azolla pinnata in the removal of methylene blue. J. Taiwan Inst. Chem. Eng. 2022, 132, 104134. [Google Scholar] [CrossRef]
  8. Bayomie, O.S.; Kandeel, H.; Shoeib, T.; Yang, H.; Youssef, N.; El-Sayed, M.M.H. Novel approach for effective removal of methylene blue dye from water using fava bean peel waste. Sci. Rep. 2020, 10, 7824. [Google Scholar] [CrossRef] [PubMed]
  9. Dinh, V.-P.; Huynh, T.-D.-T.; Le, H.M.; Nguyen, V.-D.; Dao, V.-A.; Hung, N.Q.; Tuyen, L.A.; Lee, S.; Yi, J.; Nguyen, T.D.; et al. Insight into the adsorption mechanisms of methylene blue and chromium(iii) from aqueous solution onto pomelo fruit peel. RSC Adv. 2019, 9, 25847–25860. [Google Scholar] [CrossRef] [PubMed]
  10. Stavrinou, A.; Aggelopoulos, C.A.; Tsakiroglou, C.D. A Methodology to Estimate the Sorption Parameters from Batch and Column Tests: The Case Study of Methylene Blue Sorption onto Banana Peels. Processes 2020, 8, 1467. [Google Scholar] [CrossRef]
  11. Sudrajat, H.; Susanti, A.; Putri, D.K.Y.; Hartuti, S. Mechanistic insights into the adsorption of methylene blue by particulate durian peel waste in water. Water Sci. Technol. 2021, 84, 1774–1792. [Google Scholar] [CrossRef] [PubMed]
  12. Ullah, A.; Zahoor, M.; Din, W.U.; Muhammad, M.; Khan, F.A.; Sohail, A.; Ullah, R.; Ali, E.A.; Murthy, H.C.A. Removal of Methylene Blue from Aqueous Solution Using Black Tea Wastes: Used as Efficient Adsorbent. Adsorpt. Sci. Technol. 2022, 2022, 5713077. [Google Scholar] [CrossRef]
  13. Taifi, A.; Alkadir, O.K.A.; Oda, A.A.; Aljeboree, A.M.; Al Bayaa, A.L.; Alkaim, A.F.; Abed, S.A. Biosorption by Environmental, Natural and Acid-Activated Orange Peels as Low-Cost Aadsorbent: Optimization of Disperse Blue 183 as a Model. In Proceedings of the IOP Conference Series: Earth and Environmental Science, Al Diwaniyah, Iraq, 19–20 January 2022; p. 012009. [Google Scholar]
  14. Al-Ajji, M.A.; Al-Ghouti, M.A. Novel insights into the nanoadsorption mechanisms of crystal violet using nano-hazelnut shell from aqueous solution. J. Water Process Eng. 2021, 44, 102354. [Google Scholar] [CrossRef]
  15. Ma, X.; Liu, Y.; Zhang, Q.; Sun, S.; Zhou, X.; Xu, Y. A novel natural lignocellulosic biosorbent of sunflower stem-pith for textile cationic dyes adsorption. J. Clean. Prod. 2022, 331, 129878. [Google Scholar] [CrossRef]
  16. Venceslau, A.d.F.A.; Mendonça, A.C.; Carvalho, L.B.; Ferreira, G.M.D.; Thomasi, S.S.; Pinto, L.M.A. Removal of methylene blue from an aqueous medium using atemoya peel as a low-cost adsorbent. Water Air Soil Pollut. 2021, 232, 1–18. [Google Scholar] [CrossRef]
  17. Djelloula, C.; Hamdaouib, O.; Alghyamahb, A. Batch biosorption of the dye methylene blue from its aqueous solutions by Palm spathe: Kinetic, isotherm, and thermodynamic studies. Desalination Water Treat. 2021, 231, 389–397. [Google Scholar] [CrossRef]
  18. Han, J.-L.; Huang, T.-W.; Shen, S.-Y.; Chou, Y.-C.; Yo, P.-S.; Yu, Y.-F. Reuse of Agricultural Waste Rice Husk. Bull. Coll. Eng. Natl. Ilan Univ. 2010, 35–42. [Google Scholar]
  19. Shamsollahi, Z.; Partovinia, A. Recent advances on pollutants removal by rice husk as a bio-based adsorbent: A critical review. J. Environ. Manag. 2019, 246, 314–323. [Google Scholar] [CrossRef] [PubMed]
  20. Shih, M.-C. Kinetics of the batch adsorption of methylene blue from aqueous solutions onto rice husk: Effect of acid-modified process and dye concentration. Desalination Water Treat. 2012, 37, 200–214. [Google Scholar] [CrossRef]
  21. Lestari, D.Y.; Laksono, E.W. Kinetics and Thermodynamics Studies of Copper (II) Adsorption onto Activated Carbon Prepared from Salacca zalacca Peel. Molekul 2020, 15, 63–72. [Google Scholar] [CrossRef]
  22. Lagergren, S. About the theory of so-called adsorption of soluble substances. K. Sven. Vetenskapsakademiens Handl. 1898, 24, 1–39. [Google Scholar]
  23. An, B. Cu (II) and As (V) Adsorption kinetic characteristic of the multifunctional amino groups in chitosan. Processes 2020, 8, 1194. [Google Scholar] [CrossRef]
  24. Jiang, Y.; Mao, Q.; Ma, T.; Liu, X.; Li, Y.; Ren, S.; Sun, J. Facile preparation of Fe2O3 Al2O3 composite with excellent adsorption properties towards Congo red. Ceram. Int. 2021, 47, 13884–13894. [Google Scholar] [CrossRef]
  25. Yu-Shah, H. Adsorption of Heavy Metals from Waste Streams by Peat. Ph.D. Thesis, University of Birmingham, Birmingham, UK, 1995. [Google Scholar]
  26. Hamami, Z.; Javanbakht, V. Biosynthesis of copper oxide nanoparticles using biomass, peel, and extract polysaccharides of Solanum Tuberosum for ultrasound-assisted adsorption of azo direct red 80 contaminants. Ceram. Int. 2021, 47, 24170–24181. [Google Scholar] [CrossRef]
  27. Ho, Y.-S. Pseudo-isotherms using a second order kinetic expression constant. Adsorption 2004, 10, 151–158. [Google Scholar] [CrossRef]
  28. Alkan, M.; Doğan, M.; Turhan, Y.; Demirbaş, Ö.; Turan, P. Adsorption kinetics and mechanism of maxilon blue 5G dye on sepiolite from aqueous solutions. Chem. Eng. J. 2008, 139, 213–223. [Google Scholar] [CrossRef]
  29. Wu, F.-C.; Tseng, R.-L.; Juang, R.-S. Characteristics of Elovich equation used for the analysis of adsorption kinetics in dye-chitosan systems. Chem. Eng. J. 2009, 150, 366–373. [Google Scholar] [CrossRef]
  30. Cheung, C.; Porter, J.; McKay, G. Sorption kinetic analysis for the removal of cadmium ions from effluents using bone char. Water Res. 2001, 35, 605–612. [Google Scholar] [CrossRef] [PubMed]
  31. Marković, D.D.; Lekić, B.M.; Rajaković-Ognjanović, V.N.; Onjia, A.E.; Rajaković, L.V. A new approach in regression analysis for modeling adsorption isotherms. Sci. World J. 2014, 2014, 930879. [Google Scholar] [CrossRef] [PubMed]
  32. Kumar, V. Adsorption kinetics and isotherms for the removal of rhodamine B dye and Pb+ 2 ions from aqueous solutions by a hybrid ion-exchanger. Arab. J. Chem. 2019, 12, 316–329. [Google Scholar]
  33. Tome, S.; Hermann, D.T.; Shikuku, V.O.; Otieno, S. Synthesis, characterization and application of acid and alkaline activated volcanic ash-based geopolymers for adsorptive remotion of cationic and anionic dyes from water. Ceram. Int. 2021, 47, 20965–20973. [Google Scholar] [CrossRef]
  34. Liu, Q.; Wang, F.; Zhou, H.; Li, Z.; Fu, Y.; Qin, M. Utilization of lignin separated from pre-hydrolysis liquor via horseradish peroxidase modification as an adsorbent for methylene blue removal from aqueous solution. Ind. Crops Prod. 2021, 167, 113535. [Google Scholar] [CrossRef]
  35. Hu, C.; Zheng, H.; Zhao, R.; Zhang, S.; Sun, Q.; Jiang, J.; Sun, Y. Structural design of a floating-magnetically responsive silica adsorbent and efficient removal of dyes. J. Clean. Prod. 2021, 302, 126985. [Google Scholar] [CrossRef]
  36. Aljeboree, A.M.; Alshirifi, A.N.; Alkaim, A.F. Kinetics and equilibrium study for the adsorption of textile dyes on coconut shell activated carbon. Arab. J. Chem. 2017, 10, S3381–S3393. [Google Scholar] [CrossRef]
  37. Ragadhita, R.; Nandiyanto, A.B.D. How to calculate adsorption isotherms of particles using two-parameter monolayer adsorption models and equations. Indones. J. Sci. Technol. 2021, 6, 205–234. [Google Scholar] [CrossRef]
  38. Sen, T.K. Adsorptive Removal of Dye (Methylene Blue) Organic Pollutant from Water by Pine Tree Leaf Biomass Adsorbent. Processes 2023, 11, 1877. [Google Scholar] [CrossRef]
  39. Hamdaoui, O.; Saoudi, F.; Chiha, M.; Naffrechoux, E. Sorption of malachite green by a novel sorbent, dead leaves of plane tree: Equilibrium and kinetic modeling. Chem. Eng. J. 2008, 143, 73–84. [Google Scholar] [CrossRef]
  40. Jawad, A.H.; Abd Rashid, R.; Mahmuod, R.M.; Ishak, M.A.M.; Kasim, N.N.; Ismail, K. Adsorption of methylene blue onto coconut (Cocos nucifera) leaf: Optimization, isotherm and kinetic studies. Desalination Water Treat. 2016, 57, 8839–8853. [Google Scholar] [CrossRef]
  41. Fadhillah, F.; Alhamzani, A.G.; Bin Bandar, K.; Alshamari, A.; Aljlil, S.; Gadallah, A.G.; Habib, M.; Abou-Krisha, M.M.; Abdel-Fatah, M.A. Application of anionic hydrogels from date palm waste for dye adsorption in wastewater treatment. Gels 2024, 10, 617. [Google Scholar] [CrossRef] [PubMed]
  42. Hameed, B.H.; Krishni, R.R.; Sata, S.A. A novel agricultural waste adsorbent for the removal of cationic dye from aqueous solutions. J. Hazard. Mater. 2009, 162, 305–311. [Google Scholar] [CrossRef] [PubMed]
  43. P’erez-Mar’ın, A.B.; Zapata, V.M.; Ortu˜no, J.F.; Aguilar, M.; S’aez, J.; Llor’ens, M. Removal of cadmium from aqueous solutions by adsorption onto orange waste. J. Hazard. Mater. 2007, 139, 122–131. [Google Scholar] [CrossRef] [PubMed]
  44. Han, R.; Zou, W.; Yu, W.; Cheng, S.; Wang, Y.; Shi, J. Biosorption of methylene blue from aqueous solution by fallen phoenix tree’s leaves. J. Hazard. Mater. 2007, 141, 156–162. [Google Scholar] [CrossRef] [PubMed]
  45. Bulut, Y.; Aydin, H. A kinetics and thermodynamics study of methylene blue adsorption on wheat shells. Desalination 2006, 194, 259–267. [Google Scholar] [CrossRef]
  46. Hameed, B. Evaluation of papaya seeds as a novel non-conventional low-cost adsorbent for removal of methylene blue. J. Hazard. Mater. 2009, 162, 939–944. [Google Scholar] [CrossRef] [PubMed]
  47. Pavan, F.A.; Mazzocato, A.C.; Gushikem, Y. Removal of methylene blue dye from aqueous solutions by adsorption using yellow passion fruit peel as adsorbent. Bioresour. Technol. 2008, 99, 3162–3165. [Google Scholar] [CrossRef] [PubMed]
  48. Othman, I.; Abu Haija, M.; Kannan, P.; Banat, F. Adsorptive removal of methylene blue from water using high-performance alginate-based beads. Water Air Soil Pollut. 2020, 231, 396. [Google Scholar] [CrossRef]
  49. Zhao, X.; Chen, Y. Adsorption of methylene blue using FeCl3-modified pomelo peel. Russ. J. Phys. Chem. A 2020, 94, 835–845. [Google Scholar] [CrossRef]
  50. Aryee, A.A.; Mpatani, F.M.; Kani, A.N.; Dovi, E.; Han, R.; Li, Z.; Qu, L. Iminodiacetic acid functionalized magnetic peanut husk for the removal of methylene blue from solution: Characterization and equilibrium studies. Environ. Sci. Pollut. Res. 2020, 27, 40316–40330. [Google Scholar] [CrossRef] [PubMed]
  51. Sifoun, N.; Yeddou, A.; Nouri, L.; Chergui, A.; Nadjemi, B. Kinetic and thermodynamic studies of methylene blue adsorption on sorghum stems. Alger. J. Environ. Sci. Technol. 2020, 6, 1526–1536. [Google Scholar]
  52. Lu, Y.C.; Kooh, M.R.R.; Lim, L.B.L.; Priyantha, N. Effective and Simple NaOH-Modification Method to Remove Methyl Violet Dye via Ipomoea aquatica Roots. Adsorpt. Sci. Technol. 2021, 2021, 183–195. [Google Scholar] [CrossRef]
  53. Alshamusi, Q.K.M.; Alzayd, A.A.M.; Mahdi, M.A.; Jasim, L.S.; Aljeboree, A.M. Adsorption of Crystal Violate (CV) Dye in Aqueous Solutions by Using P (PVP-co-AAm)/GO Composite as (Eco-Healthy Adsorbate Surface): Characterization and Thermodynamics Studies. Biochem. Cell. Arch 2021, 12, 2423–2431. [Google Scholar]
  54. Özçelik, G.; Kurtulbaş Şahin, E.; Şahin, S. Effect of ionic strength on methylene blue sorption onto macroporous resins: A comprehensive study. J. Dispers. Sci. Technol. 2022, 43, 716–725. [Google Scholar] [CrossRef]
  55. de Farias Silva, C.E.; da Gama, B.M.V.; da Silva Gonçalves, A.H.; Medeiros, J.A.; de Souza Abud, A.K. Basic-dye adsorption in albedo residue: Effect of pH, contact time, temperature, dye concentration, biomass dosage, rotation and ionic strength. J. King Saud Univ. Eng. Sci. 2020, 32, 351–359. [Google Scholar] [CrossRef]
  56. Shen, S.; Huang, Y.; Wang, W.; Ding, W.; Li, Y.; Long, Z. Study on adsorption behavior of Sb(V) by ferrihydrite and its humic acid complex. Acta Sci. Circumstantiae 2019, 39, 4015–4021. [Google Scholar]
  57. Bayramoğlu, G.; Celik, G.; Arica, M.Y. Biosorption of Reactive Blue 4 dye by native and treated fungus Phanerocheate chrysosporium: Batch and continuous flow system studies. J. Hazard. Mater. 2006, 137, 1689–1697. [Google Scholar] [CrossRef] [PubMed]
  58. Aksu, Z.; Tezer, S. Biosorption of reactive dyes on the green alga Chlorella vulgaris. Process Biochem. 2005, 40, 1347–1361. [Google Scholar] [CrossRef]
  59. Akcay, G.; Akcay, M.; Yurdakoc, K. Removal of 2, 4-dichlorophenoxyacetic acid from aqueous solutions by partially characterized organophilic sepiolite: Thermodynamic and kinetic calculations. J. Colloid Interface Sci. 2005, 281, 27–32. [Google Scholar] [CrossRef] [PubMed]
  60. Saha, P.; Chowdhury, S. Insight into adsorption thermodynamics. Thermodynamics 2011, 16, 349–364. [Google Scholar]
  61. Ho, Y.S.; McKay, G. Sorption of dye from aqueous solution by peat. Chem. Eng. J. 1998, 70, 115–124. [Google Scholar] [CrossRef]
  62. Ho, Y.S.; McKay, G. Sorption of dyes and copper ions onto biosorbents. Process Biochem. 2003, 38, 1047–1061. [Google Scholar] [CrossRef]
  63. Khan, S.A.; Khan, M.A. Adsorption of chromium (III), chromium (VI) and silver (I) on bentonite. Waste Manag. 1995, 15, 271–282. [Google Scholar] [CrossRef]
  64. Ghibate, R.; Senhaji, O.; Taouil, R. Kinetic and thermodynamic approaches on Rhodamine B adsorption onto pomegranate peel. Case Stud. Chem. Environ. Eng. 2021, 3, 100078. [Google Scholar] [CrossRef]
  65. Khalid, N.; Ahmad, S.; Toheed, A.; Ahmed, J. Potential of rice husks for antimony removal. Appl. Radiat. Isot. 2000, 52, 31–38. [Google Scholar] [CrossRef] [PubMed]
  66. Unuabonah, E.I.; Adebowale, K.O.; Olu-Owolabi, B.I. Kinetic and thermodynamic studies of the adsorption of lead (II) ions onto phosphate-modified kaolinite clay. J. Hazard. Mater. 2007, 144, 386–395. [Google Scholar] [CrossRef] [PubMed]
  67. El Qada, E.N.; Allen, S.J.; Walker, G.M. Adsorption of Methylene Blue onto activated carbon produced from steam activated bituminous coal: A study of equilibrium adsorption isotherm. Chem. Eng. J. 2006, 124, 103–110. [Google Scholar] [CrossRef]
  68. Basha, S.; Murthy, Z.V.P.; Jha, B. Sorption of Hg (II) from Aqueous Solutions onto Carica papaya: Application of Isotherms. Ind. Eng. Chem. Res. 2008, 47, 980–986. [Google Scholar] [CrossRef]
  69. Aksu, Z.; Tatl, A.; Tunc, O. A comparative adsorption/biosorption study of Acid Blue 161: Effect of temperature on equilibrium and kinetic parameters. Chem. Eng. J. 2008, 142, 23–39. [Google Scholar] [CrossRef]
  70. Jou, F.-Z.; Wu, S.-T.; Yu, S.-T. Kinetics of CO2 Adsorption under Low CO2 Partial Pressures. J. Sci. Eng. Technol. 2017, 13, 45–55. [Google Scholar]
  71. Chakrabarty, S.; Tonu, N.; Saha, N.K. Removal of iron (II) ion from aqueous solution using waste tea leaves. Int. J. Eng. Sci. IJES 2018, 6, 62–67. [Google Scholar]
  72. Khayyun, T.S.; Mseer, A.H. Comparison of the experimental results with the Langmuir and Freundlich models for copper removal on limestone adsorbent. Appl. Water Sci. 2019, 9, 170. [Google Scholar] [CrossRef]
  73. Chang, T.-H. The Study of Using Chitosan Coated on Different Clays applied to Copper (II) Removal from Aqueous Solution. Master’s Thesis, Chia Nan University of Pharmacy & Science, Kaohsiung, Taiwan, 2012. [Google Scholar]
  74. Rafatullah, M.; Sulaiman, O.; Hashim, R.; Ahmad, A. Adsorption of methylene blue on low-cost adsorbents: A review. J. Hazard. Mater. 2010, 177, 70–80. [Google Scholar] [CrossRef] [PubMed]
Figure 1. Comparison between the measured and modeled time profiles and comparison of kinetic models in predicting qt for the adsorption of MB onto CRH at different initial MBB concentrations.
Separations 12 00189 g001
Figure 2. Comparison between the measured and modeled time profiles and comparison of kinetic models in predicting qt for the adsorption of MB onto CRH at different initial pH values.
Separations 12 00189 g002
Figure 3. Comparison between the measured and modeled time profiles and comparison of kinetic models in predicting qt for the adsorption of MB onto CRH at different initial concentrations of ions.
Separations 12 00189 g003
Figure 4. Comparison between the measured and modeled time profiles and comparison of kinetic models in predicting qt for the adsorption of MB onto CRH at different temperatures.
Separations 12 00189 g004
Figure 5. The Arrhenius plot for the determination of the activation energy for the adsorption of MB on CRH at different temperatures.
Separations 12 00189 g005
Figure 6. Plot of Kd versus 1000 × 1/T for the determination of the adsorption thermodynamic parameters.
Separations 12 00189 g006
Figure 7. Experimental points and comparison of the fitted curves from various adsorption isotherms for the adsorption of MB onto CRH.
Separations 12 00189 g007
Figure 8. Plot of separation factor versus initial methylene blue concentration.
Separations 12 00189 g008
Table 1. Kinetic parameters for the effects of initial dye concentration on adsorption of MB onto CRH.
Adsorbent 10 mgL−125 mgL−150 mgL−175 mgL−1100 mgL−1
qe exp (mgg−1)0.501.192.333.384.30
Pseudo-first-orderK1 (min−1)1.77 × 10−22.44 × 10−22.05 × 10−22.21 × 10−22.10 × 10⁻²
qe mod0.08 0.25 0.60 1.02 1.66
R20.660.830.820.870.89
Pseudo-second orderK2 (gmg−1 min−1)0.98 0.32 0.11 0.06 0.03
qe,mod0.51 1.20 2.37 3.47 4.46
h0.25 0.46 0.64 0.76 0.66
R211111
Elovich equationα17,750.82 1861.75 231.33 59.30 9.98
β35.97 12.50 5.10 2.95 1.80
R20.820.850.860.870.89
Table 2. Kinetic parameters for the effects of pH on the adsorption of MB onto CRH.
Adsorbent pH 2pH 4pH 6pH 8pH 10pH 12
qe exp (mgg−1)0.76 2.36 2.37 2.38 2.40 2.56
Pseudo-first-orderK1 (min−1)2.99 × 10−31.34 × 10−21.38 × 10−21.52 × 10−21.64 × 10−21.75 × 10−2
qe mod1.59 1.25 0.97 1.02 0.89 0.67
R20.910.860.820.830.840.79
Pseudo-second-orderK2 (gmg−1 min−1)0.02 0.04 0.06 0.06 0.08 0.10
qe,mod0.98 2.48 2.47 2.47 2.47 2.62
h0.02 0.25 0.36 0.37 0.46 0.72
R20.9211111
Elovich equationα0.04 0.98 6.75 3.69 11.36 19,623.86
β4.57 2.48 3.41 3.07 3.58 6.56
R20.960.940.940.940.910.97
Table 3. Kinetic parameters for the effects of ions on the adsorption of MB onto CRH.
Adsorbent 0 M NaCl0.05 M NaCl1 M NaCl0.05 M CaCl21 M CaCl2
qe exp (mgg−1)2.4832.2181.6832.2182.483
Pseudo-first-orderK1 (min−1)2.26 × 10−21.15 × 10−25.99 × 10−37.14 × 10−34.61 × 10⁻³
qe mod1.04 1.65 1.90 2.06 1.85
R20.960.950.950.980.93
Pseudo-second-orderK2 (gmg−1 min−1)6.78 × 10−22.47 × 10−21.90 × 10−21.23 × 10−22.39 × 10⁻²
qe,mod2.48 2.31 1.76 1.99 1.50
h4.16 × 10−11.32 × 10−15.90 × 10−24.85 × 10−25.39 × 10−2
R20.990.990.940.920.95
Elovich equationα5.25 0.30 0.13 0.09 0.12
β3.20 2.19 2.71 2.16 3.28
R20.950.990.930.950.93
Table 4. Kinetic parameters for the effects of temperature on the adsorption of MB onto CRH.
Adsorbent 278.15 K298.15 K308.15 K323.15 K
qe exp (mgg−1)2.372.382.452.52
Pseudo-first-orderK1 (min−1)3.80 × 10−21.64 × 10−22.03 × 10−22.56 × 10−2
qe mod2.47 0.60.83 0.65
R20.710.740.860.87
Pseudo-second-orderK2 (gmg−1 min−1)0.05 0.15 0.09 0.16
qe,mod2.42 2.36 2.47 2.54
h0.32 0.82 0.56 1.02
R20.990.990.990.99
Elovich equationα2.54 231.3310.07 883.50
β2.99 5.10 3.45 5.27
R20.970.860.850.82
Table 5. Thermodynamic parameters for the adsorption of MB onto CRH.
T (K)ΔH° (KJ mol−1)ΔS° (KJ mol−1 K−1)ΔG° (KJ mol−1)R2
27828.8640.11−0.560.76
298−2.68
323−3.73
323−5.32
Table 6. Isotherm parameters for MB adsorption onto CRH.
Langmuirqmax (mgg−1)5.72
KL (Lmg−1)0.20
R20.97
FreundlichKF (mg1−(1/n) L1/ng−1)0.98
n1.68
R20.99
TemkinAT (Lg−1)3.26
BT2397.08
R20.92
Table 7. Comparison of adsorption capacities of various adsorbents for methylene blue.
Adsorbent qm (mg/g)References
Rice husk4.30This study
Activated carbon from Hazelnut shell8.82[74]
Apricot stone-activated carbon 750 °C4.11 [74]
Coarse ground wheat straw 3.82 [74]
Neem (Azadirachta indica) leaf powder 3.67[74]
Walnut shell-activated carbon 750 °C 3.53[74]
Finely ground wheat straw 2.23[74]
Almond shell-activated carbon 750 °C 1.33[74]
Fir wood-based activated carbon1.21 [74]
Corncob-based activated carbon 0.84[74]
Disclaimer/Publisher’s Note: The statements, opinions and data contained in all publications are solely those of the individual author(s) and contributor(s) and not of MDPI and/or the editor(s). MDPI and/or the editor(s) disclaim responsibility for any injury to people or property resulting from any ideas, methods, instructions or products referred to in the content.

