Review

Nanoplastics: From Separations to Analysis—Challenges and Limitations

by
Justyna Ośko
*,
Kornelia Kadac-Czapska
,
Katarzyna Jażdżewska
,
Natalia Nowak
,
Piotr Kowalczyk
and
Małgorzata Grembecka
*
Department of Bromatology, Faculty of Pharmacy, Medical University of Gdańsk, 80-416 Gdańsk, Poland
*
Authors to whom correspondence should be addressed.
Separations 2025, 12(7), 185; https://doi.org/10.3390/separations12070185
Submission received: 25 June 2025 / Revised: 10 July 2025 / Accepted: 14 July 2025 / Published: 15 July 2025

Abstract

The issue of nanoplastics (NPs) in the environment, following that of microplastics (MPs), is receiving increasing attention in the scientific community. Due to their size, these particles require the development and application of new methods for both quantitative and qualitative determination. Consequently, techniques commonly used for analyzing MPs may prove ineffective in the context of NPs. Isolating NPs from samples with complex matrices poses a significant challenge that directly affects analytical outcomes. This paper aims to discuss the main challenges encountered during the analysis of NPs in environmental samples. Various methods for the visualization and identification of NPs are examined, with a focus on microscopic, spectroscopic, and thermal techniques. The advantages and limitations of analytical approaches reported in the literature are summarized, offering guidance for the future development and standardization of methods used to determine NPs in environmental contexts.

Graphical Abstract

1. Introduction

For over 50 years, plastics have been an indispensable material used by humans. Industries such as packaging, construction, textiles, consumer goods, transport, and electrical and electronic sectors use plastic products on a daily basis [1]. It is estimated that over 460 million tons of plastic are produced globally each year [2]. Inadequate waste management leads to the release and accumulation of plastic waste in the environment, which is a major source of pollution. An estimated 71% of plastic waste ultimately ends up in aquatic or terrestrial environments [3].
In nature, plastic pollutants undergo photo- and thermo-oxidative degradation, as well as mechanical fragmentation (e.g., physical abrasion). UV exposure is also a contributing factor to their degradation through photochemical processes. To a lesser extent, they also undergo biodegradation (i.e., microbial degradation), resulting in debris of various sizes, including MPs and NPs [3,4,5]. MPs range in size from 0.1 µm to 5 mm, while NPs range from 1 nm to 100 nm [6]. In recent years, the presence of NPs has been detected in various environmental matrices, including aquatic, terrestrial, and atmospheric systems [7]. Nevertheless, developing procedures for determining NPs in such matrices remains challenging, as it requires the consideration of their chemical complexity, which can complicate the analysis [8]. Furthermore, these particles are distinguished by specific properties, which can also influence the selection of suitable separation techniques. Among the separation techniques are chemical digestion and filtration, magnetic extraction, field-flow fractionation (FFF), ultracentrifugation, and capillary electrophoresis (CE). Additionally, surface-enhanced Raman spectroscopy (SERS) can be used for subsequent identification and characterization. Nanoplastics rarely occur in isolation in the environment. Instead, they tend to form heteroaggregates with various natural and anthropogenic substances [9]. These may include minerals, natural organic matter, and other plastic particles [7]. The formation of heteroaggregates raises environmental and health concerns. These structures can impact aquatic ecosystems, modify how NPs interact with cells and tissues, facilitate their transport within organisms, and potentially accumulate in organs. This may lead to long-term health effects such as inflammation, oxidative stress, and cellular damage [9]. Moreover, NPs can also adsorb and transport other contaminants, further increasing environmental and health risks [10,11,12].
Nanoplastics are of growing concern due to their widespread occurrence and potential negative impacts on both ecosystems and human health [13]. There are some articles [14,15,16,17,18] published on methods for the analysis of NPs and their removal from the environment. However, previous reviews [14,15,16,17,18] have predominantly encompassed studies on so-called ‘micro/nanoplastics’, defined as polymeric mixtures of particles with poorly defined or overlapping size ranges. This has a significant impact on the type of research methods used and the accuracy of the analytical results. Consequently, the present review concentrates on the qualitative and quantitative analysis of only clearly defined nanoplastic particles in environmental samples. It also presents potential challenges and limitations encountered in this field. Each step of the analytical procedure is discussed, including the quality control, sampling, separation, and determination of NPs. Furthermore, this document highlights key elements to be considered during NP analysis, thus supporting future research in this field.

2. Materials and Methods

The literature review was based on scientific articles accessed through the ScienceDirect, PubMed, and Google Scholar databases. The term “nanoplastic” was combined with keywords such as “identification”, “sampling”, “limit of detection (LOD)”, “separation”, “determination”, “filtration”, “quality control”, “environment”, “soil”, “water”, “freshwater”, “air”, and “atmosphere”. These words were searched within the titles, abstracts, and keywords of the publications. Special attention was given to studies addressing particles ≤ 100 nm in size, as well as to the sampling, identification, and quantification of NPs, with a focus on dust, soil, and water matrices. The analysis focused on peer-reviewed, English-language articles published after 2020. Articles published prior to 2020 were included when deemed particularly relevant to research on NPs.

3. Nanoplastics

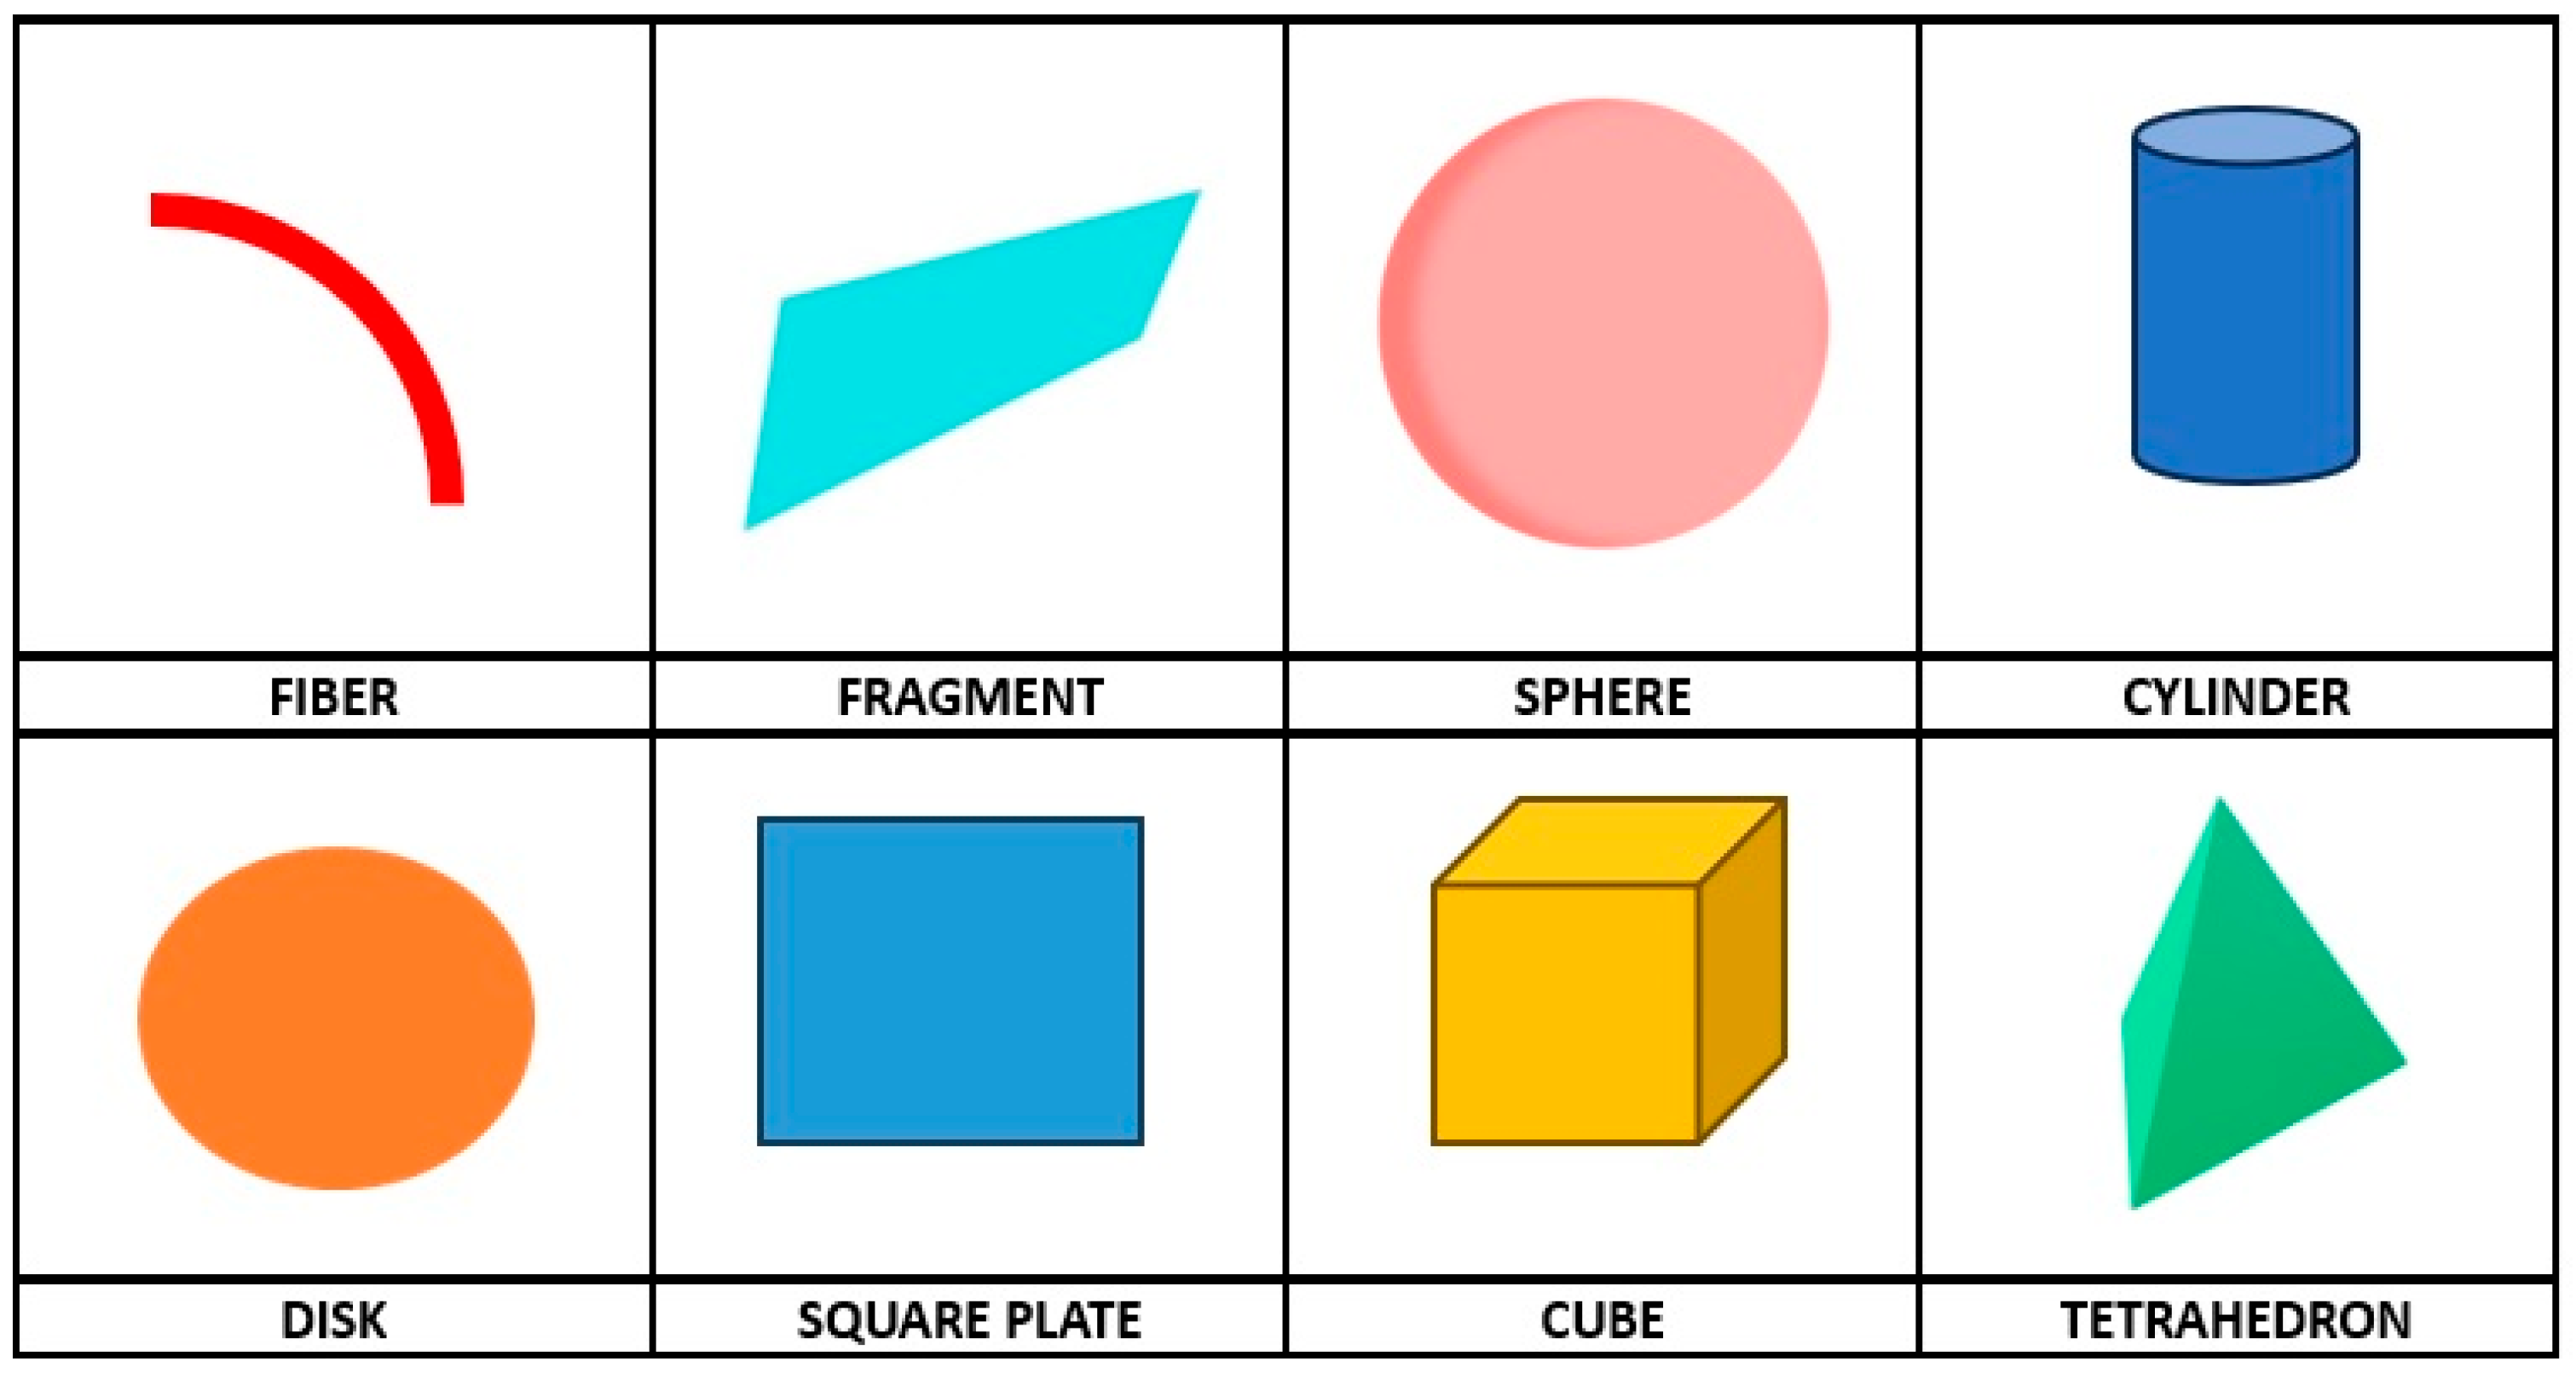
3.1. Classification and Properties

Nanoplastic sources can be divided into primary and secondary [19]. Primary NPs can be used in nanomedicine, nanoimaging, and nanosensors, as well as in water-based dispersion paints [20,21]. They have also been used as an ingredient in exfoliating cosmetics [22]. Secondary NPs can originate from the breakdown of plastics subjected to physical, chemical, or biological forces [19]. The most frequently reported secondary sources of NPs include wastewater treatment plants, abraded tires, and laundry effluents discharged from washing machines [23,24,25]. Primary NPs are typically spherical, whereas secondary NPs are non-spherical. The particles often appear as fibers or fragments [26]. However, the most frequent shapes of NPs are divided into regular and irregular. Regular ones include spheres, cylinders, disks, square plates, cubes, other cuboids (square and rectangular prisms), tetrahedrons, and fibers, as illustrated in Figure 1 [27].
Nanoplastics are smaller and more reactive, potentially posing more risks to organisms than MPs [28]. A comparison of the characteristics of MPs and NPs is shown in Table 1.

3.2. Occurrence and Matrices

The occurrence of NPs in the environment is primarily the result of the degradation of larger plastic materials under the influence of sunlight, heat, and mechanical forces [38]. Furthermore, atmospheric pollutants such as aerosols and fog have been demonstrated to act as carriers of NPs from the atmosphere to aquatic environments [39].
Although the number of studies reporting the presence of NPs in the atmosphere is increasing, many do not conform to the definition established by European Food Safety Authority (EFSA). In addition, many of these investigations primarily focus on measuring total plastic concentrations in the atmosphere [40]. Nanoplastics have been detected in urban air in several cities. Yuan et al. [41] detected NPs in PM2.5 (particulate matter) samples collected in Shenyang city. The highest measured concentration was 28.92 µg/m3. The mass analysis of atmospheric PM2.5 revealed the following polymer distribution: polyethylene (PE) (43%) > poly(vinyl chloride) (PVC) (36%) > polyamide (PA) (15%) > polypropylene (PP) (6%) [41]. Kirchsteiger et al. [42] also found NPs in PM2.5 in the city of Graz, Austria. At the single-polymer level, the highest reported concentrations were 256 ng/m3 for poly(ethylene terephthalate) (PET), 326 ng/m3 for PP, and 290 ng/m3 for PE [42].
Nanoplastics are also increasingly being detected in aquatic environments. The primary sources of NP contamination include industrial sewage, surface runoff, and atmospheric deposition. Furthermore, NPs can interact with metals and inorganic colloids, thereby facilitating the settling of nanoparticles [43]. In a study by Li et al. [44] conducted on wastewater in China, the concentrations of PE and PVC NPs (20–1000 nm) were found to be 0.86 µg/L and 137 µg/L, respectively. This contamination was attributed to the aging of pipelines made from these materials.
In tap water, NP contamination may also result from wastewater treatment processes that degrade MPs into NPs. Subsequently, these nanoparticles are transported to water treatment processes [45]. In the majority of cases, sewage treatment facilities or households use pipes typically made of PE, PVC, PP, or cast iron. Additionally, the interior surfaces of the cast-iron pipes may be coated with a layer of epoxy resin. Water flow through these pipes can lead to the scouring of plastic material from the pipe walls and joints, especially those made of PA [45]. For instance, in a study conducted by Li et al. [46] in China, concentrations of nanoplastic particles ranging from 1.67 to 2.08 µg/L were detected in tap water samples. The detected NPs were identified as polyolefins, PS, PVC, and PA, with sizes ranging from 58 to 255 nm [46].
In environmental matrices such as soil, large plastic debris has been shown to degrade into MPs and NPs over time, primarily as a result of environmental weathering processes. The transportation of plastic particles within soil is predominantly influenced by the dynamics of water flow and bioturbation [47]. The formation of NPs in soil is believed to continue for up to 30 years due to limited photodegradation [48]. Foetisch et al. [49] confirmed the presence of plastic particles in soil samples. However, most of these particles have dimensions exceeding 100 nm and therefore do not fall within the current definition of NPs [49].

4. Challenges and Problems Related to NPs Isolation

The determination of NPs in environmental samples is a complex process comprising several key stages: sample collection, preparation, and both quantitative and qualitative analysis. At each stage, it is essential to prevent the external contamination of the sample by implementing rigorous quality control measures. The subsequent sections will provide a detailed discussion of each step involved in the analysis of NPs, highlighting the challenges that researchers have encountered in recent years.

4.1. Quality Control

A key step in the determination of NPs is ensuring conditions that prevent unintentional sample contamination. Currently, laboratory protocols used for the analysis of MPs are often applied to NP research.
One primary consideration is the protection of both the sample and the researcher from contamination and exposure. In both MP and NP studies, wearing cotton lab coats is considered standard practice. Another important aspect is the use of gloves—typically either disposable nitrile or cotton gloves. Disposable gloves protect researchers from potential exposure to reagents. However, it has been shown that plastic-based gloves themselves may serve as a source of contamination. To investigate this issue, Witzig et al. [50] employed μ-Raman spectroscopy, Fourier transform infrared microspectroscopy (μ-FTIR), and pyrolysis–gas chromatography–mass spectrometry (Pyr-GC/MS) to assess the degradation of powder-free disposable gloves after five hours of contact with ultrapure water. The results indicated that gloves can release stearates and sodium dodecyl sulfate, potentially causing an overestimation of PE MPs in analytical results [50]. Notably, this study did not assess glove exposure to ultrapure water for durations shorter than five hours. Extending the range of contact times could better simulate the real impact of gloves on analytical outcomes. Currently, no data are available regarding disposable gloves as a potential source of NPs. Therefore, disposable gloves continue to be widely used in NP analysis [30,44].
Another important factor is the purity of the solvents employed in the analysis. It has been shown that chemical reagents should be filtered 1–3 times before performing tests aimed at detecting plastic particles smaller than 100 µm [51]. Notably, most studies on NPs used analytical-grade reagents and Milli-Q ultrapure water without implementing additional purification steps [30,44,46,52,53].
Furthermore, it is recommended that filtered reagents are stored in glass or plastic containers [54]. However, most studies report that analytical equipment is made exclusively of glass or metal. Specific quality control measures reported in the literature are summarized in Table 2. Using flow cytometry, it has been shown that glass may release more plastic particles in the 200–700 nm range than plasticware. This was explained by the higher restrictions associated with the production and storage of plastic materials such as test tubes and pipette tips [55]. However, it should be noted that the size range of the particles studied exceeds the commonly accepted definition of NPs.
The sample preparation steps for analysis should be carried out in an area free of NP contamination. To achieve this, laboratory fume hoods, laminar flow hoods, and biosafety cabinets are commonly used. Lin et al. [56] conducted a study to evaluate emissions of NPs from fume hoods using constant air volume (CAV), variable air volume (VAV), and air curtain (AC) systems. These hoods differ in their design and ventilation mechanism. The frontal air velocity of the hood can have a significant effect on particle emissions. It was observed that AC systems did not emit NPs under various operating conditions. In the case of CAV and VAV systems, it was shown that at a frontal velocity above 0.4 m/s, the complete prevention of air pollutant emissions was achieved [56]. However, laboratory fume hoods draw unfiltered air from the surrounding environment and, while they reduce researcher exposure, they may still lead to sample contamination [55].
Another option when preparing a sample for NP determination is to use a laminar flow hood. These devices draw air through high efficiency particulate air (HEPA) filters and create a laminar flow toward the work area [57]. This setup prevents the ingress of unfiltered air and minimizes the risk of contamination by particles larger or smaller than 0.3 µm [55]. However, a laminar fume hood does not protect the user from contamination. In addition, volatile or flammable chemicals should not be used. In contrast, biological safety cabinets are designed primarily to protect the user from infectious materials. Sample protection is provided by Class II and Class III biosafety cabinets, which also ensure a contamination-free working environment [58].
Another important consideration is protecting the sample from NP contamination outside the laminar fume hood or biological safety cabinet. For MP testing, the use of aluminum foil or glass lids to cover sample containers is generally recommended [57]. For NP testing, aluminum foil is also commonly used to protect samples [46,52]. In some cases, it is pre-cleaned with an organic solvent [30]. In contrast, some publications do not provide information on how the sample is protected [53,59]. It has been suggested that fresh aluminum foil may itself be a source of plastic particle contamination. Using flow cytometry, Jones et al. [55] detected 168.9 plastic particles/mL in aluminum foil samples used as dust collectors over a 30-day period. Furthermore, aluminum foil is regarded as a fragile material that is susceptible to tearing. It is therefore also recommended that a glass or wooden cover be used to protect samples from contamination [60].
In addition, quality control measures, including blank samples, are implemented during the analysis to account for potential contamination and instrument variability [38]. In the majority of cases, ultrapure water is used as a negative control sample in water matrix testing. It is noteworthy that Okoffo et al. [30] prepared several blank samples for the determination of NPs in environmental and potable water samples. This approach enabled the identification of potential contamination at various stages of sample processing and analysis. For example, the blank samples were divided into field, procedural, and instrumental samples. Field blank samples were prepared at the actual sampling stage. Procedural blank samples were subjected to the same processing steps as the real samples. Instrumental blank samples were analyzed using Pyr-GC/MS [30]. Alternatively, a blank sample may be prepared to undergo the entire analytical procedure alongside the actual sample. This approach enables a comprehensive evaluation to ascertain whether the analytical procedure is susceptible to sample contamination [53]. It should be noted that blank samples are usually stored in properly washed glassware. In MP testing, glassware is sometimes additionally heated in an oven at temperatures exceeding 400 °C [55]. However, glassware heating has not been reported in NP-related studies.

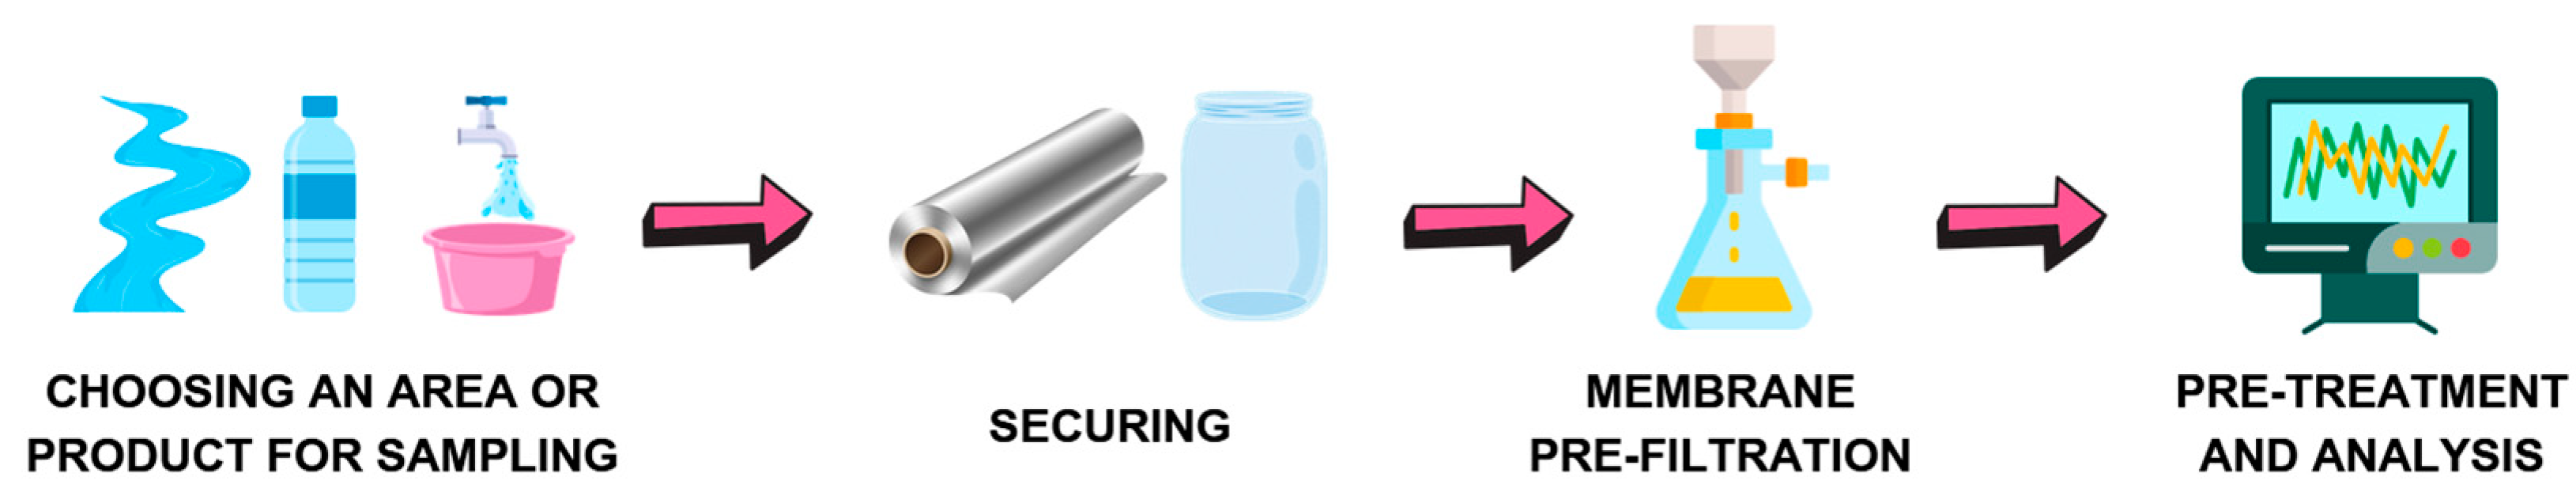
4.2. Collecting Samples

In order to properly estimate NP pollution in the chosen matrix, the collected samples must be representative. However, there are no specific guidelines or protocols available for NPs [61,62]. As such, researchers generally rely on experience gained from MP analysis. The basics of NP sample collection are shown in Figure 2.
The use of plastic containers for storing samples is not recommended, as they may serve as a source of NPs contamination. Instead, materials such as stainless steel and glass are preferred, with glass stoppers and aluminum foil commonly used as covers [62,64]. Each step of the sampling process should include appropriate quality control measures.
At the time of writing, there are no reports indicating that MPs or NPs undergo further degradation before or during analysis, such as during transportation or storage. However, since the presence of larger MPs may interfere with NP-focused analyses, additional sample preparation steps are often required. This typically involves pre-filtration using membranes with pore sizes ranging from 0.22 to 1.00 µm to separate and remove possible MPs [30,62]. The separation of larger particles can also be achieved through centrifugation and sedimentation [65].

4.3. Separation of NPs from Matrix

The separation of NPs from the matrix is a crucial step in the procedure for their determination in a sample. These techniques should not degrade the NPs or cause their loss during processing. On the other hand, the sample matrix should not interfere with the identification of plastic particles. Moreover, the NP isolation method influences the selection of appropriate techniques for qualitative and quantitative analysis.

4.3.1. Chemical Digestion and Filtration

Typically, the chemical digestion of the sample matrix and filtration are combined during the isolation of NPs. One example is sequential filtration, which involves using several filters with different pore sizes. Li et al. [44] applied triple filtration with filters of 1000 nm, 200 nm, and 20 nm pore sizes to isolate NPs from treated water samples. Only the material retained on the two smaller filters was used for analysis. The aim of this filtration method is also to prevent filter clogging. Then, the filters were digested using hydrochloric acid (HCl) and hydrogen peroxide (H2O2). However, the recovery of NPs from water samples was not determined for this technique [44].
Another example of sequential filtration was applied for tap water samples. Li et al. [46] used prefiltration with a 0.45 µm filter to remove large particles. In the next step, filtration was performed using filters with pore sizes of 200 nm, 100 nm, and 20 nm. The filters were then crushed, sonicated, and retentates were treated with HCl and H2O2. The gravimetric method was used to calculate the recovery. The filters were weighed before and after the filtration of a sample containing a mixture of standard PS beads with dimensions of 50, 150, and 250 nm, and the difference in weight was calculated. A recovery of 95.82 ± 1.44% was obtained for 50 nm PS NPs. The presented isolation technique was considered reliable for aqueous matrices [46].
An alternative approach involves the preliminary chemical digestion of the sample matrix, followed by filtration. This sequence was used for environmental and potable water samples [30]. Initially, Okoffo et al. [30] treated the samples with H2O2 and filtered them through a 1 µm filter. A key feature of this method was that filters retaining particles larger than 1 µm were discarded after filtration. As stated by the authors, this resulted in the loss of potentially agglomerated NPs larger than 1 µm. Then, the filtrate was further processed by concentration, ultrafiltration, freeze-drying, and sonication. Milli-Q water and wastewater samples were spiked with PS (30, 200, and 700 nm) and poly(methyl methacrylate) (PMMA) (70, 110, and 740 nm) solutions and then subjected to the same processing steps as the real sample. Additionally, unspiked Milli-Q water and wastewater samples were treated as blank samples. Recovery was calculated as the difference between the mass of NPs detected by Pyr-GC/MS in the spiked sample and the mass of NPs detected in the blank sample, divided by the mass of added PS and PMMA. The extraction efficiency of the enriched NPs ranged from 58.3 ± 2.3% to 68.1 ± 2.3% in Milli-Q water and from 54.6 ± 2.9% to 64.2 ± 3.1% in wastewater samples. The authors admitted that the complexity of the NP isolation steps could have had an impact on the loss of particles. It is believed that these particles could physically adhere to the equipment and materials used [30].

4.3.2. Magnetic Extraction

Magnetic extraction and depolymerization involve the extraction of PET NPs using porous magnetic ZIF-8 nanoparticles (Nano-Fe@ZIF-8) in an organic solvent [66]. Then, Pasanen et al. [66] removed the extracted NP aggregates by the action of an external magnetic field and depolymerized the particles with ethylene glycol. This isolation method allowed the determination of the glycolysis product using high-performance liquid chromatography (HPLC). In addition, the NP separation technique was applied to spiked bottled water samples, yielding a recovery of 91.5–109.3%. However, the PET particles obtained during extraction had an average size of 200 nm, which also includes particles that do not fit the definition of NPs. The authors admit that the advantages of this extraction technique include its speed. However, no attempts were made to isolate polymers other than PET [66].
Another example is the use of hydrophobically functionalized magnetic nanoparticles for the separation and concentration of NPs from model environmental matrices. Surette et al. [67] used metal-doped PS NPs, which were removed from suspensions and captured on regenerated cellulose membranes. Nanoplastics were extracted from synthetic fresh water and synthetic seawater, among other matrices. The recovery was 78.9% and 56.1% for synthetic freshwater and seawater, respectively. It was observed that the synthetic fresh water required the addition of sodium chloride to induce particle aggregation. Furthermore, it was found that this technique is not suitable for highly turbid surface water or seawater samples [67].

4.3.3. Field-Flow Fractionation

Field-flow fractionation is a particle size-based separation method [68]. This non-destructive technique is suitable for isolating particles ranging from 1 to 1000 nm. A variant of FFF is asymmetrical flow-FFF (AF4), which can be coupled with detectors such as ultraviolet–visible (UV-Vis), refractive index, fluorescence, multi-angle light scattering (MALS), and dynamic light scattering (DLS) detectors. This allows the separation of NPs as well as qualitative and quantitative determination [69].
An example is the use of AF4-MALS-UV to determine the size of NPs in an aqueous matrix. Valido et al. [70] used PS NPs ranging in size from 30 to 490 nm for this purpose. The optimized method showed good repeatability, as no statistical differences were observed in the results throughout the day. The authors noted that the method should be further developed for environmental samples, as it only accounts for spherical PS NPs [70].
Furthermore, Wahl et al. [48] found that AF4 could be used to remove organic chemicals that could hinder the detection of NPs in contaminated soil samples.

4.3.4. Ultracentrifugation

Density gradient ultracentrifugation (DGU) was used to isolate NPs of PS, PA, PMMA, polycarbonate (PC), PVC, and PET from soil samples. Jing et al. [71] used cesium chloride and various volume ratios of the solution and water to separate particles ranging from 1 nm to 300 µm (a range exceeding typical NPs dimensions). The recovery was 78.5–96.0%. The technique showed high selectivity for both soil and water samples. In addition, DGU is a cost-effective method compatible with various analytical techniques and offers a significantly shorter sample pretreatment time (0.5 h) [71].

4.3.5. Capillary Electrophoresis

Another method for separating NPs involves hydrophobic interactions with organic dyes, based on the principle of donor–acceptor binding. This takes advantage of the large specific surface area of NPs. Lai et al. [72] exploited ionic interactions between PS NPs (9.5, 80, and 90 nm) and fluorescent dyes such as rhodamine 6 G, coumarin 521, and fluorescein. Then, CE was used to efficiently separate the particles based on their size-to-charge ratio. According to the authors, this technique is fast and suitable for the separation of polydisperse NPs in aqueous samples. However, quantifying mixtures of different NPs using this method may be challenging [72].
Adelantado et al. [73] attempted to separate PMMA, PP, and PE NPs smaller than 200 nm using CE under alkaline conditions. They showed that the NP separation mechanism involves a combination of linear and nonlinear electrophoretic effects. Moreover, this separation technique can be coupled with a diode array detector (DAD) operating in the UV-Vis range to identify and quantify NPs. On the other hand, the authors believe that when analyzing real samples, additional concentration steps, such as filtration, are necessary prior to CE. This is due to the fact that the molecules present in the sample may absorb UV light, which could interfere with the analysis [73].

4.3.6. Separation Techniques Coupled with Surface-Enhanced Raman Spectroscopy

Surface-enhanced Raman spectroscopy can be coupled with luminescent metal–phenolic networks. Labeling with zirconium ions, tannic acid, and rhodamine B enables the separation of NPs such as PS, PMMA, and polylactic acid (PLA), ranging from 20 to 500 nm, from liquid media. Using this separation technique, Ye et al. [74] achieved a recovery of 90–120% for tap water and lake water samples. In the case of sea water, the recovery was below 60%. This was attributed to the presence of biological compounds and salts in the samples, which interfered with the labeling [74]. Another approach was proposed by Yang et al. [75], who enhanced SERS with a checkerboard-patterned substrate composed of polydomain silver nanoparticles activated by an enhanced electromagnetic field. The objective of this procedure was to enable the preconcentration of NPs. This facilitated the determination of PS NPs with dimensions ranging from 30 to 1000 nm in spiked samples of tap water and lake water. An additional advantage is that NPs can be concentrated within one minute. Conversely, the recovery for this method was not reported, leaving its accuracy uncertain [75]. Zhou et al. [76] stated that, due to the complexity of environmental sample matrices, density separation or chemical/enzymatic degradation should be applied prior to SERS measurements.

5. Analytical Methods

A variety of techniques for the analysis of NPs are described in the current literature. Existing studies focus on microscopic, spectroscopic, and thermal techniques. A summary of the methods discussed in Section 5.1 is provided in Table 3. Typically, a combination of techniques is employed to identify NPs, thereby facilitating both a visual assessment of the particles and the determination of their chemical composition.

5.1. Methods for the Analysis of NPs

5.1.1. Microscopic Techniques

Transmission electron microscopy is a technique that can achieve a resolution down to 0.1 nm. However, its application in the analysis of plastic particles remains a subject of debate. It is believed that due to the amorphous nature of polymers, NPs should be stained with heavy elements to increase their detection efficiency [77]. On the other hand, Kalaronis et al. [77] stated that staining particles can affect their chemical composition. Furthermore, this technique was mainly used in natural waters and experimental solutions [77]. Yang et al. [78] reported that both agglomerated PET NPs and single-molecule PET NPs were captured by TEM. The investigation focused on NPs with dimensions ranging from 158 to 190 nm, as present in textile washing wastewater samples. Notably, NPs smaller than 100 nm were excluded from the image analysis, as the smallest identifiable PET NPs were 100 nm. However, it was a complementary technique to others, such as scanning transmission X-ray microspectroscopy (STXM), scanning electron microscopy (SEM), and nanoparticle tracking analysis (NTA). It was determined that the TEM image exhibited a superior resolution in comparison to the STXM image. This observation facilitated a more precise size analysis [78]. In a seminal study, Davranche et al. [79] observed NPs with dimensions ranging from 200 to 1000 nm in sand water extract samples. However, it was acknowledged that this technique lacks selectivity for NPs and necessitates the confirmation of their presence through chemical composition analysis [79].
Another technique that is applicable in the analysis of NPs is atomic force microscopy (AFM). It is a high-resolution technique down to 0.3 nm. One of its advantages is the relatively simple sample preparation required for analysis. On the other hand, the tip of the device can be a source of contamination or damage to the sample, which can affect image quality [80]. AFM techniques are divided into quasi-static AFM and multi-frequency AFM, the latter being more suitable for the identification of plastic particles. Multi-frequency AFM can characterize nanoplastic aggregates and observe aging processes. However, it is not suitable for identifying the composition of NPs [81]. In order to determine the particle size and functional groups of NPs in environmental samples, atomic force microscopy-based infrared spectroscopy (AFM-IR) was used. Polyethylene and PVC nanoparticles with dimensions of 20–1000 nm were examined in drinking water subjected to treatment processes [44]. Atomic force microscopy-based infrared spectroscopy has also been used to identify NPs in tap water. It was found that this technique does not allow for the determination of all types of polymers in the sample. However, this technique provides greater detail than FTIR and allows for the identification of chemical functional groups within microscopic regions [46].
Fluorescence microscopy is a relatively high-resolution technique. When combined with confocal scanning, it enables the detection of fluorescently labeled NPs with sizes below 100 nm [82]. Fluorescence microscopy combined with Nile Red staining and single-particle counting has been used to quantify 100 nm PS NPs in tap and bottled water samples. This technique is considered rapid, cost-effective, and does not require sample pretreatment for simple matrices. However, distinguishing stained NPs from Nile Red aggregates in the sample can be challenging, and additional corrections may introduce errors. Consequently, using lower concentrations of Nile Red may help reduce the formation of its aggregates [83]. According to Mandemaker et al. [82], fluorescence microscopy is a viable method for the direct identification of NPs in spiked samples. However, its applicability to real samples remains to be ascertained. This limitation is primarily due to dye leaching and autofluorescence from organic matter, which can interfere with result interpretation [82].

5.1.2. Spectroscopic Techniques

Surface-enhanced Raman spectroscopy is a non-destructive technique increasingly used in NP analysis due to its high sensitivity, which allows for the detection of trace amounts of analyte [84]. The technique amplifies Raman signals through local surface plasmon resonance (LSPR) generated at the interface of metallic nanostructures [75]. It has been demonstrated that SERS facilitates the detection of NPs as small as 20 nm. However, it should be noted that detection sensitivity depends on both the electromagnetic field enhancement provided by noble metal substrates and chemical amplification mechanisms. Separating the NP isolation step from their detection by SERS is not recommended, as it may lead to particle loss during the transfer process [75,85]. Techniques for separating NPs from the sample matrix prior to SERS analysis are discussed in Section 4.3.6. Notably, SERS combined with luminescent metal–phenolic networks allows for the quantitative determination of NPs in the sample within approximately 30 min. However, a limitation of this method is its inability to distinguish between different NP sizes [74]. In turn, SERS with a checkerboard substrate composed of polydomain silver nanoparticles enabled detection of NPs within one minute [75].
An alternative method for quantifying NPs is Mie scattering, which enables the rapid detection and quantification (within 20 s) of 25 nm PS NPs in water samples, including those from bottled water. Mou et al. [59] demonstrated the capacity of the method to determine the concentration of NPs within a mixture of particles of varying sizes.
Laser-Induced Breakdown Detection (LIBD) is a technique in which a high-energy focused laser beam (515–532 nm) irradiates NPs, leading to their ionization. The resulting excited electrons generate plasma shockwaves, which can be analyzed using optical (charge-coupled device camera) and acoustic (piezoelectric crystal) detection to determine particle concentration [86]. The sensitivity of this method is significantly impacted by several factors, including particle density, ionization energy, light absorption capacity, hardness, and the degree of aggregation. Additionally, consistent quantification results can only be achieved for NPs suspended in pure or simple water matrices. Nonetheless, the method has been successfully used to detect PS, PET, and PP NPs with sizes around 100 nm and densities ranging from 0.9 to 1.4 g/mL. It allows in-line monitoring and can be combined with size separation methods to simplify the matrices [86].
Nanoparticle tracking analysis (NTA) is a detection method that enables the measurement of particle concentration and size distribution by tracking the Brownian motion of particles diffusing in solution, using laser illumination and a microscope equipped with a video camera [87,88]. The lower limit of the particle size detectable by this method is influenced by its refractive index and can be as low as 10 nm [87]. It is considered to be a sensitive method. However, it does not differentiate between particle types, which can lead to false positives, thereby rendering polymer type identification impossible. Additionally, LODs associated with this method are typically high, which may limit its applicability for analyzing environmentally relevant concentrations of NPs [65,89].

5.1.3. Thermal Analysis

Pyrolysis–gas chromatography–mass spectrometry is an analytical technique used for the identification and quantification of NPs. However, it is time-consuming and destructive, which limits its applicability for observing the fragmentation or agglomeration of NPs [59]. Since it is independent of particle size, Py-GC/MS can be effectively applied to the analysis of NPs [90].
Okoffo et al. [90] reported that Pyr-GC/MS is both sensitive and effective for detecting plastic nanoparticles with sizes below 1 µm in wastewater samples. The method was used to determine eight polymers: PE, PP, PET, PS, PMMA, PC, NYL 6, and 66. Due to interference from the sample matrix, PVC could not be reliably detected in the samples. The validation of the method was conducted using PS and PMMA nanoparticles with dimensions in the range of 30–740 nm [90]. As Okoffo et al. [30] found, lipids, waxes, and proteins present in the environmental and potable water samples can also decompose into the same pyrolysis products as plastics. Therefore, more specific and less interfered pyrolysis products were selected for the identification of NPs. The identification of NPs with dimensions between 10 and 1000 nm revealed the presence of PE, PP, PET, PMMA, PC, PVC, NYL 6, and 66 [30].

5.1.4. Other Methods

Some of the newer methods currently under investigation for the analysis of NPs cannot be readily categorized within the previously discussed analytical techniques. They are therefore presented separately in this section.
A recently developed method is the estrogen receptor gold nanograting biosensor, designed for the detection and quantification of NPs. Seggio et al. [91] proposed the use of an estrogen receptor-based recognition element grafted onto a polymer supported gold nanograting plasmonic platform. Receptors were functionalized to bind and detect PMMA NPs. Plasmonic spectra were obtained and analyzed. The method demonstrated a strong potential, enabling the accurate quantification of 100 nm particles in water samples. It required a minimal sample volume (2 µL), provided rapid response times (3 min), and did not necessitate any pretreatment. Furthermore, it achieved an LOD of 0.39 ng/mL, which was significantly lower than that of other methods. The results obtained were verified through filtration and evaporation. However, the sensor was not evaluated for high concentrations of NPs or for detecting other types of polymers. Additionally, the operational lifetime of the sensor was limited to approximately two weeks [91].
Another group of methods includes electrochemical techniques. Chen et al. [92] demonstrated that techniques such as resistive pulse sensing and single microparticle–electrode impacts enable the simultaneous identification of the size and composition of plastic particles in urban waters. While the authors believe these techniques can identify NPs, they acknowledge that this capability has yet to be confirmed. Despite their potential limitations regarding analyte size, these techniques can successfully detect contaminants associated with NPs and MPs. Electrochemical techniques have also been applied for the removal of NPs from urban waters [92].

5.2. Required Properties of Analytical Methods and Challenges in Nanoplastic Analysis

In recent years, the awareness of NPs as an emerging contaminant increased [93]. Their specific characteristics (e.g., nanoscale size and colloidal nature) make it difficult or impossible to analyze them using the same methods as for MPs. Despite the clear limitations for methods used in NPs analysis (e.g., the inability of Pyr-GC/MS to provide particle counts), the same fundamental methodological requirements apply to both MP and NP analysis [94].
The first crucial parameter is accuracy, a key component of the method validation process, which can be assessed through recovery testing [95]. In recovery tests, complex matrices (e.g., lake water) can introduce various interferences, which may selectively affect specific polymer types. For example, Ye et al. [95] reported a lower recovery for PLA in both tap and lake water compared to PS and PMMA. This was attributed to microbial activity. However, for PE, the recovery was reduced only in lake water, not in tap water, due to lake water constituents diminishing the intensity of the PE Raman peak at 1297 cm−1 [95]. Particle shape can also contribute to differences in recovery. Cai et al. [65] observed nearly a twofold decrease in recovery for spherical PS compared to fragmented PS. This was attributed to differences in zeta potential, as spherical PS was more stable in suspension and thus aggregated less, reducing its sedimentation rate [65]. In some cases, a surfactant such as sodium dodecyl sulfate can be added, preventing aggregation and increasing recovery [96]. As expected, smaller particle sizes also negatively affect recovery. Hiltunen et al. [94] observed nearly an order of magnitude lower recovery when comparing NPs and MPs based on microscopic imaging. Additionally, when analyzing recovery as a function of particle dimensions, the relationship with the largest dimension appeared to be more linear [94].
Another important parameter is the repeatability of the measurements (precision), defined by the relative standard deviation (RSD) [75]. An RSD below 10% is generally preferred [75,97]. For example, in the case of SERS in water matrices, Li et al. [97] reported an RSD of 9.69%, while Yang et al. [75] reported an RSD of 8.6%. In the case of Pyr-GC/MS, an RSD of up to 20 % can be considered acceptable, as shown in a study by Li et al. [98], although the specific method was designed for solid matrices.
In order to understand the limitations of the used methods and reliably interpret the obtained results, the LOD and limit of quantification (LOQ) should be established. High values may at times be overcome through an additional NP preconcentration step. However, available preconcentration methods have their own limitations and may introduce additional dangers, such as the possible loss of the analyte [99]. The linearity of the calibration curve at environmentally relevant concentrations should also be achieved. Table 4 shows various performance parameter reports for different analytical methods used in NP analysis. The clear limitations of current studies include the focus on a single polymer (PS) and the inability to measure NP contamination at low concentrations (both in terms of mass and particle count).

6. Conclusions

Interest in both quantitative and qualitative analysis of NPs in the environment has significantly grown recently, with researchers focusing on evaluating various analytical techniques through validation parameters. The current objective is to facilitate the rapid and practical implementation of NP determination methods in field conditions. However, multi-stage sample processing—such as filtration, digestion, and concentration—may cause significant analyte losses. Certain approaches in NP research, including quality control procedures, overlap with those applied in MP studies, reflecting methodological parallels in these related fields. Research to date has primarily focused on detecting NPs in environmental samples, with comparatively less emphasis on accurately characterizing their physical properties. Most existing methods are applicable predominantly to simple aqueous matrices. Nevertheless, consistent protocols for NP analysis across diverse matrices remain scarce. Among the more established techniques, Pyr-GC/MS and SERS are gaining traction and undergoing further development, whereas newer approaches such as laser-based methods and biosensors are still in the early stages of validation. Moreover, the rigorous validation of analytical methods—including parameters such as accuracy, precision, limit of detection, and recovery—is essential to ensure reliable NP quantification, particularly given the challenges posed by complex environmental matrices.
As demonstrated in the studies reviewed, the selection of an optimal NP isolation technique depends strongly on the type of matrix being analyzed. The objective should be to minimize the number of sample preparation steps for analysis, thus ensuring satisfactory recoveries. The utilization of SERS coupled with separation techniques appears to be a viable, cost-effective solution to the problem of NP determination. This approach facilitates rapid and accurate identification, thereby enabling effective environmental monitoring of this potential contaminant. This technique minimizes analyte losses; however, samples with complex organic matrices may pose significant challenges for its application. In such cases, the employment of sample digestion and filtration is of paramount importance. Both the choice of chemical reagents and the pore size of the filters substantially influence the particle size distribution observed in the final analysis. In addition to SERS, AFM-IR is also emerging as a promising method for determining NPs, enabling both their identification and the monitoring of particle aging processes.
It is imperative to underscore that the lack of standardized methodologies for NP research hampers the meaningful comparison of data across studies, a situation further complicated by variability in the NP size ranges investigated. Despite notable progress, further research is essential to optimize existing methods, with particular emphasis on minimizing false positives and enhancing the detection and quantification of NPs at low concentrations in complex environmental matrices.

Author Contributions

Conceptualization, J.O., K.K.-C., K.J., P.K., N.N. and M.G.; writing—original draft preparation, K.J., P.K. and N.N.; writing—review and editing, J.O., K.K.-C. and M.G.; visualization, K.J., P.K. and N.N.; supervision, M.G. All authors have read and agreed to the published version of the manuscript.

Funding

This research received no external funding.

Conflicts of Interest

The authors declare no conflicts of interest.

References

  1. British Plastics Federation Plastics Applications. Available online: https://www.bpf.co.uk/plastipedia/applications/Default.aspx (accessed on 1 June 2025).
  2. International Union for Conservation of Nature and Natural Resources. Plastic Pollution; International Union for Conservation of Nature and Natural Resources: Gland, Switzerland, 2024. [Google Scholar]
  3. Busch, M.; Brouwer, H.; Aalderink, G.; Bredeck, G.; Kämpfer, A.A.M.; Schins, R.P.F.; Bouwmeester, H. Investigating Nanoplastics Toxicity Using Advanced Stem Cell-Based Intestinal and Lung in Vitro Models. Front. Toxicol. 2023, 5, 1112212. [Google Scholar] [CrossRef] [PubMed]
  4. Banerjee, A.; Shelver, W.L. Micro- and Nanoplastic Induced Cellular Toxicity in Mammals: A Review. Sci. Total Environ. 2021, 755, 142518. [Google Scholar] [CrossRef] [PubMed]
  5. Facciolà, A.; Visalli, G.; Pruiti Ciarello, M.; Di Pietro, A. Newly Emerging Airborne Pollutants: Current Knowledge of Health Impact of Micro and Nanoplastics. Int. J. Environ. Res. Public Health 2021, 18, 2997. [Google Scholar] [CrossRef] [PubMed]
  6. EFSA Panel on Contaminants in the Food Chain (Contam). Presence of Microplastics and Nanoplastics in Food, with Particular Focus on Seafood. EFSA J. 2016, 14, e04501. [Google Scholar] [CrossRef] [PubMed]
  7. Pradel, A.; Catrouillet, C.; Gigault, J. The Environmental Fate of Nanoplastics: What We Know and What We Need to Know about Aggregation. NanoImpact 2023, 29, 100453. [Google Scholar] [CrossRef] [PubMed]
  8. Pérez-Reverón, R.; Álvarez-Méndez, S.J.; González-Sálamo, J.; Socas-Hernández, C.; Díaz-Peña, F.J.; Hernández-Sánchez, C.; Hernández-Borges, J. Nanoplastics in the Soil Environment: Analytical Methods, Occurrence, Fate and Ecological Implications. Environ. Pollut. 2023, 317, 120788. [Google Scholar] [CrossRef] [PubMed]
  9. Wang, Z.; Pal, D.; Pilechi, A.; Ariya, P.A. Nanoplastics in Water: Artificial Intelligence-Assisted 4D Physicochemical Characterization and Rapid In Situ Detection. Environ. Sci. Technol. 2024, 58, 8919–8931. [Google Scholar] [CrossRef] [PubMed]
  10. Jing, B.; Wan, W.; Hu, B.; Jin, W.; Zhang, Z.; Peng, C.; Wang, M.; Deng, J.; Dong, X.; Liu, Y.; et al. Plastic Nanoparticles Cause Proteome Stress and Aggregation by Compromising Cellular Protein Homeostasis Ex Vivo and in Vivo. Ecotoxicol. Environ. Saf. 2023, 262, 115347. [Google Scholar] [CrossRef] [PubMed]
  11. Asmatulu, E.; Andalib, M.N.; Subeshan, B.; Abedin, F. Impact of Nanomaterials on Human Health: A Review. Environ. Chem. Lett. 2022, 20, 2509–2529. [Google Scholar] [CrossRef]
  12. Chen, Z.; Shi, X.; Zhang, J.; Wu, L.; Wei, W.; Ni, B.-J. Nanoplastics Are Significantly Different from Microplastics in Urban Waters. Water Res. X 2023, 19, 100169. [Google Scholar] [CrossRef] [PubMed]
  13. Joksimovic, N.; Selakovic, D.; Jovicic, N.; Jankovic, N.; Pradeepkumar, P.; Eftekhari, A.; Rosic, G. Nanoplastics as an Invisible Threat to Humans and the Environment. J. Nanomater. 2022, 2022, 6707819. [Google Scholar] [CrossRef]
  14. Mariano, S.; Tacconi, S.; Fidaleo, M.; Rossi, M.; Dini, L. Micro and Nanoplastics Identification: Classic Methods and Innovative Detection Techniques. Front. Toxicol. 2021, 3, 636640. [Google Scholar] [CrossRef] [PubMed]
  15. Xie, L.; Ma, M.; Ge, Q.; Liu, Y.; Zhang, L. Machine Learning Advancements and Strategies in Microplastic and Nanoplastic Detection. Environ. Sci. Technol. 2025, 59, 8885–8899. [Google Scholar] [CrossRef] [PubMed]
  16. Nene, A.; Sadeghzade, S.; Viaroli, S.; Yang, W.; Uchenna, U.P.; Kandwal, A.; Liu, X.; Somani, P.; Galluzzi, M. Recent Advances and Future Technologies in Nano-Microplastics Detection. Environ. Sci. Eur. 2025, 37, 7. [Google Scholar] [CrossRef]
  17. Chen, G.; Li, X.; Wang, Z.; Li, M.; Wang, W.; Lu, R.; Wang, S.; Li, Q.; Hu, Z.; Wu, Y.; et al. Human Exposure to Micro(Nano)Plastics: Health Risks and Analysis Methods. TrAC 2024, 178, 117835. [Google Scholar] [CrossRef]
  18. Allouzi, M.M.A.; Tang, D.Y.Y.; Chew, K.W.; Rinklebe, J.; Bolan, N.; Allouzi, S.M.A.; Show, P.L. Micro (Nano) Plastic Pollution: The Ecological Influence on Soil-Plant System and Human Health. Sci. Total Environ. 2021, 788, 147815. [Google Scholar] [CrossRef] [PubMed]
  19. Peng, L.; Fu, D.; Qi, H.; Lan, C.Q.; Yu, H.; Ge, C. Micro- and Nano-Plastics in Marine Environment: Source, Distribution and Threats—A Review. Sci. Total Environ. 2020, 698, 134254. [Google Scholar] [CrossRef] [PubMed]
  20. Lai, H.; Liu, X.; Qu, M. Nanoplastics and Human Health: Hazard Identification and Biointerface. Nanomaterials 2022, 12, 1298. [Google Scholar] [CrossRef] [PubMed]
  21. Müller, A.-K.; Brehm, J.; Völkl, M.; Jérôme, V.; Laforsch, C.; Freitag, R.; Greiner, A. Disentangling Biological Effects of Primary Nanoplastics from Dispersion Paints’ Additional Compounds. Ecotoxicol. Environ. Saf. 2022, 242, 113877. [Google Scholar] [CrossRef] [PubMed]
  22. Hernandez, L.M.; Yousefi, N.; Tufenkji, N. Are There Nanoplastics in Your Personal Care Products? Environ. Sci. Technol. Lett. 2017, 4, 280–285. [Google Scholar] [CrossRef]
  23. Mathissen, M.; Scheer, V.; Vogt, R.; Benter, T. Investigation on the Potential Generation of Ultrafine Particles from the Tire–Road Interface. Atmos. Environ. 2011, 45, 6172–6179. [Google Scholar] [CrossRef]
  24. Sillanpää, M.; Sainio, P. Release of Polyester and Cotton Fibers from Textiles in Machine Washings. Environ. Sci. Pollut. Res. 2017, 24, 19313–19321. [Google Scholar] [CrossRef] [PubMed]
  25. Cunningham, B.E.; Sharpe, E.E.; Brander, S.M.; Landis, W.G.; Harper, S.L. Critical Gaps in Nanoplastics Research and Their Connection to Risk Assessment. Front Toxicol. 2023, 5, 1154538. [Google Scholar] [CrossRef] [PubMed]
  26. Yang, H.; Lin, X.; Lu, J.; Zhao, X.; Wu, D.; Kim, H.; Su, L.; Cai, L. Effect of Shape on the Transport and Retention of Nanoplastics in Saturated Quartz Sand. J. Hazard. Mater. 2024, 479, 135766. [Google Scholar] [CrossRef] [PubMed]
  27. Goral, K.D.; Guler, H.G.; Larsen, B.E.; Carstensen, S.; Christensen, E.D.; Kerpen, N.B.; Schlurmann, T.; Fuhrman, D.R. Settling Velocity of Microplastic Particles Having Regular and Irregular Shapes. Environ. Res. 2023, 228, 115783. [Google Scholar] [CrossRef] [PubMed]
  28. Sharma, V.K.; Ma, X.; Lichtfouse, E.; Robert, D. Nanoplastics Are Potentially More Dangerous than Microplastics. Environ. Chem. Lett. 2023, 21, 1933–1936. [Google Scholar] [CrossRef]
  29. European Foood Safety Authority. Peter Hollman Microplastics and Nanoplastics in Food–an Emerging Issue 2016; European Foood Safety Authority: Parma, Italy, 2016. [Google Scholar]
  30. Okoffo, E.D.; Thomas, K.V. Quantitative Analysis of Nanoplastics in Environmental and Potable Waters by Pyrolysis-Gas Chromatography–Mass Spectrometry. J. Hazard. Mater. 2024, 464, 133013. [Google Scholar] [CrossRef] [PubMed]
  31. Nematollahi, M.J.; Moore, F.; Keshavarzi, B.; Vogt, R.D.; Nasrollahzadeh Saravi, H.; Busquets, R. Microplastic Particles in Sediments and Waters, South of Caspian Sea: Frequency, Distribution, Characteristics, and Chemical Composition. Ecotoxicol. Environ. Saf. 2020, 206, 111137. [Google Scholar] [CrossRef] [PubMed]
  32. Kedzierski, M.; Palazot, M.; Soccalingame, L.; Falcou-Préfol, M.; Gorsky, G.; Galgani, F.; Bruzaud, S.; Pedrotti, M.L. Chemical Composition of Microplastics Floating on the Surface of the Mediterranean Sea. Mar. Pollut. Bull. 2022, 174, 113284. [Google Scholar] [CrossRef] [PubMed]
  33. Shi, X.; Chen, Z.; Wei, W.; Chen, J.; Ni, B.J. Toxicity of Micro/Nanoplastics in the Environment: Roles of Plastisphere and Eco-Corona. Soil Environ. Health 2023, 1, 100002. [Google Scholar] [CrossRef]
  34. Reynaud, S.; Aynard, A.; Grassl, B.; Gigault, J. Nanoplastics: From Model Materials to Colloidal Fate. Curr. Opin. Colloid. Interface Sci. 2022, 57, 101528. [Google Scholar] [CrossRef]
  35. Rahman, A.M.N.A.A.; Rusli, A.; Abdullah, M.K.; Shuib, R.K.; Hamid, Z.A.A.; Ku Ishak, K.M.; Mohd Zaini Makhtar, M.; Jaafar, M.; Shafiq, M.D. A Review of Microplastic Surface Interactions in Water and Potential Capturing Methods. Water Sci. Eng. 2024, 17, 361–370. [Google Scholar] [CrossRef]
  36. Müller, S.; Fiutowski, J.; Rasmussen, M.B.; Balic Zunic, T.; Rubahn, H.-G.; Posth, N.R. Nanoplastic in Aqueous Environments: The Role of Chemo-Electric Properties for Nanoplastic-Mineral Interaction. Sci. Total Environ. 2025, 964, 178529. [Google Scholar] [CrossRef] [PubMed]
  37. Forster, N.A.; Wilson, S.C.; Tighe, M.K. Microplastic Surface Retention and Mobility on Hiking Trails. Environ. Sci. Pollut. Res. 2023, 30, 46368–46382. [Google Scholar] [CrossRef] [PubMed]
  38. Mahapatra, S.; Maity, J.P.; Singha, S.; Mishra, T.; Dey, G.; Chandra Samal, A.; Banerjee, P.; Biswas, C.; Chattopadhyay, S.; Patra, R.R.; et al. Microplastics and Nanoplastics in Environment: Sampling, Characterization and Analytical Methods. Groundw. Sustain. Dev. 2024, 26, 101267. [Google Scholar] [CrossRef]
  39. Shi, C.; Liu, Z.; Yu, B.; Zhang, Y.; Yang, H.; Han, Y.; Wang, B.; Liu, Z.; Zhang, H. Emergence of Nanoplastics in the Aquatic Environment and Possible Impacts on Aquatic Organisms. Sci. Total Environ. 2024, 906, 167404. [Google Scholar] [CrossRef] [PubMed]
  40. Choudhury, A.; Simnani, F.Z.; Singh, D.; Patel, P.; Sinha, A.; Nandi, A.; Ghosh, A.; Saha, U.; Kumari, K.; Jaganathan, S.K.; et al. Atmospheric Microplastic and Nanoplastic: The Toxicological Paradigm on the Cellular System. Ecotoxicol. Environ. Saf. 2023, 259, 115018. [Google Scholar] [CrossRef] [PubMed]
  41. Yuan, C.; Li, X.; Lu, C.; Sun, L.; Fan, C.; Fu, M.; Wang, H.; Duan, M.; Xia, S. Micro/Nanoplastics in the Shenyang City Atmosphere: Distribution and Sources. Environ. Pollut. 2025, 372, 126027. [Google Scholar] [CrossRef] [PubMed]
  42. Kirchsteiger, B.; Materić, D.; Happenhofer, F.; Holzinger, R.; Kasper-Giebl, A. Fine Micro- and Nanoplastics Particles (PM2.5) in Urban Air and Their Relation to Polycyclic Aromatic Hydrocarbons. Atmos. Environ. 2023, 301, 119670. [Google Scholar] [CrossRef]
  43. Xu, Y.; Ou, Q.; Jiao, M.; Liu, G.; van der Hoek, J.P. Identification and Quantification of Nanoplastics in Surface Water and Groundwater by Pyrolysis Gas Chromatography–Mass Spectrometry. Environ. Sci. Technol. 2022, 56, 4988–4997. [Google Scholar] [CrossRef] [PubMed]
  44. Li, Y.; Zhang, C.; Tian, Z.; Cai, X.; Guan, B. Identification and Quantification of Nanoplastics (20–1000 Nm) in a Drinking Water Treatment Plant Using AFM-IR and Pyr-GC/MS. J. Hazard. Mater. 2024, 463, 132933. [Google Scholar] [CrossRef] [PubMed]
  45. Romphophak, P.; Faikhaw, O.; Sairiam, S.; Thuptimdang, P.; Coufort-Saudejaud, C. Removal of Microplastics and Nanoplastics in Water Treatment Processes: A Systematic Literature Review. J. Water Process. Eng. 2024, 64, 105669. [Google Scholar] [CrossRef]
  46. Li, Y.; Wang, Z.; Guan, B. Separation and Identification of Nanoplastics in Tap Water. Environ. Res. 2022, 204, 112134. [Google Scholar] [CrossRef] [PubMed]
  47. Yu, Y.; Flury, M. Current Understanding of Subsurface Transport of Micro- and Nanoplastics in Soil. Vadose Zone J. 2021, 20, e20108. [Google Scholar] [CrossRef]
  48. Wahl, A.; Le Juge, C.; Davranche, M.; El Hadri, H.; Grassl, B.; Reynaud, S.; Gigault, J. Nanoplastic Occurrence in a Soil Amended with Plastic Debris. Chemosphere 2021, 262, 127784. [Google Scholar] [CrossRef] [PubMed]
  49. Foetisch, A.; Filella, M.; Watts, B.; Vinot, L.-H.; Bigalke, M. Identification and Characterisation of Individual Nanoplastics by Scanning Transmission X-Ray Microscopy (STXM). J. Hazard. Mater. 2022, 426, 127804. [Google Scholar] [CrossRef] [PubMed]
  50. Witzig, C.S.; Földi, C.; Wörle, K.; Habermehl, P.; Pittroff, M.; Müller, Y.K.; Lauschke, T.; Fiener, P.; Dierkes, G.; Freier, K.P.; et al. When Good Intentions Go Bad—False Positive Microplastic Detection Caused by Disposable Gloves. Environ. Sci. Technol. 2020, 54, 12164–12172. [Google Scholar] [CrossRef] [PubMed]
  51. Bai, R.; Fan, R.; Xie, C.; Liu, Q.; Liu, Q.; Yan, C.; Cui, J.; He, W. Microplastics Are Overestimated Due to Poor Quality Control of Reagents. J. Hazard. Mater. 2023, 459, 132068. [Google Scholar] [CrossRef] [PubMed]
  52. Winkler, A.; Fumagalli, F.; Cella, C.; Gilliland, D.; Tremolada, P.; Valsesia, A. Detection and Formation Mechanisms of Secondary Nanoplastic Released from Drinking Water Bottles. Water Res. 2022, 222, 118848. [Google Scholar] [CrossRef] [PubMed]
  53. Xie, D.; Fang, H.; Zhao, X.; Lin, Y.; Su, Z. Identification of Microplastics and Nanoplastics in Environmental Water by AFM-IR. Anal. Chim. Acta 2025, 1354, 343992. [Google Scholar] [CrossRef] [PubMed]
  54. Primpke, S.; Meyer, B.; Falcou-Préfol, M.; Schütte, W.; Gerdts, G. At Second Glance: The Importance of Strict Quality Control–A Case Study on Microplastic in the Southern Ocean Key Species Antarctic Krill, Euphausia Superba. Sci. Total Environ. 2024, 918, 170618. [Google Scholar] [CrossRef] [PubMed]
  55. Jones, N.R.; de Jersey, A.M.; Lavers, J.L.; Rodemann, T.; Rivers-Auty, J. Identifying Laboratory Sources of Microplastic and Nanoplastic Contamination from the Air, Water, and Consumables. J. Hazard. Mater. 2024, 465, 133276. [Google Scholar] [CrossRef] [PubMed]
  56. Lin, G.-Y.; Lee, Y.-M.; Chiu, B.-W.; Hsu, H.-Y.; Chen, C.-W.; Tsai, C.-J. A Comprehensive Study Combing Experiment and CFD Simulation on the Fume Hood Performance for Nanoparticles and Isopropanol Control. Process Saf. Environ. Prot. 2024, 186, 361–375. [Google Scholar] [CrossRef]
  57. Prata, J.C.; Reis, V.; da Costa, J.P.; Mouneyrac, C.; Duarte, A.C.; Rocha-Santos, T. Contamination Issues as a Challenge in Quality Control and Quality Assurance in Microplastics Analytics. J. Hazard. Mater. 2021, 403, 123660. [Google Scholar] [CrossRef] [PubMed]
  58. O’Kane, M. Osilla Biological Safety Cabinet vs Laminar Flow Hood. Available online: https://www.ossila.com/pages/biological-safety-cabinets-laminar-flow-hoods (accessed on 1 June 2025).
  59. Mou, L.; Zhang, Q.; Li, R.; Zhu, Y.; Zhang, Y. A Powerful Method for In Situ and Rapid Detection of Trace Nanoplastics in Water—Mie Scattering. J. Hazard. Mater. 2024, 470, 134186. [Google Scholar] [CrossRef] [PubMed]
  60. Bogdanowicz, A.; Zubrowska-Sudol, M.; Krasinski, A.; Sudol, M. Cross-Contamination as a Problem in Collection and Analysis of Environmental Samples Containing Microplastics—A Review. Sustainability 2021, 13, 12123. [Google Scholar] [CrossRef]
  61. Carreón, R.V.; Cortázar-Martínez, O.; Rodríguez-Hernández, A.G.; Serrano de la Rosa, L.E.; Gervacio-Arciniega, J.J.; Krishnan, S.K. Ionic Liquid-Assisted Thermal Evaporation of Bimetallic Ag–Au Nanoparticle Films as a Highly Reproducible SERS Substrate for Sensitive Nanoplastic Detection in Complex Environments. Anal. Chem. 2024, 96, 5790–5797. [Google Scholar] [CrossRef] [PubMed]
  62. Yang, Q.; Zhang, S.; Su, J.; Li, S.; Lv, X.; Chen, J.; Lai, Y.; Zhan, J. Identification of Trace Polystyrene Nanoplastics Down to 50 Nm by the Hyphenated Method of Filtration and Surface-Enhanced Raman Spectroscopy Based on Silver Nanowire Membranes. Environ. Sci. Technol. 2022, 56, 10818–10828. [Google Scholar] [CrossRef] [PubMed]
  63. Zhou, H.; Cai, W.; Li, J.; Wu, D. Visual Monitoring of Polystyrene Nanoplastics < 100 Nm in Drinking Water Based on Functionalized Gold Nanoparticles. Sens. Actuators B Chem. 2023, 392, 134099. [Google Scholar] [CrossRef]
  64. Luo, S.; Zhang, J.; de Mello, J.C. Detection of Environmental Nanoplastics via Surface-Enhanced Raman Spectroscopy Using High-Density, Ring-Shaped Nanogap Arrays. Front. Bioeng. Biotechnol. 2023, 11, 1242797. [Google Scholar] [CrossRef] [PubMed]
  65. Cai, H.; Chen, M.; Du, F.; Matthews, S.; Shi, H. Separation and Enrichment of Nanoplastics in Environmental Water Samples via Ultracentrifugation. Water Res. 2021, 203, 117509. [Google Scholar] [CrossRef] [PubMed]
  66. Pasanen, F.; Fuller, R.O.; Maya, F. Sequential Extraction, Depolymerization and Quantification of Polyethylene Terephthalate Nanoplastics Using Magnetic ZIF-8 Nanocomposites. Chem. Eng. J. 2024, 490, 151453. [Google Scholar] [CrossRef]
  67. Surette, M.C.; Mitrano, D.M.; Rogers, K.R. Extraction and Concentration of Nanoplastic Particles from Aqueous Suspensions Using Functionalized Magnetic Nanoparticles and a Magnetic Flow Cell. Microplast. Nanoplast. 2023, 3, 2. [Google Scholar] [CrossRef] [PubMed]
  68. Dai, Y.; Li, L.; Guo, Z.; Yang, X.; Dong, D. Emerging Isolation and Degradation Technology of Microplastics and Nanoplastics in the Environment. Environ. Res. 2024, 243, 117864. [Google Scholar] [CrossRef] [PubMed]
  69. Roberto de Bruin, C.; de Rijke, E.; van Wezel, A.P.; Astefanei, A. Methodologies to Characterize, Identify and Quantify Nano- and Sub-Micron Sized Plastics in Relevant Media for Human Exposure: A Critical Review. Env. Sci. Adv. 2022, 1, 238–258. [Google Scholar] [CrossRef]
  70. Valido, I.H.; Fuentes-Cebrian, V.; Hernández, A.; Valiente, M.; López-Mesas, M. Validated Method for Polystyrene Nanoplastic Separation in Aqueous Matrices by Asymmetric-Flow Field Flow Fraction Coupled to MALS and UV–Vis Detectors. Microchim. Acta 2023, 190, 285. [Google Scholar] [CrossRef] [PubMed]
  71. Jing, S.; Huang, Y.; Chen, Y.; He, X.; Chen, Z.; Lu, X.; Wu, M.; Wanger, T.C. Non-Destructive Extraction and Separation of Nano- and Microplastics from Environmental Samples by Density Gradient Ultracentrifugation. Anal. Chem. 2022, 94, 15280–15287. [Google Scholar] [CrossRef] [PubMed]
  72. Lai, E.P.C.; Onomhante, A.; Tsopmo, A.; Hosseinian, F. Determination of Polystyrene Nanospheres and Other Nanoplastics in Water via Binding with Organic Dyes by Capillary Electrophoresis with Laser-Induced Fluorescence Detection. Talanta 2025, 284, 127265. [Google Scholar] [CrossRef] [PubMed]
  73. Adelantado, C.; Lapizco-Encinas, B.H.; Jordens, J.; Voorspoels, S.; Velimirovic, M.; Tirez, K. Capillary Electrophoresis as a Complementary Analytical Tool for the Separation and Detection of Nanoplastic Particles. Anal. Chem. 2024, 96, 7706–7713. [Google Scholar] [CrossRef] [PubMed]
  74. Ye, H.; Esfahani, E.B.; Chiu, I.; Mohseni, M.; Gao, G.; Yang, T. Quantitative and Rapid Detection of Nanoplastics Labeled by Luminescent Metal Phenolic Networks Using Surface-Enhanced Raman Scattering. J. Hazard. Mater. 2024, 470, 134194. [Google Scholar] [CrossRef] [PubMed]
  75. Yang, Z.; Zhu, K.; Yang, K.; Qing, Y.; Zhao, Y.; Wu, L.; Zong, S.; Cui, Y.; Wang, Z. One-Step Detection of Nanoplastics in Aquatic Environments Using a Portable SERS Chessboard Substrate. Talanta 2025, 282, 127076. [Google Scholar] [CrossRef] [PubMed]
  76. Zhou, X.-X.; Liu, R.; Hao, L.-T.; Liu, J.-F. Identification of Polystyrene Nanoplastics Using Surface Enhanced Raman Spectroscopy. Talanta 2021, 221, 121552. [Google Scholar] [CrossRef] [PubMed]
  77. Kalaronis, D.; Ainali, N.M.; Evgenidou, E.; Kyzas, G.Z.; Yang, X.; Bikiaris, D.N.; Lambropoulou, D.A. Microscopic Techniques as Means for the Determination of Microplastics and Nanoplastics in the Aquatic Environment: A Concise Review. Green. Anal. Chem. 2022, 3, 100036. [Google Scholar] [CrossRef]
  78. Yang, T.; Luo, J.; Nowack, B. Characterization of Nanoplastics, Fibrils, and Microplastics Released during Washing and Abrasion of Polyester Textiles. Environ. Sci. Technol. 2021, 55, 15873–15881. [Google Scholar] [CrossRef] [PubMed]
  79. Davranche, M.; Lory, C.; Le Juge, C.; Blancho, F.; Dia, A.; Grassl, B.; El Hadri, H.; Pascal, P.-Y.; Gigault, J. Nanoplastics on the Coast Exposed to the North Atlantic Gyre: Evidence and Traceability. NanoImpact 2020, 20, 100262. [Google Scholar] [CrossRef]
  80. Man Thaiba, B.; Sedai, T.; Bastakoti, S.; Karki, A.; Anuradha, K.C.; Khadka, G.; Acharya, S.; Kandel, B.; Giri, B.; Bhakta Neupane, B. A Review on Analytical Performance of Micro- and Nanoplastics Analysis Methods. Arab. J. Chem. 2023, 16, 104686. [Google Scholar] [CrossRef]
  81. Galluzzi, M.; Lancia, M.; Zheng, C.; Re, V.; Castelvetro, V.; Guo, S.; Viaroli, S. Atomic Force Microscopy (AFM) Nanomechanical Characterization of Micro- and Nanoplastics to Support Environmental Investigations in Groundwater. Emerg. Contam. 2025, 11, 100478. [Google Scholar] [CrossRef]
  82. Mandemaker, L.D.B.; Meirer, F. Spectro-Microscopic Techniques for Studying Nanoplastics in the Environment and in Organisms. Angew. Chem. Int. Ed. Engl. 2023, 62, e202210494. [Google Scholar] [CrossRef] [PubMed]
  83. Chatterjee, S.; Krolis, E.; Molenaar, R.; Claessens, M.M.A.E.; Blum, C. Nile Red Staining for Nanoplastic Quantification: Overcoming the Challenge of False Positive Counts Due to Fluorescent Aggregates. Environ. Chall. 2023, 13, 100744. [Google Scholar] [CrossRef]
  84. Kousheh, S.; Lin, M. Recent Advancements in SERS-Based Detection of Micro- and Nanoplastics in Food and Beverages: Techniques, Instruments, and Machine Learning Integration. Trends Food Sci. Technol. 2025, 159, 104940. [Google Scholar] [CrossRef]
  85. Han, K.; Yan, Z.; Ding, Z.; Zhou, P.; Ye, C.; Qin, L.; Bao, Z.; Zhang, M.; Zhang, W. High-Sensitivity SERS Sensor Leveraging Three-Dimensional Ti3C2Tx/TiO2/W18O49 Semiconductor Heterostructures for Reliable Detection of Trace Micro/Nanoplastics in Environmental Matrices. Talanta 2025, 286, 127474. [Google Scholar] [CrossRef] [PubMed]
  86. Nguyen, M.N.; Lipp, P.; Zucker, I.; Schäfer, A.I. Quantification of Nanoplastics and Inorganic Nanoparticles via Laser-Induced Breakdown Detection (LIBD). Small Methods 2025, e2402060. [Google Scholar] [CrossRef] [PubMed]
  87. Foreman-Ortiz, I.U.; Ma, T.F.; Hoover, B.M.; Wu, M.; Murphy, C.J.; Murphy, R.M.; Pedersen, J.A. Nanoparticle Tracking Analysis and Statistical Mixture Distribution Analysis to Quantify Nanoparticle–Vesicle Binding. J. Colloid. Interface Sci. 2022, 615, 50–58. [Google Scholar] [CrossRef] [PubMed]
  88. James, A.E.; Driskell, J.D. Monitoring Gold Nanoparticle Conjugation and Analysis of Biomolecular Binding with Nanoparticle Tracking Analysis (NTA) and Dynamic Light Scattering (DLS). Analyst 2013, 138, 1212. [Google Scholar] [CrossRef] [PubMed]
  89. Zhang, J.; Peng, M.; Lian, E.; Xia, L.; Asimakopoulos, A.G.; Luo, S.; Wang, L. Identification of Poly(Ethylene Terephthalate) Nanoplastics in Commercially Bottled Drinking Water Using Surface-Enhanced Raman Spectroscopy. Environ. Sci. Technol. 2023, 57, 8365–8372. [Google Scholar] [CrossRef] [PubMed]
  90. Okoffo, E.D.; Thomas, K.V. Mass Quantification of Nanoplastics at Wastewater Treatment Plants by Pyrolysis–Gas Chromatography–Mass Spectrometry. Water Res. 2024, 254, 121397. [Google Scholar] [CrossRef] [PubMed]
  91. Seggio, M.; Arcadio, F.; Cennamo, N.; Zeni, L.; Bossi, A.M. A Plasmonic Gold Nano-Surface Functionalized with the Estrogen Receptor for Fast and Highly Sensitive Detection of Nanoplastics. Talanta 2024, 267, 125211. [Google Scholar] [CrossRef] [PubMed]
  92. Chen, Z.; Wei, W.; Liu, X.; Ni, B.J. Emerging Electrochemical Techniques for Identifying and Removing Micro/Nanoplastics in Urban Waters. Water Res. 2022, 221, 118846. [Google Scholar] [CrossRef] [PubMed]
  93. Donisi, I.; Colloca, A.; Anastasio, C.; Balestrieri, M.L.; D’Onofrio, N. Micro(Nano)Plastics: An Emerging Burden for Human Health. Int. J. Biol. Sci. 2024, 20, 5779–5792. [Google Scholar] [CrossRef] [PubMed]
  94. Hiltunen, A.; Huopalainen, J.; Mäkilä, E.; Häkkilä, S.; Damlin, P.; Hänninen, J. Expanding Sample Volume for Microscopical Detection of Nanoplastics. Mar. Environ. Res. 2024, 202, 106806. [Google Scholar] [CrossRef] [PubMed]
  95. Ye, H.; Jiang, S.; Yan, Y.; Zhao, B.; Grant, E.R.; Kitts, D.D.; Yada, R.Y.; Pratap-Singh, A.; Baldelli, A.; Yang, T. Integrating Metal–Phenolic Networks-Mediated Separation and Machine Learning-Aided Surface-Enhanced Raman Spectroscopy for Accurate Nanoplastics Quantification and Classification. ACS Nano 2024, 18, 26281–26296. [Google Scholar] [CrossRef] [PubMed]
  96. Li, H.; Lee, L.M.; Yu, D.; Chan, S.H.; Li, A. An Optimized Multi-Technique Based Analytical Platform for Identification, Characterization and Quantification of Nanoplastics in Water. Talanta 2024, 272, 125800. [Google Scholar] [CrossRef] [PubMed]
  97. Li, Z.; Han, K.; Zhang, A.; Wang, T.; Yan, Z.; Ding, Z.; Shen, Y.; Zhang, M.; Zhang, W. Honeycomb-like AgNPs@TiO2 Array SERS Sensor for the Quantification of Micro/Nanoplastics in the Environmental Water Samples. Talanta 2024, 266, 125070. [Google Scholar] [CrossRef] [PubMed]
  98. Li, Z.; Gao, Y.; Wu, Q.; Yan, B.; Zhou, X. Quantifying the Occurrence of Polystyrene Nanoplastics in Environmental Solid Matrices via Pyrolysis-Gas Chromatography/Mass Spectrometry. J. Hazard. Mater. 2022, 440, 129855. [Google Scholar] [CrossRef]
  99. Ranasinghe, M.; Breadmore, M.C.; Maya, F. Preconcentration of Nanoplastics Using Micro-Electromembrane Extraction across Free Liquid Membranes. Adv. Sample Prep. 2024, 11, 100125. [Google Scholar] [CrossRef]
  100. Battistini, B.; Petrucci, F.; Bocca, B. In-House Validation of AF4-MALS-UV for Polystyrene Nanoplastic Analysis. Anal. Bioanal. Chem. 2021, 413, 3027–3039. [Google Scholar] [CrossRef] [PubMed]
  101. Tian, L.; Skoczynska, E.; Siddhanti, D.; van Putten, R.-J.; Leslie, H.A.; Gruter, G.-J.M. Quantification of Polyethylene Terephthalate Microplastics and Nanoplastics in Sands, Indoor Dust and Sludge Using a Simplified in-Matrix Depolymerization Method. Mar. Pollut. Bull. 2022, 175, 113403. [Google Scholar] [CrossRef] [PubMed]
  102. Carreón, R.V.; Rodríguez-Hernández, A.G.; Serrano de la Rosa, L.E.; Gervacio-Arciniega, J.J.; Krishnan, S.K. Mechanically Flexible, Large-Area Fabrication of Three-Dimensional Dendritic Au Films for Reproducible Surface-Enhanced Raman Scattering Detection of Nanoplastics. ACS Sens. 2025, 10, 1747–1755. [Google Scholar] [CrossRef] [PubMed]
Figure 1. Shapes of NPs. Own work based on [27]. Source of images: https://www.canva.com/ (accessed on 31 May 2025).
Separations 12 00185 g001
Figure 2. General procedure for NP sampling. Own work based on [62,63]. Source of images: https://www.canva.com/ (accessed on 31 May 2025).
Separations 12 00185 g002
Table 1. Comparison of MPs and NPs properties.
PropertiesMPsNPsReference
Size100 nm–5 mm1 nm–100 nm[29]
Identify
polymer type
Polyethylene (PE), polypropylene (PP),
polystyrene (PS),
poly (ethylene terephthalate) (PET)
[30,31,32]
Nylon (NYL)-
Environmental riskPlastisphereEco-corona[33]
Colloidal
behavior
Creates a colloidCreates a colloid[34,35]
Mobility and DispersionLow mobilityHigh mobility[36,37]
Table 2. Examples of quality control measures during the determination of NPs.
ResearcherProtectionWorkplaceToolMaterialReagent PuritySample ProtectionBlank SampleType of SampleReference
Nitrile
gloves and 100% cotton laboratory coats
Fume hoodGlass and metalAnalytical
grade without
additional
purification
Milli-Q ultrapure water
Dichloromethane pre-cleaned
aluminum foils
YesEnvironmental and potable
water
[30]
Nitrile butadiene gloves and cotton laboratory
coats
Laminar flow
Cabinets
Glass or stainless steelMilli-Q ultrapure waterNo informationYesWater from drinking water plant[44]
Cotton laboratory coatsLaminar air flow fume hoodGlass or stainless steelAnalytical grade
Ultrapure water
Aluminum foilYesTap water[46]
No informationNo informationGlassUltrapure waterNo informationYesEnvironmental water[53]
Table 3. Advantages and limitations of selected methods for the determination of NPs in environmental samples.
Type of MethodAdvantagesLimitations
Microscopic
Transmission electron microscopy (TEM)Observation of agglomerated and single-molecule NPsLack of selectivity for NPs
Atomic force microscopy (AFM)Observation of NPs aggregates and aging processesMay damage or contaminate
the sample
Fluorescence
microscopy
Rapid
Cost-effective
Does not necessitate sample
pretreatment
Suitable only for spiked samples, not real samples
Non-fluorescent polymers cannot be detected
Spectroscopic
SERSRapid
Non-destructive
Can be coupled with separation techniques
NPs dimensions cannot be
distinguished
Mie scatteringRapid
Suitable for mixture of particles of varying sizes
Suitable only for pure or simple water matrices
Laser-Induced Breakdown Detection (LIBD)Can be coupled with separation techniquesSuitable only for pure or simple water matrices
Nanoparticle Tracking Analysis (NTA)SensitiveNPs dimensions cannot be
distinguished
High limit of detection (LOD)
Thermal
Pyr-GC/MSSensitive
Identification and quantification of NPs
Time-consuming
Destructive
Others
Estrogen Receptor–Gold Nanograting (ER-GNG)No pretreatment of sample neededTwo weeks lifetime of the sensor
Electrochemical methodsIdentification of the size and
material of plastic particles
Identification of contaminants carried by NPs
The minimum particle size is 1 µm
Table 4. Examples of reported validation parameters in NP studies.
MethodMatrixPolymer TypesNPs Size [nm]Linearity RangeLODLOQReference
SERSWaterPS50/10050–1000/200–1000 μg/mL12.5/6.25 μg/mL-[62]
LIBDWaterPS20–400-104−105 particles/mL-[86]
ER-GNG biosensorSeawaterPMMA1001–100 ng/mL0.39 ng/mL-[91]
AF4-MALS + Pyr-GC/MSBottled waterPMMA, PS50–3500.02–10 µg; R2 = 0.9993–0.99960.01 µg-[96]
AF4-MALS + UV-DADWaterPS20–20050–1000 μg/mL; R2 = 0.998–0.99915–33 μg/mL-[100]
LC-UVIndoor dustPET100-0.3 mg/g1 mg/g[101]
SERSTap and pond water, diluted milk, winePS10010−5–10−1 g/mL8.2 μg/mL-[102]
Disclaimer/Publisher’s Note: The statements, opinions and data contained in all publications are solely those of the individual author(s) and contributor(s) and not of MDPI and/or the editor(s). MDPI and/or the editor(s) disclaim responsibility for any injury to people or property resulting from any ideas, methods, instructions or products referred to in the content.

