Article

An Optimized Pathway for Nitrate Removal from Aqueous Solution by Environmentally Friendly Calabash Gourd Shell Adsorbent Based on Experimental Design Methodology

by
Goran S. Nikolić
1,*,
Nataša Simonović
1,
Miloš Durmišević
1,
Nada Nikolić
1,
Dragana Marković Nikolić
2,
Milena Nikolić
2,
Grozdanka Bogdanović
3 and
Aleksandar Bojić
4
1
Faculty of Technology, University of Niš, Bulevar Oslobodjenja 124, 16000 Leskovac, Serbia
2
Department of Technological Art Studies, Academy Southern Serbia, 16000 Leskovac, Serbia
3
Technical Faculty in Bor, University of Belgrade, VJ 12, 19210 Bor, Serbia
4
Faculty of Sciences and Mathematics, University of Niš, Višegradska 33, 18000 Niš, Serbia
*
Author to whom correspondence should be addressed.
Separations 2025, 12(6), 139; https://doi.org/10.3390/separations12060139
Submission received: 2 May 2025 / Revised: 21 May 2025 / Accepted: 21 May 2025 / Published: 23 May 2025
(This article belongs to the Special Issue Adsorption/Degradation Methods for Water and Wastewater Treatment)

Abstract

:
The aim of this research is to optimize the process parameters for nitrate adsorption from aqueous solutions using ammonium modified calabash gourd shell (CGS). Two types of experimental design (DoE) methodology were implemented in the optimization. A full factorial design (FFD) assessed the influence of the main factors on the process response. The efficiency of nitrate adsorption at the predicted optimal conditions by FFD was 78.93%. The study was extended to a central composite design (CCD) within the response surface methodology (RSM) to capture the factors nonlinear effects and optimize the adsorption parameters. The quadratic polynomial model using CCD proved to be useful for understanding the adsorption system’s behavior, locating the optimal process factors, and predicting the adsorption efficiency (R2 > 0.95). The significance of the model terms (A, B, C, D, B2, and C2) is confirmed by F = 74.95 and p < 0.0001. According to the CCD, the optimal adsorption conditions were estimated in the range: initial nitrate concentration 10–20 mg/L, pH 6–7, temperature 20–25 °C, and contact time 25–30 min (desirability 0.996). The predicted and obtained values using FFD and CCD models are very close, which confirms their practical applicability. The repeated test found the nitrate adsorption efficiency (84.9%) using CCD model in the predicted range (80.1–89.6%), which confirms the adequacy and significance of the model. This model could find potential application in real processes for the treatment of nitrate-contaminated water using the environmentally friendly CGS cationic adsorbent.

1. Introduction

The excessive use of nitrogen-containing fertilizers and the discharge of untreated industrial wastewater directly affect the increase in the concentration of nitrates in waterways. These anthropogenic activities can lead to serious environmental issues, such as eutrophication, as well as health problems [1,2]. Therefore, nitrates must be removed from industrial and agricultural runoff, i.e., reduced to the maximum permitted concentration before entering natural water bodies or main water supply systems. Nitrate removal has been studied using various conventional or improved processes, including ion exchange [3], chemical/biological denitrification [4], reverse osmosis [5], electrodialysis [6], and adsorption [7]. Apart from adsorption, most of these processes face challenges such as high operational costs, limited efficiency, low pollutant selectivity, or generation of undesirable byproducts. Adsorption is recommended as a successful remediation technique that uses simple and cheaper technology and has a good decontamination effect of various organic and inorganic pollutants [7]. One of the more important alternatives to improved processes is adsorption using activated carbon. However, complex regeneration processes, the production of secondary pollutants, and the problem of their disposal are still limiting factors in the application of this technique. Valuable adsorbents, in addition to efficiency and high sorption capacity, are required to be available, inexpensive, biodegradable, and, above all, repurposed for further use after utilization. In this regard, various semi-synthetic, natural, and chemically or thermally modified materials have been studied [8,9,10,11]. A new challenge for wastewater treatment is agricultural residues or food industry waste as an environmentally sustainable option for nitrate removal [12]. One of the potentially valuable agrowaste is the calabash gourd shell, which has not yet been sufficiently tested for this purpose.
Calabash (Lagenaria siceraria), commonly known as white-flowered gourd, is a plant cultivated worldwide for its fruits [13]. Calabash fruits come in a variety of shapes. The rounder varieties harvested ripe (usually called calabash gourd, bottle gourd) are used mainly as containers, birdhouse gourd, or for making utensils and musical instruments after drying. Besides being widely available on all continents, the calabash gourd is also very productive [14]. It is ready for harvesting within 2 months, each plant can produce one fruit per day (for 45 days) yielding 35–40 tons/ha over a 3-month growing season. The dried gourd shell, as an environmentally friendly natural material of hard and porous lignocellulosic structure, is an exceptionally valuable agricultural residue for making potentially attractive adsorbents of different functionalities [15]. In addition to abundant availability, the advantages of this functional-ecological biomass are solid consistency (even after modification), exceptional hydrophilicity, biocompatibility, and biodegradability. Among other things, we found its possibility of recycling and reuse through several adsorption cycles, as well as the possibility of using it as compost or nitrogen/phosphorus enriched fertilizer at the end of its life cycle [15]. However, in its native state, the gourd shell can only adsorb cationic species (such as metal ions) due to the presence of OH and COO functional groups [15]. To remove anions (such as nitrate or phosphate) from aqueous solutions, the lignocellulosic material undergoes chemical modification [16]. Functionalization of the lignocellulosic surface groups can be achieved by their cationization with amine [17] or ammonium-type reagents [18].
In terms of the nitrate removal efficiency from aqueous solutions, apart from choosing an adequate adsorbent, it is always necessary to optimize the adsorption process parameters. It is known that the adsorption efficiency is significantly affected by many variables, such as adsorbate concentration, amount of adsorbent, contact time, temperature, pH of the initial solution, stirring speed, and the presence of competing ions [15,19]. Conventional process optimization and the collection of extensive experimental data can be time-consuming and very expensive [20]. For this reason, experimental design and mathematical models are necessary to interpret the interactive effects of significant variables, as well as to predict the adsorption performance [21]. Adsorption performance can be improved by using advanced tools such as artificial intelligence, which has a great capacity for solving complex problems. Numerous studies have demonstrated the successful application of artificial intelligence models to predict the ability of different adsorbents to remove various pollutants from aqueous solutions, including nitrates [22].
One of the more powerful experimental techniques with a multivariate experimental approach to investigate new or existing processes is the Design of Experiments (DoE). This strategy is used for better insight into the process itself and its optimization to achieve the most efficient performance [11,23]. After conducting a minimum number of well-planned experiments, a mathematical model of system behavior can be established based on suitable factors identified using Factorial Design (FD). The proposed model can be successfully redefined using Response Surface Methodology (RSM). RSM is an important statistical technique that uses experimental design, analysis, and modeling of experimental variables [24]. This methodology significantly reduces the number of experimental runs necessary to provide sufficient data for statistically suitable results. Within RSM, one of the two main types (besides the Box-Behnken design) that is most commonly used when considering information from a factorial experiment is the Central Composite Design (CCD). Both FD and CCD within RSM combine several factors at once and analyze how their interactions affect the expected result [25]. This concept of process optimization leads to the final verification of a located optimum. The advantages of the approach are the creation of a method in a systematic way, saving the time and costs of the method development, while the system behavior is thoroughly studied and examined.
Given that several types are used in practice, it is very important in the DoE methodology to choose an adequate experimental design. The aim of this study is to compare and combine the two most common types of experimental design: full factorial design (FFD) and central composite design (CCD) within the RSM framework to optimize the process parameters of nitrate adsorption using the calabash gourd shell. These two types of designs differ in the number of experiments and the quality of information that can be extracted after their application. In addition to determining the drawbacks and advantages of each of them in the optimization process, the most convenient solution will be identified for further locating the optimal nitrate adsorption conditions.

2. Materials and Methods

2.1. Adsorbent Preparation

In the conducted experiments of nitrate adsorption from simulated aqueous solutions, chemically modified calabash gourd shell (CGS) was used as an adsorbent. Modification of dried and crushed (400–600 μm) lignocellulosic biomass of CGS to the cationic form was performed with N-(3-chloro-2-hydroxypropyl) trimethylammonium chloride (CHTAC) reagent according to a modified procedure [26]. Previously prepared raw CGS (3 g) was suspended in 15 mL NaOH (5 M), with constant stirring (100 rpm) for 30 min at a temperature of 20 °C. After the destruction of the CGS surface and the activation of surface functional groups, the modification process was continued in the same reaction vessel by adding 15 mL CHTAC (60 wt%) reagent. The cationization reaction of CGS with quaternary ammonium groups was carried out at 80 °C, for 10 h with constant stirring (150 rpm). The obtained material was washed with demineralized water to a neutral pH value of the effluent and then converted into the chloride form by suspending it in an HCl solution at pH 2. The final product was dried at 60 °C and used as an adsorbent. All reagents used were of analytical grade (Sigma-Aldrich Chemie GmbH, Schnelldorf, Germany).

2.2. Characteriation of the Cationic Adsorbent

The cationic adsorbent used in our adsorption experiments has already been characterized earlier [15], using various physicochemical and spectroscopic methods. Morphological SEM analysis indicated a highly porous structure (macropores 0.5–1 μm), while FTIR spectroscopy confirmed surface functionalization with positive trimethylammonium groups [27]. The main properties of this adsorbent important for the adsorption process are the point of zero charge (pHpzc) value of 7.04 and the high content of quaternary ammonium groups (1.39 mmolN/g of NR4+Cl), which represent active centers for the sorption of nitrate anions [15].

2.3. Batch Adsorption Experiments

Simulated working nitrate solutions were prepared by diluting the stock solution (100 mg/L KNO3) to the desired concentration (10, 30, and 50 mg/L). Nitrate adsorption in batch mode was performed from the working solution (50 mL) under fixed reaction conditions (2 g/L CGS dose and stirring speed 150 rpm to ensure mixing without vortex effect) [26]. Variable adsorption parameters (initial nitrate concentration, pH value, temperature, and adsorbent/adsorbate contact time) were applied according to the established CCD matrix (Table 1). The solution pH was adjusted to the desired value using HCl (0.1 M) or NaOH (0.1 M). The content of remaining nitrate in the working solution (expressed as nitrogen) after the required time was monitored using an UV-VIS spectrophotometer (Cary 100 Conc, Varian, Palo Alto, CA, USA), according to standard 4500-NO3 method [26]. The nitrate removal efficiency (Y) was calculated using the equation:
Y (%) = 100 (C0Ct)/C0
where C0 and Ct are initial and final nitrate concentrations (mg/L) at time t.

2.4. Experimental Design

In this study, a sequential approach based on DoE methodology was applied, primarily 24 full factorial design. The experiments were designed to find the interaction of four independent process variables: initial nitrate concentration (C0), pH, temperature (T), and adsorbent-adsorbate contact time (t). Then, the CCD was used to describe the process in the experimental domain, as well as to optimize the adsorption process that would provide the best nitrate removal. The levels of different variables were chosen based on preliminary experiments. The nitrate adsorption efficiency was considered as the response to be modeled by DoE methodology. Main interactions, correlation coefficients, analysis of variance, residuals, and standard deviation were performed using the software program JMP (version 17 Pro, SAS Institute Inc., Cary, NC, USA). All the experiments were duplicated to assess measurement variability. The experiments were performed randomly, and the percentage of nitrate removal was noted in each experiment.

3. Results

In optimizing the adsorption process, an experimental design methodology was used that first incorporated the FFD to investigate all the basic interactions between key factors. After that, the CCD within the RSM was conducted for optimization and analysis of nonlinear effects. The FFD is usually applied in the early stages of process studying, and it is ideal to use this design up to a maximum of four factors [28], which is the case of this study. It is most often applied on two levels so that the total number of experiments is 2k, where k is the number of factors and two represents the number of levels. The FFD consists of all possible combinations of two levels for all factors [29]. One of the assumptions with which a two-level FFD begins is that the response for a given range of factors is approximately linear [28]. As the purpose of this study is to predict performance based on a regression model with quadratic (non-linear) effects, after 24 FFD a response surface methodology was implemented. Since the key factors and interactions at the limiting values of the factors have been identified based on the FFD, the behavior of the adsorption process can be modeled on the RSM basis in the entire range of set values of the input factors [29]. The total number of experiments (N) for CCD within the RSM can be recalculated by the following equation:
N = 2k + 2k + z
where k is the number of input factors and z is the number of replicates at the central point. Based on the RSM, a second-order model can be developed that can be used to predict the response at different values of the variables [28,29].

3.1. Design of Statistical Experiments

In order to optimize the experimental conditions for the nitrate removal from aqueous solutions, all the factors that can affect the efficiency of the adsorption process should be identified first. Most research on similar lignocellulosic adsorbents highlights four key factors (C0, pH, T, and t) that have a significant impact [15,20]. The initial pollutant concentration can increase the adsorption capacity up to a certain level, and it is necessary to determine the concentration that gives the best relationship between capacity and cost. Different pH values affect the dominance and change of anion type in the solution, while the adsorption capacity is directly dependent on the point of zero charge (pHpzc) of the adsorbent. The change in temperature can affect the adsorption kinetics and the distribution of the pollutant between the liquid phase and the adsorbent. The contact time is important in multi-stage adsorption processes, which are characterized by an initial step of the adsorbate rapid binding to the surface and then a slower migration in the internal adsorbent pores. Therefore, the total adsorption time affects the equilibrium state achievement and the maximum amount of adsorbate removed. Among other process parameters, the adsorbent dosage and the mixing speed can also be considered, but their impact on nitrate removal efficiency is of minor importance in this optimization methodology [15,20]. Namely, previous experiences have indicated that higher mixing speeds (over 150 rpm) lead to a vortex effect. Part of the adsorbent then loses contact with the solution, which directly affects the gradual decrease in adsorption efficiency [26]. Conversely, slower mixing causes partial separation of adsorbent particles on the surface of the solution or clustering of particles and their precipitation. In both cases, uneven adsorbent-adsorbate contact reduces the adsorption efficiency. In the second case, regardless of the mixing speed, the addition of adsorbent in excess (>2 g/L) leads to particle densification [15]. There is no tendency to increase the nitrate removal efficiency, which is explained by the effect of the initial concentration gradient between the solid phase and the solution. For a given volume of solution and amount of adsorbent, the initial concentration gradient increases with increasing solution concentration [26]. Thus, a higher adsorbent dose in the same volume of solution leads to a scattering of the concentration gradient between the solution and the adsorbent. The resulting agglomeration of the adsorbent particles reduces the number of available active centers per unit mass of the adsorbent (blinding), which directly affects the decrease in adsorption efficiency. Also, the thickening effect hinders the diffusion of anions into the adsorbent interior, which makes adsorbent-adsorbate contact in the lignocellulosic biomass bulk difficult. Consequently, the utilization of the adsorbent is insufficient. The above facts support the justification of using adsorbent dosage and mixing speed as fixed reaction conditions. Additionally, in the case of more concentrated nitrate solutions, instead of increasing the adsorbent dosage, an additional adsorption step may be helpful. This is also a characteristic of lignocellulosic adsorbents, which can be recycled and reused in multiple cycles. However, it should be taken into account that the adsorption efficiency decreases due to adsorbent degradation with each repeated cycle. From a practical point of view, dilution of highly contaminated waters may be a better option than increasing the sorbent dose.
The preliminary experiments provided valuable information about the experimental region for optimizing nitrate adsorption and allowed the definition of factors intervals. The coded and uncoded values of the variables (independent input factors), the factor levels, and the experimental region values included in a 24 full factorial design and the CCD matrix are shown in Table 1.
Thus, a total of 16 experiments were planned for the 24 full factorial design, while 28 experiments were calculated by Equation (2) for the central composite design, including four replicates at the central point (z). These 16 experiments for the FFD are also part of the CCD matrix (Table 2), so it was not necessary to repeat them in the later phase of the research. In this sense, the CCD was supplemented with the remaining axial and central points. When the main effects and interactions are estimated based on the FFD, it remains to estimate the squares based on the axial points and to assess the adequacy of the model based on the central points. During the process, the adsorption efficiency was monitored as an output (dependent) factor.
The correlations plots of the actual vs. predicted adsorption efficiency values by the FFD (a) and the CCD (b) are presented in Figure 1. It is evident that many of the data points are generally concentrated towards the diagonal line, around the mean value. This indicates a close relation and agreement between the predicted and actual experimental values. The quality of the fit can be confirmed by the coefficient of determination (R2). In addition, based on the analysis of variance (ANOVA) test, the F-value and p-value can show how important and appropriate the derived models can be (Table 3 and Table 4).

3.2. Regression Models and Analytical Validation

The corresponding regression models for predicting the adsorption efficiency, with a positive (+) and negative (−) effect on the response (Y), are presented in the form of the following Equations (3) and (4):
  • a linear polynomial model by FFD:
Y1 = 41.08 − 14.90 × A + 4.78 × B − 9.24 × C + 6.65 × D − 1.69 × AB
  • a nonlinear polynomial model by CCD:
Y2 = 57.59 − 15.12 × A + 5.20 × B − 9.67×C + 7.88 × D − 10.04 × B2 − 6.40 × C2
The correctness (accuracy and adequacy) of the FFD and the CCD regression models (Equations (3) and (4)) was tested using ANOVA. For this purpose, the relevant statistical parameters are coefficient of determination (R2), adjusted coefficient of determination (R2adj.) and predicted coefficient of determination (R2pred.). The corresponding results and the calculated relevant statistical parameters are shown in Table 3.
It is evident from Table 3 that in both cases R2 > 0.96, which meets the recommended value of R2 > 0.75 [30]. Based on the extremely high R2 values (0.99 for Y1 and 0.96 for Y2) it is clear that both proposed mathematical models are acceptable. More importantly, although R2 are high, the comparatively high values of R2adj. suggest that these regression models provide good prediction ability. A difference between R2adj. and R2pred. of less than 0.2 indicates that there is good agreement [24]. Also, low relative deviation values between experimental (Y) and predicted values (Y1 and Y2) indicate that the polynomial models are satisfactory.
In addition to the quality of the models fit (expressed by R2 and R2adj.), the statistical significance of these models was checked using Fisher’s exact test (F-test). Model terms were selected based on probability (p-value) with a confidence level of 95%. Based on the p-value, which is in both cases less than 0.0001, it can be concluded that the regression models are adequate and can be used to predict the adsorption efficiency well.

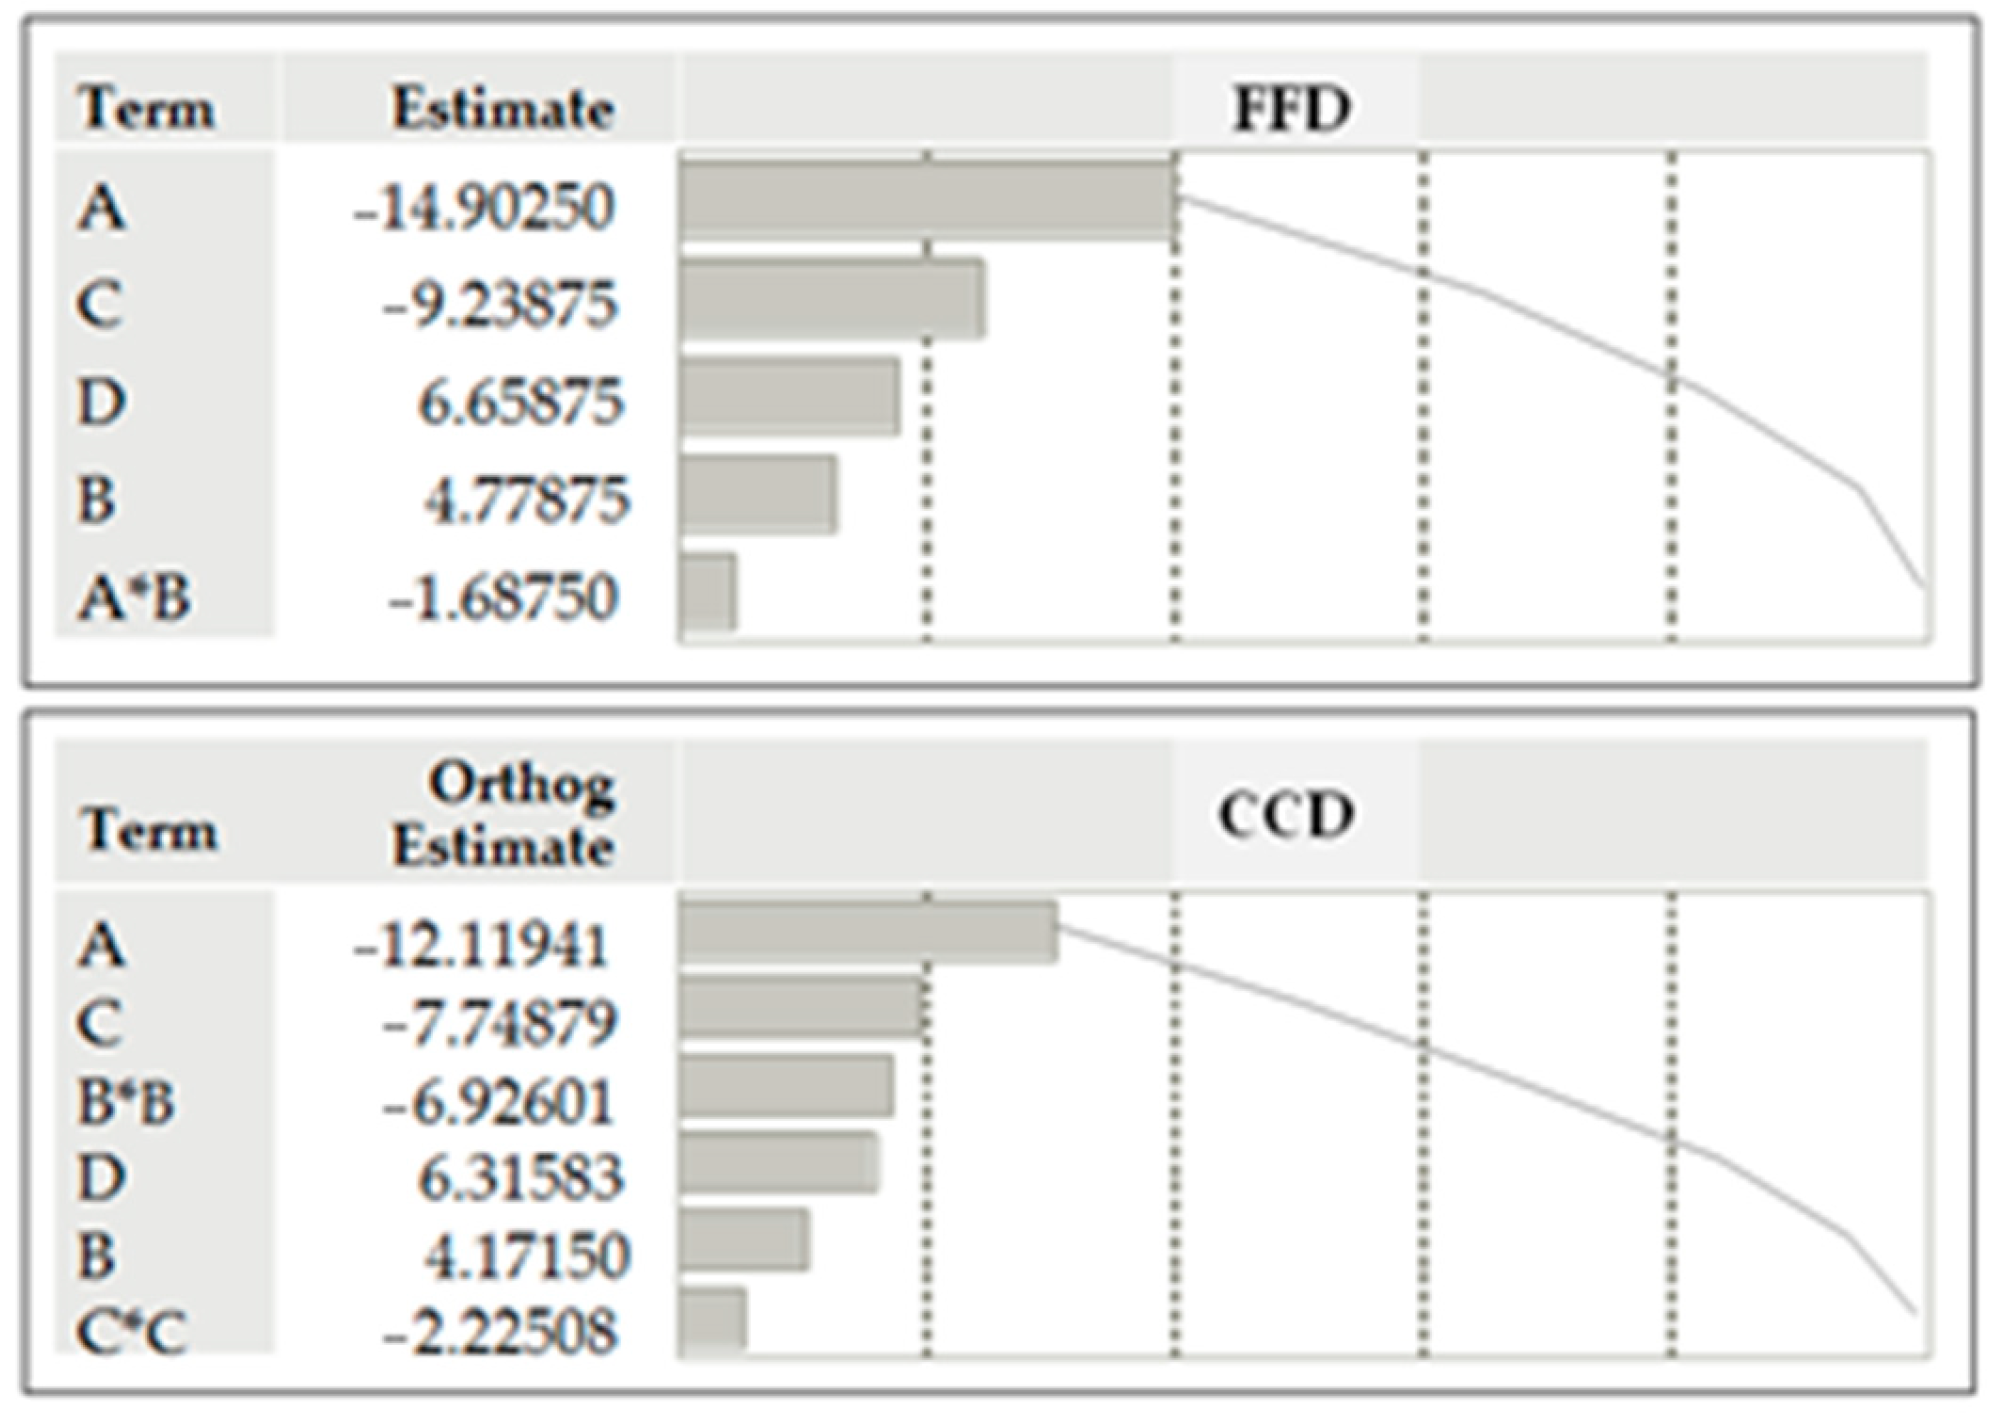
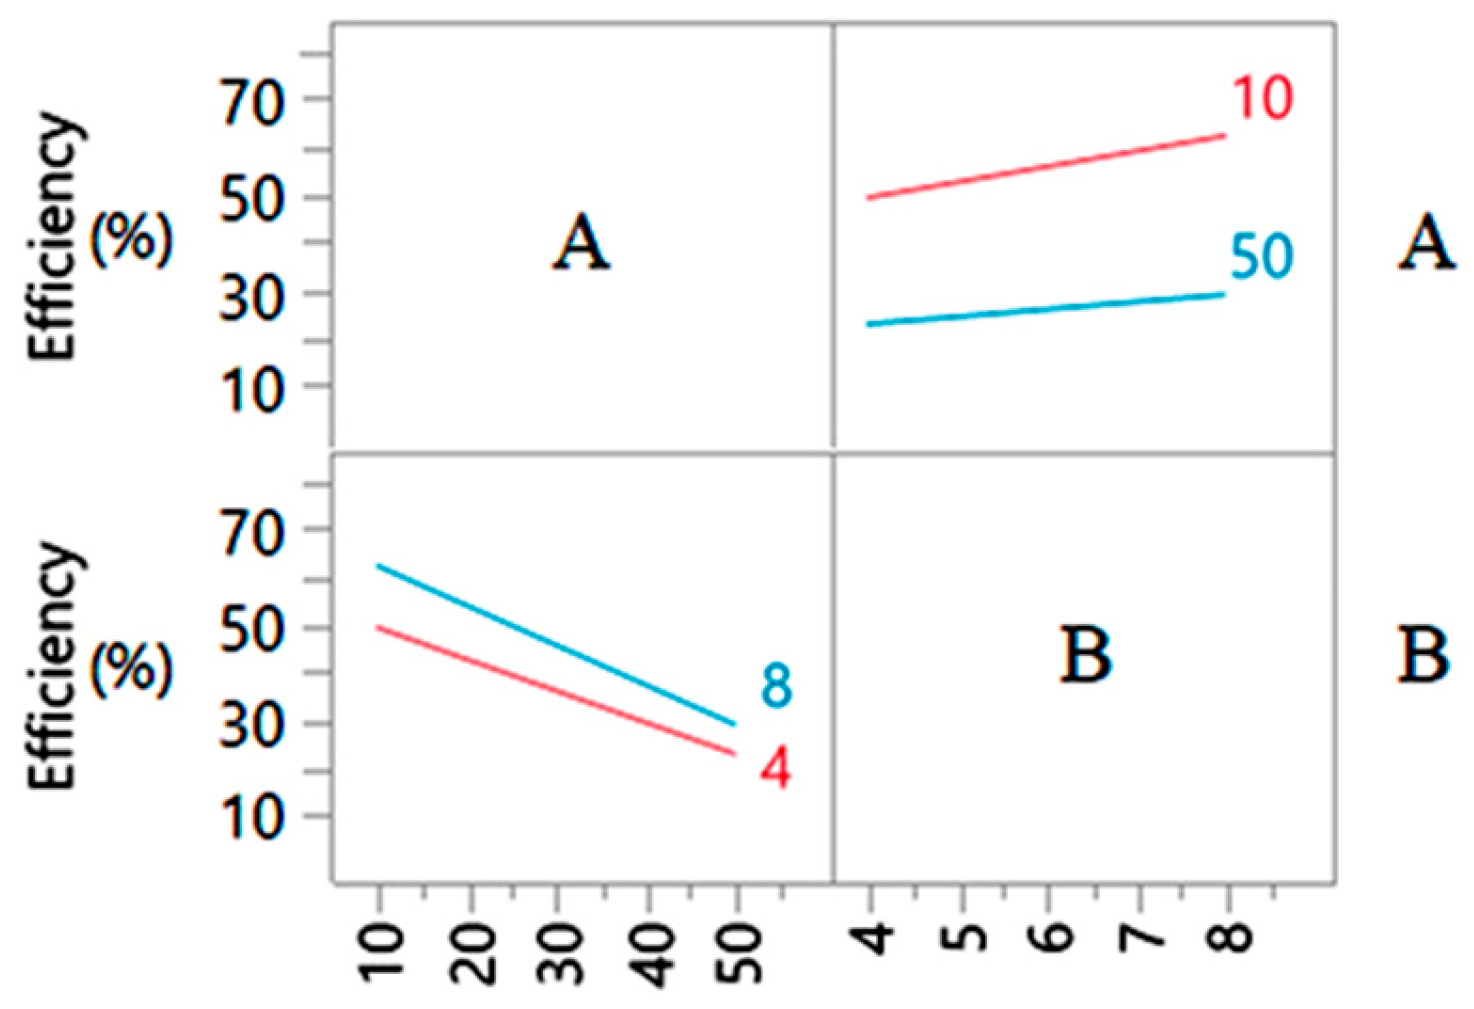
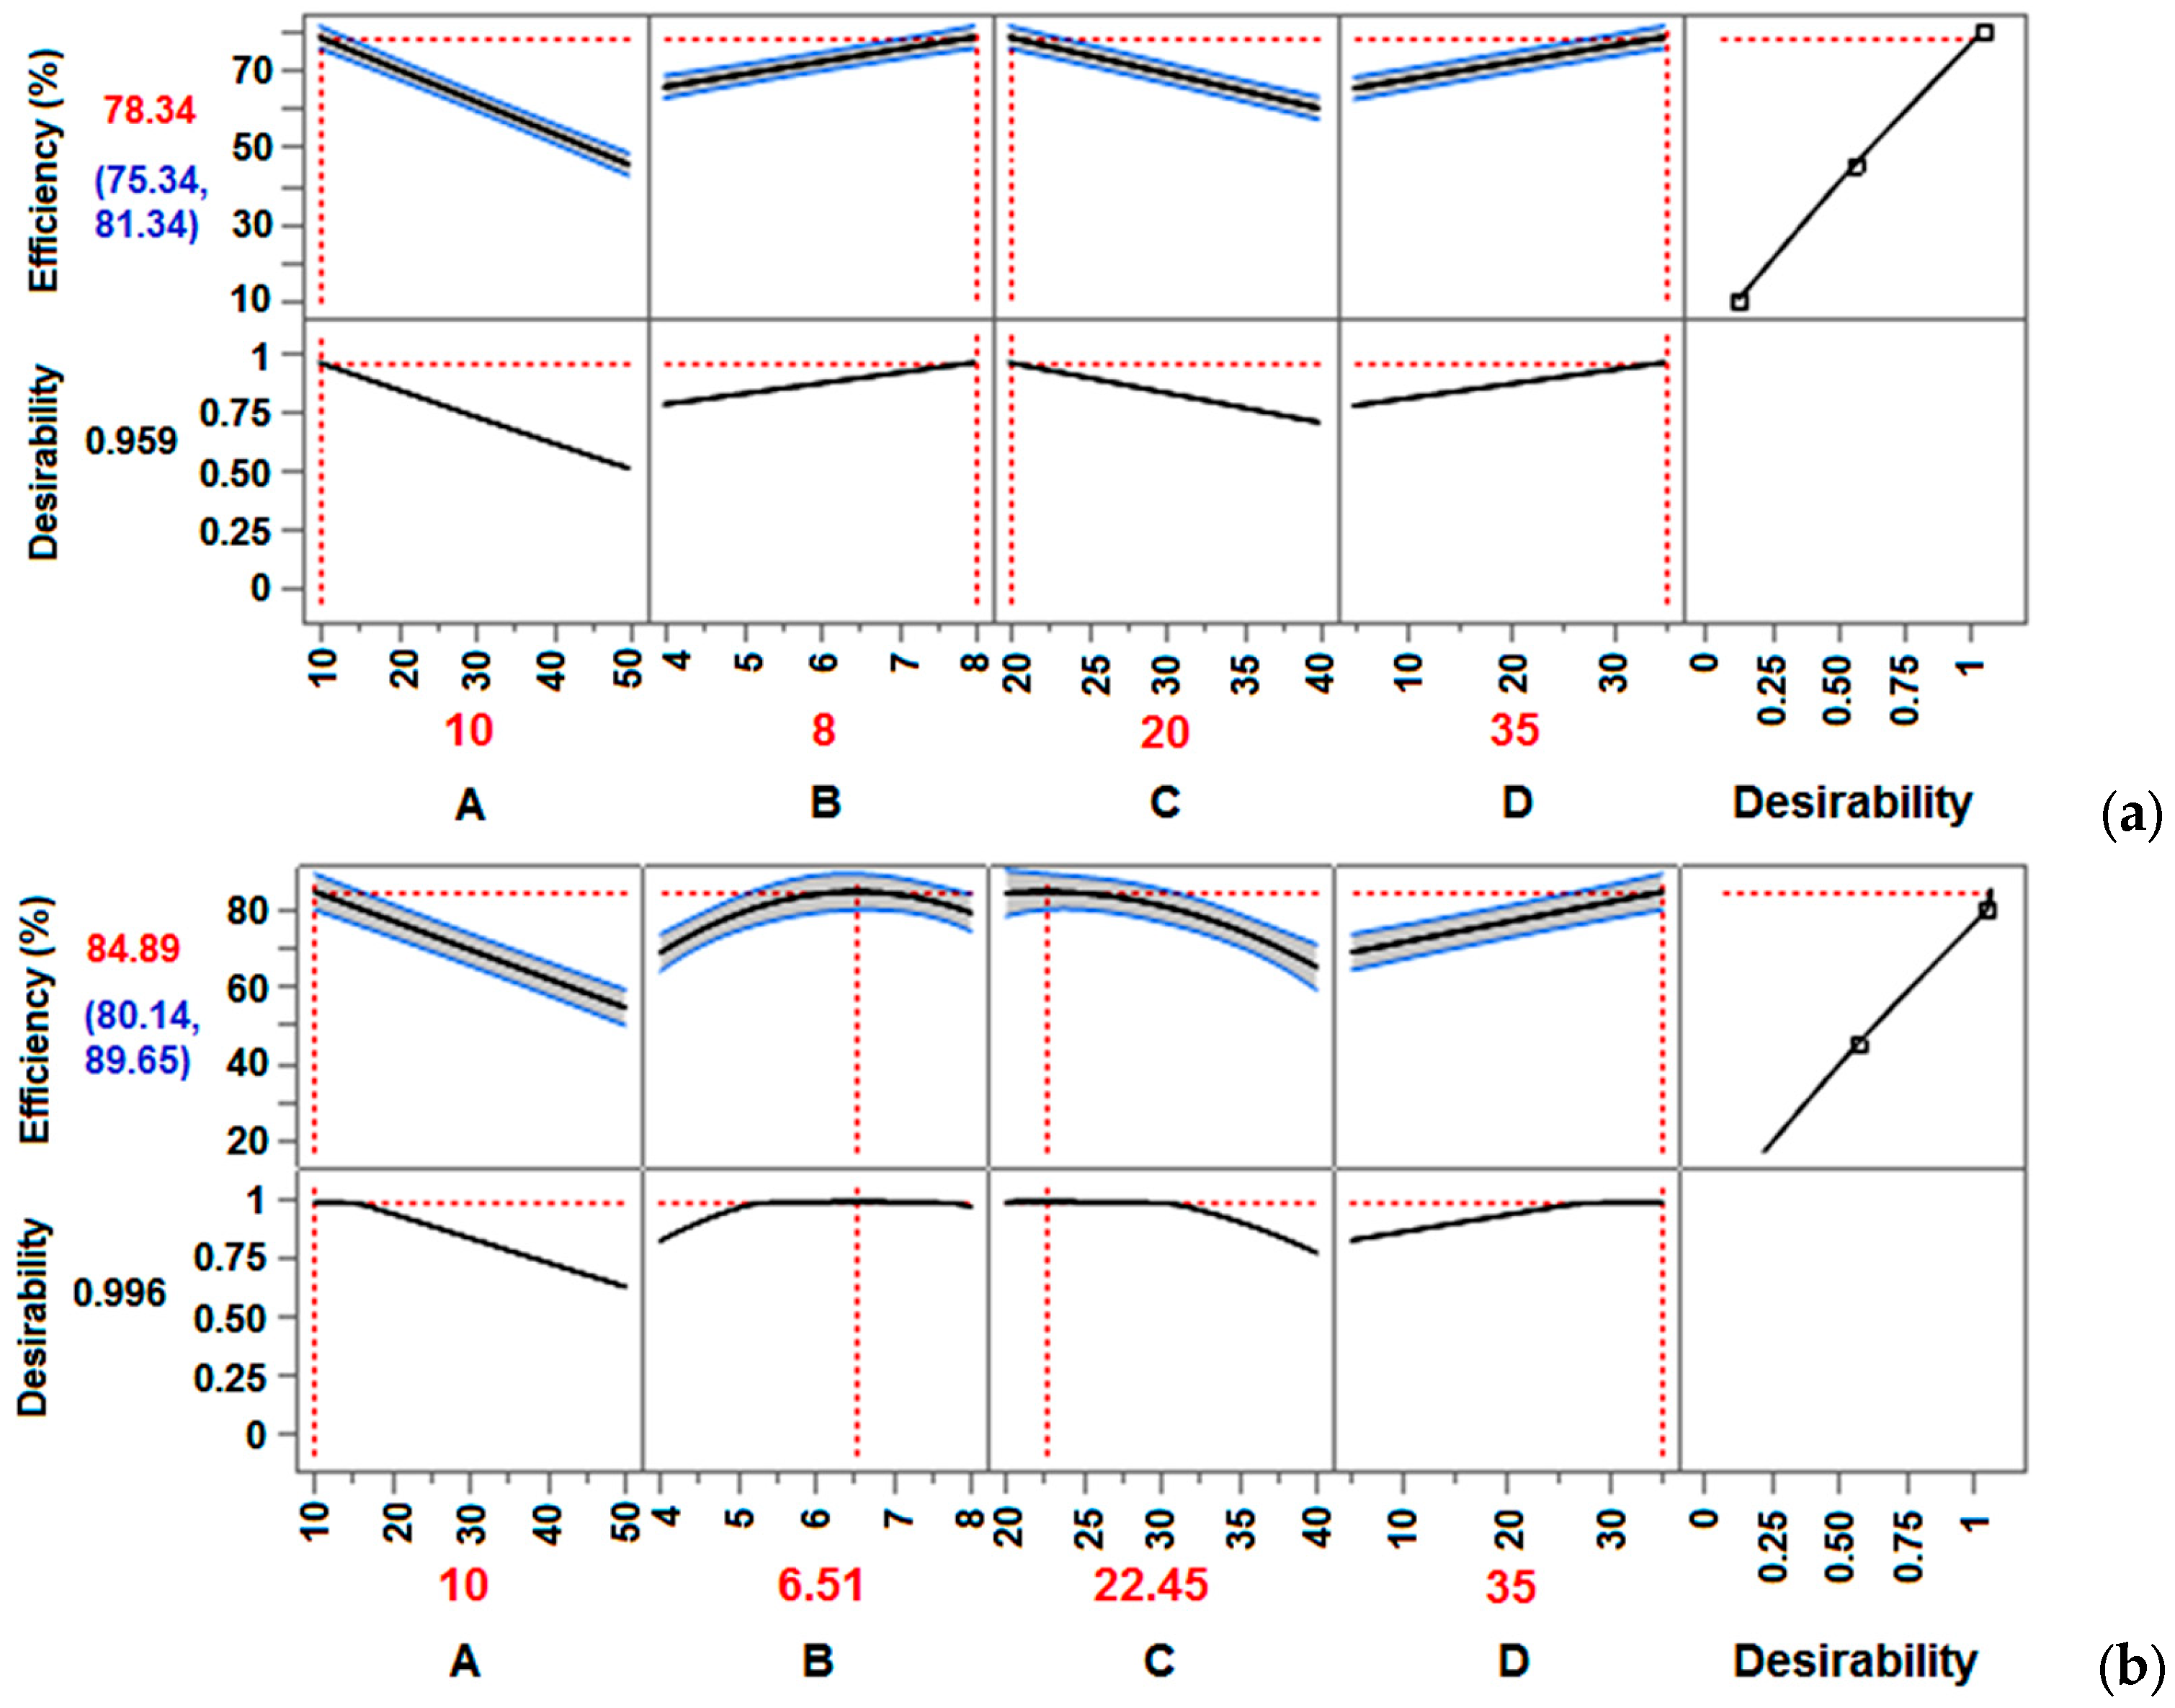
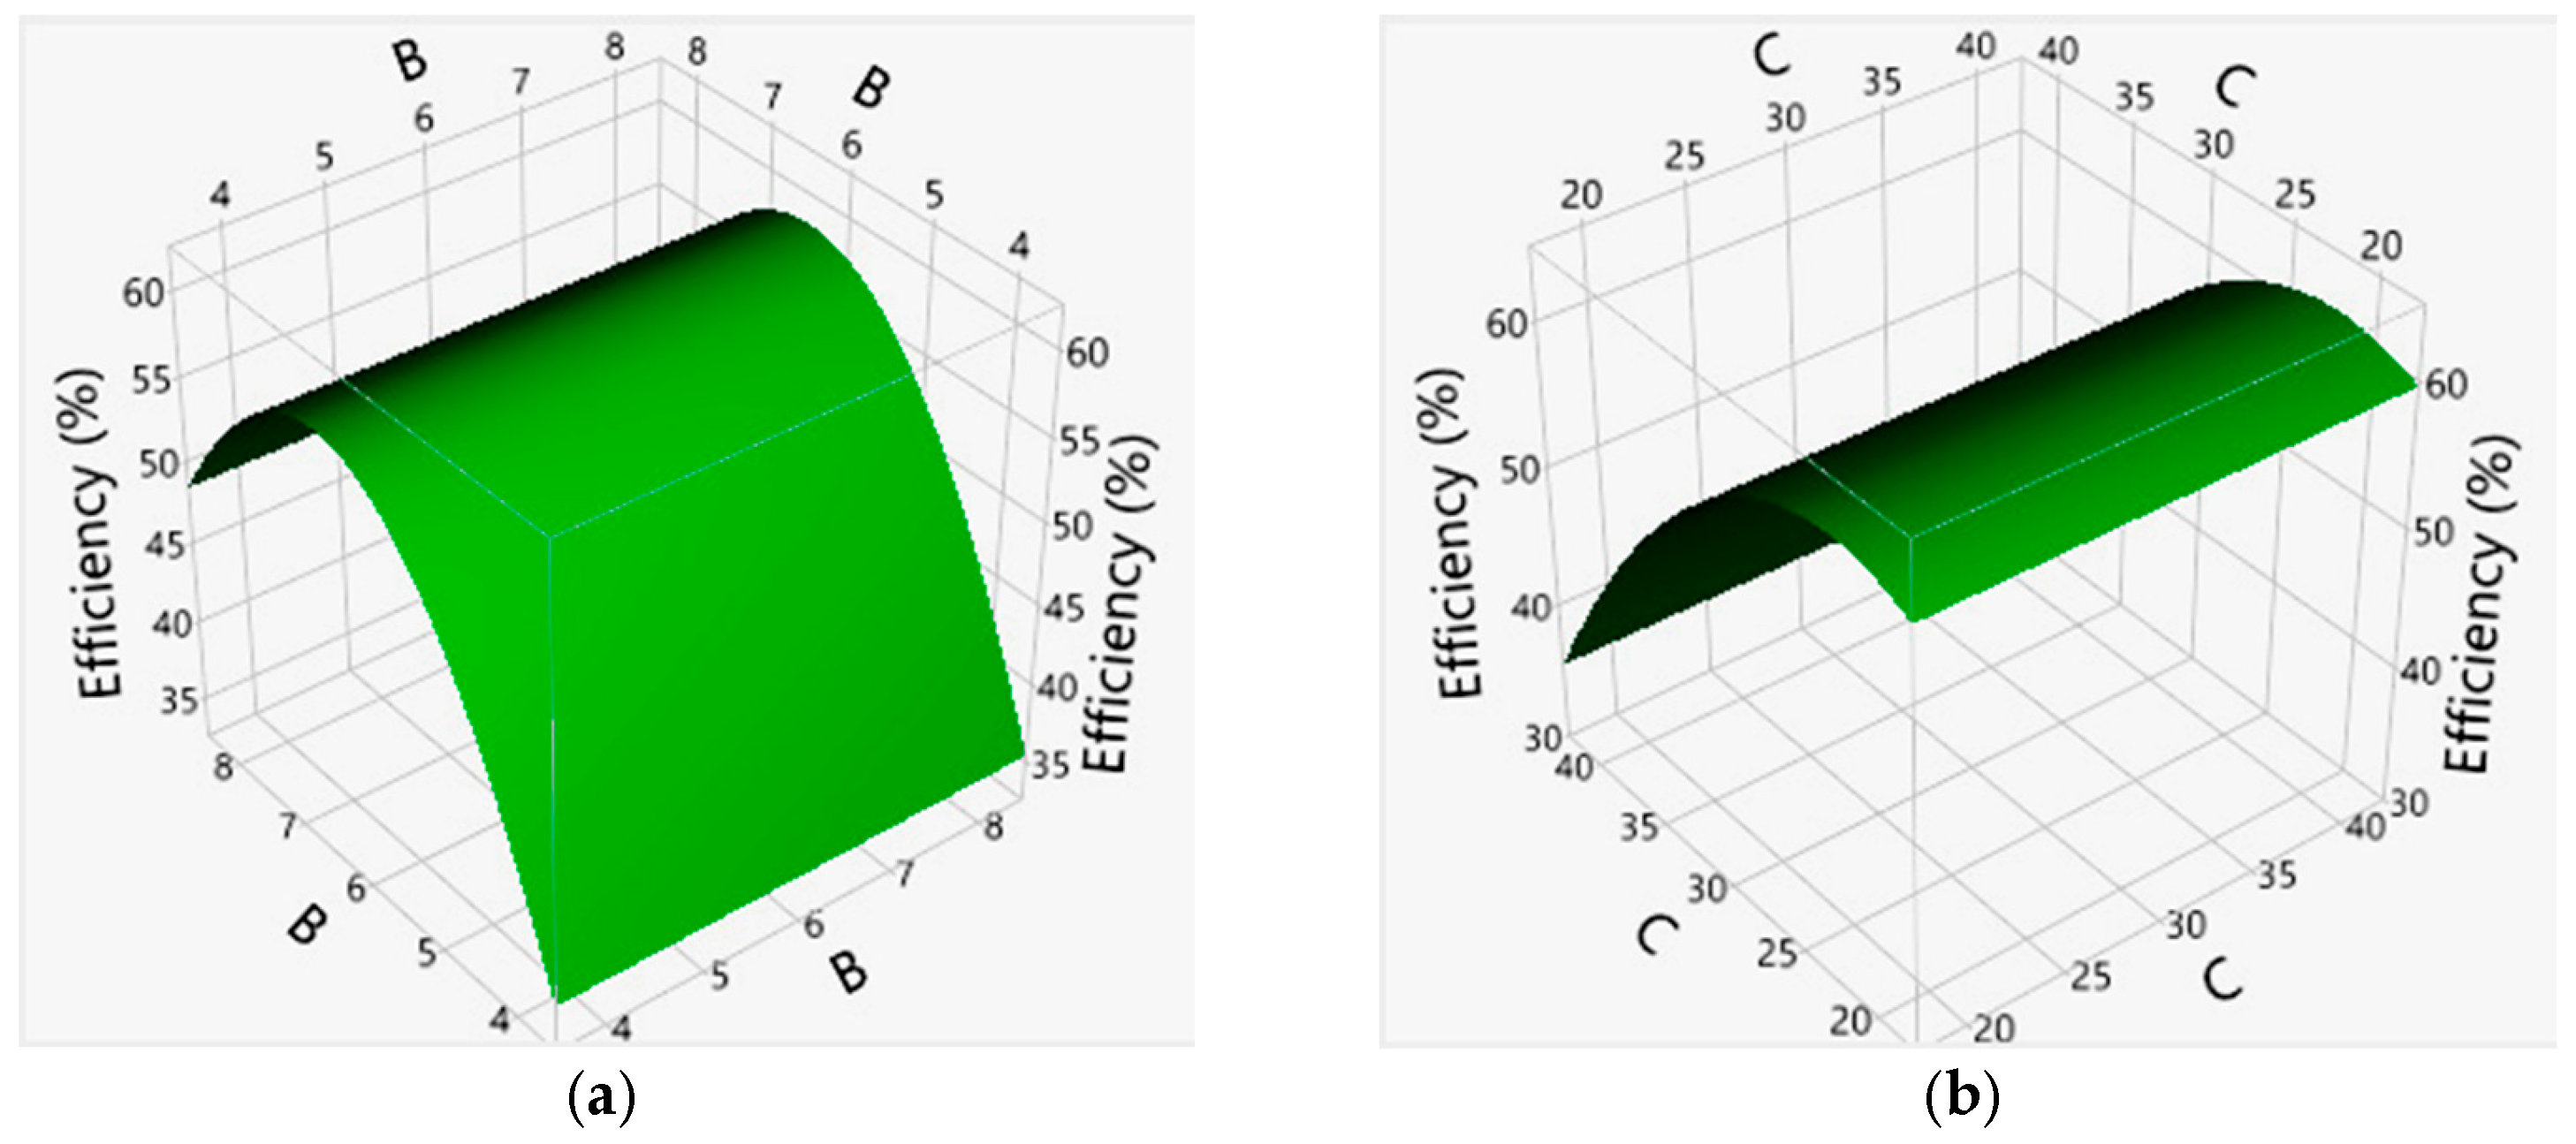
3.3. Effects of Main Factors and Their Interactions

The significance of model factors, effects of main factors, and their interactions on the response were assessed based on combinations of F-values and p-values using the ANOVA test. In order to identify the key main factors and their interaction on the efficiency of nitrate adsorption, an effect test assessment was made (Table 4). All factors and factor interactions that are not statistically significant will be excluded from further analysis.
The proposed mathematical model developed using FFD (Equation (3)) includes an assessment of the linear influence of individual factors, as well as the influence of factor interactions. Considering the results of the conducted experiments (Table 2), 10 model terms were created by the FFD (Table 4). These model terms can be used for theoretical testing of the experimental space if their statistical adequacy is confirmed. It is evident from Table 4, based on the calculated high F-values (F-ratio > 4), that the FFD highlights five significant variations in the response. In this regard, Prob > F indicates that model terms A, B, C, D, and AB are statistically significant (p < 0.05). The corresponding values of the intercept and coefficients of the FFD regression model, as well as the relevant statistical parameters, are given in Table 5.
From Equation (3) it is clear that the efficiency of nitrate adsorption is strongly influenced by the initial nitrate concentration (negative effect of factor A). The response Y1 is positively influenced by the pH value and the contact time. This observation is in accordance with the literature data [15], where it is stated that the adsorption capacity is the highest near pHpzc. Thus, the increase in pH up to pHpzc contributes to a better removal of nitrates from the solution. The kinetic data indicated a faster nitrate adsorption in the initial time period followed by a slower phase until equilibrium is reached [26]. Certainly, the optimal adsorption time will be found in the region close to establishing the equilibrium state of the process [26]. More significant information about the adsorption process can be obtained by calculating the contribution of each factor to the response Y1. The AB interaction effect was globally weaker than the main effects. The importance of the factors and their interactions on nitrate adsorption efficiency is presented in Table 5. Based on the significance of these factors (all p < 0.0001), the predicted Y1 response and the high value of R2 (0.992), it can be tentatively assumed that the mathematical model derived using the FFD (Equation (3)) is acceptable. However, a potential examination of quadratic dependence was not possible here. Therefore, the FFD has limited application in optimization procedures, unless the dependence is certain to be linear. For this reason, the study was expanded, and further analysis was undertaken by additional methodologies.
Given that most optimization problems require the inclusion of quadratic terms in the mathematical model, i.e., the examination of potential quadratic dependence, the study was extended to the CCD within RSM. The CCD examines each factor on three levels and accordingly allows the estimation of the squared terms. Applying this design resulted in an estimate of the intercept and six coefficients after 28 experiments (Table 5), indicating that certain degrees of freedom are left. This is very useful and can help to create more reliable models, especially where some experiments may be affected by experimental errors. Based on the results of the conducted experiments (Table 2), 14 model terms were created using the CCD (Table 4). Based on the calculated high F-values (F-ratio > 4), the CCD highlights six significant variations in the response. In this regard, Prob > F indicates that model terms A, B, C, D, B2, and C2 are statistically significant (p < 0.05). The terms estimates and the regression coefficients in the quadratic model by CCD, providing a t-test for each parameter, are given in Table 5. The observations are similar to those in the previous analysis by FFD. The nonlinear polynomial model (Equation (4)) also shows the strongest negative effect of factor A on the nitrate adsorption efficiency. Also, the positive influence of contact time and pH value on the Y2 response contributes to more efficient nitrate removal from the solution. The C*C interaction effect was globally weaker than the main effects. Based on the significance of these factors (all p < 0.0001), the predicted Y2 response and the high R2 value (0.960), it can be concluded in this case that the mathematical model derived using CCD (Equation (4)) is acceptable.
For easier visualization, a graphical presentation (Pareto diagrams) of the standardized factors effects and their statistically significant interactions obtained using 24 FFD and CCD is shown in Figure 2. The Pareto plot in both cases shows that the main effects (A, B, C, and D) are significant at the 5% significance level (Table 3). Based on the FFD, it was estimated that the A*B interaction is significant. Also, through CCD, the influence of squares B2 and C2 was assessed as significant at the 5% significance level.
However, comparative tests of the effects of main factors and their interactions using FFD and CCD (Table 4) indicated one characteristic case of lack of fit. Namely, the A*B linear interaction was estimated to be significant (p < 0.05) model term using FFD. To understand the interaction nature, the A*B factor interaction is represented by the interaction graph in Figure 3. The presence of non-parallel lines within the design limits indicated the significance of the A*B interaction. In contrast, based on the F-ratio (1.8983 < 4) and Prob > F (0.1915), the CCD did not evaluate this model term as a statistically significant factor interaction (p > 0.05). Therefore, this interaction was excluded from the analysis based on the CCD methodology, and the presented second-order polynomial model by CCD (Equation (4)) was adopted as adequate to describe the factors effect on the response and predict the adsorption efficiency.
To compare the performance of the models used in this study, Figure 4 provides a visual representation of the main effects on adsorption efficiency. Based on the comparative analysis by FFD and CCD, significant changes in the behavior of some main factors (B, C) were observed. As the full factorial design is performed only at the limiting set values (Figure 4a), it was not possible to observe that the maximum of the adsorption efficiency occurs at a pH value of 6.5 (factor B) and that it gradually decreases thereafter (Figure 4b). Also, the adsorption temperature (factor C) does not linearly affect the drop in adsorption efficiency (Figure 4b), which could not be predicted based on the full factorial design (Figure 4a). Based on CCD, the maximum of adsorption efficiency is predicted at 22.5 °C (Figure 4b). Therefore, it was important to extend the study to CCD, in order to examine the influence of factors in the range of their values, but also the squares of the model.
Furthermore, in order to obtain a more complete picture of the adsorption process, a multivariate approach by CCD was applied to consider the interaction effects according to the main effects. The statistical parameters (Table 3) and parameter estimates (Table 5) confirming the statistical validity of the polynomial model suggest that the proposed quadratic model can be used to construct a 3D response surface diagram (RSM spatial design). The squared effects of B2 and C2 were statistically significant (p < 0.05, Table 4) and are presented as 3D response surface graph (Figure 5).
In order to verify the practical applicability of both regression models, nitrate adsorption experiments were repeated at the predicted optimal conditions. The predicted optimum nitrate adsorption conditions with 95% confidence interval are given in Table 6. The analysis was conducted again using FFD and CCD. The efficiency of nitrate adsorption at the predicted optimal conditions by FFD was 78.93% (the predicted efficiency was 78.34%). The obtained nitrate adsorption efficiency was within the predicted range of values (desirability 0.96). The predicted and obtained values are very close, which confirms the adequacy and practical applicability of the model. By applying the CCD during the extended study, after conducting the analysis at the predicted optimal conditions, a nitrate sorption efficiency of 84.06% was obtained (the predicted value was 84.89%). Given that this value is also in the predicted range (desirability 0.99), it can be concluded that in this case the adequacy of the second model has been confirmed. During the extended study using CCD, more precise experimental conditions were determined as optimal for achieving higher nitrate adsorption efficiency (Table 6).

4. Discussion

Process optimization implies adjusting a process to optimize a certain set of parameters without breaking any limitations [24]. The priority goal of optimization is to reduce operating costs while increasing process efficiency, in this case nitrate adsorption. Thus, by compromising cost-effectiveness, adsorption efficiency, and energy savings, the best process solution can be chosen. The best option for this is the design of experiments. Optimal settings of control variables, where the smallest and largest responses can be found in a specific region of interest, can be realized using RSM. This methodology can lead to a good-fitting model that should provide an adequate representation of the mean response. Only such a model can be utilized the optimum value.
In our study, the optimization of the experimental results was carried out to keep the response within the desired range. In this sense, the adsorption efficiency (in response to nitrate removal from the solution) was aimed at the maximum while the other parameters were kept within the range. By using CCD within the RSM, the response surfaces of the quadratic model with one variable were kept at the central level. The other variables were varied within the experimental range. In this case, a pronounced trough was observed on the response surfaces (Figure 5). This confirmed that the optimal conditions were precisely located within the design limits. The optimal adsorption conditions (C0, pH, T, and t) and responses predicted by numerical optimization are shown in Table 6. Based on the obtained results, it can be concluded that all four considered factors (A, B, C, D) and their interactions (B2 and C2) have an important contribution to the efficiency of nitrate adsorption.
Namely, the nonlinear effect of pH (factor B), which first increases and then decreases (Figure 4b), indicates that the pH has a significant positive effect on the nitrate adsorption efficiency within the design limits. Thus, at pH values lower than pHPZC (pH < 7.04), the surface of the CGS adsorbent is positively charged and attracts negative nitrate ions more strongly [15]. This effect is also favorable due to the better nitrates’ mobility, which further improves adsorption. At pH values around pHPZC, the adsorbent surface becomes neutral, which reduces the affinity for nitrate. It is evident that the adsorption efficiency may be lower at this point (Figure 4b), because there are not enough electrostatic attractive forces between negative nitrates and the neutral adsorbent surface. At pH above 7.04, the adsorbent surface becomes negatively charged. This leads to a decrease in adsorption efficiency due to electrostatic repulsion between negative nitrate ions and the negatively charged centers on the adsorbent surface. Additionally, nitrate adsorption at higher pH values is hindered by more competitive OH ions. The CCD methodology predicts a pH of 6.52 as the optimum value (Table 6). At this pH, the adsorbent is slightly positively charged, which allows electrostatic interactions with negative nitrate ions. Also, this pH is not too low for protons (H+) to obstruct the process (generating HNO3). Therefore, the applied model predicts the highest adsorption efficiency (85%) in mildly acidic conditions (pH 6–7, desirability 0.996).
Based on CCD, the temperature (factor C) has a nonlinear and negative effect on adsorption efficiency above 25 °C (Figure 4b). Namely, for exothermic reactions like adsorption, an increase in temperature reduces the strength of the nitrate ions binding to the adsorbent [26]. High temperature actually favors desorption. Thus, an increase in temperature over 25 °C leads to the adsorbate release from the adsorbent surface, reducing the adsorption efficiency. According to the CCD model, the optimal temperature for nitrate adsorption by the CGS adsorbent is predicted to be in the range of 20–25 °C (Figure 4b). The applied model predicts the highest adsorption efficiency (85%) at 22.5 °C with a desirability of 0.996 (Table 6).
Further, both design types similarly predicted a positive effect of contact time (factor D) on nitrate adsorption efficiency (Figure 4). Thus, the high adsorption efficiency (80–90%) with a linear effect of time indicates a stable and efficient process within the designed limits (from 5 to 35 min). However, this prediction did not meet our expectations at first glance. This leads to the suspicion that additional testing (longer contact time) is necessary to achieve process equilibrium. According to some literature data on nitrate adsorption by similar lignocellulosic biomasses [15,26], the equilibrium state is reached at similar reaction conditions within 30–40 min, depending on the initial solution concentration. Additionally, the nitrate adsorption process occurs in two phases [26]. The first phase (initial period) is characterized by rapid nitrate adsorption (whereby most of the nitrate is removed), while the second phase is slower due to the adsorbent surface saturation (achieving equilibrium). Therefore, a linear effect of time was expected with a maximum that should appear in the adsorption saturation phase within 35 min. The possible misconception can be clarified by a more careful analysis of the desirability function using CCD (Figure 4b), which once again confirmed the advantage of this methodology. Following the ANOVA analysis, the desirability function was used to optimize multiple output variables (responses), where each response was transformed onto a scale ranging from 0 (completely unacceptable result) to 1 (most desirable result). All individual desirability scores were combined into an overall desirability function, which was used to identify the combination of factors that provide the best overall outcome. By incorporating constraints and targets for each response, the optimal factor levels that yield the best combination of values for all responses were estimated. In this sense, as can be seen from Figure 4b, the desirability has reached its ideal state at 25 min. From that moment the desirability does not change anymore but stagnates at 0.996 because the goal has been achieved. Although the adsorption efficiency continues to increase linearly, it can be assumed that it is no longer significant in relation to the resources needed for additional investments. The CCD model estimated a time of 35 min as optimal because it does not seek the ideal value of the isolated factor D but is based on the combination of all factors that give the best efficiency and desirability function. In general, it can be concluded that the optimal time is 25–30 min.
The initial nitrate concentration (factor A) has a linear and strong negative effect on adsorption efficiency within the designed limits (Figure 4). The linear decrease in adsorption efficiency with increasing initial nitrate concentration (from 10 to 50 mg/L) indicates that the adsorbent cannot remove all available nitrates from more concentrated solutions [15,26]. It can be explained by adsorption capacity. Namely, the number of the adsorbent active centers limits the adsorption capacity regardless of the initial solution concentration. Thus, from dilute solutions the entire amount of nitrate can be adsorbed. From concentrated solutions, the nitrate amount corresponding to the adsorption capacity will be adsorbed. Hence, the negative effect of the factor A and the linear decrease in adsorption efficiency are understandable (Figure 4). According to the CCD model, an optimal initial nitrate concentration (factor A) of 10 mg/L was predicted (Table 6). However, similar to the explanation in the previous case, the desirability function estimates the initial solution concentration in the range of 10–20 mg/L as the optimal value (Figure 4b).
Our observations can be confirmed by other studies related to nitrate adsorption using lignocellulosic materials with very similar physicochemical and morphological characteristics, such as the bottle gourd (Lagenaria vulgaris) variety [15,26]. In these studies, the initial nitrate concentration effect on the adsorption capacity under similar reaction conditions (nitrate concentration 2–100 mg/L, sorbent dosage 2 g/L, stirring speed 150 rpm, temperature 20 °C, pH 6.5, contact time 60 min) was examined. It was found that increasing the initial solution concentration leads to a decrease in adsorption efficiency, but to the adsorption of a larger nitrate amount per unit mass of sorbent. This is explained by a higher mass transfer driving force. The nitrate adsorption occurs very quickly during the first 15 min (first phase), and then more slowly up to 30 min (second phase) when the system reaches equilibrium. The slower phase of nitrate adsorption is due to the decrease in the mass transfer driving force over time. Additionally, the reaction kinetic of nitrate adsorption on the bottle gourd adsorbent is best described by a non-linear pseudo-first-order model [26]. Based on the Langmuir and Sips isotherms, nitrate adsorption occurs in a monomolecular layer, without mutual interaction and transmigration of ions on the energetically uniform surface of the adsorbent [15]. It was found that nitrate adsorption better followed the Langmuir model with an equilibrium adsorption capacity of 1.18 mmol N/g. The mechanism of electrostatic attraction and anion exchange of chloride with nitrate ions is the dominant adsorption process [15]. Based on thermodynamic parameters, nitrate adsorption is a spontaneous and exothermic process in the temperature range of 20 to 40 °C [26].
The adsorption capacity of the modified gourd shell adsorbent was comparable to the results of most other cationic adsorbents tested for nitrate removal under similar conditions [31,32,33,34,35,36,37,38,39,40,41,42,43,44]. Thus, the nitrate removal ability by cationically modified CGS was higher or very similar to some modified lignocellulosic agricultural waste materials (corn cob, sunflower seed shell, bamboo chopstick, wheat straw), even compared to some mineral clay (such as halloysite or bentonite), commercial activated carbon or zinc-impregnated almond shell activated carbon (Table 7). Also, CGS showed an adsorption capacity close to the commercial anion exchanger Amberlite IRA-900, or higher than the Amberlite IRA-400, Relite A490 and Duolite A7 resins. However, CGS has a lower adsorption capacity than some agricultural wastes grafted with various amine groups (rice hull, sugarcane bagasse, hazelnut shells), or than miscellaneous anion exchangers based on meso-structured silica (Table 7). It is understandable that the differences in adsorption capacity values between these adsorbents depend primarily on the material nature (in biomass, on the ratio of cellulose to lignin), then on the modification reagent, as well as on the adsorption conditions applied [7,15].
Finally, the DoE methodology applied to study the process of nitrate adsorption from the simulated aqueous solutions using a modified calabash gourd shell allowed for a more detailed description of the system behavior through a CCD mathematical model. However, although the CCD within RSM model can help to find the optimal conditions for the nitrate adsorption process, this model will have some limitations in the case of real wastewater. In that case, new models will be developed using the RSM methodology. Therefore, the next step of the research will be aimed at optimizing the adsorption process in more complex aqueous systems (such as industrial, municipal, or agricultural wastewater). Multiple objectives will include the maximum removal of eutrophication causative agents (nitrates and phosphates combined) in the presence of coexisting ions and other pollutants.

5. Conclusions

This study presents the comparison and application of two experimental design types (24 full factorial design and central composite design) in optimizing the nitrate removal from aqueous solutions using the calabash gourd shell. Both applied design types provided mathematical models with satisfactory statistical parameters. The significance of the investigated factors of these two models was comparable. Although the R2 values for FFD were slightly higher, the central composite design proved to be a better option in terms of the obtained data quality. At the optimal model factors predicted by the CCD numerical optimization, a nitrate adsorption efficiency of 85% was achieved in a repeated control experiment. The desirability function contributed significantly to the identification of the factors combination that provides the best overall outcome. In this regard, we recommend the optimal conditions in the range: initial nitrate concentration 10–20 mg/L, pH 6–7, temperature 20–25 °C, and contact time 25–30 min. The adsorption capacity of the modified CGS adsorbent (16.53 mg/g) is comparable to the ability of various cationic adsorbents tested for nitrate removal under similar conditions. The applied DoE methodology proved to be very useful for understanding the adsorption system behavior and locating optimal process factors.

Author Contributions

Conceptualization, G.S.N. and N.S.; Methodology, A.B.; Software, N.S.; Validation, G.B. and N.N.; Formal analysis, M.D. and M.N.; Investigation, D.M.N. and M.N.; Writing—original draft preparation, N.S. and D.M.N.; Writing—review and editing, G.S.N.; visualization, N.N. and M.D.; Supervision, A.B. and G.B. All authors have read and agreed to the published version of the manuscript.

Funding

This research received no external funding.

Data Availability Statement

The original contributions presented in this study are included in the article. Further inquiries can be directed to the corresponding author.

Acknowledgments

This research was supported by the Ministry of Science, Technological Development and Innovation of the Republic of Serbia within the Program of scientific research work (No. 451-03-137/2025-03/200133; No. 451-03-137/2025-03/200124; No. 451-03-137/2025-03/200131).

Conflicts of Interest

The authors declare no conflicts of interest. The funders had no role in the design of the study; in the collection, analyses, or interpretation of data; in the writing of the manuscript; or in the decision to publish the results.

Abbreviations

The following abbreviations are used in this manuscript:
ANOVAAnalysis of variance test
CCDCentral Composite Design
CGSCalabash gourd shell
CHTACN-(3-chloro-2-hydroxypropyl) trimethylammonium chloride
DFDegrees of freedom
DoEDesign of Experiments
FFDFull Factorial Design
pHpzcpH value at the point of zero charge
RSMResponse Surface Methodology

References

  1. Valiente, N.; Gil-Márquez, J.M.; Gómez-Alday, J.J.; Andreo, B. Unraveling groundwater functioning and nitrate attenuation in evaporitic karst systems from southern Spain: An isotopic approach. Appl. Geochem. 2020, 123, 104820. [Google Scholar] [CrossRef]
  2. Long, L.; Xue, Y.; Hu, X.; Zhu, Y. Study on the influence of surface potential on the nitrate adsorption capacity of metal modified biochar. Environ. Sci. Pollut. Res. 2019, 26, 3065–3074. [Google Scholar] [CrossRef] [PubMed]
  3. Zhan, Y.; Lin, J.; Zhu, Z. Removal of nitrate from aqueous solution using cetylpyridinium bromide (CPB) modified zeolite as adsorbent. J. Hazard. Mater. 2011, 186, 1972–1978. [Google Scholar] [CrossRef] [PubMed]
  4. Soares, M.I.M. Biological denitrification of groundwater. Water Air Soil Pollut. 2000, 123, 183–193. [Google Scholar] [CrossRef]
  5. Schoeman, J.J.; Steyn, A. Nitrate removal with reverse osmosis in a rural area in South Africa. Desalination 2003, 155, 15–26. [Google Scholar] [CrossRef]
  6. Abou-Shady, A.; Peng, C.; Bi, J.; Xu, H.; Juan Almeria, O. Recovery of Pb(II) and removal of NO3 from aqueous solutions using integrated electrodialysis, electrolysis, and adsorption process. Desalination 2012, 286, 304–315. [Google Scholar] [CrossRef]
  7. Bhatnagar, A.; Sillanpää, M. A review of emerging adsorbents for nitrate removal from water. Chem. Eng. J. 2011, 168, 493–504. [Google Scholar] [CrossRef]
  8. Vieillard, J.; Bouazizi, N.; Nkuigue Fotsing, P.; Samir, B.; Raguillet, K.; Cosme, J.; Abou Serhal, C.; Mignot, M.; Sophie Bette, M.; Auger, P.; et al. Herbs carbonization and activation for fast sorption of nitrate ions: A new challenge for a full treatment of groundwater pollution. Environ. Sci. Pollut. Res. 2023, 30, 82637–82646. [Google Scholar] [CrossRef]
  9. Gupta, V.K.; Carrott, P.J.M.; Ribeiro Carrott, M.M.L.; Suhas, D. Low-cost adsorbents: Growing approach to wastewater treatment—A review. Crit. Rev. Environ. Sci. Technol. 2009, 39, 783–842. [Google Scholar] [CrossRef]
  10. Keränen, A.; Leiviskä, T.; Hormi, O.; Tanskanen, J. Removal of nitrate by modified pine sawdust: Effects of temperature and co-existing anions. J. Environ. Manag. 2015, 147, 46–54. [Google Scholar] [CrossRef]
  11. Aliedeh, M.A.; Aljbour, S.H.; Al-Harahsheh, A.M.; Al-Zboon, K.; Al-Harahsheh, S. Implementing 24-1 fractional factorial design for filing the gaps in ovat sorption studies of nitrate ions onto Jordanian zeolitic tuff. J. Chem. Technol. Metall. 2021, 56, 331–341. [Google Scholar]
  12. Karić, N.; Maia, A.S.; Teodorović, A.; Atanasova, N.; Langergraber, G.; Crini, G.; Ribeiro, A.R.L.; Đolić, M. Bio-waste valorisation: Agricultural wastes as biosorbents for removal of (in)organic pollutants in wastewater treatment. Chem. Eng. J. Adv. 2022, 9, 100239. [Google Scholar] [CrossRef]
  13. Prajapati, R.P.; Kalariya, M.; Parmar, S.K.; Sheth, N.R. Phytochemical and pharmacological review of Lagenaria sicereria. J. Ayurveda Integr. Med. 2010, 1, 266–272. [Google Scholar] [CrossRef]
  14. Erickson, D.L.; Smith, B.D.; Clarke, A.C.; Sandweiss, D.H.; Tuross, N. An Asian origin for a 10,000-year-old domesticated plant in the Americas. Proc. Natl. Acad. Sci. USA 2005, 102, 18315–18320. [Google Scholar] [CrossRef]
  15. Nikolić, G.; Marković Nikolić, D.; Bojić, A.; Bojić, D.; Nikolić, L.; Stanojević, L.; Durmišević, M.; Simonović, N.; Kostić, M. Bottle gourd (Lagenaria vulgaris) shell as a natural, biodegradable, highly available, cheap, agricultural by-product, miscellaneous biomass, ion exchanger, biosorbent and fertilizer. In Sorption-New Perspectives and Applications; Margeta, K., Farkaš, A., Eds.; InTechOpen: London, UK, 2024; pp. 1–31. [Google Scholar] [CrossRef]
  16. Priya, E.; Kumar, S.; Verma, C.; Sarkar, S.; Maji, P.K. A comprehensive review on technological advances of adsorption for removing nitrate and phosphate from waste water. J. Water Process Eng. 2022, 49, 103159. [Google Scholar] [CrossRef]
  17. Kalaruban, M.; Loganathan, P.; Shim, W.G.; Kandasamy, J.; Ngo, H.H.; Vigneswaran, S. Enhanced removal of nitrate from water using amine-grafted agricultural wastes. Sci. Total Environ. 2016, 565, 503–510. [Google Scholar] [CrossRef]
  18. Maculewicz, J.; O’Sullivan, A.D.; Barker, D.; Tat Wai, K.; Basharat, S.; Bello-Mendoza, R. Novel quaternary ammonium functionalized cellulosic materials for nitrate adsorption from polluted waters. Water Air Soil Pollut. 2025, 236, 47. [Google Scholar] [CrossRef]
  19. Marković Nikolić, D.Z.; Bojić, A.; Bojić, D.; Cvetković, D.; Cakić, M.; Nikolić, G.S. Preconcentration and immobilization of phosphate from aqueous solutions in environmental cleanup by a new bio-based anion exchanger. Waste Biomass Valor. 2020, 11, 1373–1384. [Google Scholar] [CrossRef]
  20. Nikolić, G.S.; Simonović, N.; Nikolić, L.; Durmišević, M.; Marković Nikolić, D.; Ristić, N.; Bojić, A. An integrated OVAT-RSM design to gaps-filling in the study of phosphate sorption process onto cationic modified bottle gourd shell. Adv. Technol. 2023, 12, 5–19. [Google Scholar] [CrossRef]
  21. Lee, S.-C.; Kang, J.-K.; Jang, H.-Y.; Park, J.-A.; Kim, S.-B. Multi-parameter experiments and modeling for nitrate sorption to quaternary ammonium-functionalized poly(amidoamine) dendrimers in aqueous solutions. Int. J. Environ. Sci. Technol. 2022, 19, 11023–11036. [Google Scholar] [CrossRef]
  22. Hafshejani, L.D.; Naserib, A.A.; Moradzadehc, M.; Daneshvard, E.; Bhatnagard, A. Applications of soft computing techniques for prediction of pollutant removal by environmentally friendly adsorbents (case study: The nitrate adsorption on modified hydrochar). Water Sci. Technol. 2022, 86, 1066. [Google Scholar] [CrossRef] [PubMed]
  23. Antony, J. Design of Experiments for Engineers and Scientists, 2nd ed.; Elsevier Ltd.: Amsterdam, The Netherlands, 2014; ISBN 978-0-08-099417-8. [Google Scholar] [CrossRef]
  24. Getahun, M.; Asaithambi, P.; Befekadu, A.; Alemayehu, E. Optimization of indigenous natural coagulants process for nitrate and phosphate removal from wet coffee processing wastewater using response surface methodology: In the case of Jimma Zone Mana district. Case Stud. Chem. Environ. Eng. 2023, 8, 100370. [Google Scholar] [CrossRef]
  25. Baei, M.S.; Esfandian, H.; Nesheli, A.A. Removal of nitrate from aqueous solutions in batch systems using activated perlite: An application of response surface methodology. Asia-Pac. J. Chem. Eng. 2016, 11, 437–447. [Google Scholar] [CrossRef]
  26. Nikolić, G.S.; Marković Nikolić, D.; Nikolić, T.; Stojadinović, D.; Andjelković, T.; Kostić, M.; Bojić, A. Nitrate removal by sorbent derived from waste lignocellulosic biomass of Lagenaria vulgaris: Kinetics, equilibrium and thermodynamics. Int. J. Environ. Res. 2021, 15, 215–230. [Google Scholar] [CrossRef]
  27. Marković Nikolić, D.Z.; Bojić, A.L.; Savić, S.R.; Petrović, S.M.; Cvetković, D.J.; Cakić, M.D.; Nikolić, G.S. Synthesis and physicochemical characterization of anion exchanger based on green modified bottle gurd shell. J. Spectrosc. 2018, 2018, 1856109. [Google Scholar] [CrossRef]
  28. Antony, J. 6—Full factorial designs. In Design of Experiments for Engineers and Scientists, 3rd ed.; Elsevier Ltd.: Amsterdam, The Netherlands, 2023; pp. 65–87. ISBN 9780443151736. [Google Scholar] [CrossRef]
  29. Montgomery, D.C. Design and Analysis of Experiments, 8th ed.; John Wiley & Sons, Inc.: Hoboken, NJ, USA, 2012; pp. 233–292. ISBN 1118214714. [Google Scholar]
  30. Nair, A.T.; Makwana, A.R.; Ahammed, M.M. The use of response surface methodology for modelling and analysis of water and wastewater treatment processes: A review. Water Sci. Technol. 2014, 69, 464–478. [Google Scholar] [CrossRef]
  31. Xi, Y.; Mallavarapu, M.; Naidu, R. Preparation, characterization of surfactants modified clay minerals and nitrate adsorption. Appl. Clay Sci. 2010, 48, 92–96. [Google Scholar] [CrossRef]
  32. Mishra, P.C.; Patel, R.K. Use of agricultural waste for the removal of nitrate-nitrogen from aqueous medium. J. Environ. Manag. 2009, 90, 519–522. [Google Scholar] [CrossRef]
  33. Nujić, M.; Milinković, D.; Habuda-Stanić, M. Nitrate removal from water by ion exchange. Croat. J. Food Sci. Technol. 2017, 9, 182–186. [Google Scholar] [CrossRef]
  34. Namasivayam, C.; Höll, W.H. Quaternized biomass as an anion exchanger for the removal of nitrate and other anions from water. J. Chem. Technol. Biotechnol. 2005, 80, 164–168. [Google Scholar] [CrossRef]
  35. Zhang, Z.; Huang, G.; Zhang, P.; Shen, J.; Wang, S.; Li, Y. Development of iron-based biochar for enhancing nitrate adsorption: Effects of specific surface area, electrostatic force, and functional groups. Sci. Total Environ. 2023, 856, 159037. [Google Scholar] [CrossRef]
  36. Kristek Janković, A.; Habuda-Stanić, M.; Dong, H.; Tutić, A.; Romić, Ž.; Ergović Ravančić, M.; Landeka Dragičević, T.; Šiljeg, M. Utilization of modified sunflower seed as novel adsorbent for nitrates removal from wastewater. Water 2024, 16, 73. [Google Scholar] [CrossRef]
  37. Chabani, M.; Amrane, A.; Bensmaili, A. Kinetic modelling of the adsorption of nitrates by ion exchange resin. Chem. Eng. J. 2006, 125, 111–117. [Google Scholar] [CrossRef]
  38. Geng, N.; Ren, B.; Xu, B.; Li, D.; Xia, Y.; Xu, C.; Hua, E. Bamboo chopstick biochar electrodes and enhanced nitrate removal from groundwater. Processes 2022, 10, 1740. [Google Scholar] [CrossRef]
  39. Rezaee, A.; Godini, H.; Dehestani, S.; Khavanin, A. Application of impregnated almond shell activated carbon by zinc and zinc sulfate for nitrate removal from water. Iran. J. Environ. Health Sci. Eng. 2008, 5, 125–130. [Google Scholar]
  40. Orlando, U.S.; Baes, A.U.; Nishijima, W.; Okada, M. Preparation of agricultural residue anion exchangers and its nitrate maximum adsorption capacity. Chemosphere 2002, 48, 1041–1046. [Google Scholar] [CrossRef]
  41. Orlando, U.S.; Baes, A.U.; Nishijima, W.; Okada, M. A new procedure to produce lignocellulosic anion exchangers from agricultural waste materials. Bioresour. Technol. 2002, 83, 195–198. [Google Scholar] [CrossRef]
  42. Stjepanović, M.; Velić, N.; Habuda-Stanić, M. Modified hazelnut shells as a novel adsorbent for the removal of nitrate from wastewater. Water 2022, 14, 816. [Google Scholar] [CrossRef]
  43. Wang, Y.; Gao, B.-Y.; Yue, W.-W.; Yue, Q.-Y. Adsorption kinetics of nitrate from aqueous solutions onto modified wheat residue. Colloids Surf. A Physicochem. Eng. Asp. 2007, 308, 1–5. [Google Scholar] [CrossRef]
  44. Hamoudi, S.; Saad, R.; Belkacemi, K. Adsorptive removal of phosphate and nitrate anions from aqueous solutions using ammonium-functionalized mesoporous silica. Ind. Eng. Chem. Res. 2007, 46, 8806–8812. [Google Scholar] [CrossRef]
Figure 1. Correlation plots of the actual versus predicted adsorption efficiency Y1 by FFD (a) and predicted adsorption efficiency Y2 by CCD (b), where RSq—the square of the Pearson correlation coefficient or coefficient of determination (R2), RMSE—the Root Mean Squared Error, and p Value—probability value (or p-value).
Separations 12 00139 g001
Figure 2. Pareto plots of standardized factor effects on response Y using FFD and CCD (Orthog.—orthogonality, a mathematical property useful for the statistical CCD model).
Separations 12 00139 g002
Figure 3. Graph of A*B interaction profiles estimated by FFD.
Separations 12 00139 g003
Figure 4. Plot of the main effects on the adsorption efficiency by FFD (a) and CCD (b).
Separations 12 00139 g004
Figure 5. 3D Response Surface graph for B*B (a) and C*C (b) interactions.
Separations 12 00139 g005
Table 1. Input factors and factor levels for 24 FFD and CCD matrix.
Sorption ParametersFactors24 FFDCCD
LevelsLevels
−1+1−10+1
Initial nitrate concentration, C0 (mg/L)A1050103050
pH valueB48468
Temperature, T (°C)C2040203040
Contact time, t (min)D53552035
Table 2. Experimental FFD (16 runs) and CCD (28 runs) matrix with the response (Y) and both predicted values of efficiency (Y1—FFD, Y2—CCD).
RunsPatternABCDEfficiency
Y (%)
Predicted
Y1 (%) FFD
Predicted
Y2 (%) CCD
1−−−−10420552.2952.0950.15
2+−−−10420522.8625.6722.56
3−+−−10820564.5865.0365.39
4−−+−50440532.7433.6232.76
5−−−+504203567.1265.4167.42
6++−−50820532.1731.8531.05
7+−+−10440510.937.197.20
8+−−+504203536.7138.9839.27
9−++−30840547.1246.5544.83
10−+−+308203578.9378.3582.92
11−−++304403545.9146.9447.29
12+++−30840512.6713.3712.52
13++−+308203547.8845.1748.02
14+−++304403521.8420.5121.18
15−+++308403559.1659.8659.62
16++++308403524.3526.6926.75
170a00304302039.42 41.96
180A00308302056.61 52.36
1900a0106202064.72 60.46
2000A0506402038.58 41.13
21000a10630538.17 47.06
22000A106303573.42 62.82
230000106302056.24 57.49
240000506302055.71 57.49
250000506302056.98 57.49
260000506302055.96 57.49
27a000106302078.45 75.89
28A000506302044.81 45.66
Table 3. Analysis of variance test and relevant statistical parameters.
Source of VariationDFSum of SquaresMean SquareF Ratio
Y1Y2Y1Y2Y1Y2Y1Y2
Model566039.39318879.79381207.881479.97249.602474.9481
Error102148.3921414.67764.8419.75Prob. > F
Corrected Total15276087.78529294.4714 <0.0001<0.0001
Determination coefficients
Y1 (using FFD)Y2 (using CCD)
R20.9920.960
R2adjusted0.9880.943
R2predicted0.9790.925
DF—Degrees of Freedom; Prob.—probability (p-value).
Table 4. Effect test of main factors and their interactions.
Full Factorial Design
SourceNparmDFSum of SquaresF RatioProb. > F
A113553.3521675.7728<0.0001 *
B11365.383269.4882<0.0004 *
C111365.6720259.7221<0.0001 *
D11709.4232134.9174<0.0001 *
A*B1145.56258.6650<0.0321 *
A*C114.16160.79140.4144
B*C1110.08061.91710.2248
A*D110.31360.05960.8168
B*D110.06500.01240.9158
C*D117.48021.42260.2865
Central Composite Design
SourceNparmDFSum of SquaresF RatioProb. > F
A114112.6404171.3500<0.0001 *
B11487.240120.3005<0.0006 *
C111681.226870.0470<0.0001 *
D111116.911346.5353<0.0001 *
B*B11275.575511.48160.0048 *
C*C11115.82994.82600.0468 *
A*B1145.56251.89830.1915
A*C114.16160.17340.6839
B*C1110.08060.42000.5282
A*D110.31360.01310.9107
B*D110.06500.00270.9593
C*D117.48020.31170.5862
A*A1127.73161.15540.3020
D*D1116.85350.70220.4172
* statistically significant factors and interactions; DF—Degrees of Freedom; Prob.—probability (p-value); Nparm—Nonparametric analysis of multivariate data.
Table 5. Parameter estimates after applying of 24 FFD and CCD.
Full Factorial Design
TermEstimateStd. Errort RatioProb. > |t|
Intercept41.07870.54995574.69<0.0001 *
A−14.90250.549955−27.10<0.0001 *
B4.77870.5499558.69<0.0001 *
C−9.23870.549955−16.80<0.0001 *
D6.65870.54995512.11<0.0001 *
A*B−1.68750.549955−3.070.0119 *
Central Composite Design
TermEstimateStd. Errort RatioProb. > |t|
Intercept57.58521.48610138.75<0.0001 *
A−15.11551.047392−14.43<0.0001 *
B5.20271.0473924.97<0.0001 *
C−9.66441.047392−9.23<0.0001 *
D7.87721.0473927.52<0.0001 *
B*B−10.04132.417854−4.150.0005 *
C*C−6.40632.417854−2.650.0150 *
* statistically significant factors and interactions.
Table 6. Predicted optimal adsorption conditions (factors) and adsorption efficiency (response).
DoEA
(C0)
B
(pH)
C
(T)
D
(t)
Efficiency
(%)
Efficiency (%)
Lower CI
Efficiency (%) Upper CIDesirability
FFD108203578.34575.34381.3470.9591
CCD106.5222.463584.89780.14489.6500.9962
Table 7. Adsorption capacities of some adsorbents towards nitrate. Adsorption experiments were done in pure nitrate solutions obtained by dissolving solid KNO3 or NaNO3 in deionized or distilled water.
AdsorbentAdsorpt. Capacity
(mg/g)
Nitrate Solution
(mg/L)
Temp.
(°C)
pHRef.
Halloysite0.5410017 hRoom5.4[31]
Wheat straw charcoal1.102510 min15-[32]
Commercial activated carbon1.222510 min15-[32]
Weak base anion exchanger Duolite A76.51100360 min255.4[33]
Cross-linked and quaternized chinese reed7.554010 min255.8[34]
Modified corn-cob9.35----[35]
Modified sunflower seed shells12.98300120 min257.5[36]
Strong base anion exchange resin Relite A49013.02100360 min255.4[33]
Modified QLD-bentonite14.7610017 hRoom5.4[31]
Commercial anion exchanger Amberlite IRA-40014.80----[37]
Modified bambo chopstick16.39----[38]
Impregnated almond shell activated carbon16–1750120 min206.2[39]
Modified CGS16.535040 min236.5This study
Commercial anion exchanger Amberlite IRA-90016.80----[40]
Modified rice hull18.483048 h30-[41]
Modified sugarcane bagasse19.743048 h30-[41]
Modified hazelnut shells25.79----[42]
Modified wheat residue29.12500150 min236.8[43]
Ammonium-functionalized mesoporous silica46.0070060 min58.0[44]
Disclaimer/Publisher’s Note: The statements, opinions and data contained in all publications are solely those of the individual author(s) and contributor(s) and not of MDPI and/or the editor(s). MDPI and/or the editor(s) disclaim responsibility for any injury to people or property resulting from any ideas, methods, instructions or products referred to in the content.

