Article

Multi-Template Molecularly Imprinted Polymers Coupled with a Solid-Phase Extraction System in the Selective Determination of Non-Steroidal Anti-Inflammatory Drugs (NSAIDs) in Environmental Water Samples

by
David Aurelio-Soria
1,
Giaan A. Alvarez-Romero
1,
Maria E. Paez-Hernandez
1,
I. Perez-Silva
1,
Miriam Franco-Guzman
1,
Gabriela Islas
1,2,* and
Israel S. Ibarra
1,*
1
Área Académica de Química, Universidad Autónoma del Estado de Hidalgo, Km 4.5 Carretera Pachuca-Tulancingo, Mineral de la Reforma 42184, Hidalgo, Mexico
2
Área de Ingeniería Agroindustrial, Universidad Politécnica de Francisco I. Madero, Domicilio Conocido, Tepatepec 42640, Hidalgo, Mexico
*
Authors to whom correspondence should be addressed.
Separations 2025, 12(6), 140; https://doi.org/10.3390/separations12060140
Submission received: 6 April 2025 / Revised: 27 April 2025 / Accepted: 29 April 2025 / Published: 25 May 2025
(This article belongs to the Section Materials in Separation Science)

Abstract

:
A simple, fast, and low-cost pre-concentration methodology based on the application of multi-template molecularly imprinted polymers (mt-MIP) in a solid-phase extraction system coupled with capillary electrophoresis was developed for the determination of naproxen, diclofenac, and ibuprofen in environmental water samples. A systematic study of the mt-MIP composition was conducted using a second-order simplex lattice experiment design (fraction of the functional monomer methacrylic acid (MAA), the total moles of functional monomers, and the total moles of the cross-linker agent). The optimal mt-MIP, consisting of 0.025 mmol of each analyte, with 2.40 mmol of methacrylic acid (MAA) and 3.60 mmol of 4-vinylpyridine (4VP) and 23.00 mmol of the cross-linker agent (EGDMA), was coupled to an SPE system under the optimal conditions: pH = 3.5; 20 mg of mt-MIP; and an eluent (MeOH/NaOH [0.001]). This methodology provides limits of detection from 3.00 to 12.00 µg L−1 for the studied NSAIDs. The methodology’s precision was evaluated in terms of inter- and intra-day repeatability, with %RSD < 10% in all cases. Finally, the proposed method can be successfully applied in the analysis of environmental water samples (bottle, tap, cistern, well, and river water samples), which demonstrates the developed method’s robustness.

1. Introduction

Emerging contaminants (ECs) have been present in the environment for decades; however, their levels have only recently begun to be quantified; therefore, they remain unregulated or are currently undergoing a regularization process [1,2]. The term ECs includes a wide range of products used in daily life, such as personal care products, pesticides, endocrine disruptors, and pharmaceutical compounds (PHCs) [3]. PHCs are employed to treat or prevent illness, with significant applications in veterinary and human medicine; some common PHCs are antibiotics, synthetic hormones, analgesics, and non-steroidal anti-inflammatory drugs, among others [4].
Non-steroidal anti-inflammatory drugs (NSAIDs) are chemical compounds classified as analgesic and antipyretic with anti-inflammatory properties. The pharmacological action of NSAIDs is based on the inhibition of cyclooxygenase, a key enzyme in prostaglandin biosynthesis [5]. The reason for their widespread prescription is that, unlike opioids, they do not cause sedation, respiratory depression, or addiction [6]. Among NSAIDs, ibuprofen (IBP), diclofenac (DCF), naproxen (NPX), and acetaminophen (ACE) are the most common and are the top 10 priority pharmaceuticals to be detected in aquatic environments [7].
The presence of NSAIDs in the environment is due to their extensive use as prescription and over-the-counter medication. Additionally, the improper disposal of unused drugs and production facility effluents are significant sources, while their physicochemical properties, such as high polarity, stability, and low biodegradability, contribute to their widespread distribution [8,9]. NSAIDs are considered safe drugs, but their continued misuse can harm human health, causing renal function, nephrotoxicity, gastrointestinal, and cardiovascular complications; furthermore, negative effects on biota, such as cytological changes in the liver, kidney, and gills of fish species, have also been reported [10,11]. NSAIDs have been included in the official United States Environmental Protection Agency (USEPA) Method 1694, and DCF has been incorporated into the watch list of the latest revision of the European Union Water Framework Directive (EU-WFD) in their determination or monitoring of NSAIDs in environmental samples at concentrations of ng L−1 and µg L−1 [11].
Several analytical techniques have been used in NSAID analysis, including the following: electrochemical methods [12], gas chromatography (GC) [13], high-performance liquid chromatography (HPLC) [14], and capillary electrophoresis (CE) [15]. Among analytical techniques, CE is widely applied in the field of analytical separations due to its numerous advantages over other instrumental techniques, such as multianalyte analysis capabilities, high separation efficiency, short analysis time, and having the minimum requirements of sample and chemical reagents. NSAID analysis has two main problems, sensitivity and selectivity, because analytes are present in low concentrations and the matrix contains organic and inorganic compounds that can interfere with the analysis, and these problems have been overcome by the incorporation of a sample treatment stage.
Sample treatments, including centrifugation, homogenization, distillation, and extraction, are designed to render the sample amenable for instrumental analysis [16]. Extraction techniques are of particular importance in the isolation, clean-up, and pre-concentration of analytes. Among extraction techniques, solid-phase extraction (SPE) is the most versatile configuration, improving analytical sensitivity [17,18]. SPE has been performed using polymeric commercial adsorbents (C8, C18, HLB, etc.), carbonaceous materials [19], cellulose-based materials [20], and metal–organic frameworks [21], and recently, the use of molecularly imprinted polymers has been explored [22].
Molecularly imprinted polymers (MIPs) are highly selective synthetic materials, specifically designed to recognize and bind to template molecules [23]. The selectivity of MIPs is conferred during synthesis; the created cavities possess the shape, size, and functionality that the template molecule needs through electrostatic forces, hydrogen bonds, π-π interactions, Van der Waals forces, and hydrophobic interactions with functional monomers. This allows MIPs to act as receptors like natural antibodies [24]. The versatility of MIPs is found in the wide combination of functional monomers and cross-linkers that can be used in their synthesis, providing unique properties such as high selectivity, stability, reusability, cost-effectiveness, easy synthesis, and storage [25]. These characteristics make MIPs excellent adsorbents, with applications in the analysis of antibiotics [22], pesticides [26], and metal ions [27], among others. Recently, multi-template molecularly imprinted polymers (mt-MIP) have gained attention due to their ability to generate multiple types of recognition sites on a single polymeric material [28].
The current study outlines the design, synthesis, and application of an innovative mt-MIP in the analysis of IBP, NPX, and DCF in environmental water samples. This analysis was performed using capillary electrophoresis coupled with an SPE pre-concentration technique. The critical factors of the SPE system were evaluated using the one-factor-at-a-time method, while a second-order simplex lattice experiment design was employed to systematically investigate the mt-MIP composition. For the first time, 4-vinylpyridine (4VP) and methacrylic acid (MAA) were used as functional monomers in the development of an mt-MIP for NSAIDs. The physical and chemical properties of the optimal mt-MIP were investigated using infrared spectroscopy (IR), thermogravimetric analysis (TGA), particle size (PS) analysis, and isotherm models (Langmuir and Dubinin–Radushkevich).

2. Materials and Methods

2.1. Reagents and Materials

Sodium tetraborate (Na2B4O7), sodium hydroxide (NaOH), and hydrochloric acid (HCl) were obtained from J.T. Baker (Phillipsburg, NJ, USA). Acetaminophen (ACE), diclofenac (DCF), ibuprofen (IBP), naproxen (NPX), and α-naphthaleneacetic acid used as the internal standard (IS) were obtained from Sigma-Aldrich (St. Louis, MO, USA). Solutions were prepared by diluting the respective analytical-grade reagent in deionized water, provided by a Milli-Q system (18.0 MΩ cm) (Millipore, Bedford, MA, USA). The background electrolyte (BGE) solution consisted of 30 mM sodium tetraborate and 2 mM β-cyclodextrin, adjusted to a pH of 10 [29].
Methacrylic acid (MAA), 4-vinylpyridine (4VP), ethylene glycol dimethacrylate (EGDMA), and the sodium persulfate employed in the synthesis of the mt-MIP were obtained from Sigma Aldrich (St. Louis, MO, USA). The HPLC-grade methanol used in mt-MIP synthesis and elution was obtained from Sigma-Aldrich (St. Louis, MO, USA).

2.2. mt-MIP Synthesis

The mt-MIP were synthesized via precipitation polymerization. First, 0.025 mmol of IBP, ACE, NPX, and DCF (template molecules) was mixed with 2.40 mmol of MAA and 3.60 mmol of 4VP (functional monomers) in MeOH (porogen solvent), and the mixture was stirred (3000 rpm). Completing the pre-polymerization step, we added 23.00 mmol of EGDMA (cross-linker agent) and 350 mg of sodium persulfate (initiator). With the aim of removing the oxygen content, the reaction mixture was purged with nitrogen for 15 min; subsequently, the polymerization reaction was carried out at 60 °C for 8 h. Finally, the templates were removed from the polymeric network by Soxhlet extraction (24 h), employing MeOH as a solvent. The obtained polymer was dried at 60 °C for 12 h [22]. The non-imprinted polymer (NIP) was synthesized in the same experimental conditions described above, excluding the template molecule.

2.3. Instruments

The characterization of the optimal LDH was conducted using a Perkin Elmer Fourier transform infrared spectrophotometer (FTIR) with a Pike Gladi ATR. The pH was adjusted with a pH/ion analyzer (model 450; Corning Science Products, New York, NY, USA). Electrophoretic separation was performed using a Beckman Coulter P/ACE 5500-UV (Fullerton, CA, USA), employing a fused silica capillary (41.7 cm × 75 μm ID). Data were collected and analyzed with a Beckman P/ACE system with MDQ version 2.3 software. The particle size was determined using a Beckman Coulter LS I3 320 Laser Diffraction Particle Size Analyzer, and the thermal stability of the adsorbent was assessed with a TGA Analyzer 200 with Universal V4.7A software in the temperature range of 35 to 600 °C (10 °C min−1).

2.4. Capillary Electrophoresis

The capillary was conditioned with 1.0 M NaOH for 15 min, 0.1 M NaOH for 10 min, deionized water for 10 min, and BGE for 10 min. The capillary was sequentially washed between analyses with 1.0 M NaOH for 4 min, 0.1 M NaOH for 2 min, deionized water for 2 min, and BGE for 4 min. Injection was performed hydrodynamically (0.5 psi, 10 s), and a voltage of 18 kV was applied to separate the analytes [29].

2.5. Adsorption Experiments

Adsorption experiments were carried out under ambient conditions using batch configuration; 10 mg of the mt-MIP was placed in a 1.5 mL Eppendorf tube and conditioned with 1.0 mL of MeOH followed by 1.0 mL of deionized water (three times). Subsequently, 1.0 mL of NSAID solution (20.0 mg L−1, pH = 3.5) was added and vortexed for 5 min. After that, the mixture was centrifuged (3 min, 5000 rpm), and the supernatant solution was spiked with IS (1.0 mg L−1) and analyzed by CE. The amount of NSAIDs adsorbed per gram of adsorbent (qe) was calculated as the difference between the initial concentration (C0) and the equilibrium concentration (Ce) (Equation (1)).
q e = ( C 0 C e ) m   V

2.6. Sample Treatment

A total of 20 mg of the mt-MIP was packed into an SPE cartridge and conditioned with 3.0 mL of MeOH followed by 5 mL of deionized water (1 mL min−1). Subsequently, 50 mL of a water sample, adjusted to pH = 3.5, was passed through the SPE cartridge. After sample loading, the mt-MIP was washed with 5.0 mL of deionized water to remove the salt content in the sample. The analytes were then eluted with 1.0 mL of MeOH/NaOH (0.01 M). The eluate was evaporated to dryness and reconstituted with 0.5 mL of a 0.5 mg L−1 IS solution and analyzed by CE.

3. Results and Discussion

3.1. MIP Composition Effects on ACE, DCF, IBP, and NPX Extraction

The molar ratios of the template, functional monomer, and cross-linker are critical variables in MIP synthesis [30]. However, the vast number of possible combinations of these variables and their levels makes a one-factor-at-a-time approach impractical. Therefore, a second-order simplex lattice experiment design (DoE) was selected to conduct a systematic study of the mt-MIP composition effects on NSAID extraction. The input variables were defined as follows (coded–uncoded): (A) the fraction of the functional monomer MAA (0.00 to 1.00: 0.20 to 0.80), (B) the total moles of functional monomers (0.00 to 1.00: 4.00 to 8.00), and (C) the total moles of the cross-linker (0.00 to 1.00: 20.00 to 40.00). Table 1 provides information regarding the factor combinations and their studied levels. The average extraction percentage was selected as the output variable. All the experiments were performed as described in Section 2.5 on adsorption experiments.
The obtained results were analyzed with MINITAB®, and the ANOVA results of the experimental data are summarized in Table 2. It was concluded that the data fit a linear model, and the interaction between the variables B (total moles of functional monomer) and C (total moles of cross-linker) is the most important. According to the literature, functional monomers are responsible for the pre-polymerization complex’s formation through specific interactions with templates that lead to the creation of molecular recognition cavities, while the cross-linker provides stability around this complex [30]. To maximize the output variable, it is necessary to determine the optimal composition of both the functional monomer and cross-linker: An excess of functional monomers in the reaction mixture can lead to the creation of non-selective sites in the polymeric matrix [31]. On the other hand, if the content of functional monomers is low, the formation of the pre-polymerization complex may not be optimal, thus affecting selectivity. Additionally, the amount of cross-linker must be controlled; if there is not enough cross-linker, the pre-polymerization complex cannot be adequately stabilized, affecting the structural properties of the mt-MIP. Conversely, an excess of cross-linker prevents template removal after synthesis, which decreases binding ability by decreasing the number of active sites in the polymeric network [32]. Equation (2) corresponds to the response surface through coded variables.
Y i = 85.976   A + 86.408   B + 84.430   C + 3.928   A B + 2.973   A C + 5.837   B C
where A: fraction of the functional monomer MAA; B: total moles of functional monomers (MAA + 4VP); C: total moles of the cross-linker.
According to the DoE, the optimal mt-MIP composition is 1 mmol of template (0.25 mmol ACE, 0.25 mmol IBP, 0.25 mmol NPX, and 0.25 mmol DCF), 6 mmol of functional monomers (2.4 mmol MAA and 3.6 mmol of 4VP), and 23 mmol of the cross-linker. The mt-MIP with this composition was synthesized as described in Section 2.2. mt-MIP synthesis and adsorption experiments were performed under the same experimental conditions. An average extraction efficiency of 88.12 with a standard deviation of 0.66 was obtained. These experimental data were contrasted with those predicted by the DoE (μ = 87.24) employing a t-test, and it was found that there is no evidence of significant differences (tcrit95% > texp). On the other hand, the adsorption experiments for the NIP were conducted under the same experimental conditions. Extraction percentages of 9.95, 0.21, 9.14, and 10.02 (n = 3, %RSD < 5%) were obtained for IBP, ACE, NPX, and DCF, respectively. These results indicate a successful imprinting process and demonstrate that the extraction performance of the optimal mt-MIP is attributed to the recognition cavities and specific interactions between each analyte and the functional monomers.

3.2. Characterization of Optimal mt-MIP

An FTIR analysis of the optimal mt-MIP for NSAID extraction was performed (Figure 1d). The FTIR spectra show a band centered around 3000 cm−1, corresponding to the O-H bonds in the product from the -COOH groups in MAA. A weak band near 2900 cm−1 is attributed to the stretching of the C-H bonds of methylene groups (-CH2-) in the polymeric chain; the intense band centered around 1730 cm−1 corresponds to the carbonyl groups from EGDMA and MAA; and the bands at 1068 and 993 cm−1 are attributed to the C-H bending of in-plane and out-of-plane rings from 4VP [33,34,35]. Finally, in the FTIR spectra of the cross-linker and functional monomers (Figure 1a–c), an intense band near 1630 cm−1 is observed, corresponding to the stretching of the C=C bond of vinyl groups. However, in the mt-MIP spectra (Figure 1d), the complete absence of this band is noticed, which confirms the success of the polymerization reaction [33,34].
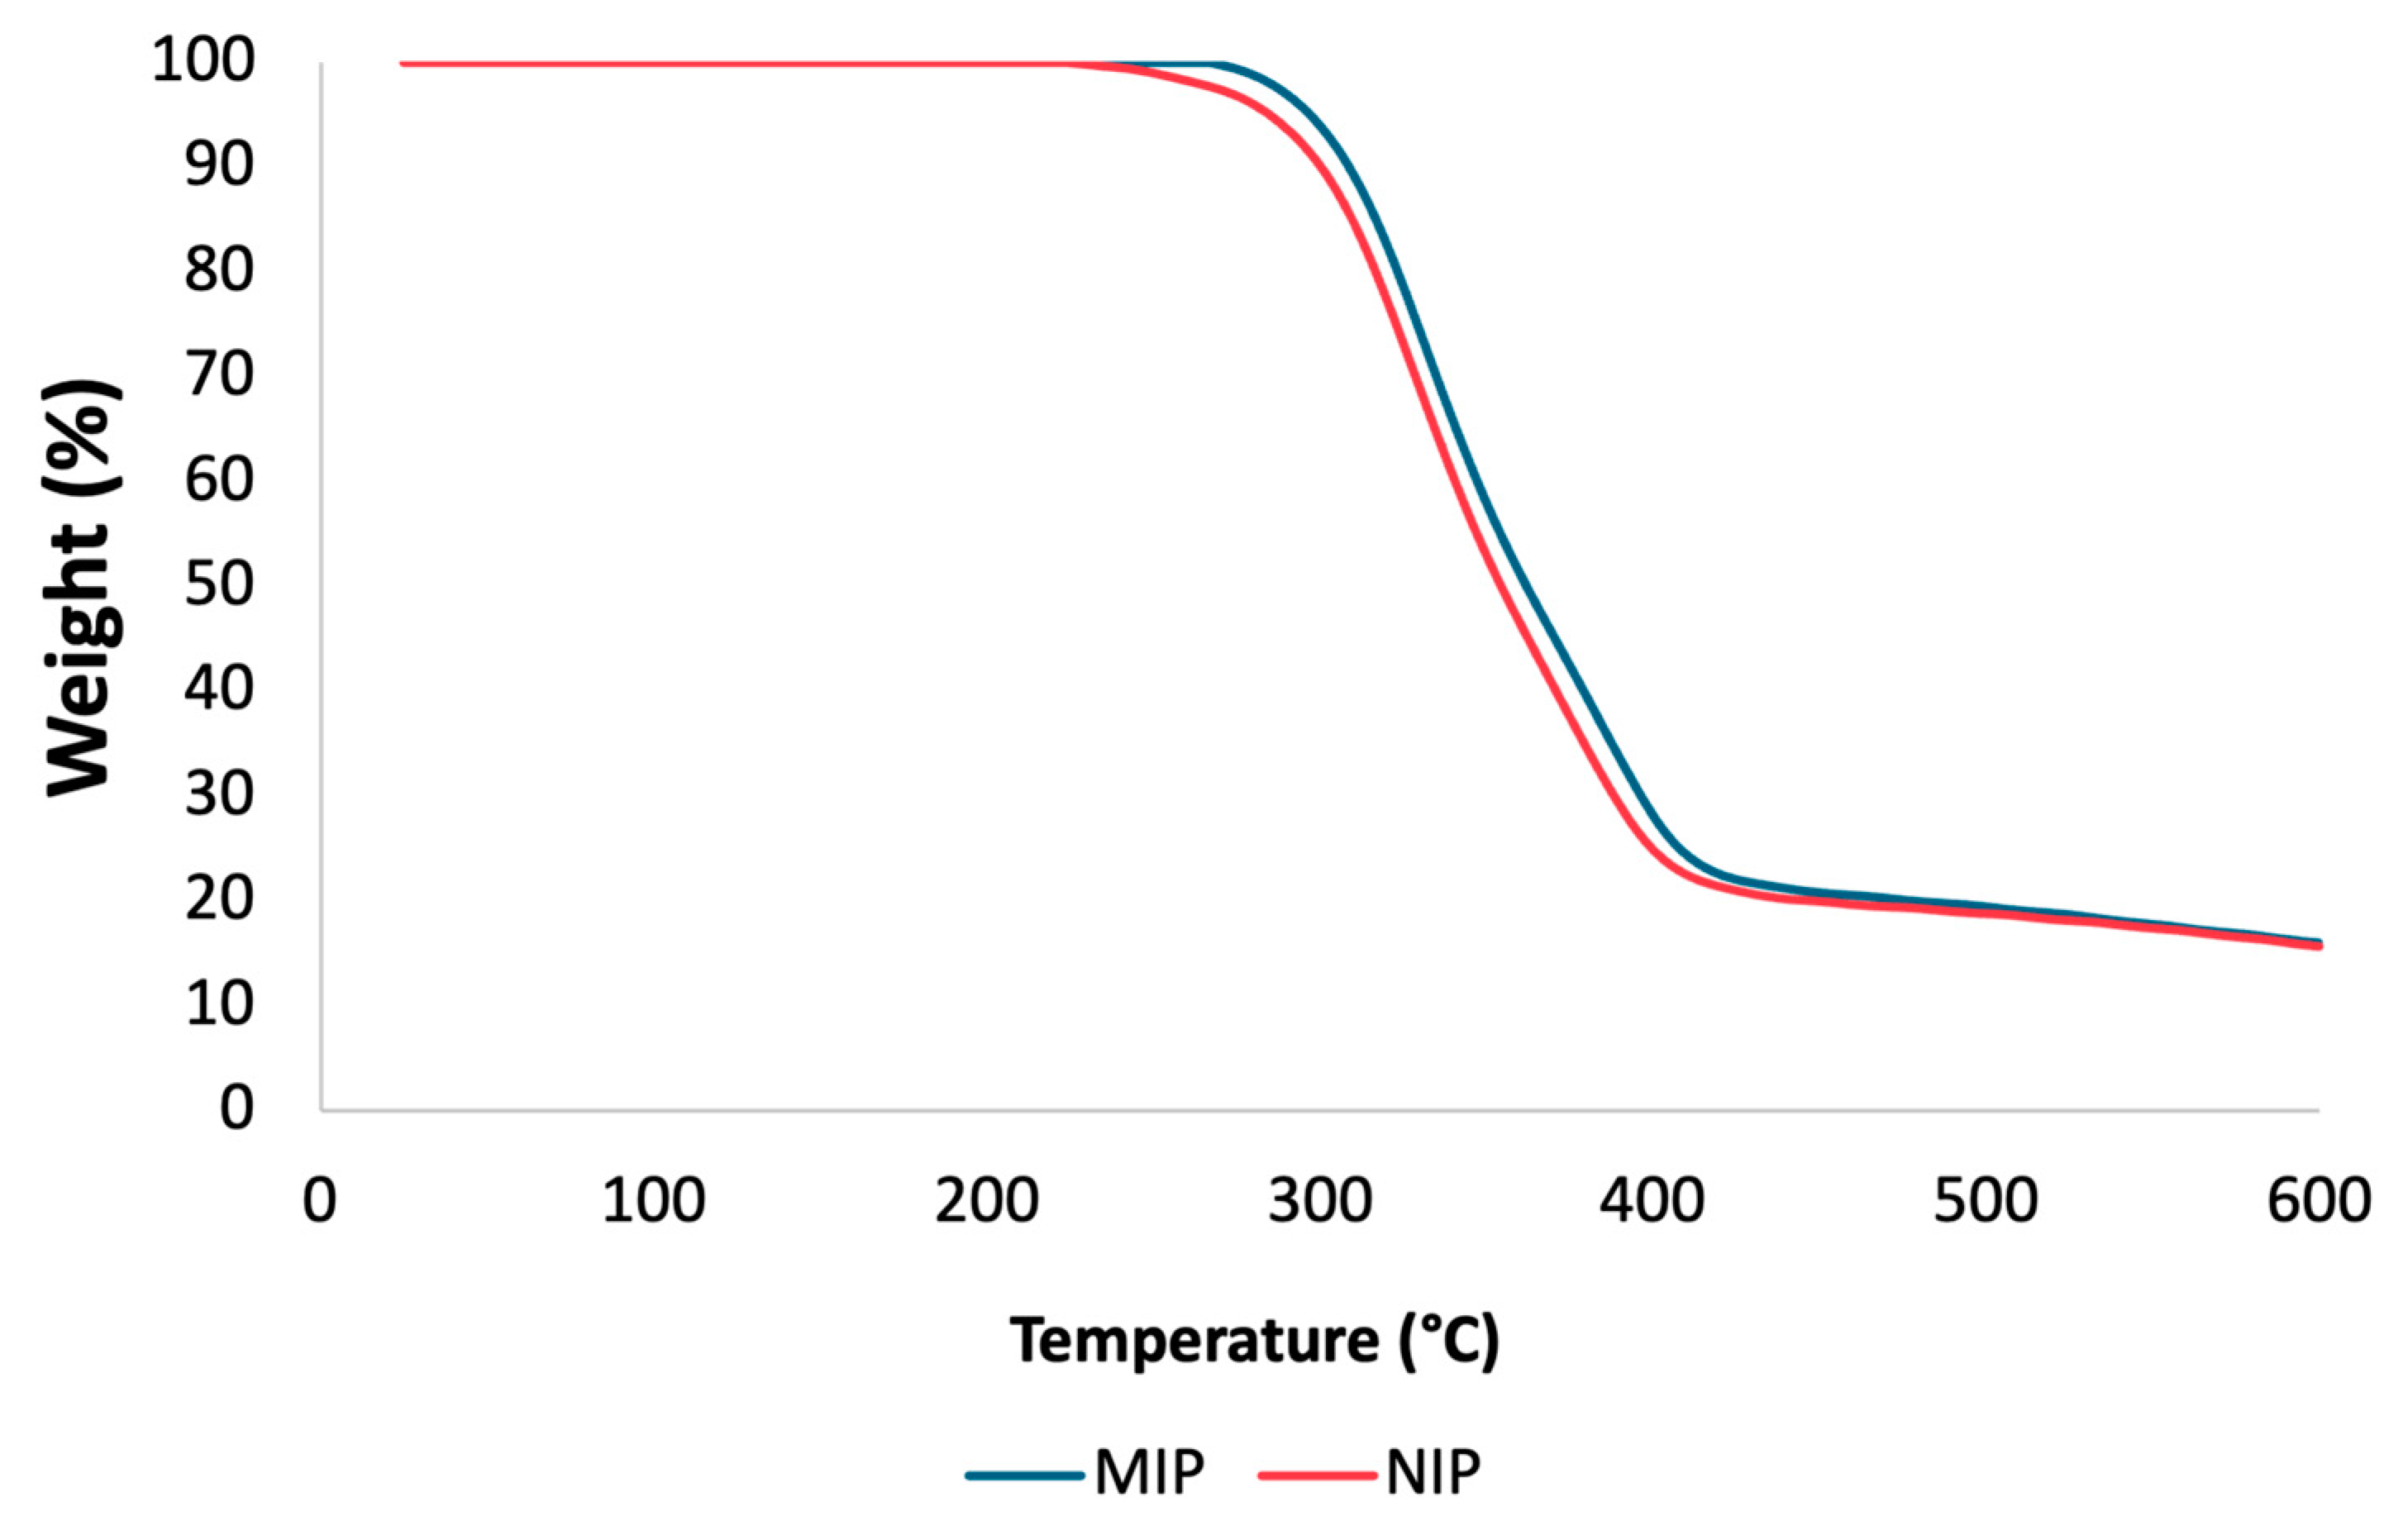
To assess the thermal stability of the mt-MIP and NIP, TGA experiments were conducted. TGA plots are shown in Figure 2. There is a comparable loss of mass for the NIP and mt-MIP; in both instances, a degradation step is visible in the temperature range of 256 to 447 °C for the NIP and 278 to 479 °C for mt-MIP, which accounts for 82% of the total mass. This behavior is attributed to the enhanced thermal stability due to the molecular imprinting process conducted for the mt-MIP [36]. A study of the particle size also revealed a consistent pattern, with NIP and mt-MIP particles measuring 23.91 μm and 27.38 μm, respectively. These differences are attributed to the recognition cavities in the mt-MIP.
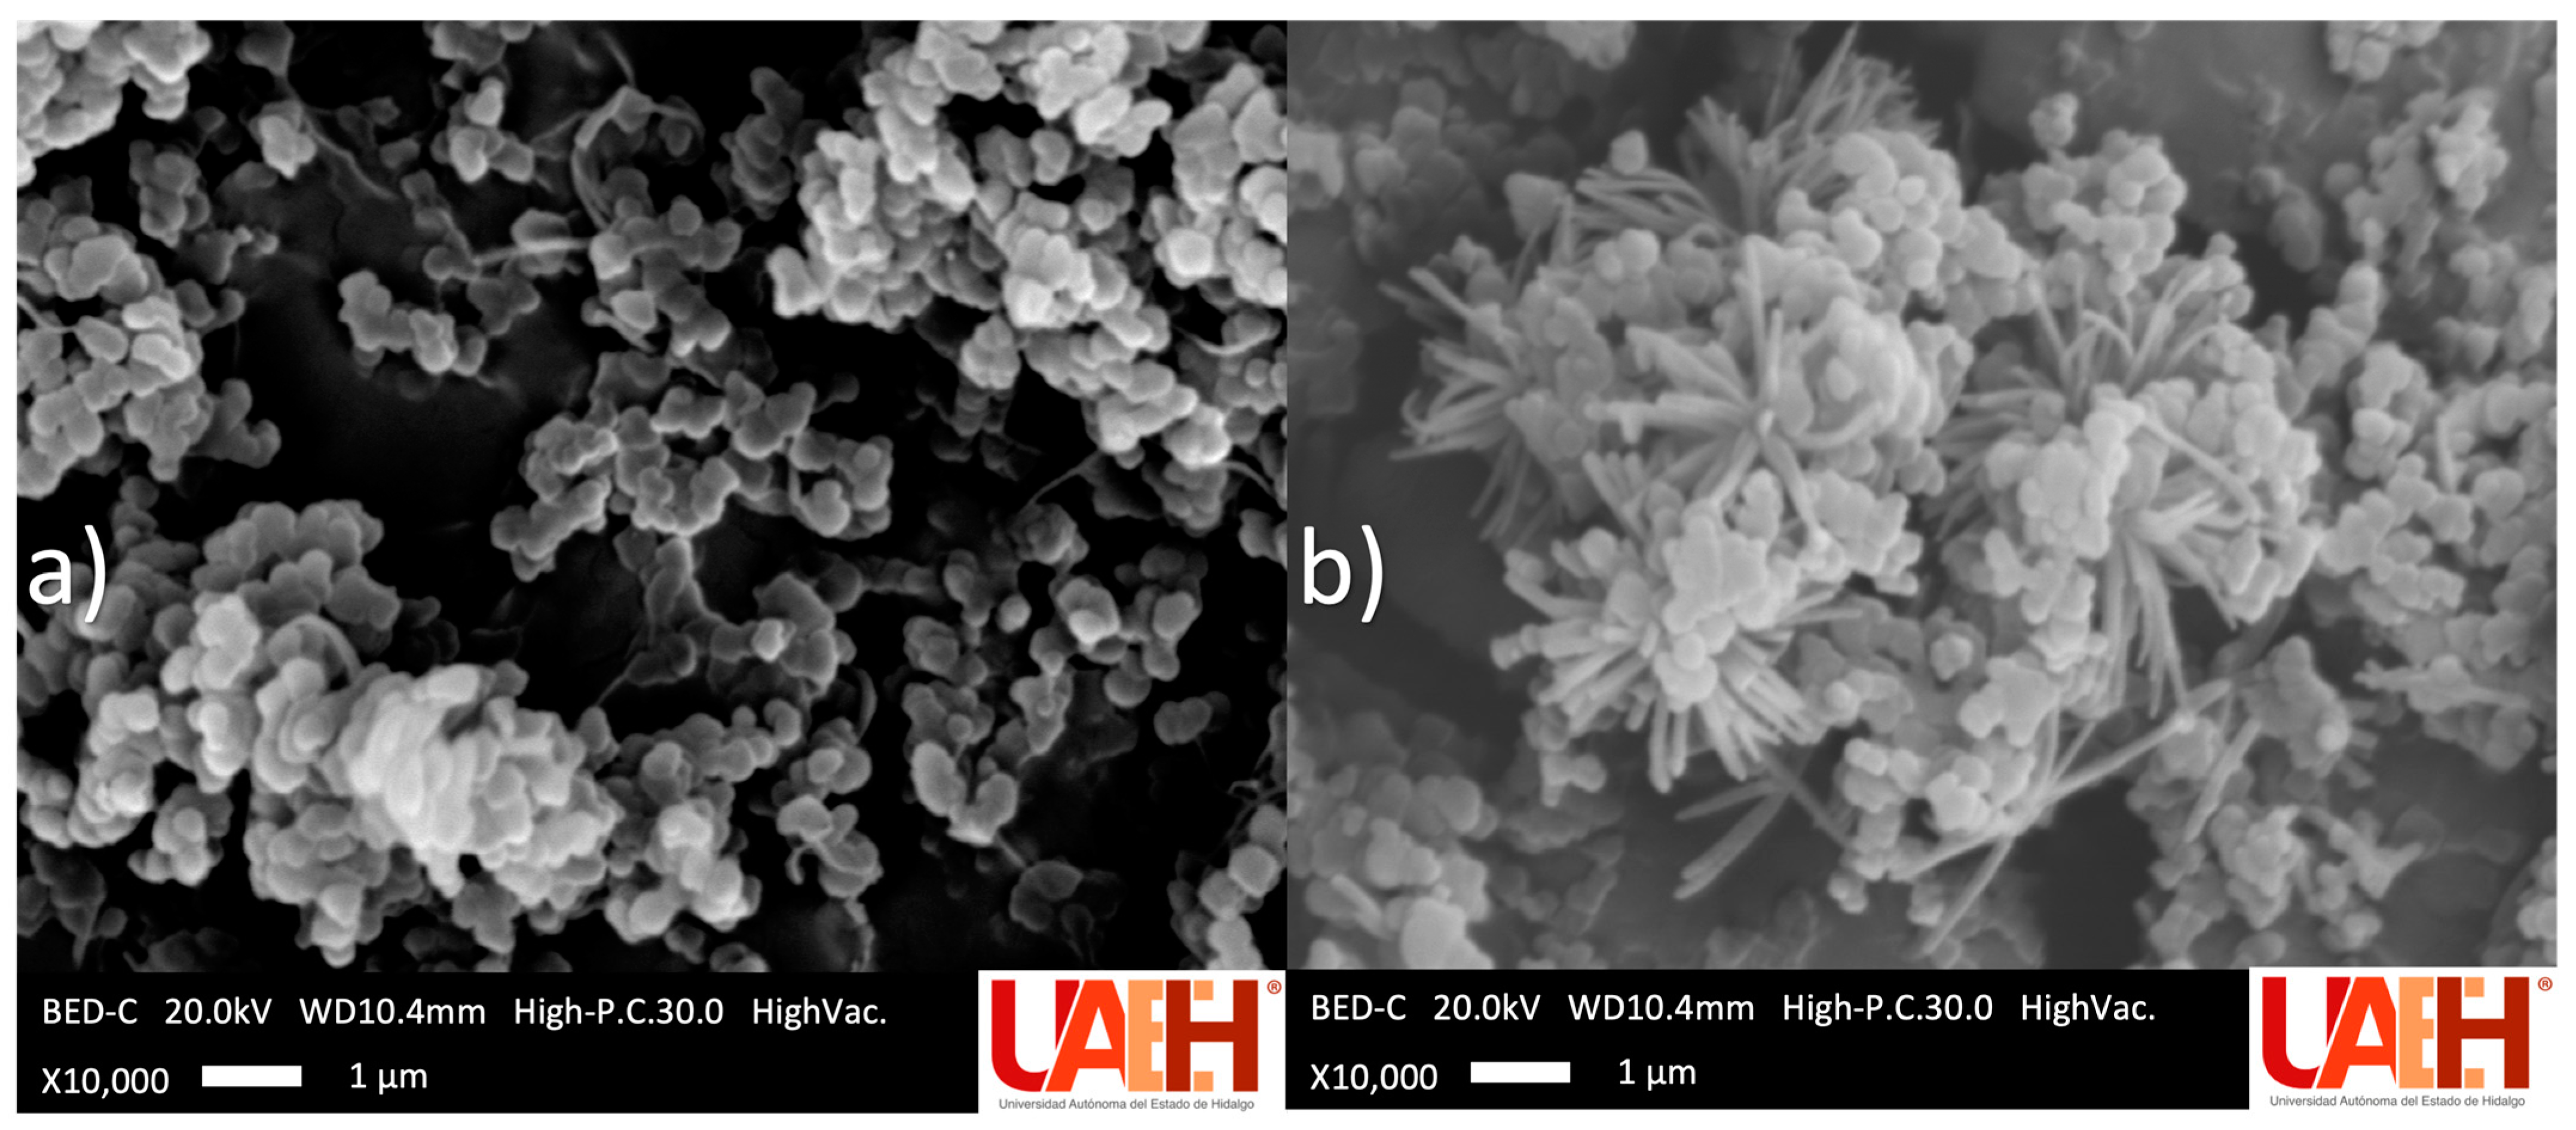
SEM micrographs of the optimal mt-MIP and NIP are shown in Figure 3. In both polymerization processes, solids with a rough surface were obtained. Nevertheless, clear morphological differences were observed: the mt-MIP exhibits a uniform semi-spherical morphology, whereas the NIP displays an irregular flower-like or dendritic morphology, characterized by a dense central core from which numerous thin, needle-like protrusions radiate outward. These differences are attributed to the pre-polymerization stage during mt-MIP synthesis [22,36].
The Langmuir model (Equations (3) and (4)) describes the adsorption process on solid surfaces under the following considerations: (1) molecules are adsorbed in a monolayer, (2) all the active sites have the same probability of being occupied, and (3) there is no interaction between the adsorbed molecules [37]. The Langmuir model was used to determine the maximum saturation capacity (Qmax) and to assess the feasibility of the adsorption process through the RL parameter: if 0 < RL < 1, the adsorption process is favorable; if RL > 1, the adsorption process is not feasible; and finally, if RL = 0, the adsorption process is irreversible [36].
1 Q e = 1 Q m a x K L C e + 1 Q m a x
R L = 1 1 + K L C 0
The Dubinin–Radushkevich model (Equations (5)–(7)) is used to determine the adsorption mechanism on homogeneous and heterogeneous solid surfaces. The constant β represents the free energy associated with the adsorption process, ε is the Polanyi potential, R denotes the gas constant (8.314 J mol−1 K−1), and T is the absolute temperature of the system. Based on the obtained energy values, it is possible to classify the adsorption process: physical adsorption if E < 8 kJ mol−1 and chemical adsorption if 8 < E < 16 kJ mol−1 (37).
L n Q e = L n Q m β ε 2
ε = R T L n ( 1 + 1 C e )
E = 1 2 β
Table 3 summarizes the obtained results; the theoretical saturation capacity was between 2.71 and 5.73 mg g−1, and the RL values from 0.17 to 0.67 confirm the feasibility of the adsorption process. The Dubinin–Radushkevich model shows that the adsorption process is a chemical one, based on the energy values we found (8.33 to 14.43 kJ mol−1). In all cases, the experimental data fit both models with determination coefficients r2 > 0.96 in all cases.

3.3. pH Effect on Adsorption Efficiency

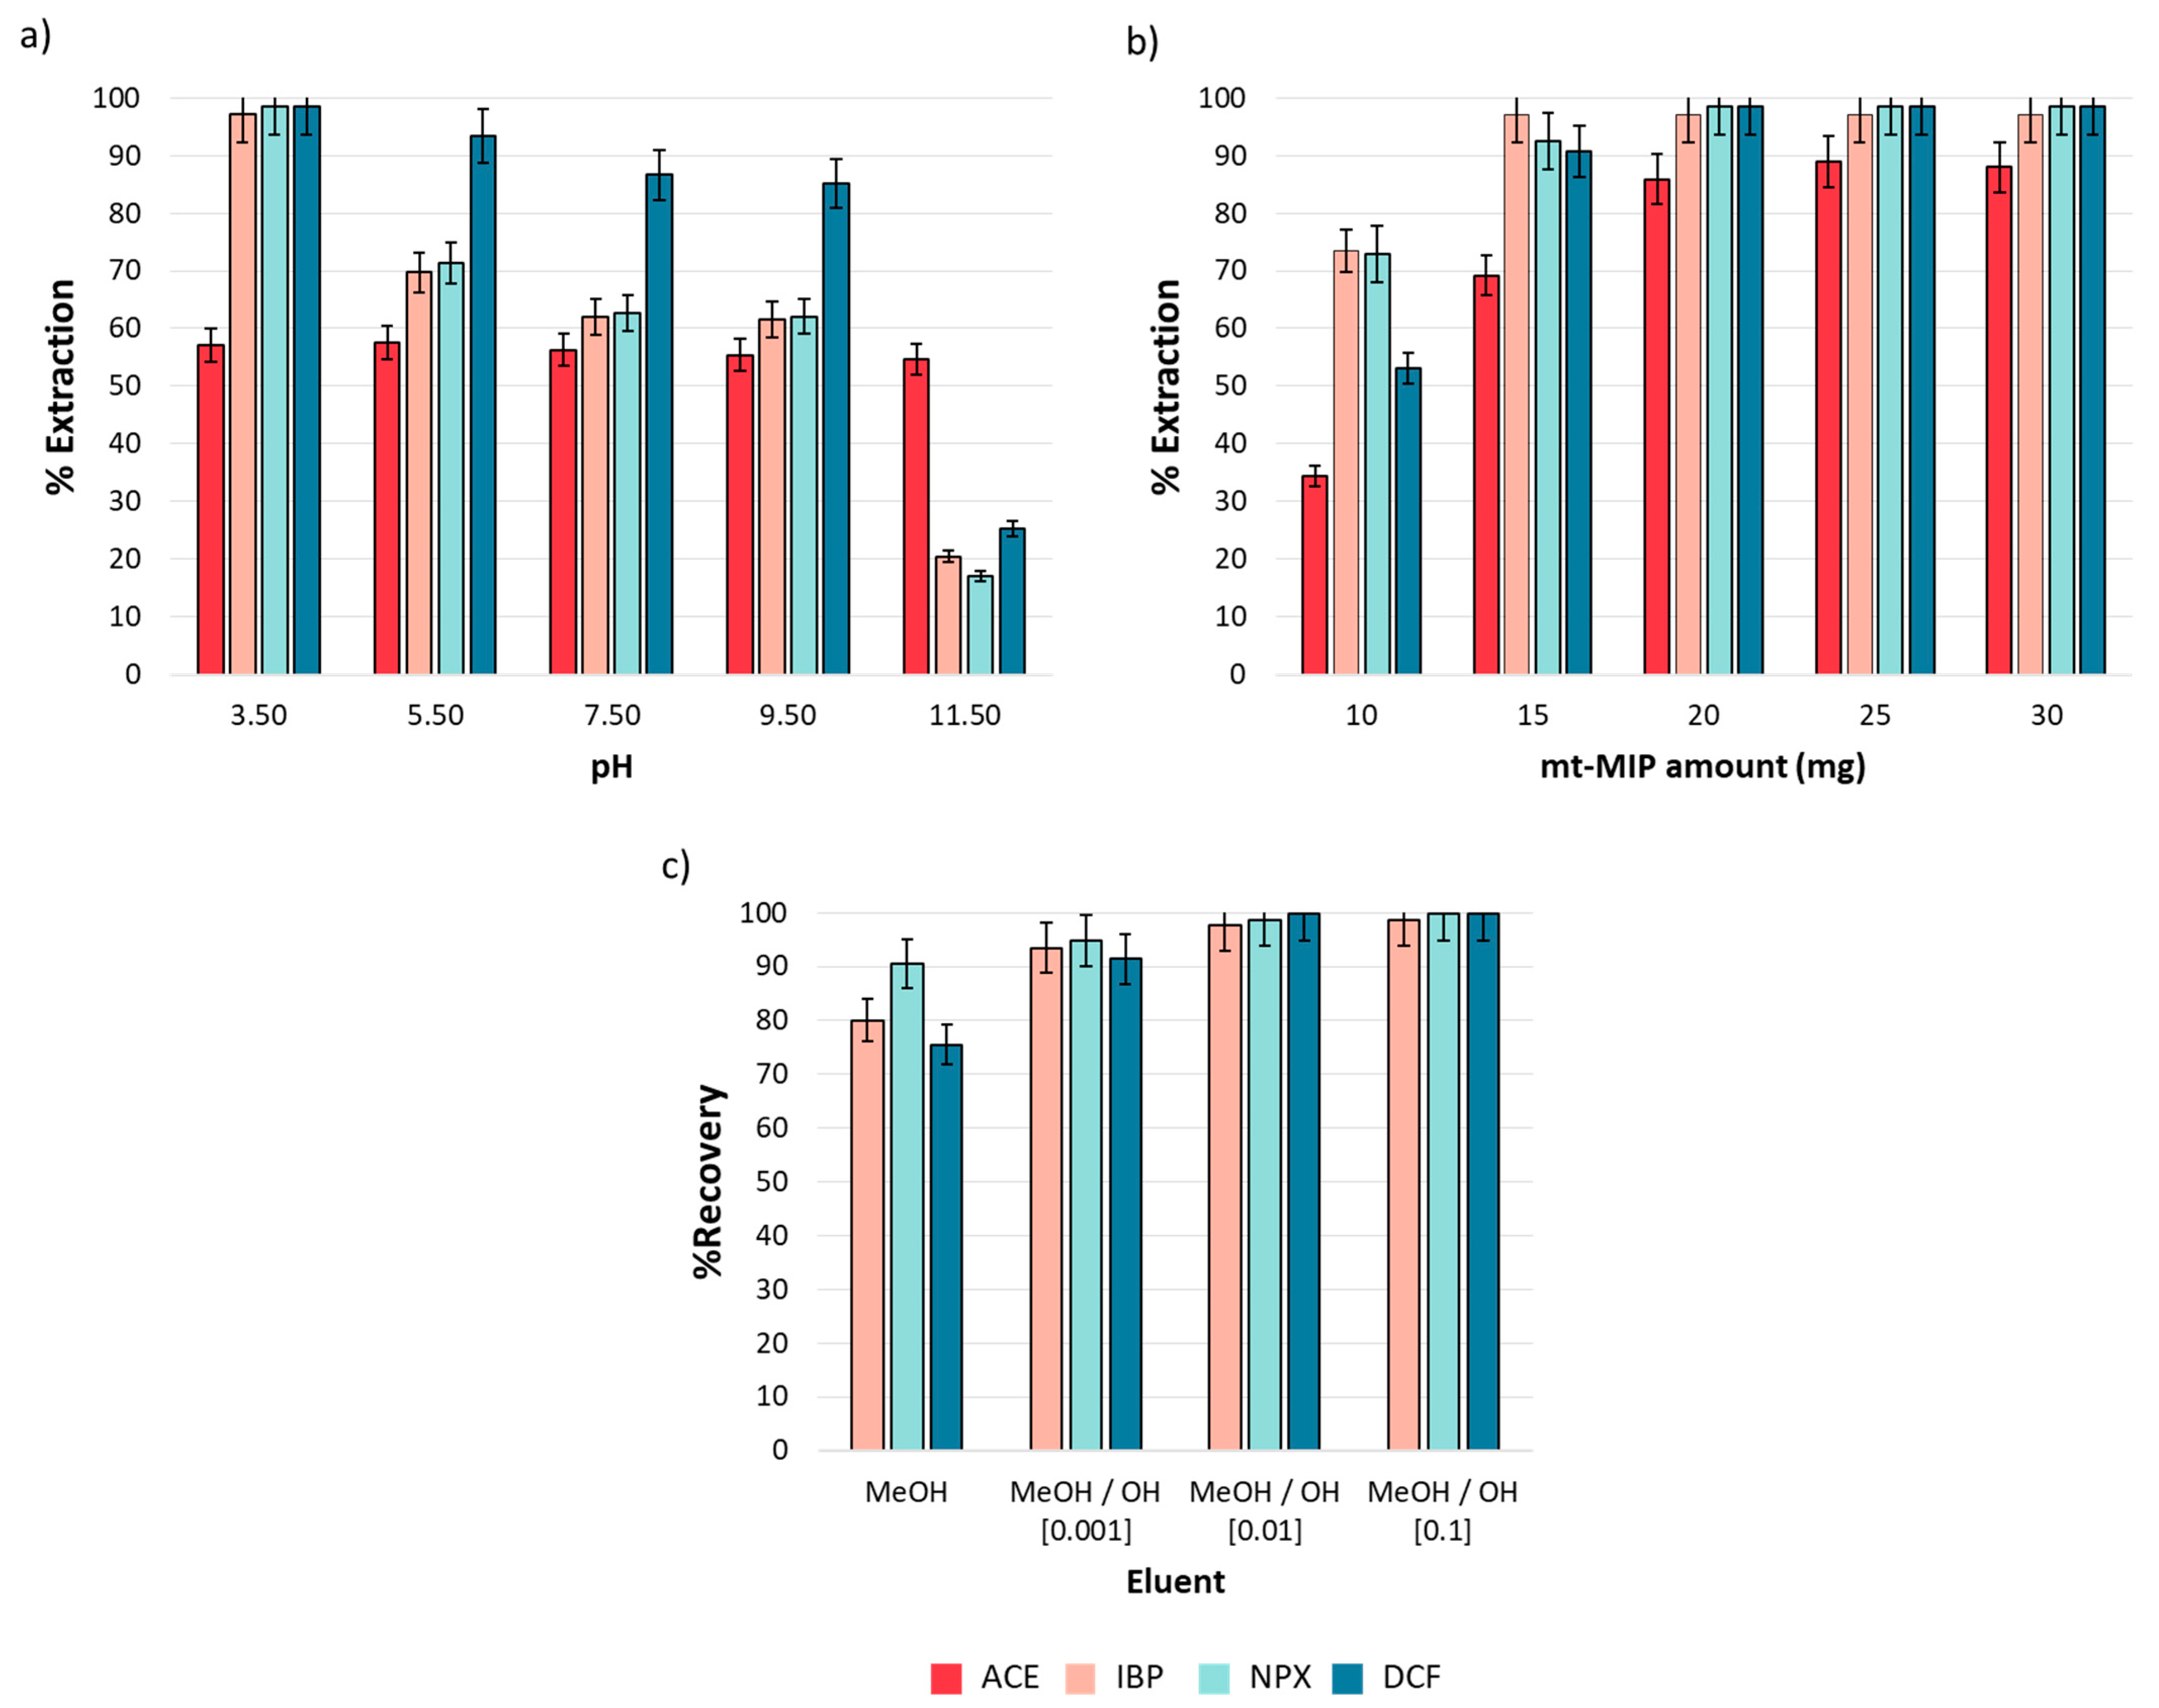
The pH effect is a critical variable in the extraction process, as it influences the net charge of both analytes and adsorbents. The analytes and functional monomers in this study present acid–base properties due to the functional groups in their structures; carboxylic acid groups are present in IBP, NPX, DCF, and MAA, with pKa values of 4.4, 4.2, 4.0, and 4.5, respectively [38]. In contrast, ACE contains a phenolic group with a pKa of 9.5. Then, for pH values below pKa, these compounds remain neutral, whereas at pH values over their pKa, they acquire a net negative charge. Conversely, the acid–base properties of 4VP are due to the amine group in its structure. At pH values below its pKa, 4VP presents a net positive charge, while at pH values over its pKa, it becomes neutral. The pH effect on the extraction performance was evaluated from 3.5 to 11.5, as described in Section 2.5. Figure 4a shows the obtained results. It was observed that the extraction efficiency is strongly influenced by pH. For IBP, NPX, and DCF, a drastic decrease in extraction efficiency from 98.50 to 17.03% (n = 3, %RSD < 5%) was observed as the medium became more basic. This phenomenon is attributed to the electrostatic repulsion between the conjugate bases of both the analytes and functional monomers in the mt-MIP. The case of ACE is different; a homogeneous extraction efficiency (57.13%, n = 3, %RSD < 5%) was observed in all pH ranges. This behavior could be explained by the phenolic group in its structure, which can stabilize the negative charge via resonance in the aromatic ring, which minimizes the electrostatic repulsion with the conjugated base of the functional monomers in mt-MIP. It was concluded that hydrophobic interactions, predominant in acidic media, primarily govern the extraction process [39]. Consequently, we selected pH = 3.5 as the optimal value for our subsequent studies.

3.4. Optimization of SPE Process

3.4.1. mt-MIP Dosage Effect

The mt-MIP amount determines the availability of the active sites in the system. Therefore, the effects of the mt-MIP amount on the extraction performance were investigated from 10.0 to 30.0 mg. The results are shown in Figure 4b. It was observed that equilibrium was reached since 20 mg provided extraction percentages from 85.87 to 98.50% (n = 3, %RSD < 5%), and no significant differences were observed for the higher mt-MIP amounts evaluated. Therefore, to reduce the mt-MIP amount employed, 20 mg was selected as the optimal value for subsequent studies.

3.4.2. Eluent Composition

To evaluate the mt-MIP potential in the pre-concentration of NSAIDs, elution tests were conducted. Elution performance was evaluated through absolute recovery using an NSAID standard solution and methanolic alkaline solutions as the eluent at three concentration levels. The results shown in Figure 4c indicate that absolute recoveries over 97.67% (n = 3, %RSD < 5%) were achieved when a MeOH/NaOH (0.01 M) solution was used as the eluent; therefore, this eluent was selected as the optimal one for the SPE process.
During the elution test, it was observed that after completing ACE adsorption, the elution process was not quantitative. This could be attributed to the pH adsorption behavior. As shown in Figure 4a, the extraction efficiency remained almost constant in the entire pH range, despite the presence of a negative net charge in ACE and functional monomers. Consequently, only IBP, NPX, and DCF are suitable for pre-concentration.
As a result of this stage, it was found that the optimal SPE conditions are pH = 3.5 and 20 mg of mt-MIP, and the optimal eluent is MeOH/NaOH (0.01 M).

3.5. Analytical Parameters

Under the optimal conditions concerning mt-MIP composition and the proposed SPE method, 50 mL of water samples was treated, and the analytical parameters were determined. The obtained peak areas were measured, and the respective calibration curves were constructed from the peak area ratios (analyte–internal standard). The data show a linear dependence for the IBP, NPX, and DCF concentrations. Table 4 displays the analytical parameters for mt-MIP-SPE-CE. The limits of detection (LODs) were calculated as a 3.29 signal-to-noise ratio according to IUPAC recommendations [40]. Under the optimal conditions, the proposed method provides LODs from 3.00 to 12.00 µg L−1. The precision of the proposed method was evaluated in terms of the intra- and inter-day repeatability of the peak area ratio (analyte–internal standard). The relative standard deviation (% RSD) of two concentrations (50.00–100.00 µg L−1) was used to determine the results. Based on the obtained results, the precision of both methodologies provides %RSD < 10.00% in all the cases (Table 4).

3.6. Interferent Analysis

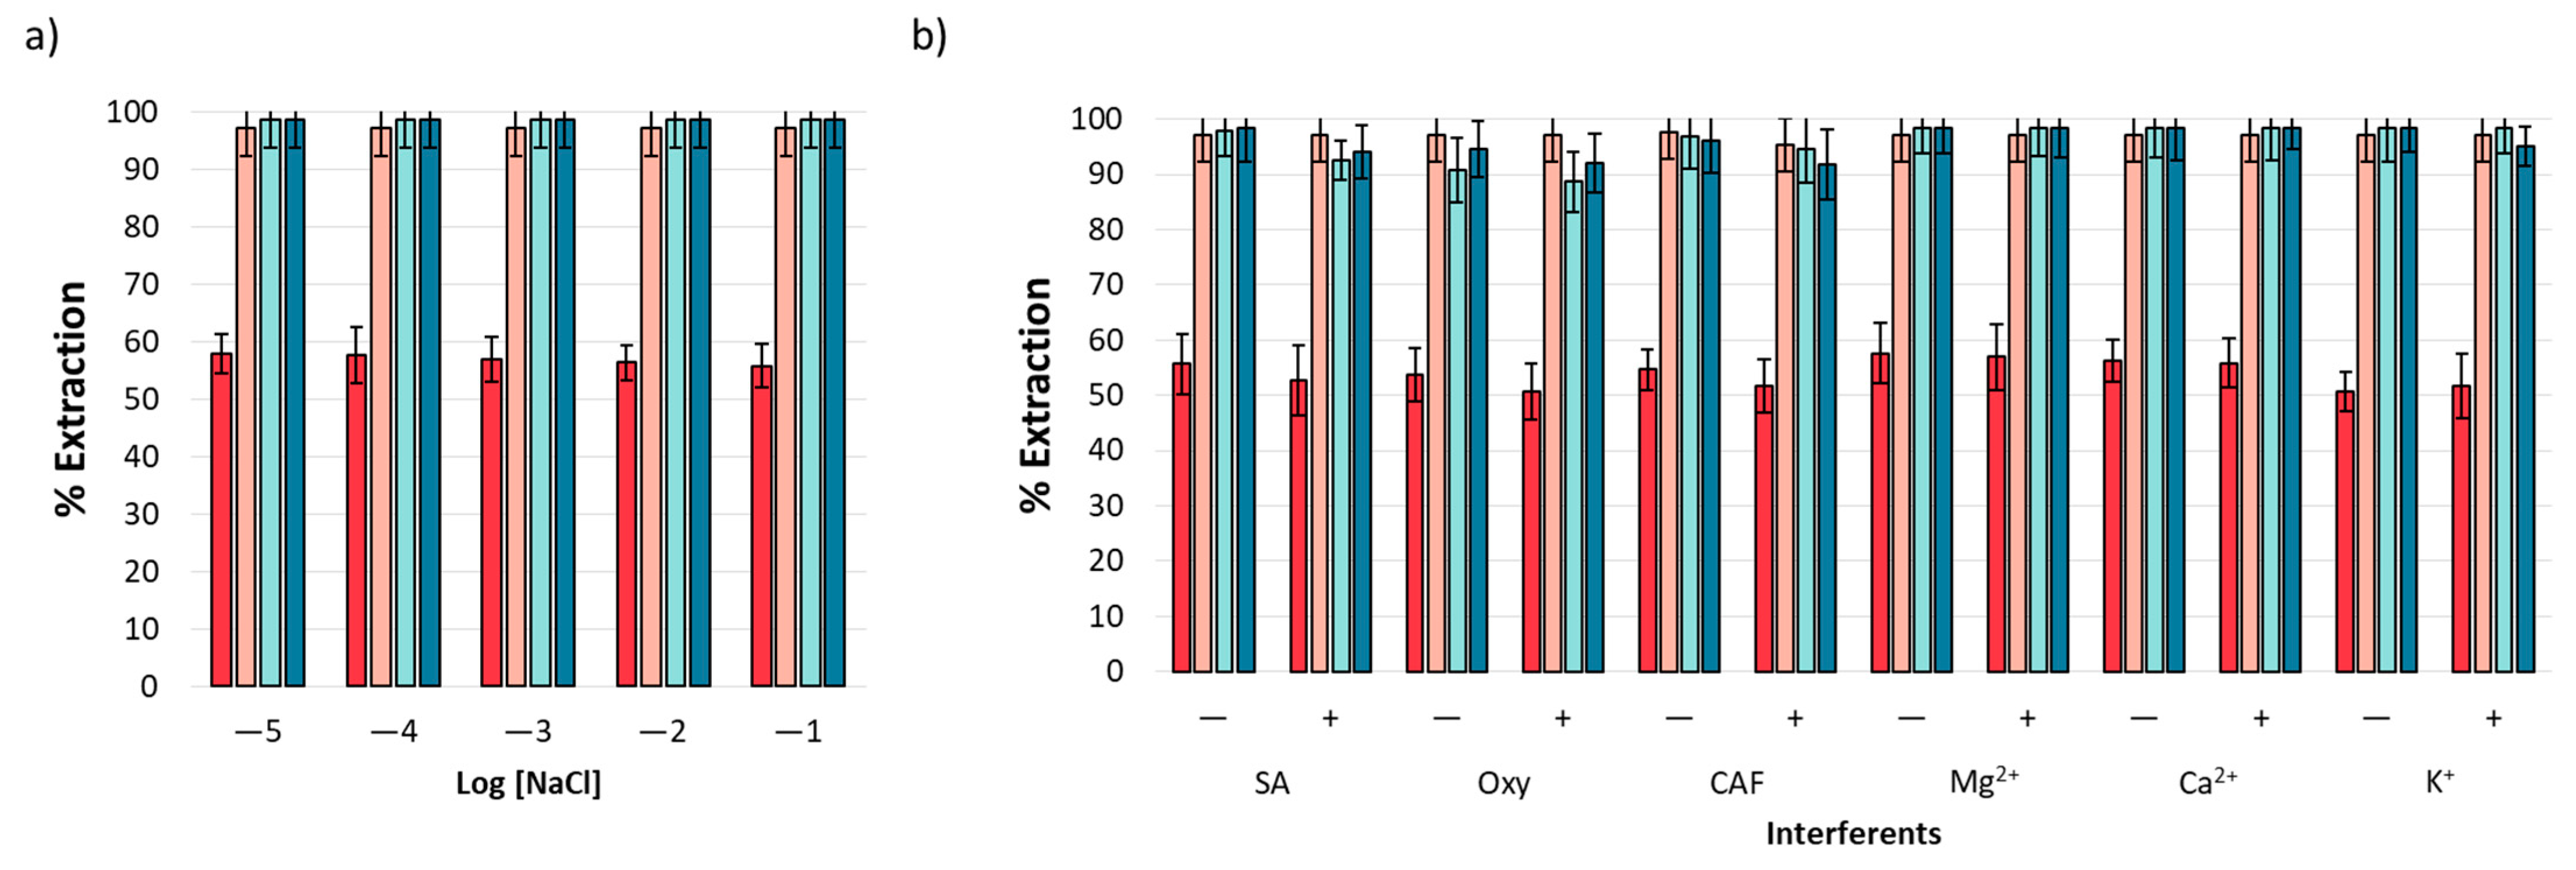
Based on the nature of the analytical matrix, it is necessary to evaluate the effect of ionic strength on extraction performance. This effect was evaluated using a standard solution of NSAIDs in the presence of NaCl with a concentration range from 1 × 10⁻⁵ to 1 × 10⁻¹ M. Figure 5a displays the obtained results, revealing a homogenous extraction performance unaffected by the presence of NaCl. The result is indicative of this method’s applicability in environmental water samples, according to the expected ion content [41].
The extraction performance of ACE, IBP, NPX, and DCF was evaluated in the presence of both organic (caffeine (CAF)), oxytetracycline (Oxy), and salicylic acid (SA)) and inorganic (Ca2+, Mg2+, and K+) interferents that may coexist with NSAIDs in environmental water samples [42,43,44]. The experiments were performed at two concentration levels (10 (−) and 20 mg L−1 (+)). The results are shown in Figure 5b, and it was observed that mt-MIP exhibits high affinity toward analytes even under high interferent concentrations, providing extraction percentages from 50.71 to 98.50 (n = 3, %RSD < 5%).

3.7. Real Sample Analysis

The developed method was applied in NSAID determination in ten water samples, including bottle, tap, spring, well, and river water, collected around Hidalgo State, Mexico. However, no positive samples for NSAIDs were found. This may be attributed to several factors, including dilution effects, low regional NSAID discharge, or the absence of cross-contamination in the studied area.
To demonstrate the applicability of the developed method, water samples were spiked at two concentration levels (50 and 75 µg L−1 of each NSAID) and were analyzed in triplicate. According to the results, recovery rates over 95.52% with a %RSD less than 10.00% were obtained in all cases. The results are summarized in Table 5.
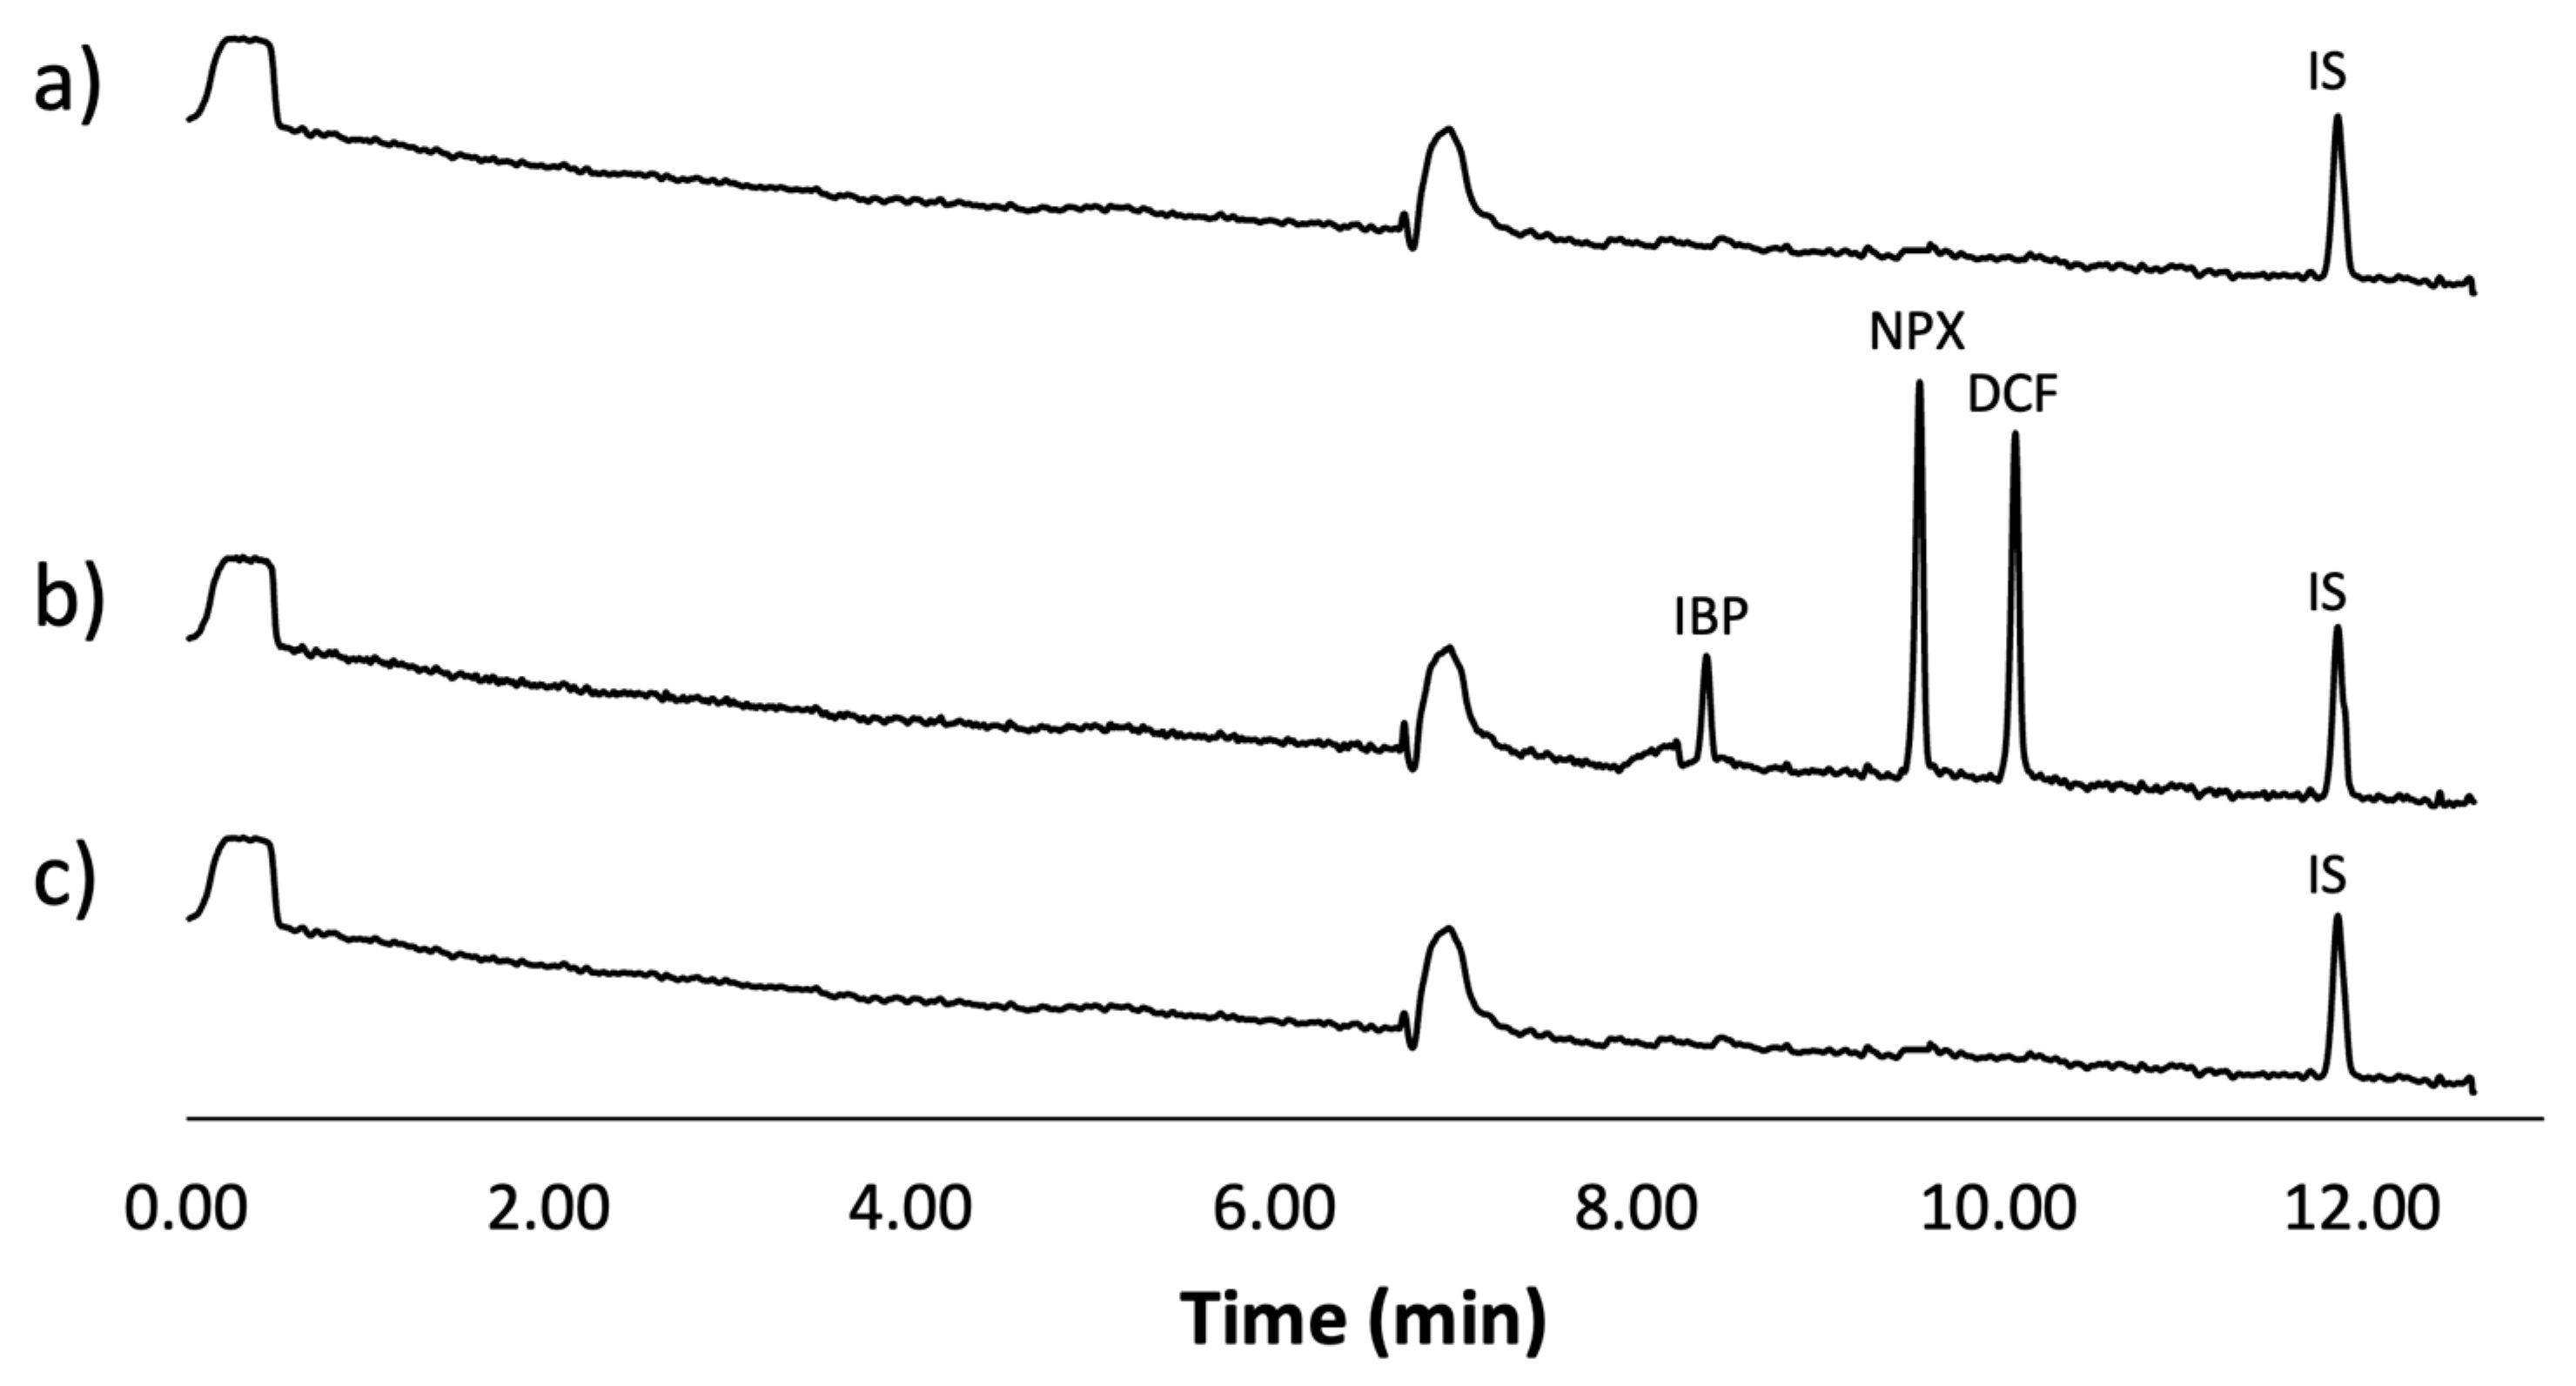
Figure 6 displays the obtained electropherograms. Figure 6a shows the results for a tap water sample, Figure 6b shows the analysis of the tap water sample spiked with the analytes and IS, and finally, Figure 6c shows the analysis of the spiked sample after being treated using the optimal conditions of the mt-MIP-SPE.

3.8. Comparison of Proposed SPE Method

The proposed mt-MIP-CE method was compared with previous pre-concentration methods reported in the literature. Table 6 summarizes some information. The developed method provides competitive LODs; additionally, in most cases, sample treatments, very time- and reagent-consuming derivatization procedures, expensive instrumentation, and larger sample volume were necessary. The proposed pre-concentration method has a low cost and solvent consumption, and it can therefore be considered environmentally friendly and is suitable for NSAID determination in complex matrices.

4. Conclusions

The implementation of MAA and 4VP as functional monomers in the development of a selective mt-MIP provides an alternative method for the determination of NSAIDs in environmental water samples. The optimal mt-MIP composition was determined using a second-order simplex lattice experiment and consisted of 0.025 mmol of each NSAID, 2.40 mmol of MAA, 3.60 mmol of 4VP, and 23.00 mmol of EGDMA. The mt-MIP exhibited a higher recognition capacity compared to the NIP, with extraction percentages ranging from 85.87% to 98.50% and 0.21% to 10.02%, respectively. The imprinted material showed high selectivity in the presence of CAF, Oxy, SA, Ca2+, Mg2+, and K+ with a selective extraction of NSAIDs. The proposed method demonstrated robustness with satisfactory results in terms of selectivity, recovery, accuracy, and precision in the determination of NSAIDs, with a relative standard deviation below 10.0% in all cases. Under optimal conditions, the methodology provides competitive LODs (3.00 to 12.00 µg L−1), comparable to or better than those reported in the literature, and can be successfully applied to the analysis of real water samples. The proposed methodology using mt-MIP in solid-phase extraction can be suitable for the NSAID remediation process in future studies.

Author Contributions

Conceptualization, I.S.I. and G.I.; methodology, D.A.-S.; software, M.F.-G.; validation, I.S.I., G.I. and G.A.A.-R.; formal analysis, M.E.P.-H.; investigation, D.A.-S.; resources, I.S.I.; data curation, I.P.-S. and M.E.P.-H.; writing—review draft preparation, I.S.I.; writing—review and editing, G.I.; visualization, M.F.-G., I.P.-S. and M.E.P.-H.; supervision, I.S.I. and G.I.; project administration, I.S.I. and G.I.; funding acquisition, I.S.I., G.I. and G.A.A.-R. All authors have read and agreed to the published version of the manuscript.

Funding

This research was supported by Secretaría de Ciencia, Humanidades, Tecnología e Innovación (SECIHTI).

Data Availability Statement

Data are contained within this manuscript.

Acknowledgments

The P.H.D and postdoctoral scholarships granted to D.A.-S. and G.I. by Secretaría de Ciencia, Humanidades, Tecnología e Innovación (SECIHTI), were invaluable in supporting this research. Additionally, we extend our gratitude to the Sistema Nacional de Investigadores e investigadoras (SNII) for the support given to G.A.A.-R., M.E.P.-H., I.P.S., M.F.G., G.I., and I.S.I.

Conflicts of Interest

The authors declare no conflicts of interest.

References

  1. Rivera-Utrilla, J.; Sánchez-Polo, M.; Ferro-García, M.Á.; Prados-Joya, G.; Ocampo-Pérez, R. Pharmaceuticals as emerging contaminants and their removal from water. A review. Chemosphere 2013, 93, 1268–1287. [Google Scholar] [CrossRef]
  2. Białk-Bielińska, A.; Kumirska, J.; Borecka, M.; Caban, M.; Paszkiewicz, M.; Pazdro, K.; Stepnowski, P. Selected analytical challenges in the determination of pharmaceuticals in drinking/marine waters and soil/sediment samples. J. Pharm. Biomed. Anal. 2016, 121, 271–296. [Google Scholar] [CrossRef] [PubMed]
  3. Chaturvedi, P.; Shukla, P.; Giri, B.S.; Chowdhary, P.; Chandra, R.; Gupta, P.; Pandey, A. Prevalence and hazardous impact of pharmaceutical and personal care products and antibiotics in environment: A review on emerging contaminants. Environ. Res. 2021, 194, 110664–110685. [Google Scholar] [CrossRef] [PubMed]
  4. Valdez-Carrillo, M.; Abrell, L.; Ramírez-Hernández, J.; Reyes-López, J.A.; Carreón-Diazconti, C. Pharmaceuticals as emerging contaminants in the aquatic environment of Latin America: A review. Environ. Sci. Pollut. Res. 2020, 27, 44863–44891. [Google Scholar] [CrossRef]
  5. Bruno, A.; Tacconelli, S.; Contursi, A.; Ballerini, P.; Patrignani, P. Cyclooxygenases and platelet functions. Adv. Pharmacol. 2023, 97, 133–165. [Google Scholar] [CrossRef] [PubMed]
  6. Farré, M.; Petrovic, M.; Barceló, D. Recently developed GC/MS and LC/MS methods for determining NSAIDs in water samples. Anal. Bioanal. Chem. 2007, 387, 1203–1214. [Google Scholar] [CrossRef]
  7. Zhou, Y.; Lin, J.Y.; Bian, Y.; Ren, C.J.; Xiao-Li, N.; Yang, C.Y.; Feng, X.S. Non-steroidal anti-inflammatory drugs (NSAIDs) in the environment: Updates on pretreatment and determination methods. Ecotoxicol. Environ. Saf. 2023, 267, 115624. [Google Scholar] [CrossRef]
  8. Petrie, B.; Camacho-Muñoz, D. Analysis, fate and toxicity of chiral non-steroidal anti-inflammatory drugs in wastewaters and the environment: A review. Environ. Chem. Lett. 2021, 19, 43–75. [Google Scholar] [CrossRef]
  9. Tanwar, S.; Di Carro, M.; Magi, E. Innovative sampling and extraction methods for the determination of nonsteroidal anti-inflammatory drugs in water. J. Pharm. Biomed. Anal. 2015, 106, 100–106. [Google Scholar] [CrossRef]
  10. Martinez-Sena, T.; Armenta, S.; De la Guardia, M.; Esteve-Turrillas, F.A. Determination of non-steroidal anti-inflammatory drugs in water and urine using selective molecular imprinted polymer extraction and liquid chromatography. J. Pharm. Biomed. Anal. 2016, 131, 48–53. [Google Scholar] [CrossRef]
  11. Paíga, P.; Lolić, A.; Hellebuyck, F.; Santos, L.H.; Correia, M.; Delerue-Matos, C. Development of a SPE-UHPLC-MS/MS methodology for the determination of non-steroidal anti-inflammatory and analgesic pharmaceuticals in seawater. J. Pharm. Biomed. Anal. 2015, 106, 61–70. [Google Scholar] [CrossRef] [PubMed]
  12. Hung, C.M.; Huang, C.P.; Chen, S.K.; Chen, C.W.; Dong, C.D. Electrochemical analysis of naproxen in water using poly (L-serine)-modified glassy carbon electrode. Chemosphere 2020, 254, 126686–126694. [Google Scholar] [CrossRef]
  13. Kovacs, E.D.; Silaghi-Dumitrescu, L.; Kovacs, M.H.; Roman, C. Determination of the uptake of ibuprofen, ketoprofen, and diclofenac by tomatoes, radishes, and lettuce by gas chromatography–mass spectrometry (GC-MS). Anal. Lett. 2021, 54, 314–330. [Google Scholar] [CrossRef]
  14. Mynul Hassan, M.; Nam, S.W. High-performance liquid chromatography for determining a mixture of nonsteroidal anti-inflammatory drugs. Electron. Mater. Lett. 2021, 17, 414–420. [Google Scholar] [CrossRef]
  15. Othman, W.M.; Al-Zoman, N.Z.; Darwish, I.A.; Almomen, A.; Saad, S.S.; Abdallah, F.F.; Farid, N.F. Development of an eco-friendly capillary electrophoresis method for the simultaneous determination of piperacillin, tazobactam and ibuprofen in plasma samples: Application to a pharmacokinetic study in rats. RSC Adv. 2024, 14, 23378–23391. [Google Scholar] [CrossRef]
  16. Jickells, S. Sample Preparation. In Analytical Techniques in Forensic Science; John Wiley & Sons: Hoboken, NJ, USA, 2021; pp. 71–108. [Google Scholar] [CrossRef]
  17. Badawy, M.E.; El-Nouby, M.A.; Kimani, P.K.; Lim, L.W.; Rabea, E.I. A review of the modern principles and applications of solid-phase extraction techniques in chromatographic analysis. Anal. Sci. 2022, 38, 1457–1487. [Google Scholar] [CrossRef]
  18. Wan, Q.; Liu, H.; Deng, Z.; Bu, J.; Li, T.; Yang, Y.; Zhong, S. A critical review of molecularly imprinted solid phase extraction technology. J. Polym. Res. 2021, 28, 401. [Google Scholar] [CrossRef]
  19. Jiang, Q.; Zhang, S.; Sun, M. Recent advances on graphene and graphene oxide as extraction materials in solid-phase (micro) extraction. TrAC. Trends Anal. Chem. 2023, 168, 117283–117301. [Google Scholar] [CrossRef]
  20. Karaket, R.; Khattiya, A.; Lerdpiriyaskulkij, N.; Mathaweesansurn, A.; Detsri, E. Covalent organic frameworks blended cellulose nanocrystal for in-needle syringe solid phase extraction of polycyclic aromatic hydrocarbons in dark roasted coffee. Microchem. J. 2024, 206, 111566–111588. [Google Scholar] [CrossRef]
  21. Wen, A.; Li, G.; Wu, D.; Yu, Y.; Yang, Y.; Hu, N.; Wu, Y. Sulphonate functionalized covalent organic framework-based magnetic sorbent for effective solid phase extraction and determination of fluoroquinolones. J. Chromatogr. A 2020, 1612, 460651–460689. [Google Scholar] [CrossRef]
  22. Aguilar, J.F.; Miranda, J.M.; Rodriguez, J.A.; Paez-Hernandez, M.E.; Ibarra, I.S. Selective removal of tetracycline residue in milk samples using a molecularly imprinted polymer. J. Polym. Res. 2020, 27, 176–188. [Google Scholar] [CrossRef]
  23. Murdaya, N.; Triadenda, A.L.; Rahayu, D.; Hasanah, A.N. A review: Using multiple templates for molecular imprinted polymer: Is it good? Polymers 2022, 14, 4441. [Google Scholar] [CrossRef]
  24. Tlili, A.; Attia, G.; Khaoulani, S.; Mazouz, Z.; Zerrouki, C.; Yaakoubi, N.; Fourati, N. Contribution to the understanding of the interaction between a polydopamine molecular imprint and a protein model: Ionic strength and pH effect investigation. Sensors 2021, 21, 619–632. [Google Scholar] [CrossRef] [PubMed]
  25. Ahmed, S.; Ansari, A.; Li, Z.; Mazumdar, H.; Siddiqui, M.A.; Khan, A.; Kumar, P. Point-of-Care Health Diagnostics and Food Quality Monitoring by Molecularly Imprinted Polymers-Based Histamine Sensors. Adv. Sens. Res. 2025, 4, 2400132–2400157. [Google Scholar] [CrossRef]
  26. Azizi, A.; Shahhoseini, F.; Langille, E.A.; Akhoondi, R.; Bottaro, C.S. Micro-gel thin film molecularly imprinted polymer coating for extraction of organophosphorus pesticides from water and beverage samples. Anal. Chim. Acta 2021, 1187, 339135–339152. [Google Scholar] [CrossRef]
  27. Gerdan, Z.; Saylan, Y.; Uğur, M.; Denizli, A. Ion-imprinted polymer-on-a-sensor for copper detection. Biosensors 2022, 12, 91–105. [Google Scholar] [CrossRef]
  28. Wang, S.; Zhang, L.; Zeng, J.; Hu, X.; Wang, X.; Yu, L.; Zhang, Z. Multi-templates molecularly imprinted polymers for simultaneous recognition of multiple targets: From academy to application. TrAC Trends Anal. Chem. 2023, 166, 117173–117197. [Google Scholar] [CrossRef]
  29. Aurelio-Soria, D.; Canales, X.H.; Vázquez-Garrido, I.; Islas, G.; Álvarez-Romero, G.A.; Ibarra, I.S. Design of Selective Nanoparticles of Layered Double Hydroxide (Mg/Al-LDH) for the Analysis of Anti-Inflammatory Non-Steroidal Agents in Environmental Samples, Coupled with Solid-Phase Extraction and Capillary Electrophoresis. Separations 2024, 11, 259–273. [Google Scholar] [CrossRef]
  30. Cormack, P.A.; Elorza, A.Z. Molecularly imprinted polymers: Synthesis and characterisation. J. Chromatogr. B 2004, 804, 173–182. [Google Scholar] [CrossRef]
  31. Hasanah, A.N.; Safitri, N.; Zulfa, A.; Neli, N.; Rahayu, D. Factors affecting preparation of molecularly imprinted polymer and methods on finding template-monomer interaction as the key of selective properties of the materials. Molecules 2021, 26, 5612–5633. [Google Scholar] [CrossRef]
  32. Mueller, A. A note about crosslinking density in imprinting polymerization. Molecules 2021, 26, 5139–5149. [Google Scholar] [CrossRef]
  33. Sikiti, P.; Msagati, T.A.; Mamba, B.B.; Mishra, A.K. Synthesis and characterization of molecularly imprinted polymers for the remediation of PCBs and dioxins in aqueous environments. J. Environ. Health Sci. Eng. 2014, 12, 82. [Google Scholar] [CrossRef] [PubMed]
  34. Zhang, W.; She, X.; Wang, L.; Fan, H.; Zhou, Q.; Huang, X.; Tang, J.Z. Preparation, characterization and application of a molecularly imprinted polymer for selective recognition of sulpiride. Materials 2017, 10, 475–491. [Google Scholar] [CrossRef]
  35. Nguyen, L.T.; Pham, H.Q.; Nguyen, D.A.S.; Nguyen, L.T.; Huynh, K.P.H.; Le Tran, H.; Mai, P.T.; Nguyen, H.T.; Truong, T.T. 10-(pyren-1-yl)-10h-phenothiazine and pyrene as organic catalysts for photoinitiated ATRP of 4-vinylpyridine. Polímeros 2021, 31, 2021001–2021008. [Google Scholar] [CrossRef]
  36. Flores-Aguilar, J.F.; Islas, G.; Rodríguez, J.A.; Paez-Hernandez, M.E.; Galán-Vidal, C.A.; Ibarra, I.S. Selective Pb (II)-imprinted polymer for solid phase extraction in the trace determination of lead in infant formula by capillary electrophoresis. J. Mex. Chem. Soc. 2022, 66, 221–236. [Google Scholar] [CrossRef]
  37. Dada, A.O.; Lekan, A.P.; Olatunya, A.M.; Dada, O. Langmuir, Freundlich, Temkin and Dubinin-Radushkevich isotherms studies of equilibrium sorption of Zn2+ unto phosphoric acid modified rice husk. J. Appl. Chem. 2012, 3, 38–45. [Google Scholar] [CrossRef]
  38. Yamin, M.; Ghouri, Z.K.; Rohman, N.; Syed, J.A.; Skelton, A.; Ahmed, K. Unravelling pH/pKa influence on pH-responsive drug carriers: Insights from ibuprofen-silica interactions and comparative analysis with carbon nanotubes, sulfasalazine, and alendronate. J. Mol. Graph. Model. 2024, 128, 108720–108736. [Google Scholar] [CrossRef]
  39. Madikizela, L.M.; Chimuka, L. Synthesis, adsorption and selectivity studies of a polymer imprinted with naproxen, ibuprofen and diclofenac. J. Environ. Chem. Eng. 2016, 4, 4029–4037. [Google Scholar] [CrossRef]
  40. Currie, L.A. Nomenclature in evaluation of analytical methods including detection and quantification capabilities (IUPAC Recommendations 1995). Pure Appl. Chem. 1995, 67, 1699–1723. [Google Scholar] [CrossRef]
  41. Burlingame, G.A.; Dietrich, A.M.; Whelton, A.J. Understanding the basics of tap water taste. J. Am. Water Works Assoc. 2007, 99, 100–111. [Google Scholar] [CrossRef]
  42. Akhter, F.; Nag, A.; Alahi, M.E.E.; Liu, H.; Mukhopadhyay, S.C. Electrochemical detection of calcium and magnesium in water bodies. Sens. Actuators A Phys. 2020, 305, 111949–111959. [Google Scholar] [CrossRef]
  43. Costa Junior, I.L.; Machado, C.S.; Pletsch, A.L.; Torres, Y.R. Simultaneous HPLC-PDA determination of commonly prescribed antidepressants and caffeine in sludge from sewage treatment plants and river sediments in the Itaipu reservoir region, Paraná, Brazil. Int. J. Environ. Anal. Chem. 2020, 100, 1004–1020. [Google Scholar] [CrossRef]
  44. McCarthy, B.; Apori, S.O.; Giltrap, M.; Bhat, A.; Curtin, J.; Tian, F. Hospital effluents and wastewater treatment plants: A source of oxytetracycline and antimicrobial-resistant bacteria in seafood. Sustainability 2021, 13, 13967–13989. [Google Scholar] [CrossRef]
  45. Payán, M.R.; López, M.Á.B.; Torres, R.F.; Navarro, M.V.; Mochón, M.C. Electromembrane extraction (EME) and HPLC determination of non-steroidal anti-inflammatory drugs (NSAIDs) in wastewater samples. Talanta 2011, 85, 394–399. [Google Scholar] [CrossRef]
  46. Dahane, S.; Galera, M.M.; Marchionni, M.E.; Viciana, M.S.; Derdour, A.; García, M.G. Mesoporous silica based MCM-41 as solid-phase extraction sorbent combined with micro-liquid chromatography–quadrupole-mass spectrometry for the analysis of pharmaceuticals in waters. Talanta 2016, 152, 378–391. [Google Scholar] [CrossRef]
  47. Toledo-Neira, C.; Álvarez-Lueje, A. Ionic liquids for improving the extraction of NSAIDs in water samples using dispersive liquid–liquid microextraction by high performance liquid chromatography-diode array–fluorescence detection. Talanta 2015, 134, 619–626. [Google Scholar] [CrossRef]
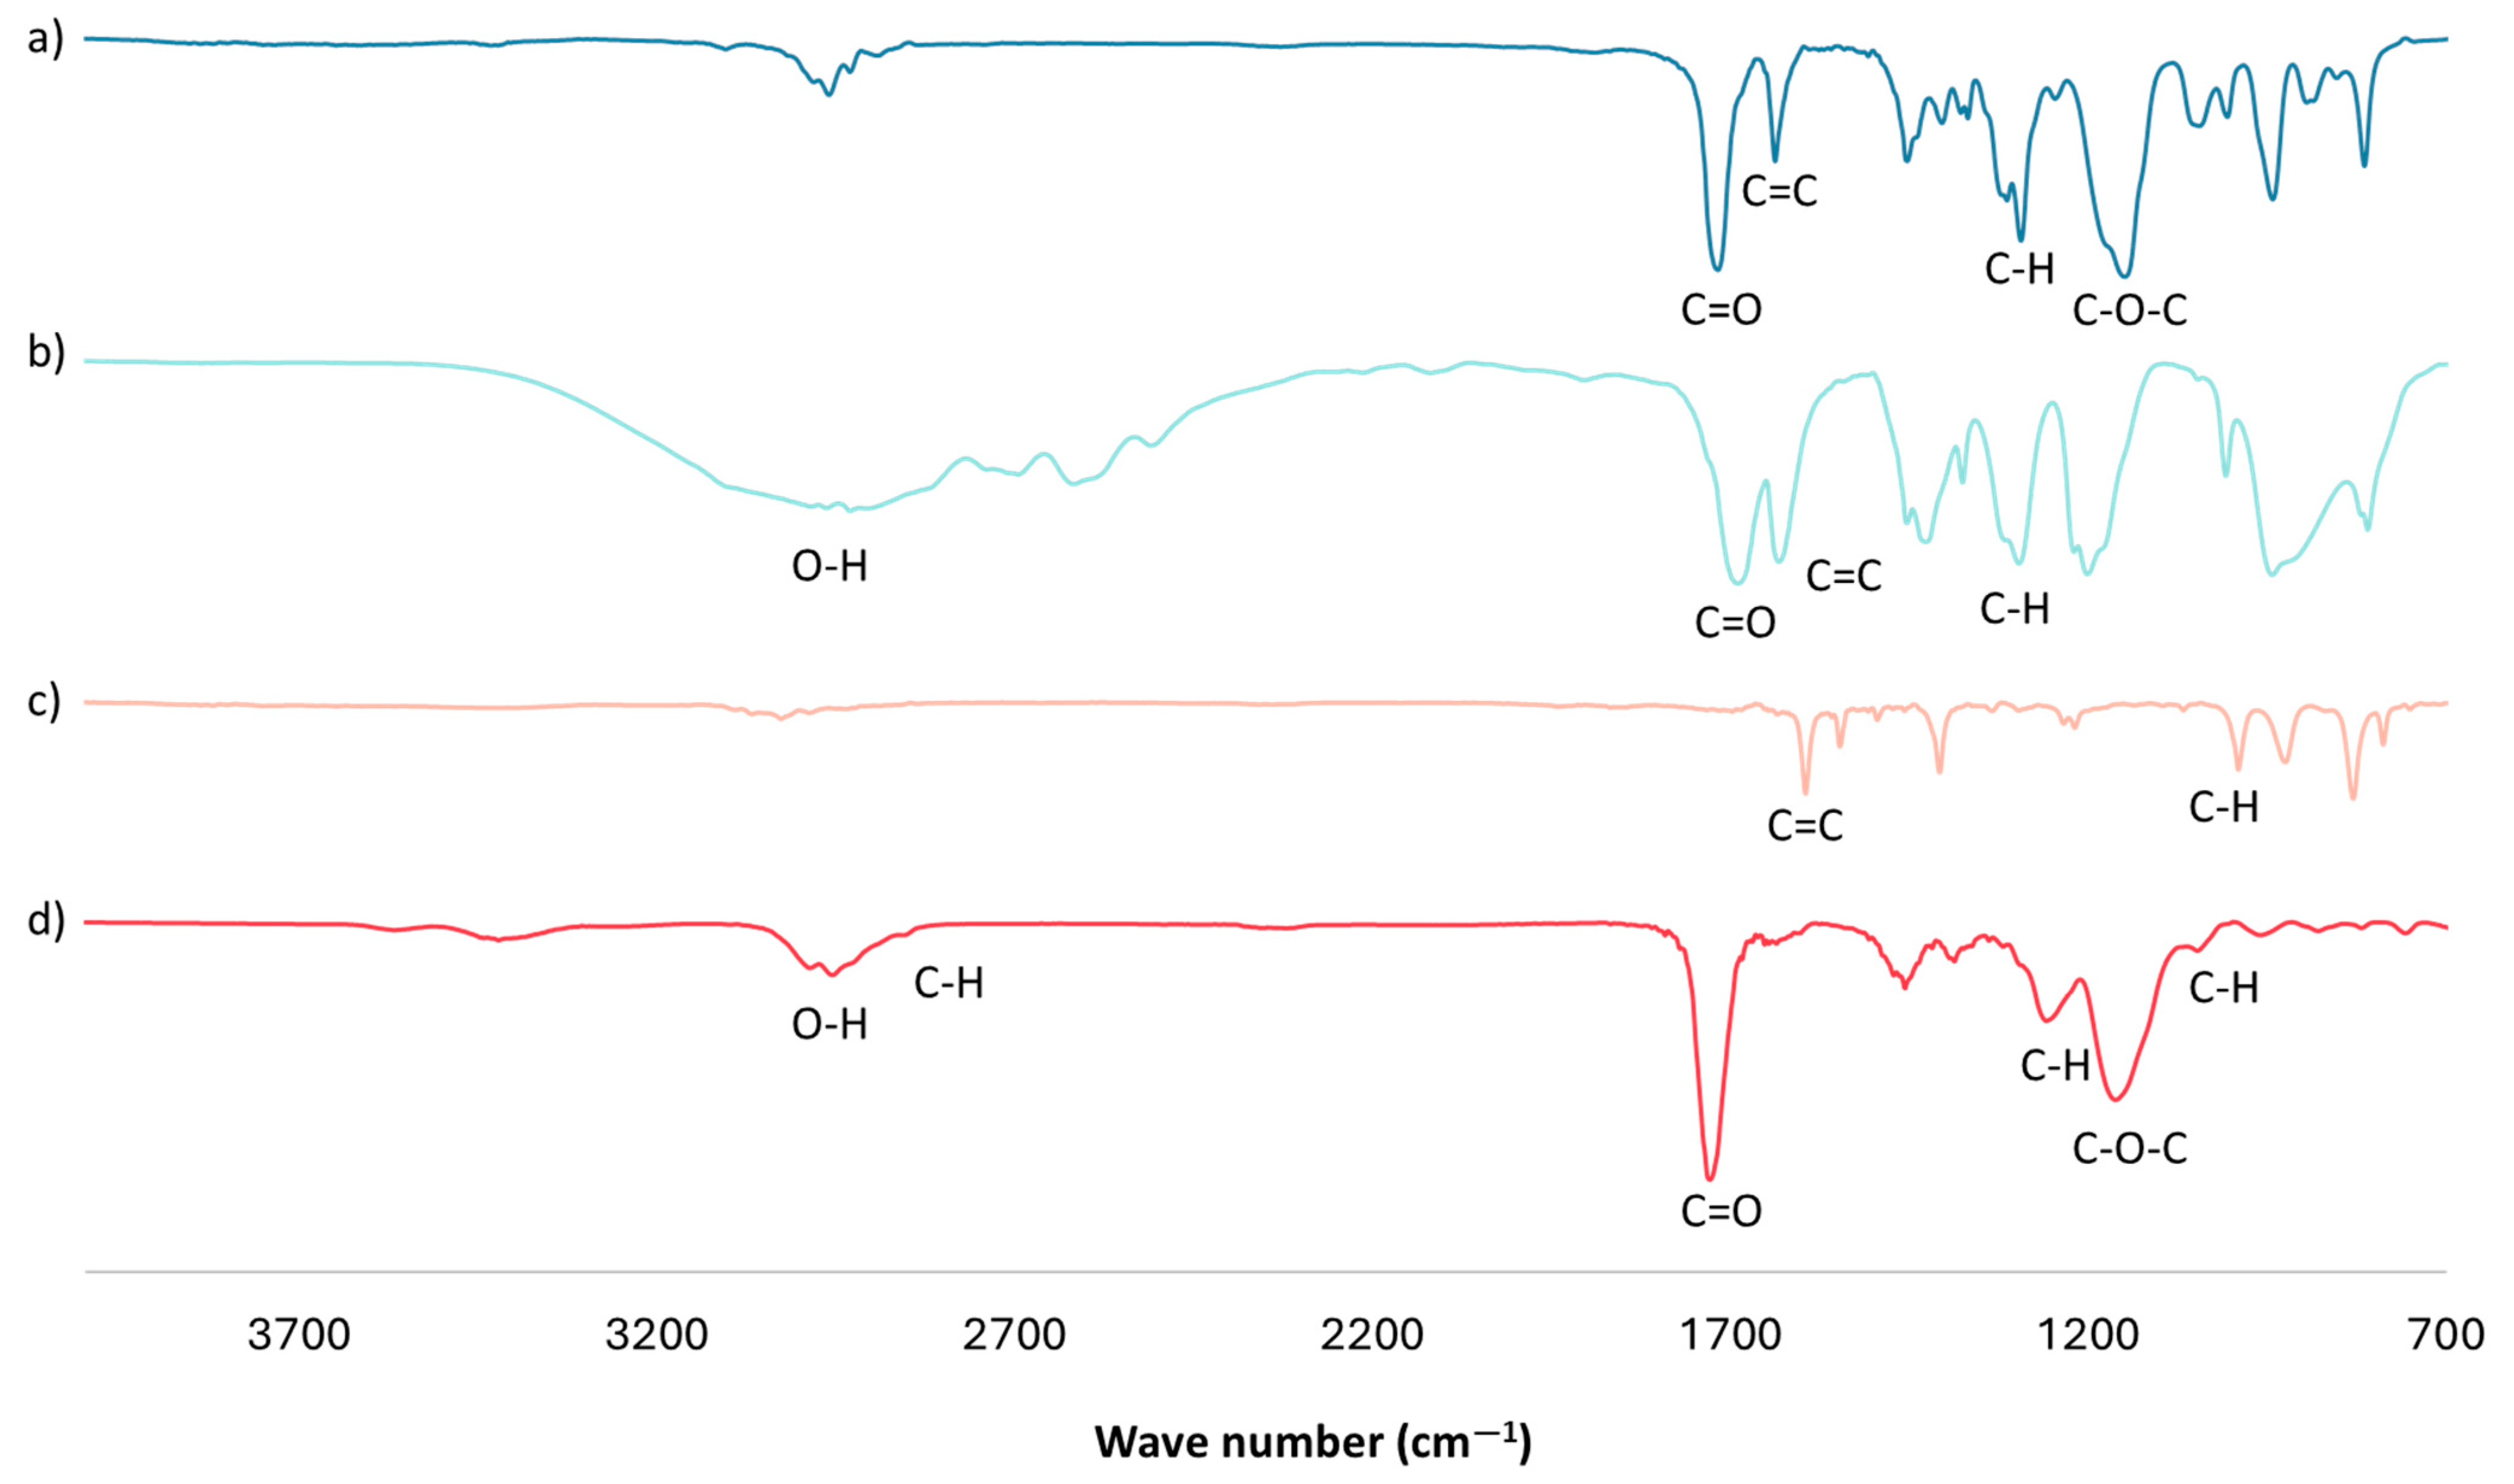
Figure 1. FTIR analysis: (a) EGDMA, (b) MAA, (c) 4VP, and (d) optimal mt-MIP.
Separations 12 00140 g001
Figure 2. TGA of NIP and mt-MIP.
Separations 12 00140 g002
Figure 3. Scanning electron microscope micrographs: (a) optimal mt-MIP and (b) NIP.
Separations 12 00140 g003
Figure 4. One-factor-at-a-time SPE optimization (n = 3): (a) pH effect, (b) mt-MIP amount, and (c) eluent composition. All experiments were performed employing 1.0 mL of NSAID standard solution (20.0 mg L−1).
Separations 12 00140 g004
Figure 5. Interferent analysis: (a) effects of ionic strength and (b) effects of organic and inorganic interferents at two concentration levels, 10 mg L−1 (−) and 20 mg L−1 (+).
Separations 12 00140 g005
Figure 6. Real water sample analysis: (a) tap water sample spiked with IS (500 µg L−1), (b) tap water sample spiked with IS (500 µg L−1) and NSAIDs (50 µg L−1), (c) tap water sample spiked with IS (500 µg L−1) and NSAIDs (50 µg L−1) treated using optimal conditions of mt-MIP-SPE.
Separations 12 00140 g006
Table 1. DoE in optimization of mt-MIP composition.
Coded (Uncoded)%ExtractionOutput Variable
ExpABCACEIBPNPXDCFAverage
10.00 (0.20)0.00 (4.00)1.00 (40.00)38.0097.1598.5098.5083.04
20.50 (0.50)0.00 (4.00)0.50 (30.00)41.0097.1598.5098.5083.79
30.33 (0.40)0.33 (5.33)0.33 (26.66)47.3297.1598.5098.5085.37
40.16 (0.30)0.16 (4.67)0.66 (33.33)46.0097.1598.5098.5085.04
51.00 (0.80)0.00 (4.00)0.00 (20.00)43.0097.1598.5098.5084.29
60.16 (0.30)0.66 (6.66)0.16 (23.33)50.0097.1598.5098.5086.04
70.67 (0.60)0.16 (4.67)0.16 (23.33)52.0097.1598.5098.5086.54
80.50 (0.50)0.50 (6.00)0.00 (20.00)46.0097.1598.5098.5085.04
90.00 (0.20)0.50 (6.00)0.50 (30.00)46.0097.1598.5098.5085.04
100.00 (0.20)1.00 (8.00)0.00 (20.00)46.0097.1598.5098.5085.04
Table 2. ANOVA results from optimization of mt-MIP composition.
SourceD.FADJ SSADJ MSF-Valuep-Value
Model56.261.251.620.33
Linear23.341.191.540.32
Square32.920.971.260.40
A*B10.760.781.010.37
A*C10.440.450.580.49
B*C11.721.722.240.21
Error43.090.77
Total99.35
Table 3. Adsorption parameters for ACE, IBP, NPX, and DCF.
LangmuirDubinin–Radushkevich
Qmax (mg g−1)RLr2E (kJ mol−1)r2
ACE2.710.380.9912.910.98
IBP2.970.390.9911.950.99
NPX5.460.170.9614.430.96
DCF5.730.670.998.331.00
Table 4. Analytical parameters of mt-MIP-SPE-CE method.
IBPNPXDCF
Correlation coefficient, r2 0.99890.99990.9999
Intercept
b0 ± ts(b0) 0.3796 ± 0.12840.4705 ± 0.19290.3558 ± 0.0938
Slope
b1 ± ts(b1) 21.7960 ± 1.119879.4721 ± 2.044252.7654 ± 0.7321
Inter-day repeatability (RSD %, n = 3)50.00 µg L−14.685.786.56
100.00 µg L−13.972.894.83
Intra-day repeatability (RSD %, n = 3)50.00 µg L−18.569.458.12
100.00 µg L−16.136.217.44
Linearity range (µg L−1) 36.00–200.0012.00–150.0010.00–200.00
Limit of detection (µg L−1) 12.004.003.00
Limit of quantification (µg L−1) 36.0012.0010.00
Table 5. NSAID recovery tests in real water samples.
Added (μg L−1)IBP NPXDCF
% Recovery% RSD% Recovery% RSD% Recovery% RSD
0ND-ND-ND-
5097.027.2196.318.0195.527.34
7598.384.3799.635.2497.825.06
Table 6. Comparison of developed method.
MethodAnalytesInstrumentMatrixLOD (μg L−1)REF
DerivatizationIBP, ACE, NPX, and DCFGC-MSHuman serum6–414[45]
EMESAC, KTR, KTP, NPX, DCF, and IBPHPLC-FLDWater0.009–9.0[38]
SPEIPB, NPX, DCF, and KTPμ-LC-MS/MSWater0.23–3.85[46]
DLLMEKTP, IBP, and DCFHPLC-FLCWater17–95[47]
SPEIBP, NPX, and DCFCE-UVWater3–12This work
EME: electromembrane extraction; SAC: salicylic acid; KTR: ketorolac; KTP: ketoprofen; FLD: fluorescence detection; DLLME: dispersive liquid–liquid micro-extraction.
Disclaimer/Publisher’s Note: The statements, opinions and data contained in all publications are solely those of the individual author(s) and contributor(s) and not of MDPI and/or the editor(s). MDPI and/or the editor(s) disclaim responsibility for any injury to people or property resulting from any ideas, methods, instructions or products referred to in the content.