Article

Effects of Hydrolysis Condition and Detection Method on the Monosaccharide Composition Analysis of Polysaccharides from Natural Sources

School of Food Science and Pharmaceutical Engineering, Nanjing Normal University, Nanjing 210046, China
*
Author to whom correspondence should be addressed.
These authors contributed equally to this work.
Separations 2024, 11(1), 2; https://doi.org/10.3390/separations11010002
Submission received: 16 November 2023 / Revised: 8 December 2023 / Accepted: 10 December 2023 / Published: 19 December 2023
(This article belongs to the Section Analysis of Natural Products and Pharmaceuticals)

Abstract

:
Monosaccharide composition analysis is essential to the structural characterization and research into the biological activity of polysaccharides. In this study, a systematic comparison was performed among commonly used monosaccharide composition analysis methods, including colorimetric and chromatographic methods. These were tested on 16 aldoses, ketoses, alditols, amino sugars, and uronic acids. Furthermore, the effect of hydrolysis methods was also investigated. The results showed that the phenol sulfuric acid method is greatly affected by the type of monosaccharide that is used as the reference substance. The determination of uronic acid using sulfuric acid carbazole is less affected by neutral sugars than that method using m-hydroxybiphenyl. The high-performance thin-layer chromatography (HPTLC) method can simultaneously analyze multiple samples and accurately determine the type of uronic acid. High-performance liquid chromatography (HPLC) can provide a good qualitative and quantitative analysis of aldose, amino sugars, and uronic acids, while gas chromatography–mass spectrometry (GC-MS) can detect aldose, ketose, and alditols. Fructose was detected in a large amount in inulin and Codonopsis pilosula after one-step hydrolysis, while it was totally destroyed in two-step hydrolysis. The release of galacturonic acid significantly increased after two-step hydrolysis in pectin and Lycium barbarum, which indicated that one-step hydrolysis is not enough for acidic polysaccharides. The results of this study are beneficial for selecting appropriate hydrolysis and analysis methods in order to accurately analyze the monosaccharide compositions of natural polysaccharides.

1. Introduction

Over the past few decades, polysaccharides have received much attention as one of the main bioactive compounds in food as well as medicines [1]. Polysaccharides from natural sources exhibit antioxidant [2], anti-inflammatory [3], hypoglycemic, etc., effects [4]. Furthermore, previous studies have proven that the biological activity of polysaccharides is closely correlated with specific structural characteristics, such as molecular weight distribution, the types and ratios of compositional monosaccharides, the types of glycosidic linkages [1], etc. Monosaccharides are the most basic units of polysaccharides [5]. Some abundant monosaccharides in nature, such as rhamnose and mannose, are proven in certain specific proportions to play important roles in anticoagulant and immunostimulatory activities [6]. In order to better develop and utilize polysaccharides from natural sources, accurate assay methods are essential to understanding their monosaccharide composition and, combined with other technical means, to fully understanding their structural information.
So far, there are various analytical methods that have been developed to determine the monosaccharide compositions of polysaccharides, including colorimetry, as well as different chromatographic methods combined with hydrolysis, including thin-layer chromatography (TLC), high-performance liquid chromatography (HPLC), gas chromatography (GC), gas chromatography–mass spectrometry (GC-MS), etc., [7,8,9]. The colorimetric method can allow researchers to quickly obtain information on total sugars and the content of uronic acid without performing hydrolysis, but it cannot determine the specific monosaccharide composition. Previous studies have found that the chromogenic abilities of monosaccharides are different [10]. When combined with an ultraviolet detector after derivatization or used in direct detection with an evaporative light-scattering detector (ELSD) and a refractive index detector (RID) [11], HPLC is considered to be the standard technology for routine carbohydrate analysis, Hydrophilic chromatography, combined with ELSD and RID, could allow for the analysis of monosaccharides without derivatization; however, it performs poorly in terms of detection sensitivity and separation efficiency. GC-MS presents several characteristics, such as high resolution and high sensitivity, which are significant for the analysis of structurally similar monosaccharides. Especially when coupled with MS, this method could offer rather complete structural information on carbohydrates [12]. The aldononitrile acetate approach has been widely used in the GC/GC-MS and LC-MS/MS methods for monosaccharide composition analysis. This derivative procedure produces a unique peak for aldose, and the cyano-functional group is very stable and easy to form, which is suitable for the quantitative analysis of monosaccharides; however, it is not as suitable for the analysis of ketose [13]. Therefore, it is important to understand the influences of different monosaccharide compositions on the detection results of different methods to truly and accurately decode the structures of natural polysaccharides.
Furthermore, another important step in monosaccharide composition analysis is the depolymerization of polysaccharides, which usually employs enzymatic hydrolysis and acid hydrolysis [14]. Acid hydrolysis is economical and rapid, and is more suitable for the monosaccharide composition analysis of polysaccharides. Sulfuric acid, hydrochloric acid, and trifluoroacetic acid (TFA) are usually used, alone or in combination, to hydrolyze polysaccharides [15]. One-step hydrolysis with one kind of acid is the most commonly used method. However, since various glycosidic linkages in polysaccharides may have different resistances to hydrolysis, two-step acid hydrolysis has been proven to be advantageous for some structurally complex polysaccharides. In particular, polysaccharides containing uronic acid, often equipping themselves with acid-resistant glycosidic linkages, may not be completely degraded under one hydrolysis condition [16]. It was reported that two-step processes can be widely used for the monosaccharide composition determination of polysaccharides rich in uronic acids [5,17]. Therefore, different monosaccharide compositions definitely require different acid hydrolysis conditions, which need to be evaluated comparatively; otherwise, it is very easy to cause the incomplete hydrolysis or degradation of the released monosaccharides.
Therefore, the influences of different monosaccharide compositions (including 16 aldoses, ketoses, alditols, amino sugars, and uronic acids) on the different colorimetric methods, including phenol sulfuric acid, carbazole sulfuric acid, and m-hydroxybiphenyl, were investigated. In addition, the applicability, operation time, detection sensitivity, and quantitative accuracy of HPTLC, HPLC-DAD, and GC-MS for different monosaccharides were compared to investigate the advantages and disadvantages of each method. Furthermore, the hydrolysis process, which significantly influences monosaccharide composition analysis, including one-step and two-step acid hydrolysis methods, was compared. The effect of hydrolysis and the detection method on the monosaccharide analysis of inulin, pectin, and three natural-source polysaccharides extracted from Lycium barbarum, Codonopsis pilosula, and Ganoderma lucidum was investigated. The results of this study can provide a basis for selecting appropriate and accurate methods when decoding the structures of polysaccharides.

2. Materials and Methods

2.1. Materials and Reagents

Rhamnose (Rha), xXylose (Xyl), rRibose (Rib), gGlucose (Glc), gGalactose (Gal), aArabinose (Ara), fFucose (Fuc), mMannose (Man), fFructose (Fru), gGlucuronic acid (GlcA), gGalacturonic acid (GalA), rRibitol (Ri-ol), and mMannitol (Ma-ol) were purchased from Sigma-Aldrich (St. Louis, MO, USA). Glucosamine (GlcN) was purchased from Meryer Corp (Shanghai, China). Sorbitol (So-ol) and xXylitol (Xy-ol) were purchased from Macklin Corp (Shanghai, China). Information about the 16 monosaccharides is shown in Table S1. Trifluoroacetic acid (TFA) was purchased from Aladdin Corp (Shanghai, China). 1-Phenyl-3-methyl-5-pyrazolone (PMP, analytical purity) was purchased from Yuanye Bio-Technology (Shanghai, China). Hydroxylamine hydrochloride and Methoxyamine hydrochloride were purchased from Sigma-Aldrich (St. Louis, MO, USA). Chromatographic-grade methanol and acetonitrile (ACN) were obtained from Macklin (Shanghai, China). Ultra-pure water was obtained from an Aquapro System (Chongqing, China). All of the other chemicals and reagents used were of analytical grade.
Pectin and inulin were purchased from Macklin (Shanghai, China); L. barbarum, C. pilosula, and G. lucidum were all commercially available. Information about the five polysaccharides is shown in Table S2.

2.2. Extraction and Hydrolysis of Polysaccharides

The powders of L. barbarum, C. pilosula, and G. lucidum were extracted according to our previous studies [13]. In brief, powders were extracted with 60% ethanol under reflux conditions at 100 °C (temperature of the oil bath) for 1 h (solid-to-liquid ratio = 1:25). The residue was centrifuged, redissolved with water and extracted at 130 °C (temperature of the oil bath) for 1 h with a solid-to-liquid ratio of 1:30. This process was repeated twice. Then, the supernatants were concentrated under reduced pressure and precipitated four times using absolute ethanol for 12 h. After centrifugation, a precipitate was obtained. The precipitate was washed with anhydrous ethanol again, and the residue was dried until there was no obvious ethanol smell. Finally, it was redissolved in pure water and lyophilized to obtain the L. barbarum polysaccharide (LBP), C. pilosula polysaccharide (CPP), and G. lucidum polysaccharide (GIP).
Polysaccharides were hydrolyzed via one-step acid hydrolysis and two-step acid hydrolysis. Specifically, the one-step acid hydrolysis method was modified according to our previous research [13]: the polysaccharide sample (3 mg) was mixed with 1 mL of 2 M TFA solution and hydrolyzed at 90 °C for 8 h. In the two-step acid hydrolysis method, firstly, 1 mL of 2 M hydrochloric acid–methanol was used for hydrolysis at 80 °C for 16 h, and after drying 1 mL of 2 M TFA was used for further hydrolysis at 120 °C for 1 h [18].

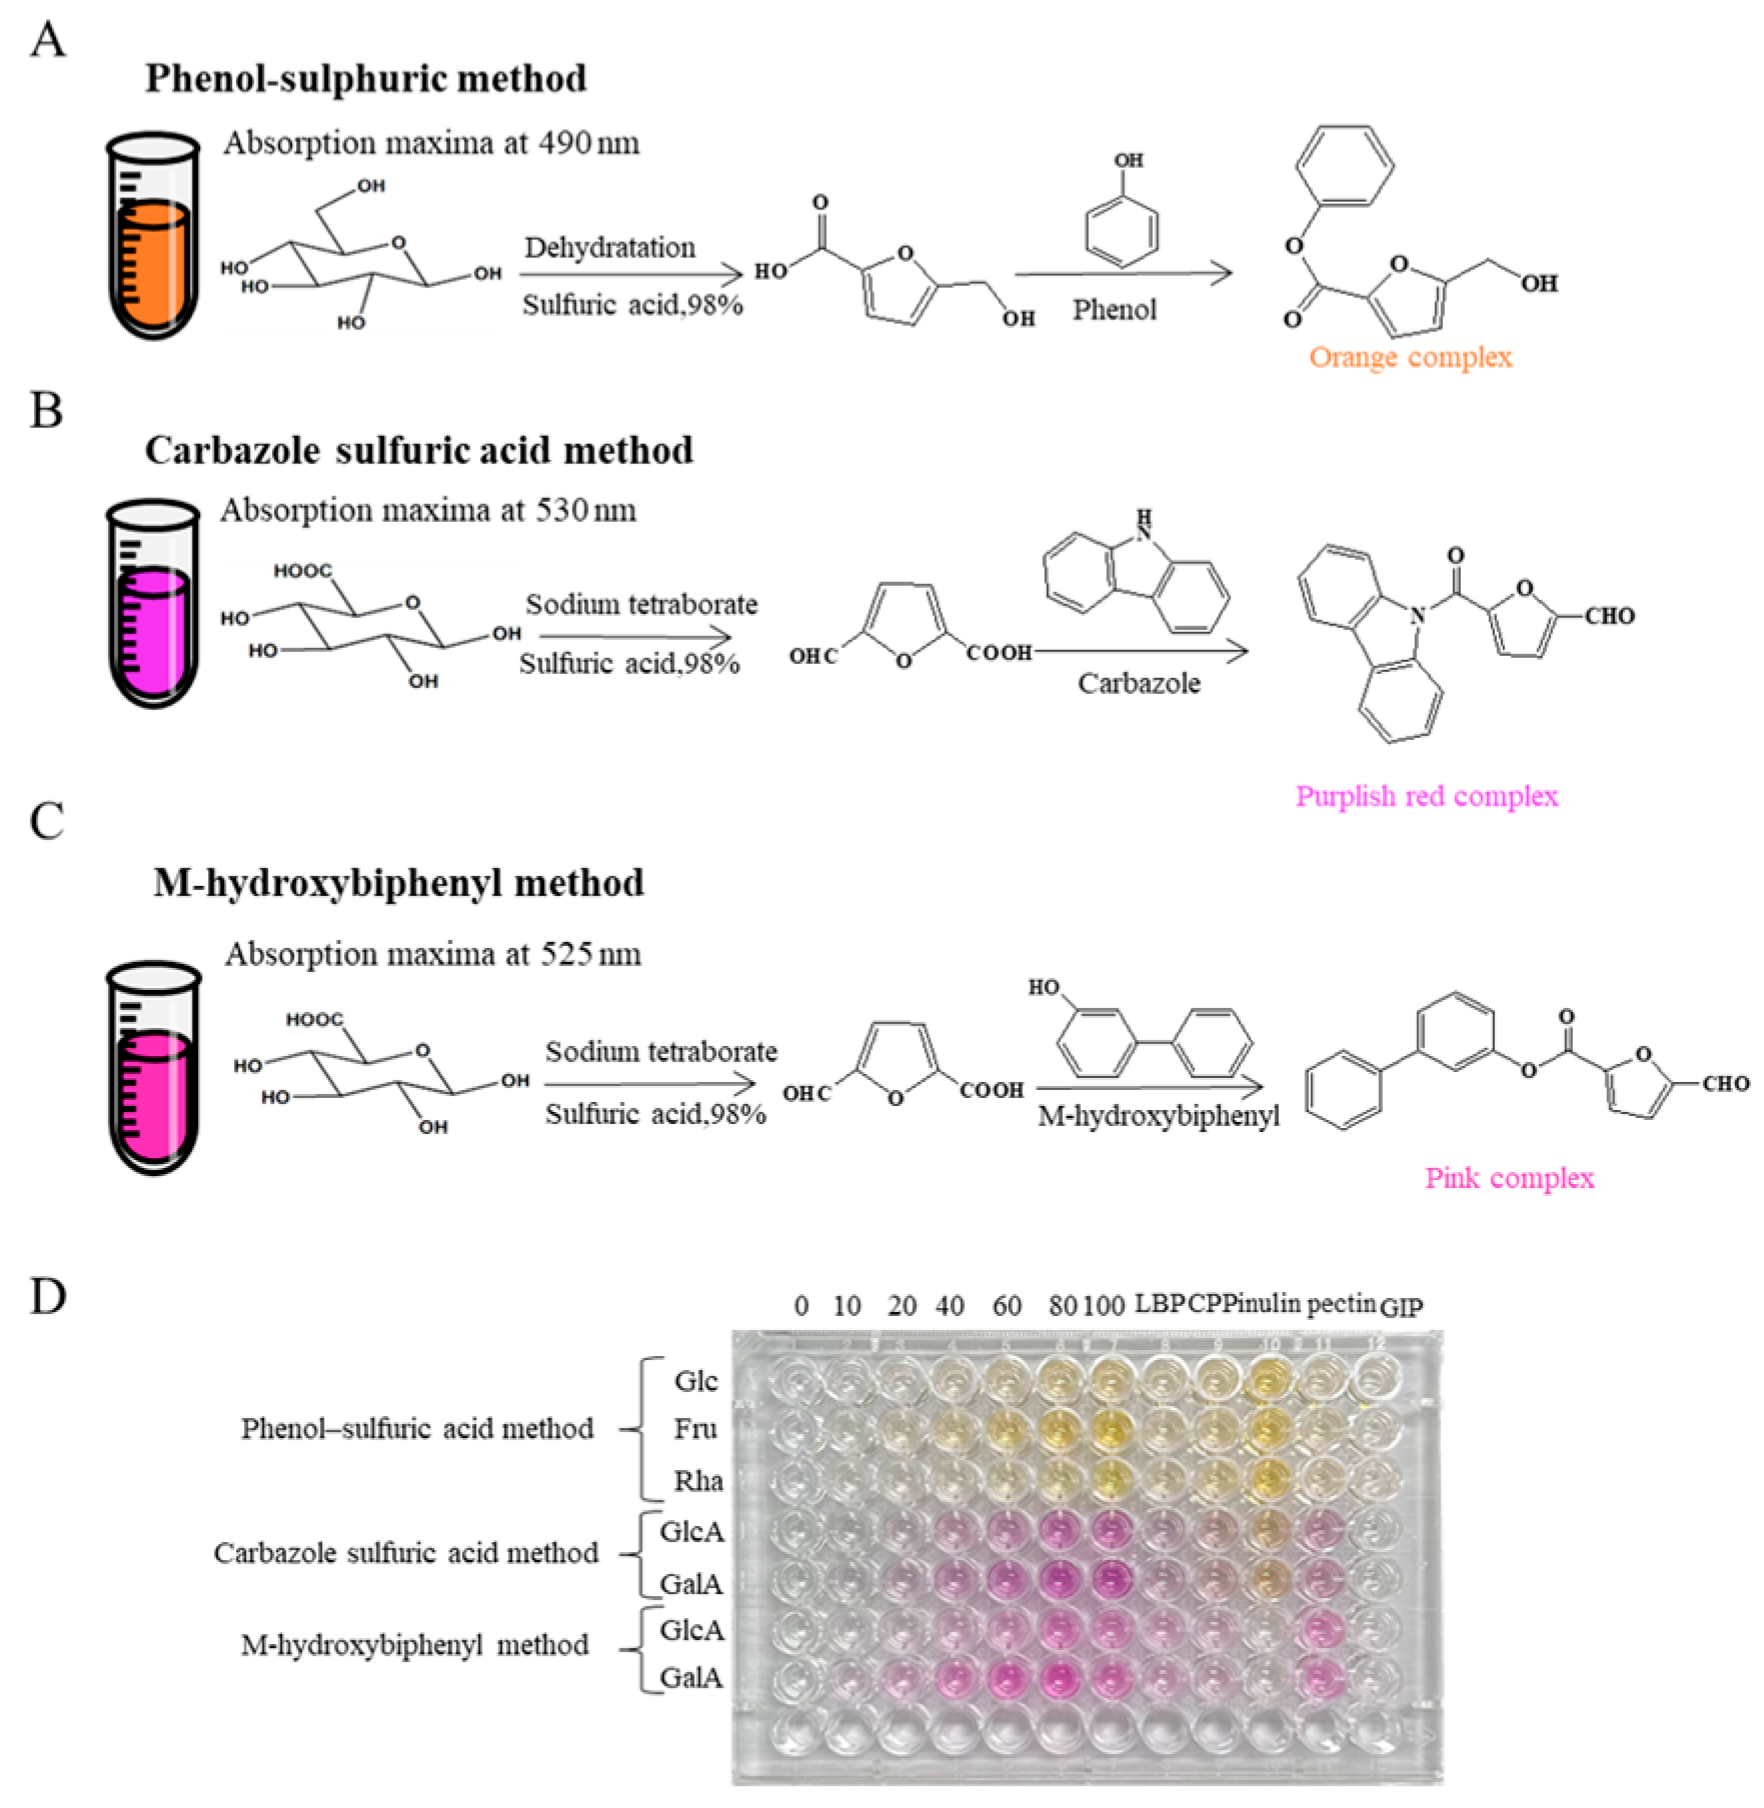
2.3. Chromogenic Method

The total sugar content was determined via the phenol–sulfuric acid method. Glc, Fru, and Rha were selected as representatives for aldose, ketose, and methylpentose and used as standard reference substances to investigate the chromogenic differences in different monosaccharides. The sample solution containing 16 monosaccharides was prepared to investigate the interference of different monosaccharides with detection accuracy. The sample solution (1 mg/mL) was diluted 10 times with purified water, and the concentration of standard solution was prepared in the range of 0–100 μg/mL. Then, 200 μL of standard solution or sample solution was mixed with 100 μL of 6% phenol solution, respectively. Under the conditions of an ice bath, 1 mL of concentrated sulfuric acid was slowly added. After being shaken well, the mixed solution was heated in a boiling water bath for 10 min and then cooled to room temperature to be measured at 490 nm.
For the determination of the uronic acid content, the carbazole sulfuric acid method and m-hydroxybiphenyl method were compared. GalA and GlcA were used as reference substances, respectively. The concentration of the standard solution was prepared in the range of 0–80 μg/mL. The specific steps of the carbazole sulfuric acid method were as follows: 200 μL of standard solution or sample solution was taken and mixed with 1 mL of 0.025 mol/L sodium tetraborate-concentrated sulfuric acid solution (under the condition of an ice bath). After shaking, the mixture was heated by a boiling water bath for 5 min and then cooled to room temperature, mixed with 40 μL of 0.125% carbazole–ethanol solution, and then determined at 530 nm. The steps for measuring uronic acid using the m-hydroxyphenyl method were as follows: 200 μL of standard solution, 200 μL of sample solution and 1 mL of sodium tetraborate–sulfuric acid solution were mixed. After being shaken well, the mixed solution was heated in a boiling water bath for 10 min and cooled in an ice water bath, and then 20 μL of 1.5 mg/mL m-hydroxyphenyl solution (5 mg/mL NaOH solution dissolved) was added. The corresponding absorbance was measured at 525 nm.

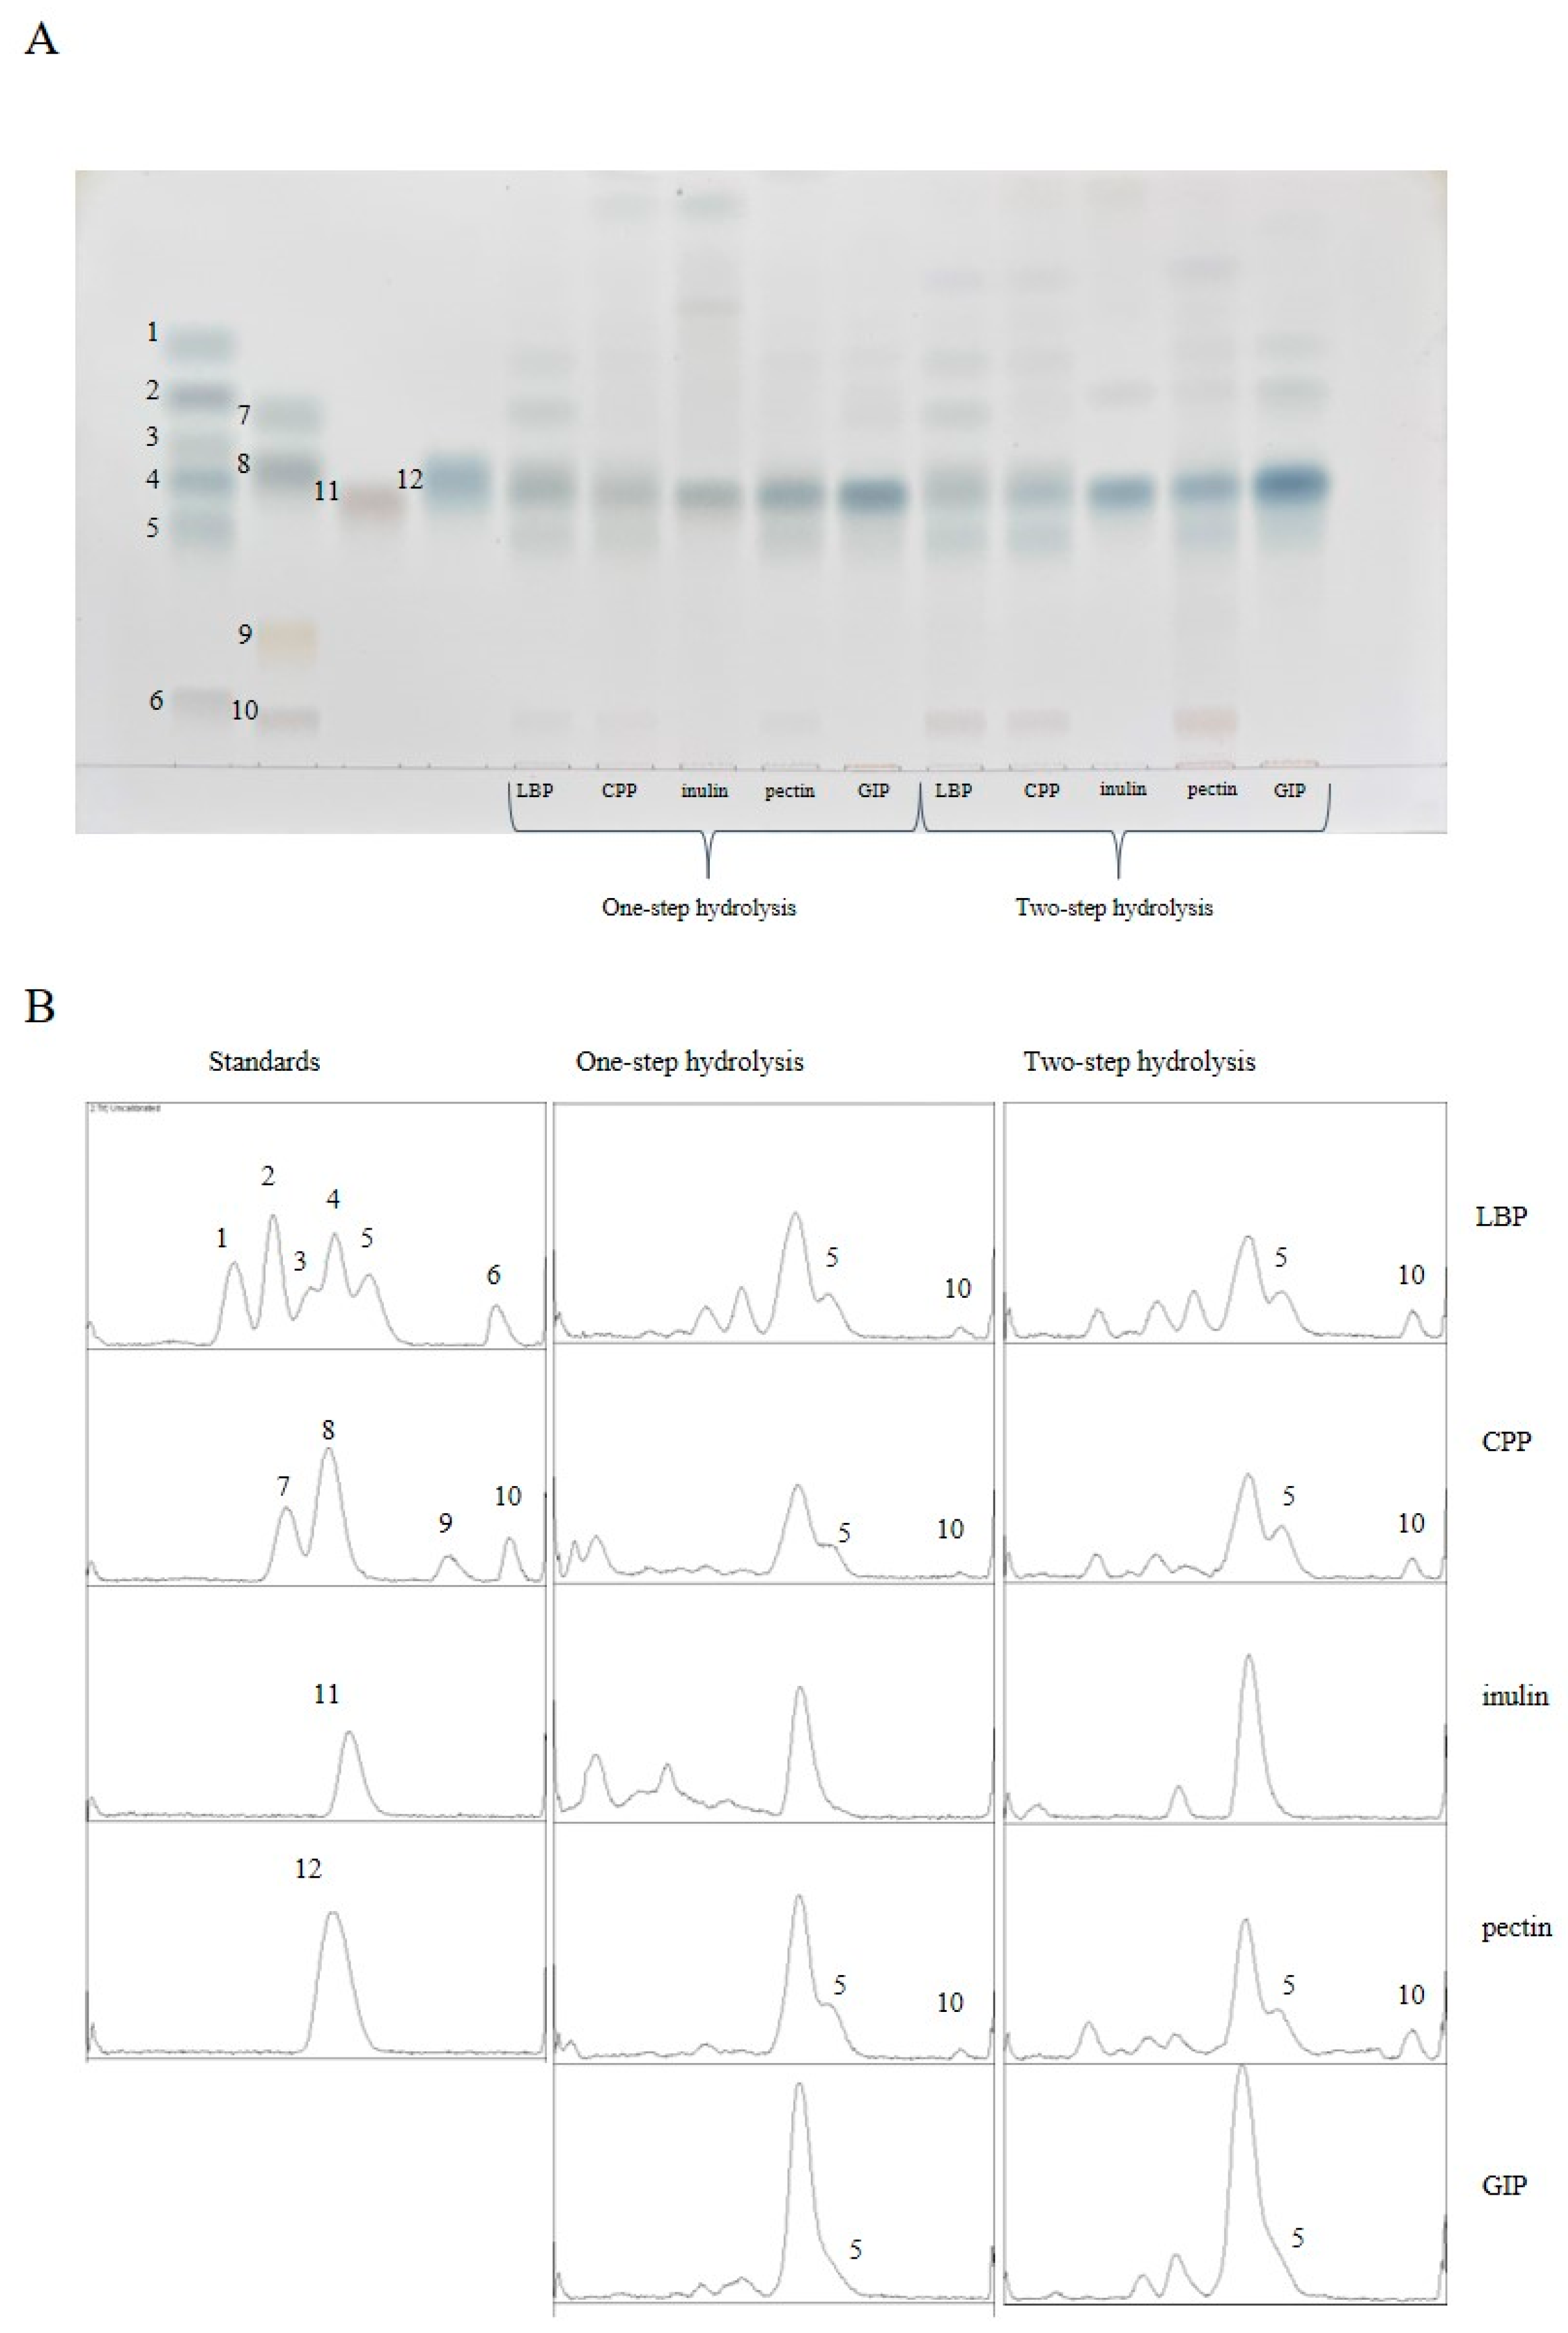
2.4. Thin-Layer Chromatography

Firstly, a silica gel thin-layer plate (Merck KGaA) was activated in an oven at 105 °C for 5–10 min. The monosaccharide standard solution was prepared at a concentration of 2 mg/mL with methonal. Then, 10 μL of standard solution and sample solutions were applied in 8 mm wide bands with a microliter syringe at a distance of 10 mm from the lower end of the plate. After the sampling was finished, the thin-layer plate was immersed in a pre-saturated double-layer chromatography cylinder for development, and the developing agent was the mixed solution of n-butanol, methanol, chloroform, glacial acetic acid, and water (25:9:10:3:3, v/v/v/v/v) [19]. The spreading distance was 90 mm. For detection, the developing agent was dried in a fume hood and sprayed with aniline-diphenylamine developer (0.4 g of diphenylamine, 0.4 mL of aniline, 2 mL of 85% phosphoric acid mixed and dissolved in 20 mL of acetone solution) onto the thin-layer plate. Finally, the plate was placed in an oven at 130 °C for color development for 5–10 min. The result of color development was photographed and recorded.
We used an automatic gel imaging system (Tanon) to shoot TLC grayscale images and analyzed them using Image-J software (Java 1.8.0 112, 64-bit, National Institutes of Health, Bethesda, MD, USA).

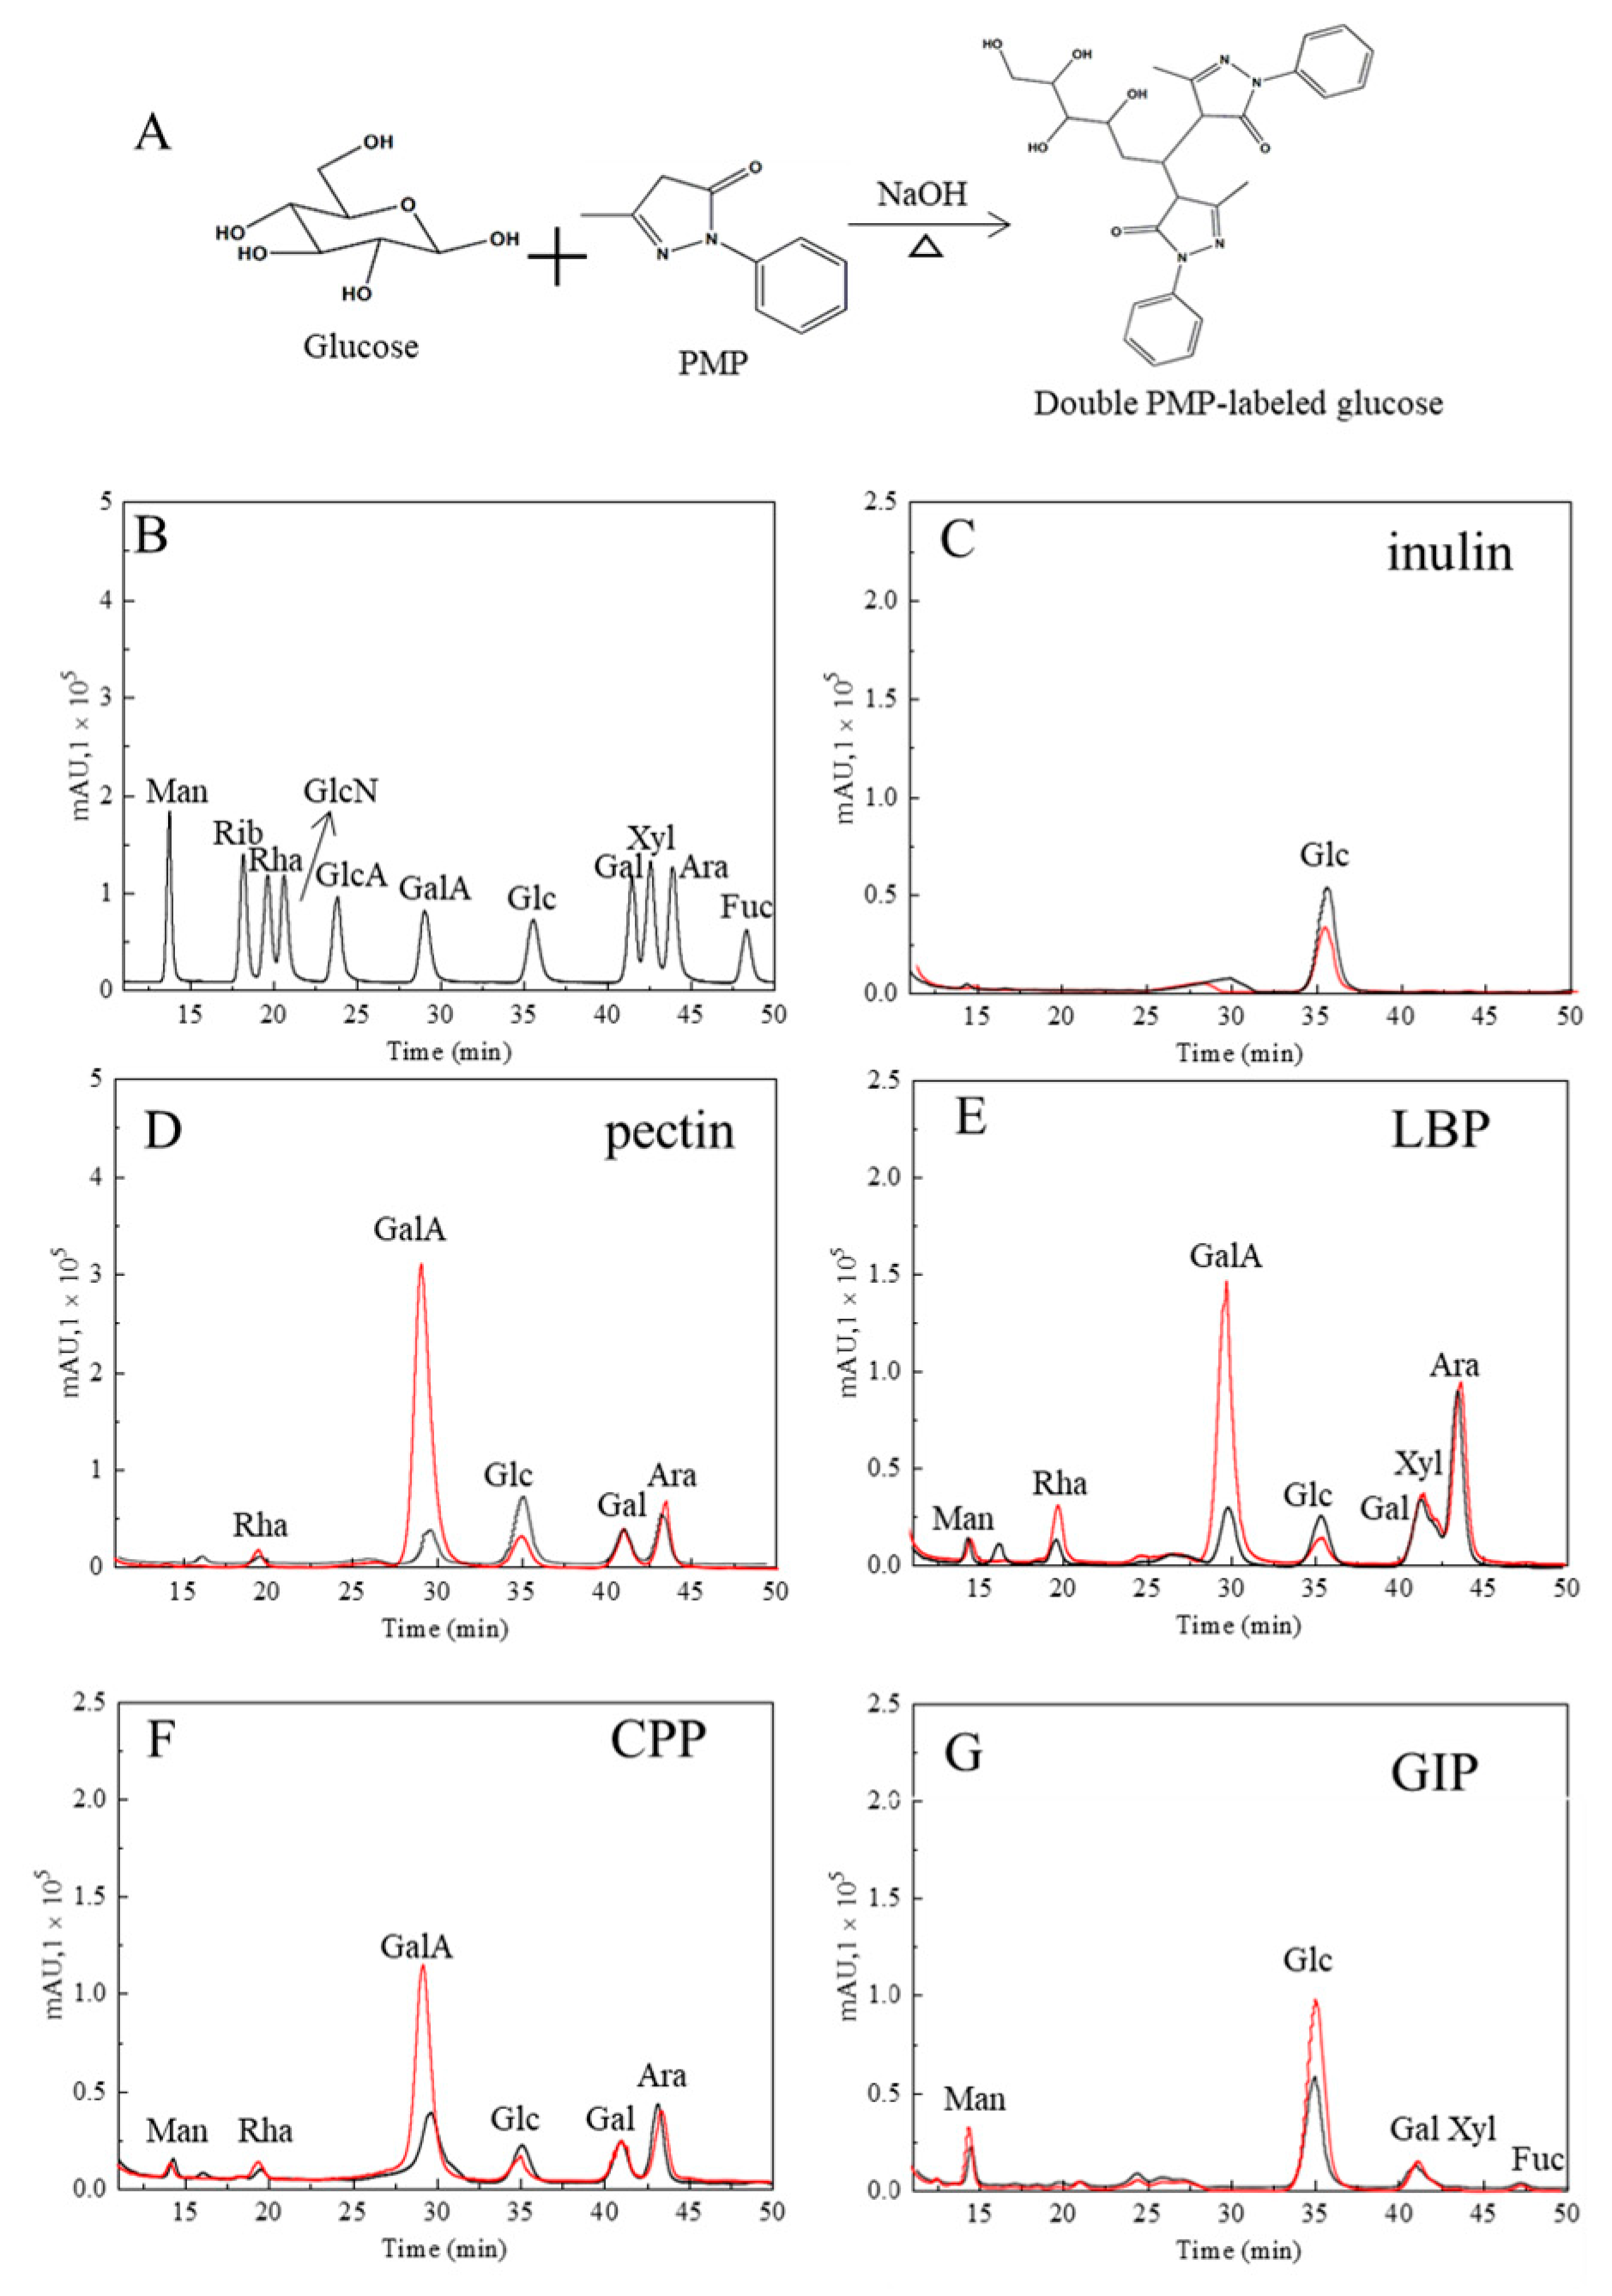
2.5. High-Performance Liquid Chromatography

The 1-phenyl-3-methyl-5-pyrazolone (PMP) derivatization method was performed as follows: the standard solution or hydrolyzed sample solution (0.5 mL) was mixed with 0.5 mL of 0.3 mol/L NaOH solution and 0.5 mol/L PMP-methanol solution. The above solution was allowed to cool to room temperature after being heated at 70 °C for 100 min. Then, 0.5 mL of 0.3 mol/L HCl solution was added to the reaction system for neutralization. Finally, the reaction system was extracted with 2 mL of chloroform. The organic layer was carefully removed from the remaining aqueous phase, and this process was repeated three times. Both standards and samples were filtered using a 0.22 µm filter before HPLC analysis.
The analysis of PMP derivatives was performed on a Nexera LC-40 (SHIMADZU, Kyoto, Japan). A Thermo Hypersil GOLD aQ (4.6 mm × 250 mm, 4.6 μm) column was used for chromatographic separation. Mobile phases consisted of 83% phase A (phosphate Buffer, pH = 6.8) and 17% phase B (acetonitrile). The separation temperature was 35 °C, the flow rate was 1 mL/min, and the injection volume was 10 μL. The UV detection wavelength was set at 245 nm.

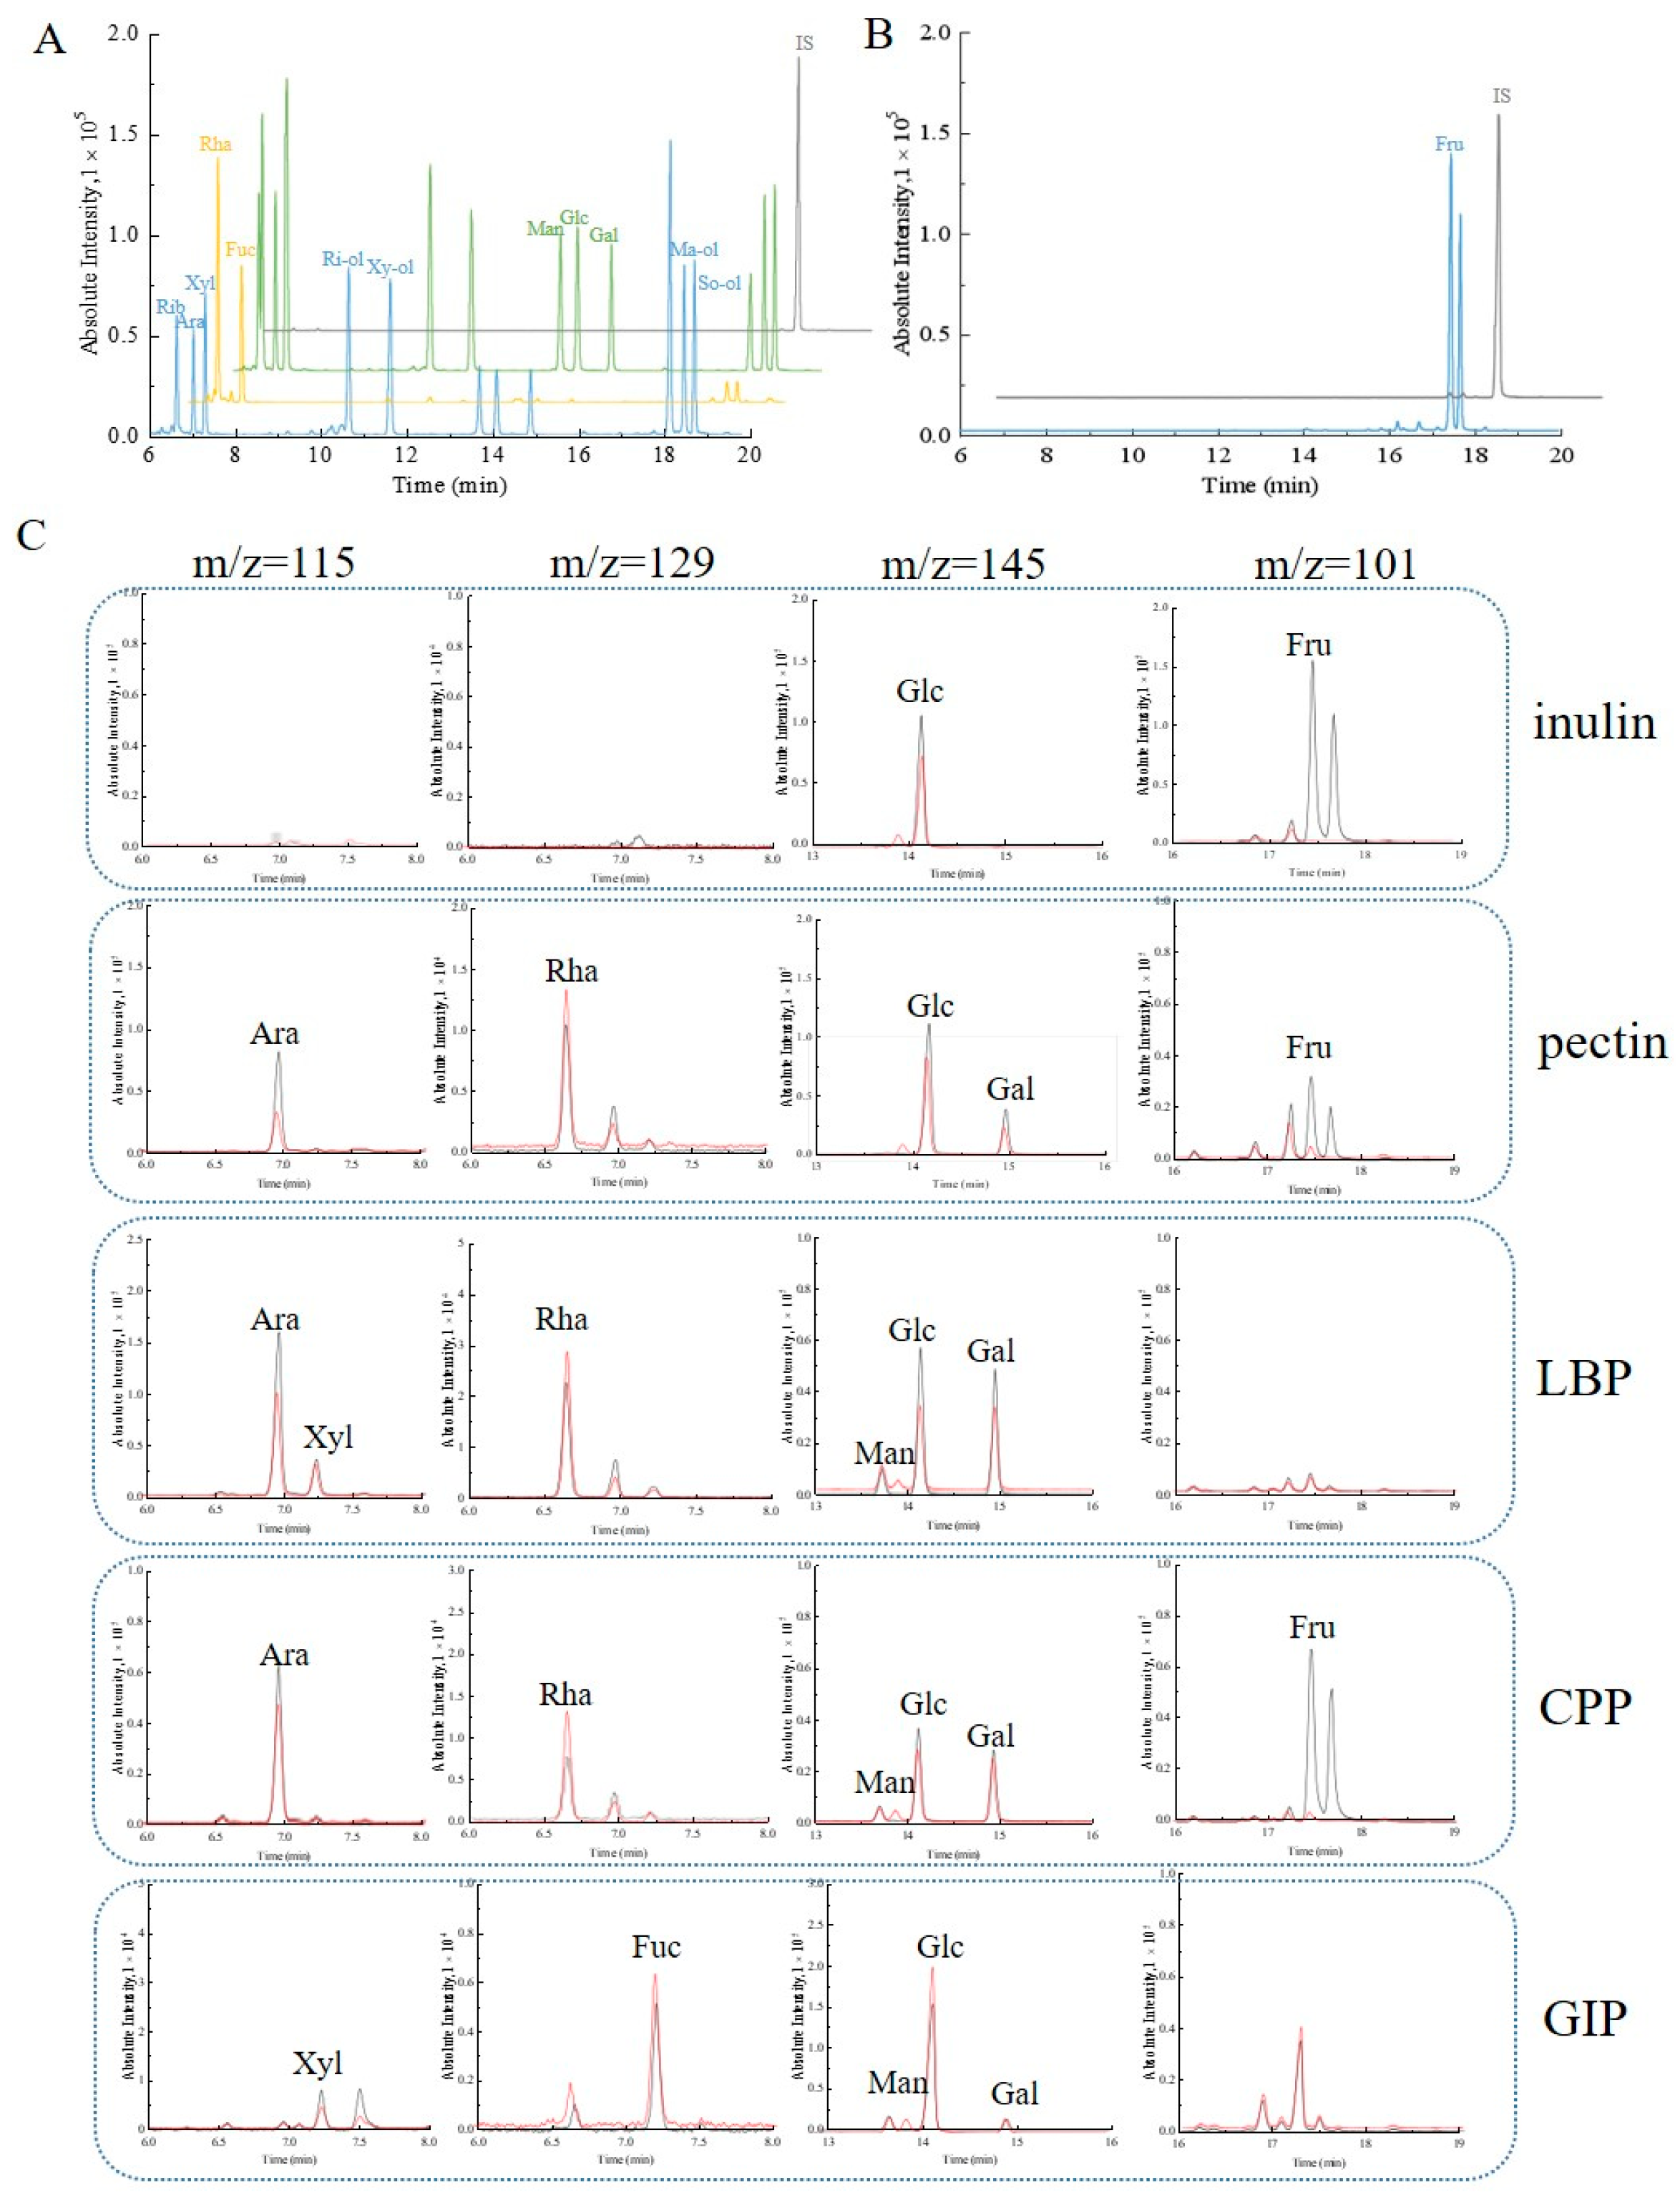
2.6. Gas Chromatography—Mass Spectrometer Method

This method is based on previous research with slight modifications [20]. To detect monosaccharide composition via GC-MS and for the derivatization of aldose and alditol separately, monosaccharides were firstly divided into two parts. The monosaccharide standard solution or hydrolyzed sample solution (400 µL) was reacted with 100 µL of hydroxylamine hydrochloride pyridine solution (100 mg/mL) at 90 °C for 30 min and subsequently with acetic anhydride (500 µL) at 90 °C for 30 min. Another step was applied for ketose derevitization. The monosaccharide standard or hydrolysates (400 µL) were treated with methoxylamine hydrochloride pyridine solution (100 µL, 10 mg/mL) at 70 °C for 60 min and then with acetic anhydride (500 µL) at 45 °C for another 60 min. After the solution dried, it was redissolved in 1 mL of methanol and dried. Then, 1 mL of 0.1 mg/mL inositol hexaacetyl ester-(internal standard)-methanol solution was added, filtered using a 0.22 µm organic microporous membrane, and detected via GC-MS. Chromatographic conditions: the column type was Agilent HP-5 MS (30 m × 0.25 mm, 0.25 μm). Helium was used as the carrier gas, and the flow rate was 1 mL/min. The initial column temperature was 170 °C for 5 min; then, it was raised to 180 °C at 4 °C/min and held for 5 min. It was then raised to 225 °C at 5 °C/min and held for 3 min, and finally raised to 280 °C at 20 °C/min. The inlet temperature was 250 °C and the injection volume was 1 µL. The split ratio was 10:1.

2.7. Verification of Monosaccharide Quantitative Method

For the standard curve, the HPLC method took the monosaccharide concentration and peak area to construct the calibration curve, while the GC-MS method used the monosaccharide concentration as X and the ratio of the monosaccharide peak area to the internal standard peak area as Y to obtain the monosaccharide linear regression equation. The limit of detection (LOD) and the limit of quantification (LOQ) were determined using signal-to-noise ratios of 3 and 10, respectively. The precision was measured at high, medium, and low levels within the linear range. Intraday precision refers to the percentage of the standard relative deviation of one concentration, determined six times on the same day, and interday precision refers to the relative standard deviation of six results after injecting a sample twice a day for three consecutive days. In order to calculate the accuracy, a mixed standard solution with a known concentration was prepared to participate in the reaction process. The recovery was used to investigate the detection accuracy and was estimated using the following formula: the measured value of the sample/actual value × 100%.

3. Results and Discussion

3.1. Determination of Total Sugar and Sugar Acid Content by Chromogenic Method

The phenol–sulfuric acid method is a common method used to determine the total sugar content [21]. The polysaccharide is dehydrated under the action of concentrated sulfuric acid to form furfural derivatives, which react with phenol to form orange–red compounds (Figure 1A). In order to study the effect of monosaccharides with different properties on the color results, Fru, Glc, and Rha were selected as the reference substances. Glc is a hexose-containing aldehyde group, while Rha is a methylpentose. Fru belongs to polyhydroxyketones and is not reducible. The results of the phenol–sulfuric acid method are shown in Table 1, and the linear relationships (R2) of the Fru, Glc, and Rha standard curves were between 0.9982 and 0.9991. The accuracy results showed that the mixed standard containing 16 monosaccharides with a 2 μg/mL concentration was closer to the actual content when substituted into the Fru (111.5%) regression equation. There may be significant differences in the color-rendering ability of different monosaccharides with the same concentration after condensation with phenol, as shown in Figure 1D, and Fru has a stronger color-rendering ability than the other two monosaccharides. When taking Glc (163.0%) as the reference substance for the phenol–sulfuric acid method, the determination results are generally on the high side, as shown in Table 1.
The carbazole sulfate method and the m-hydroxybiphenyl method are commonly used to determine the uronic acid content in polysaccharides [22]. Uronic acid is hydrolyzed into various furan structures with -COOH under the action of concentrated sulfuric acid. The derivatives react with carbazole reagent to produce purplish-red compounds; the color intensity is proportional to the uronic acid content [23]. It can be quantitatively compared with color (Figure 1B). The principle of the m-hydroxybiphenyl method is similar to that of the carbazole sulfuric acid method (Figure 1C). Both GlcA and GalA were used as reference substances in two methods. The results show that the two methods have good linearity within the range of 0.9971–0.9993. For the mixed standard, the recovery of both the carbazole sulfuric acid and the m-hydroxybiphenyl method showed that the existence of neutral sugar affects the determination of uronic acid. As shown in Table 1, the detection result is relatively high compared with the actual concentration. Compared with the m-hydroxybiphenyl method, the detection value of the carbazole sulfuric acid method is closer to the actual value. And compared with experiments using GlcA as the reference substance, the results obtained using GalA as the reference substance are closer to the actual value (205.3% vs. 150.6%). The results showed that, when GlcA was used as a reference substance, the detected value was more than twice of the actual value derived using both the carbazole sulfuric acid (205.3%) and the m-hydroxybiphenyl method (234.1%). The result suggested that we may achieve a better result when determining the uronic acid content of acidic polysaccharides using colorimetric methods, especially when using the m-hydroxybiphenyl method or using GlcA as the reference substance.
The above methods were applied to determine the content of total sugar and uronic acid in real samples (Figure 1D, Table 2). Inulin is a neutral polysaccharide consisting of a linear chain of fructose units with glucose units at the reducing end [24,25,26,27], and pectin is a family of galacturonic acid-rich polysaccharides, including homogalacturonan, rhamnogalacturonan I and the substituted galacturonans rhamnogalacturonan II (RG-II) [28,29,30,31]. Lycium barbarum (LBP) is also rich in acidic polysaccharides, including GalA, Ara, Gal, Rha, Glc, and Xyl, at different ratios based on previous studies [32,33,34]. Codonopsis pilosula (CPP) contained both neutral inulin-type fructan and acidic rhamnogalacturonan [35,36,37]. Polysaccharides in Ganoderma lucidum are mainly neutral glucans [38,39]. Therefore, these polysaccharides with different structures were selected for the purpose of investigating the effects of hydrolysis conditions and detection methods on monosaccharide composition analysis. The structural information of five polysaccharides is summarized in Table S2. As the results show in Table 2, the total sugar content of inulin is higher than 100% when calculated using Glc and Rha as the reference substances. This indicates that the chromogenic method results were significantly affected by the kind of monosaccharide used as the reference substance. The content calculated using Fru is relatively low, which is consistent with the validation results obtained using the mixed standards shown in Table 1. Inulin does not contain uronic acid, but the determination results showed the presence of uronic acid, which further verifies the effect of neutral sugars on the detection results of uronic acid. The structure of pectin is rich in uronic acid, and the content of uronic acid is higher than 100%, as detected via the m-hydroxybiphenyl method when using GlcA as a reference substance. Furthermore, when using GlcA as a reference substance, the detection deviation of the carbazole sulfuric acid method and m-hydroxybiphenyl method is higher than that obtained with GlaA (such as in the detection of pectin, where there is a rate of 59.1% vs. one higher than 100% when using GlcA as the reference substance, and likewise 39.2% vs. 39.5% when using GalA as the reference substance). Although the colorimetric method is simple and rapid, it cannot represent the true situation of heteropolysaccharides, and the test results show that the presence of neutral sugar will affect the determination result of uronic acid. For polysaccharides from different sources, a more accurate determination method should be used to determine the monosaccharide composition.

3.2. High-Performance Thin-Layer Chromatography

High-performance thin-layer chromatography (HPTLC) allows for a visual identification of monosaccharide species by color and Rf value. The results of HPTLC showed that nine neutral sugars, two sugar acids, and amino sugars could be separated usig this method (Figure 2A). Because the Rf values of some monosaccharides are similar, which affects the quantitative results, 12 kinds of sugars were divided into four groups. Group A included Rha, Xyl, Rib, Glc, Gal, and GlcA; B consisted of Fuc, Ara, GlcN, and GalA; and Group C and Group D were Fru and Man, respectively. The strips from the thin-layer chromatography plate were taken as TLC grayscale images using an automated gel imaging system and converted from grayscale into optical density values via image-j analysis software in an attempt to perform quantitative analysis (Figure 2B). Taking the concentration as the X-axis, the optical density values of each monosaccharide under different concentrations were taken as the Y-axis to construct the linear standard curve. Table S3 shows the methodological results of HPTLC. Compared with HPLC and GC, the linear relationship is not so satisfied. This is mainly because of the scanning and conversion errors, as well as operating errors [5]. Although HPTLC does not have an advantage in quantitative analysis, it can perform intuitive qualitative analysis and analyze multiple samples simultaneously, making it essential for monosaccharide composition analysis.
The result showed that there were obvious differences in the monosaccharide composition and content among five polysaccharides from natural sources, which could be observed visually in HPTLC plates after color development (Figure 2A). It is known that inulin is composed of Glc and Fru. The HPTLC results showed that the monosaccharide composition of inulin changed greatly under the action of the two steps of acid hydrolysis. The disappearance of Fru bands can be visually observed based on color as Fru is brown and Glc is blue after color development. The band of inulin after one-step hydrolysis is brown mixed with blue, while the band appears to be exclusively blue after two-step hydrolysis, as shown in Figure 2A. This indicates that Fru is more easily destroyed under intense hydrolysis conditions. The bands overlapped due to the close Rf values of some monosaccharides, and the monosaccharide types cannot be definitely distinguished by color. Therefore, the identification of Glc, Ara, and Man is difficult as they have similar Rf. However, in HPTLC separation, GalA and GlcA can be clearly separated, while it is hard to derive stable and quantifiable chromatographic peaks in gas chromatography. The bands after the conversion shown in Figure 2B demonstrated that Gal and GalA can be clearly identified. Excepting inulin, the other four polysaccharides contained Gal. LBP, CPP, and pectin are acidic polysaccharides composed of GalA. Furthermore, the content of GalA obviously increased after two-step hydrolysis, which is obviously reflected in HPTLC plates (Figure 2A,B).

3.3. High-Performance Liquid Chromatography

The HPLC-UV method using 1-phenyl-3-methyl-5-pyrazolone (PMP) for pre-column derivatization is a common method used for monosaccharide determination. Pre-column derivatization with PMP can react with reduced carbohydrates under mild conditions without an acid catalyst. The derivatives were not easy to crack, it was not easy for them to produce isomers, and they had strong absorption at 245 nm wavelength (Figure 3A). Since the reaction requires an aldehyde group, sugar alcohols could not be analyzed as PMP derivatives. In addition, Fru could not form PMP derivatives. This was probably due to the low reactivity of the ketone group and the spatial site hindrance caused by its molecular conformation [40]. The HPLC-DAD chromatogram of the mixed standards is shown in Figure 3B: aldoses, amino sugars, and uronic acids, including Man, Rib, Rha, GlcN, GlcA, GalA, Glc, Gal, Xyl, Ara, and Fuc, were derived and separated. The linear regression equation is shown in Table S4. It can be seen that the monosaccharide in the range of 3.04~343 µg/mL had a good linear relationship (R2 > 0.9928), and the detection sensitivity was satisfied with an LOD of 0.19~0.42 µg/mL. The recovery was between 90.6% and 101.3%. As shown in Table S5, the intraday precision of the peak area and retention time, respectively, measured at the concentrations of 25, 50, and 100 µg/mL was 0.10~3.71% and 0.16~0.63%%. The interday precision of the peak area and retention time was in the range of 2.10~13.83% and 0.18~0.74%, respectively. The results showed that the analytical method has good precision.
After the hydrolyzed polysaccharide samples were derived via PMP, the monosaccharide composition of polysaccharides from natural sources was further decoded. Except for Gal and GalA, which were determined via HPTLC, other monosaccharides were also determined. Only Glc was detected in inulin because Fru could not be derived via PMP (Figure 3C). And the monosaccharide composition of pectin included Rha, GalA, Glc, Gal, and Ara, in which GalA was present in a large amount. This result is in accordance with the structure of pectin, in which GalA is abundant along the backbone (Figure 3D). Monosaccharides including Man, Rha, GalA, Glc, Gal, and Ara were detected in LBP and CPP. LBP also had a small amount of Xyl (Figure 3E,F). The monosaccharide with the highest content in GIP was Glc, which is consistent with previous reports that the main polysaccharide in G. lucidum is glucan (Figure 3G) [41,42]. Polysaccharides containing uronic acid typically have acid-resistant glycosidic linkages. Therefore, for polysaccharides rich in uronic acid, such as pectin, LBP, and CPP, two-step hydrolysis is needed. The result showed that different acid hydrolysis conditions resulted in significant variations in uronic acid content. After two-step acid hydrolysis, the content of GalA increased obviously, as shown in Figure 3D–F in the red line. This result proves that one-step acid hydrolysis is usually insufficient for acidic polysaccharides, which probably leads to the misjudgment of monosaccharide composition [5]. Therefore, suitable acid hydrolysis conditions are crucial to obtaining the accurate monosaccharide composition of polysaccharides, which need to be optimized for different polysaccharides.

3.4. Gas Chromatography—Mass Spectrometry

Monosaccharides have no volatility and so they must be chemically modified before they can be used for GC-MS analysis. Due to the different functional groups of aldose, ketose, sugar alcohol, amino sugars, and uronic acid, their properties are different, and so different monosaccharides need to be derivatized with different derivatization reagents, as described in the experimental method. Among various derivatization methods, the aldononitrile acetate derivative method is the most widely used method [43]. The principle is that sugar oxime is formed after treatment with hydroxylamine hydrochloride. As a second step, the progress in acetylation is performed for aldose to form aldononitrile acetate, which can simplify chromatograms by producing a single peak. Sugar alcohol does not react with hydroxylamine hydrochloride. They only reacted with acetic anhydride in the second step to form alditol acetates. Of note, neither the oxime group in the C2 position of the ketose participated in the second step; as such, two peaks formed because of each fructose form [44]. As shown in Figure 4A,B, the monosaccharides that can be analyzed by this method include aldose, ketose, and sugar alcohol, but uronic acid and amino sugar cannot be detected due to their low volatility. All derived monosaccharides, especially Gal and Xyl, which cannot achieve good separation in HPLC methods can be separated well via GC-MS. The results of the methodological examination are shown in Tables S6 and S7. The GC-MS method had good linearity in the range of 3.14~226.67 µg/mL, and the R2 was greater than 0.9967. The LOD and LOQ of the analytes ranged from 0.12 to 0.80 μg/mL and 0.41 to 2.68 μg/mL, respectively, which indicated that the method established was sufficiently sensitive. The accuracy of the developed method was acceptable, and its recoveries varied in the range of 84.4–99.9%. The RSDs for the interday and intraday precision of the peak areas ranged from 0.87% to 6.33% and 0.67% to 5.78%, respectively, while the RSDs for interday and intraday precision of the retention times ranged from 0.01% to 0.20% and 0.01% to 0.09%, respectively.
Compared with HPLC, ketose could be detected via GC-MS, and it was observed that fructose-rich heteropolysaccharides such as inulin and CPP contained large amounts of Fru after one-step acid hydrolysis, as shown in the black line in Figure 4C. However, after two steps of acid hydrolysis, the Fru could hardly be detected in either inulin or CPP. Ara, Glc, and Gal could also be observed to decrease slightly after two-step acid hydrolysis (Figure 4C). The quantitative results in Table 3 showed that the Fru content in inulin was 54.5 mg/g after one-step acid hydrolysis; however, Fru could not be detected after two-step acid hydrolysis.
The methodology investigation result showed that the HPLC-DAD and GC-MS methods could achieve the accurate quantification of monosaccharides. However, the quantification results shown in Table 3 displayed obvious differences in five polysaccharides detected using HPLC-DAD and GC-MS. The result indicated that it may be caused by the different hydrolysis conditions and detection capacities of different methods. Two-step hydrolysis leads to the increased release of uronic acid and degradation of Fru. For acidic polysaccharides such as pectin, LBP, and CPP, their GalA content increases sharply after two-step acid hydrolysis. Inulin and CPP are rich in Fru, and their Fru content is completely degraded after two-step acid hydrolysis from the original 54.5 mg/g in inulin and 41.1 mg/g in CPP. Different from other polysaccharides, GIP does not contain GalA and Fru. After two-step acid hydrolysis, the content of each monosaccharide changes little, and Glc is released more under more severe conditions. The quantification results of GIP detected using HPLC-DAD and GC-MS after one-step acid hydrolysis (119.1 mg/g by HPLC and 119.8 mg/g by GC) and two-step acid hydrolysis (178.1 mg/g by HPLC and 175.0 mg/g by GC) are similar, which indicated that the methods established in this study, both HPLC-DAD and GC-MS, are accurate for the quantification of monosaccharides. Furthermore, the result indicated that correct hydrolysis condition and suitable analytical method are the prerequisites for the accurate determination of monosaccharide composition.
The monosaccharide composition of five polysaccharides from different sources was also calculated as a percentage and compared with previous studies (Table S2). Inulin is mainly composed of Fru and Glc. The GalA accounts for 82.1% of the content of pectin, which is consistent with the structure of (1→4)-α-D-GalA as the backbone. Similar to pectin, LBP is also rich in acidic polysaccharides, and the content of GalA is 60.9%. Especially, both neutral inulin-type fructan and acidic polysaccharides are contained in CPP; therefore, the results based on the one-step hydrolysis coupled with GC analysis showed that 41.0% of Fru existed in CPP. And the results based on the two-step hydrolysis coupled with HPLC analysis showed that 74.4% of GalA was contained in LBP, but Fru could not be detected after the two-step hydrolysis. This result indicated that when analyzing the monosaccharide composition of complex polysaccharides, different hydrolysis conditions may need to be used simultaneously. Glc is the most abundant monosaccharide in GIP with a content of 75.4%, which is also consistent with the structure of glucan with (1→3)-β-Glc and (1→6)-β-Glc as backbone.

3.5. Evaluation of Monosaccharide Composition Determination Method

The structural characteristics and biological activities of polysaccharides from different sources are quite different, and monosaccharide composition is of great significance for the structural characterization of polysaccharides. Currently, there are still many studies focusing on the simultaneous separation of different types of monosaccharides. A different devitization method coupled with LC-MS/MS [45,46,47], and GC-MS [48,49,50] was developed for the accurate analysis of monosaccharides. Furthermore, NMR was also developed for the identification of pentosan polysulfate monosaccharide composition [51]. Nevertheless, based on the accessibility and stability of the method, PMP and aldononitrile acetate derivatization are still the most commonly used in the monosaccharide composition analysis of polysaccharides [5,21].
Therefore, in this study, a comparison of several commonly used methods for determining the monosaccharide composition is shown in Table 4. The colorimetric method can achieve the rapid determination of total sugar and uronic acid content with a simple operation and low equipment requirements. However, the inability to provide specific information on monosaccharide composition means that it cannot achieve the precise analysis of polysaccharide structures.
Three chromatographic methods were further compared to analyze the monosaccharide composition of polysaccharides from natural sources. The application scope of the three chromatography methods is different for the 16 kinds of monosaccharides, as summarized in Table 4. HPTLC is a simple, rapid, cost-effective, and visualized method for effective qualitative analysis. In this study, the HPTLC method was used to identify 12 monosaccharides, excluding sugar alcohols. It can analyze multiple samples simultaneously, and the type of uronic acid can also be determined visually and quickly based on the chromogenicity of monosaccharides and specific Rf values. In addition, HPLC-DAD and GC-MS methods could analyze different ranges of monosaccharides, as shown in Table 4. In particular, the HPLC method can perform PMP derivatization work on uronic acid, aldoses, and amino sugars, but it cannot derivate ketose and sugar alcohols, while the GC-MS method can detect aldoses, ketose, and sugar alcohols, but cannot detect uronic acid and amino sugars. Furthermore, compared with HPLC-DAD, GC-MS has a stronger separation ability, which has advantages for separating monosaccharides with similar structures. It can be seen in Table 4 that all the investigated monosaccharaides, except GlcA, GalA, and GlcN, which could not be derivated, were well separated and quantified via GC-MS.
Both the HPLC-DAD and GC-MS methods used in this study require derivatization. PMP is a commonly used derivatization reagent, and PMP-monosaccharide derivatives have an almost quantitative yield and are characterized by a significant degree of absorbance at 245 nm. The GC-MS method for the determination of the monosaccharide composition using the aldononitrile acetate derivative method is more tedious than the derivatization process of PMP and requires different derivatization methods for ketose and aldose. In terms of derivatization time, the PMP derivatization process required 1 h, while the aldononitrile acetate derivative method required at least 1–2 h (Table 4). In terms of the operation time, the HPTLC method requires at least 2 h to achieve plate preparation, sampling, developing, and detection, which is longer than required by the HPLC and GC-MS methods in one operation. However, HPTLC can analyze multiple samples simultaneously. In terms of the chromatographic analysis procedures, the HPTLC method does not require excessive time spent on instrumental analysis, whereas the HPLC-DAD method requires more analysis time. Except for the HPTLC method, both chromatographic methods have a good resolution and high sensitivity for the microanalysis of polysaccharides.

4. Conclusions

The effect of the hydrolysis condition and detection method on the monosaccharide composition analysis of polysaccharides was systematically investigated in this study. The results showed that the detection accuracy of chromogenic methods is affected by the color-rendering abilities of different monosaccharides, and the result is more accurate and stable when using Fru and GalA as reference substances. HPTLC can intuitively analyze multiple samples simultaneously, making it more suitable for the preliminary determination of monosaccharide composition and optimization of hydrolysis conditions. HPLC-DAD coupled with PMP derivatiztion can detect aldose, amino sugars, and uronic acid, but Fru cannot be detected. The selected derivative method coupled with GC-MS can separate aldose, ketose, and sugar alcohols well, but it cannot determine uronic acid and amino sugars. Finally, the monosaccharide composition of five polysaccharides from natural sources was analyzed by combining it with two hydrolysis methods. It was found that the two-step acid hydrolysis could release more uronic acid, but that the Fru would be destroyed. This study has reference significance for the rational selection of monosaccharide composition analysis methods and hydrolysis conditions for natural polysaccharides.

Supplementary Materials

The following supporting information can be downloaded at: https://www.mdpi.com/article/10.3390/separations11010002/s1, Table S1: Information of 16 investigated monosaccharides; Table S2: Structure information of five polysaccharides and monosaccharide composition ratio detected in this study; Table S3: Linearity of the HPTLC method for different carbohydrates; Table S4: Linearity and accuracy of the HPLC method for different carbohydrates; Table S5: Precision for of HPLC method; Table S6: Linearity and accuracy of the GC-MS method for different carbohydrates; Table S7: Precision for of GC-MS method (PDF).

Author Contributions

M.Z.: Data curation, Formal analysis, investigation, methodology, validation, Writing—original draft, writing—review and editing. F.K.: Formal analysis, Funding acquisition, investigation, methodology, Validation. Y.Z.: Formal analysis, methodology, validation, writing—review and editing. G.L.: Formal analysis, Funding acquisition, Project administration, supervision, Writing—review &review and editing. All authors have read and agreed to the published version of the manuscript.

Funding

The study was supported by grants from Major Natural Science Research Projects of Colleges and Universities in Jiangsu Province (22KJA360010) and the Postgraduate Research & Practice Inno-vation Program of Jiangsu Province (No. 181200003023339).

Data Availability Statement

Data are contained within the article and supplementary materials.

Acknowledgments

We greatly appreciate Xiaochen Gao’s contribution to this article during the paper revision process.

Conflicts of Interest

The authors declare no conflict of interest.

References

  1. Li, L.-F.; Zhang, Q.-W.; Han, Q.-B. Recent advances in qualitative and quantitative analysis of polysaccharides in natural medicines: A critical review. J. Pharm. Biomed. Anal. 2022, 220, 115016. [Google Scholar] [CrossRef] [PubMed]
  2. Zhou, S.; Huang, G.; Huang, H. Extraction, derivatization and antioxidant activities of onion polysaccharide. Food Chem. 2022, 388, 133000. [Google Scholar] [CrossRef] [PubMed]
  3. Chen, S.; Wang, J.; Dong, N.; Fang, Q.; Zhang, Y.; Chen, C.; Cui, S.W.W.; Nie, S. Polysaccharides from natural Cordyceps sinensis attenuated dextran sodium sulfate-induced colitis in C57BL/6J mice. Food Funct. 2023, 14, 720–733. [Google Scholar] [CrossRef] [PubMed]
  4. Li, F.; Wei, Y.; Liang, L.; Huang, L.; Yu, G.; Li, Q. A novel low-molecular-mass pumpkin polysaccharide: Structural characterization, antioxidant activity, and hypoglycemic potential. Carbohydr. Polym. 2021, 251, 117090. [Google Scholar] [CrossRef]
  5. Liu, D.; Tang, W.; Yin, J.-Y.; Nie, S.-P.; Xie, M.-Y. Monosaccharide composition analysis of polysaccharides from natural sources: Hydrolysis condition and detection method development. Food Hydrocoll. 2021, 116, 106641. [Google Scholar] [CrossRef]
  6. Seedevi, P. Antioxidant and anticoagulant activity of crude polysaccharide and a-L-Rhamnose from Grateloupia lithophila. Biomass Convers. Biorefin. 2022. [Google Scholar] [CrossRef]
  7. Sun, W.; Xu, J.-D.; Zhang, W.; Guo, M.-F.; Kong, M.; Zhu, H.; Zhou, S.S.; Wu, C.-Y.; Li, S.L.; Mao, Q. Holistic quality evaluation of Callicarpae Formosanae Folium by multi-chromatography-based qualitative and quantitative analysis of polysaccharides and small molecules. J. Pharm. Biomed. Anal. 2023, 227, 115282. [Google Scholar] [CrossRef]
  8. Si, H.; Chen, Y.; Yang, J.; Wen, X. Characterization and comparison of polysaccharides from Achyranthes bidentata, Cyathula officinalis and Achyranthes aspera by saccharides mapping. J. Pharm. Biomed. Anal. 2023, 227, 115272. [Google Scholar] [CrossRef]
  9. Deng, Y.; Chen, L.-X.; Han, B.-X.; Wu, D.-T.; Cheong, K.-L.; Chen, N.-F.; Zhao, J.; Li, S.-P. Qualitative and quantitative analysis of specific polysaccharides in Dendrobium huoshanense by using saccharide mapping and chromatographic methods. J. Pharm. Biomed. Anal. 2016, 129, 163–171. [Google Scholar] [CrossRef]
  10. Yue, F.; Zhang, J.; Xu, J.; Niu, T.; Lu, X.; Liu, M. Effects of monosaccharide composition on quantitative analysis of total sugar content by phenol-sulfuric acid method. Front Nutr. 2022, 9, 963318. [Google Scholar] [CrossRef]
  11. Wang, Q.-C.; Zhao, X.; Pu, J.-H.; Luan, X.-H. Influences of acidic reaction and hydrolytic conditions on monosaccharide composition analysis of acidic, neutral and basic polysaccharides. Carbohydr. Polym. 2016, 143, 296–300. [Google Scholar] [CrossRef] [PubMed]
  12. Guan, J.; Yang, F.-Q.; Li, S.-P. Evaluation of Carbohydrates in Natural and Cultured Cordyceps by Pressurized Liquid Extraction and Gas Chromatography Coupled with Mass Spectrometry. Molecules 2010, 15, 4227–4241. [Google Scholar] [CrossRef] [PubMed]
  13. Qin, J.; Wang, H.-Y.; Zhuang, D.; Meng, F.-C.; Zhang, X.; Huang, H.; Lv, G.-P. Structural characterization and immunoregulatory activity of two polysaccharides from the rhizomes of Atractylodes lancea (Thunb.) DC. Int. J. Biol. Macromol. 2019, 136, 341–351. [Google Scholar] [CrossRef] [PubMed]
  14. Yin, J.-Y.; Ma, L.-Y.; Xie, M.-Y.; Nie, S.-P.; Wu, J.-Y. Molecular properties and gut health benefits of enzyme-hydrolyzed konjac glucomannans. Carbohydr. Polym. 2020, 237, 116117. [Google Scholar] [CrossRef] [PubMed]
  15. Shi, H.; Wan, Y.; Li, O.; Zhang, X.; Xie, M.; Nie, S.; Yin, J. Two-step hydrolysis method for monosaccharide composition analysis of natural polysaccharides rich in uronic acids. Food Hydrocoll. 2020, 101, 105524. [Google Scholar] [CrossRef]
  16. De Ruiter, G.A.; Schols, H.A.; Voragen, A.G.; Rombouts, F.M. Carbohydrate analysis of water-soluble uronic acid-containing polysaccharides with high-performance anion-exchange chromatography using methanolysis combined with TFA hydrolysis is superior to four other methods. Anal. Biochem. 1992, 207, 176–185. [Google Scholar] [CrossRef] [PubMed]
  17. Banerjee, P.; Mukherjee, S.; Bera, K.; Ghosh, K.; Ali, I.; Khawas, S.; Ray, B.; Ray, S. Polysaccharides from Thymus vulgaris leaf: Structural features, antioxidant activity and interaction with bovine serum albumin. Int. J. Biol. Macromol. 2019, 125, 580–587. [Google Scholar] [CrossRef]
  18. Zhang, T.; Liu, H.; Bai, X.; Liu, P.; Yang, Y.; Huang, J.; Zhou, L.; Min, X. Fractionation and antioxidant activities of the water-soluble polysaccharides from Lonicera japonica Thunb. Int. J. Biol. Macromol. 2020, 151, 1058–1066. [Google Scholar] [CrossRef]
  19. Deng, Y.; Chen, C.; Chen, L.; Han, B.; Li, S.; Zhao, J. Fast saccharide mapping method for quality consistency evaluation of commercial xylooligosaccharides collected in China. J Pharm Anal. 2021, 11, 284–291. [Google Scholar] [CrossRef]
  20. Liu, C.-Y.; Hu, D.-J.; Zhu, H.; Zhang, Y.-Y.; Qin, J.; Wang, F.; Zhang, Z.-D.; Lv, G.-P. Preparation, characterization and immunoregulatory activity of derivatives of polysaccharide from Atractylodes lancea (Thunb.) DC. Int. J. Biol. Macromol. 2022, 216, 225–234. [Google Scholar] [CrossRef]
  21. Kurzyna-Szklarek, M.; Cybulska, J.; Zdunek, A. Analysis of the chemical composition of natural carbohydrates—An overview of methods. Food Chem. 2022, 394, 133466. [Google Scholar] [CrossRef] [PubMed]
  22. Zhao, L.; Wu, L.; Li, L.; Zhu, J.; Chen, X.; Zhang, S.; Li, L.; Yan, J.-K. Physicochemical, structural, and rheological characteristics of pectic polysaccharides from fresh passion fruit (Passiflora edulis f. flavicarpa L.) peel. Food Hydrocoll. 2023, 136, 108301. [Google Scholar] [CrossRef]
  23. Li, J.; Kisara, K.; Danielsson, S.; Lindstrom, M.E.; Gellerstedt, G. An improved methodology for the quantification of uronic acid units in xylans and other polysaccharides. Carbohydr. Res. 2007, 342, 1442–1449. [Google Scholar] [CrossRef] [PubMed]
  24. Bhanja, A.; Paikra, S.K.; Sutar, P.P.; Mishra, M. Characterization and identification of inulin from Pachyrhizus erosus and evaluation of its antioxidant and in-vitro prebiotic efficacy. J. Food Sci. Technol. 2023, 60, 328–339. [Google Scholar] [CrossRef] [PubMed]
  25. Du, M.; Cheng, X.; Qian, L.; Huo, A.; Chen, J.; Sun, Y. Extraction, Physicochemical Properties, Functional Activities and Applications of Inulin Polysaccharide: A Review. Plant Foods Hum. Nutr. 2023, 78, 243–252. [Google Scholar] [CrossRef] [PubMed]
  26. Mensink, M.A.; Frijlink, H.W.; Maarschalk, K.V.D.V.; Hinrichs, W.L.J. Inulin, a flexible oligosaccharide I: Review of its physicochemical characteristics. Carbohydr. Polym. 2015, 130, 405–419. [Google Scholar] [CrossRef] [PubMed]
  27. Shoaib, M.; Shehzad, A.; Omar, M.; Rakha, A.; Raza, H.; Sharif, H.R.; Shakeel, A.; Ansari, A.; Niazi, S. Inulin: Properties, health benefits and food applications. Carbohydr. Polym. 2016, 147, 444–454. [Google Scholar] [CrossRef]
  28. Duan, X.; Cheng, G.; Yang, E.; Yi, C.; Ruenroengklin, N.; Lu, W.; Luo, Y.; Jiang, Y. Modification of pectin polysaccharides during ripening of postharvest banana fruit. Food Chem. 2008, 111, 144–149. [Google Scholar] [CrossRef]
  29. Mohnen, D. Pectin structure and biosynthesis. Curr. Opin. Plant Biol. 2008, 11, 266–277. [Google Scholar] [CrossRef]
  30. Vityazev, F.V.; Golovchenko, V.V.; Patova, O.A.; Khlopin, V.A.; Kosolapova, N.V.; Dmitrenok, A.S.; Shashkov, A.S. Pectic polysaccharides of black radish taproots: Extraction, structural characterization. Food Chem. 2024, 436, 137692. [Google Scholar] [CrossRef]
  31. Christiaens, S.; Van Buggenhout, S.; Houben, K.; Kermani, Z.J.; Moelants, K.R.N.; Ngouemazong, E.D.; Van Loey, A.; Hendrickx, M.E.G. Process-Structure-Function Relations of Pectin in Food. Crit. Rev. Food Sci. Nutr. 2016, 56, 1021–1042. [Google Scholar] [CrossRef] [PubMed]
  32. Tian, X.; Liang, T.; Liu, Y.; Ding, G.; Zhang, F.; Ma, Z. Extraction, Structural Characterization, and Biological Functions of Lycium Barbarum Polysaccharides: A Review. Biomolecules 2019, 9, 389. [Google Scholar] [CrossRef] [PubMed]
  33. Masci, A.; Carradori, S.; Casadei, M.A.; Paolicelli, P.; Petralito, S.; Ragno, R.; Cesa, S. Lycium barbarum polysaccharides: Extraction, purification, structural characterisation and evidence about hypoglycaemic and hypolipidaemic effects. A review. Food Chem. 2018, 254, 377–389. [Google Scholar] [CrossRef] [PubMed]
  34. Wu, D.-T.; Guo, H.; Lin, S.; Lam, S.-C.; Zhao, L.; Lin, D.-R.; Qin, W. Review of the structural characterization, quality evaluation, and industrial application of Lycium barbarum polysaccharides. Trends Food Sci Technol. 2018, 79, 171–183. [Google Scholar] [CrossRef]
  35. Zou, Y.-F.; Chen, X.-F.; Malterud, K.E.; Rise, F.; Barsett, H.; Inngjerdingen, K.T.; Michaelsen, T.E.; Paulsen, B.S. Structural features and complement fixing activity of polysaccharides from Codonopsis pilosula Nannf. var. modesta L.T.Shen roots. Carbohydr. Polym. 2014, 113, 420–429. [Google Scholar] [CrossRef] [PubMed]
  36. Zou, Y.-F.; Zhang, Y.-Y.; Paulsen, B.S.; Fu, Y.-P.; Huang, C.; Feng, B.; Li, L.-X.; Chen, X.-F.; Jia, R.-Y.; Song, X.; et al. Prospects of Codonopsis pilosula polysaccharides: Structural features and bioactivities diversity. Trends Food Sci Technol. 2020, 103, 1–11. [Google Scholar] [CrossRef]
  37. Luan, F.; Ji, Y.; Peng, L.; Liu, Q.; Cao, H.; Yang, Y.; He, X.; Zeng, N. Extraction, purification, structural characteristics and biological properties of the polysaccharides from Codonopsis pilosula: A review. Carbohydr. Polym. 2021, 261, 117863. [Google Scholar] [CrossRef] [PubMed]
  38. Kou, F.; Ge, Y.; Wang, W.; Mei, Y.; Cao, L.; Wei, X.; Xiao, H.; Wu, X. A review of Ganoderma lucidum polysaccharides: Health benefit, structure-activity relationship, modification, and nanoparticle encapsulation. Int. J. Biol. Macromol. 2023, 243, 125199. [Google Scholar] [CrossRef]
  39. Ferreira, I.C.F.R.; Heleno, S.A.; Reis, F.S.; Stojkovic, D.; Queiroz, M.J.R.P.; Helena Vasconcelo, M.; Sokovic, M. Chemical features of Ganoderma polysaccharides with antioxidant, antitumor and antimicrobial activities. Phytochemistry 2015, 114, 38–55. [Google Scholar] [CrossRef]
  40. Wang, W.; Chen, F.; Wang, Y.; Wang, L.; Fu, H.; Zheng, F.; Beecher, L. Optimization of reactions between reducing sugars and 1-phenyl-3-methyl-5-pyrazolone (PMP) by response surface methodology. Food Chem. 2018, 254, 158–164. [Google Scholar] [CrossRef]
  41. Hung, W.-T.; Wang, S.-H.; Chen, C.-H.; Yang, W.-B. Structure determination of beta-glucans from Ganoderma lucidum with matrix-assisted laser desorption/ionization (MALDI) mass spectrometry. Molecules 2008, 13, 1538–1550. [Google Scholar] [CrossRef] [PubMed]
  42. Dong, Q.; Wang, Y.; Shi, L.; Yao, J.; Li, J.; Ma, F.; Ding, K. A novel water-soluble beta-D-glucan isolated from the spores of Ganoderma lucidum. Carbohydr. Res. 2012, 353, 100–105. [Google Scholar] [CrossRef] [PubMed]
  43. Lv, G.; Hu, D.; Zhao, J.; Li, S. Quality control of sweet medicines based on gas chromatography-mass spectrometry. Drug Discov. Ther. 2015, 9, 94–106. [Google Scholar] [CrossRef] [PubMed]
  44. Wang, T.-L.; Li, Y.-C.; Lin, C.-S.; Zou, Y.-P. Comprehensive analysis of natural polysaccharides from TCMs: A generic approach based on UPLC-MS/MS. Carbohydr. Polym. 2022, 277, 118877. [Google Scholar] [CrossRef] [PubMed]
  45. Wang, S.-L.; Wang, Y.; Wu, L.; Cai, Y.-Y.; Wang, Z.-C.; Alolga, R.N.; Qi, L.-W.; Li, B.; Huang, F.-Q. Paired Derivatization Approach with H/D-Labeled Hydroxylamine Reagents for Sensitive and Accurate Analysis of Monosaccharides by Liquid Chromatography Tandem Mass Spectrometry. Anal. Chem. 2022, 94, 3590–3599. [Google Scholar] [CrossRef]
  46. Qu, M.; Ma, S.; Huang, Y.; Yuan, H.; Zhang, S.; Ouyang, G.; Zhao, Y. LC-MS/MS-based non-isotopically paired labeling (NIPL) strategy for the qualification and quantification of monosaccharides. Talanta 2021, 231, 122336. [Google Scholar] [CrossRef] [PubMed]
  47. Couture, G.; Luthria, D.L.; Chen, Y.; Bacalzo, N.P., Jr.; Tareq, F.S.; Harnly, J.; Phillips, K.M.; Pehrsson, P.R.; McKillop, K.; Fukagawa, N.K.; et al. Multi-Glycomic Characterization of Fiber from AOAC Methods Defines the Carbohydrate Structures. J. Agric. Food Chem. 2022, 70, 14559–14570. [Google Scholar] [CrossRef] [PubMed]
  48. Gao, J.-N.; Li, Y.; Liang, J.; Chai, J.-H.; Kuang, H.-X.; Xia, Y.-G. Direct acetylation for full analysis of polysaccharides in edible plants and fungi using reverse phase liquid chromatography-multiple reaction monitoring mass spectrometry. J. Pharm. Biomed. Anal. 2023, 222, 115083. [Google Scholar] [CrossRef]
  49. Black, I.; Heiss, C.; Azadi, P. Comprehensive Monosaccharide Composition Analysis of Insoluble Polysaccharides by Permethylation to Produce Methyl Alditol Derivatives for Gas Chromatography/Mass Spectrometry. Anal. Chem. 2019, 91, 13787–13793. [Google Scholar] [CrossRef]
  50. Guan, Q.-Y.; Zhao, X.-H. Monosaccharide composition and in vivo immuno-stimulatory potential of soluble yam (Dioscorea opposita Thunb.) polysaccharides in response to a covalent Se incorporation. Food Chem. 2022, 396, 133741. [Google Scholar] [CrossRef]
  51. Eisele, G.; Alekseeva, A.; Bertini, S.; Gardini, C.; Paganini, D.; Fonseca, E.C.M.; Guerrini, M.; Naggi, A. Further advances in identification of pentosan polysulfate monosaccharide composition by NMR. J. Pharm. Biomed. Anal. 2023, 235, 115672. [Google Scholar] [CrossRef] [PubMed]
Figure 1. Schematic diagram of monosaccharide detection principle based on phenol sulfuric acid (A), carbazole sulfuric acid (B), m-hydroxybiphenyl (C) colorimetry, and the color development result of different reference substances and samples (D) of these three methods.
Separations 11 00002 g001
Figure 2. HPTLC chromatograms (A) and HPTLC densitograms (B) of four groups of mixed standards and natural polysaccharides from different sources under one-step or two-step acid hydrolysis. The isolated monosaccharide types include (1) Rha, (2) Xyl, (3) Rib, (4) Glc, (5) Gal, (6) GlcA, (7) Fuc, (8) Ara, (9) GlcN, (10) GalA, (11) and Fru and (12) Man.
Separations 11 00002 g002
Figure 3. Mechanism of PMP derivatization (A) and chromatogram of mixed standard (B), (CG) are HPLC chromatography of hydrolyzate of inulin, pectin, L. barbarum (LBP), C. pilosula (CPP) and G. lucidum (GIP), respectively. (The black line indicates one-step hydrolysis and the red line indicates two-step hydrolysis).
Separations 11 00002 g003
Figure 4. GC-MS standard chromatogram, in which (A) is the standard chromatogram of 12 aldoses and sugar alcohols, (B) is the standard chromatogram of ketose, and (C) is the chromatogram of polysaccharides from five different sources. (The black line indicates one-step hydrolysis and the red line indicates two-step hydrolysis).
Separations 11 00002 g004
Table 1. Linearity and accuracy of the chromogenic method for different carbohydrates.
MethodsCarbohydratesRegression EquationR2Linear Range (µg/mL)Accuracy (%)
Phenol–sulfuric acid methodGlcY = 0.0031X − 0.00370.99900–100163.0 ± 2.9%
FruY = 0.0045X − 0.00260.9991111.5 ± 2.0%
RhaY = 0.0036X + 0.00560.9982132.3 ± 2.5%
Carbazole sulfuric acid methodGalAY = 0.0039X + 0.00490.99910–80150.6 ± 5.4%
GlcAY = 0.0023X + 0.00390.9993205.3 ± 3.7%
M-hydroxybiphenyl methodGalAY = 0.0025X − 0.00550.99790–80190.4 ± 6.2%
GlcAY = 0.0014X − 0.00540.9971234.1 ± 3.0%
Table 2. Chromogenic results of polysaccharides from five different sources.
Chemical CompositionMethodsReference SubstanceInulin (%)Pectin (%)LBP (%)CPP (%)GIP (%)
Total sugarPhenol–sulfuric acid methodGlc-46.5 ± 1.040.7 ± 0.971.7 ± 1.124.7 ± 0.5
Fru89.5 ± 1.322.9 ± 0.519.9 ± 0.535.9 ± 0.611.7 ± 0.3
Rha-57.8 ± 1.250.5 ± 1.189.3 ± 1.430.6 ± 0.6
Uronic acidCarbazole sulfuric acid methodGalA18.3 ± 0.439.2 ± 0.223.0 ± 0.321.0 ± 0.36.6 ± 0.2
GlcA28.5 ± 0.359.1 ± 0.135.3 ± 0.232.5 ± 0.23.3 ± 0.1
M-hydroxybiphenyl methodGalA6.2 ± 0.239.5 ± 0.119.7 ± 0.216.7 ± 0.14.0 ± 0.1
GlcA14.3 ± 0.4-50.3 ± 0.542.2 ± 0.38.4 ± 0.3
-, the calculated value higher than 100%.
Table 3. Determination results of monosaccharide composition of five polysaccharides from different sources.
SamplesMonosaccharide Composition (mg/g)Total
AraXylRhaFucManGlcGalFruGalA
HPLCGCHPLCGCHPLCGCHPLCGCHPLC-HPLCGCHPLCGCHPLCGCHPLCGCHPLCGC
inulinOne-step- a---------77.0 ±
5.2
73.5 ±
4.7
--/ b54.5 ±
2.2
-/77.0128.0
Two-step----------50.4 ±
2.5
48.7 ±
3.9
--/--/50.748.7
pectinOne-step26.8 ±
2.7
28.8 ±
1.0
--5.5 ±
0.9
5.5 ±
0.2
----75.6 ±
9.8
74.4 ±
1.4
21.1 ±
3.4
21.3 ±
0.3
/-47.7 ±
10.8
/176.7130.0
Two-step23.8 ±
5.3
21.2 ±
2.0
--11.6 ±
2.6
10.3 ±
1.0
----30.3 ±
5.0
28.5 ±
2.0
19.1 ±
0.9
17.2 ±
1.7
/-388.9 ±
33.6
/473.877.3
LBPOne-step48.8 ±
0.1
46.9 ±
1.5
15.2 ±
2.3
14.3 ±
0.3
9.2 ±
2.2
9.5 ±
0.2
--4.3 ±
0.3
4.4 ±
0.1
28.4 ±
1.4
26.2 ±
1.8
23.9 ±
8.3
21.5 ±
1.6
/-40.0 ±
1.7
/169.9122.7
Two-step46.1 ±
1.6
44.7 ±
0.9
13.1 ±
3.8
11.8 ±
0.2
21.6 ±
4.0
20.5 ±
2.2
--3.6 ±
0.1
3.7 ±
0.1
12.9 ±
4.1
12.4 ±
0.1
21.7 ±
6.9
18.6 ±
1.6
/-184.9 ±
27.5
/303.8111.6
CPPOne-step22.4 ±
1.9
21.5 ±
0.2
--3.6 ±
0.6
3.5 ±
0.1
--3.3 ±
0.1
2.9 ±
0.2
20.5 ±
5.0
17.4 ±
1.3
12.9 ±
5.9
13.7 ±
0.9
/41.1 ±
2.4
70.4 ±
10.4
/133.1100.2
Two-step18.3 ±
4.5
18.0 ±
0.2
--7.0 ±
1.8
6.2 ±
0.1
--2.2 ±
0.2
2.7 ±
0.1
14.3 ±
0.4
14.0 ±
0.3
13.0 ±
3.1
12.5 ±
0.3
/-159.0 ±
11.5
/213.853.4
GIPOne-step--3.6 ±
5.1
4.2 ±
0.3
--5.5 ±
4.4
4.7 ±
0.1
12.8 ±
0.6
11.8 ±
0.3
88.4 ±
5.6
90.3 ±
2.8
8.9 ±
3.0
8.7 ±
0.4
/--/119.1119.8
Two-step--3.0 ±
2.3
3.8 ±
0.3
--6.5 ±
0.6
6.1 ±
1.1
15.0 ±
4.4
13.1 ±
0.4
141.8 ±
3.7
140.6 ±
3.9
11.8 ±
0.9
11.4 ±
0.3
/--/178.1175.0
(a) Cannot be derived; (b) not detected in the sample.
Table 4. Comparison of determination results of 16 investigated monosaccharides by chromogenic method and three chromatographic methods.
Carbohydrates or Compare ContentChromogenic MethodsHPTLCHPLC-DADGC-MS
RibND
AraDD
XylDD
RhaD
FucD
ManD
GlcD
GalD
FruDX
GlcAX
GalAX
GlcNDX
Ri-olXX
Xy-olXX
Ma-olXX
So-olXX
Derivatization time--60 min60 or 120 min
Operation time20–30 min120 min30 min20 min
Instrument analysis time2 min2 min55 min30 min
Detection sensitivityLowLowHigh, 0.19–0.42 μg/mLHigh, 0.12–0.80 μg/mL
Quantification accuracyLowLowHigh, 90.62–101.28%High, 84.4–99.94%
Note: √: both detection and separation are good; X: neither detection nor separation are good; D: detection is good but cannot be separated well; N: this operation is not required or cannot be performed.
Disclaimer/Publisher’s Note: The statements, opinions and data contained in all publications are solely those of the individual author(s) and contributor(s) and not of MDPI and/or the editor(s). MDPI and/or the editor(s) disclaim responsibility for any injury to people or property resulting from any ideas, methods, instructions or products referred to in the content.

