Article

HPLC-DAD Development and Validation Method for Short-Chain Fatty Acids Quantification from Chicken Feces by Solid-Phase Extraction

by
Lenin Rodolfo Díaz-Corona
1,
Karina Jeanette Parra-Saavedra
2,
Renata Sofia Mora-Alonzo
2,
María Esther Macías-Rodríguez
2,
Alma H. Martínez-Preciado
1,
Santiago José Guevara-Martínez
2,
Adalberto Zamudio-Ojeda
3 and
Adriana Macaria Macias-Lamas
2,*
1
Departamento de Ingeniería Química, Centro Universitario de Ciencias Exactas e Ingenierías, Universidad de Guadalajara, Blvd. Marcelino García Barragán #1421, Guadalajara 44430, Jalisco, Mexico
2
Departamento de Farmacobiología, Centro Universitario de Ciencias Exactas e Ingenierías, Universidad de Guadalajara, Blvd. Marcelino García Barragán #1421, Guadalajara 44430, Jalisco, Mexico
3
Departamento de Física, Centro Universitario de Ciencias Exactas e Ingenierías, Universidad de Guadalajara, Blvd. Marcelino García Barragán #1421, Guadalajara 44430, Jalisco, Mexico
*
Author to whom correspondence should be addressed.
Separations 2023, 10(5), 308; https://doi.org/10.3390/separations10050308
Submission received: 25 April 2023 / Revised: 8 May 2023 / Accepted: 10 May 2023 / Published: 13 May 2023
(This article belongs to the Special Issue HPLC: A Key Tool for Analytical Chemistry)

Abstract

:
A solid-phase extraction (SPE) process, followed by an HPLC-DAD method, was developed and validated to quantify short-chain fatty acids (SCFAs) and applied to analyze chicken feces samples. This study aimed to report the use of the STRATATM-X-A 96 Well Plate SPE cartridge method as the first step in quantifying SCFAs. A stationary reverse-phase Luna Omega C18 column kept at 40 °C was used, with a gradient elution mobile phase (H2SO4 and Acetonitrile, 98:2), a flow rate of 1.2 mL/min, and detection at 210 nm. A mixture of acetic, propionic, and butyric acid was used as thestandard. The method showed a linear relationship, with a coefficient of determination of R2 = 0.9987, R2 = 0.9985, and R2 = 0.9966 for acetic, propionic, and butyric acid, respectively. Concerning sensitivity, an LOD and LOQ of 0.14, 0.14, 0.14 mg/mL and 0.44, 0.45, 0.43 mg/mL were obtained for acetic, propionic, and butyric acid, respectively. According to the sample analysis, the accuracy was 76.05, 95.60, and 81.56% for acetic, propionic, and butyric acid, respectively. The developed method is simple, fast, linear, sensitive, accurate, precise, and robust for the quantification of SCFAs. This could serve as an alternative to conventional methodologies for the determination of these critical components in the intestinal health of chicken feces.

Graphical Abstract

1. Introduction

SCFAs are final products and metabolites of the anaerobic microbial fermentation of dietary fiber in the cecum of chickens, and almost all mammals [1]. SCFAs are compounds of less than six carbons, chemically composed of hydrocarbon chains. The most important compounds are acetic (AA), propionic (PA), and butyric (BA) acid, with two, three, and four carbons, respectively (Figure 1) [2]. These three compounds comprise 95% of the total SCFAs, and are mainly found in a proportion of 60/20/20, with acetic acid as the most abundant [3]. Although, during fermentation, the microorganisms produce a wide variety of components, SCFAs have gained in importance due to their positive effects on health.
SCFAs are used as indicators of good health because their levels are related to the pathological conditions or potential health benefits of the organism [4]. Many studies have shown the significant role of SCFAs in the regulation of intestinal health, strengthening the immune system, metabolism homeostasis, inhibiting intestinal inflammation, and avoiding pathogen adhesion in chickens. However, it is known that the main function of SCFAs is energy production through their absorption by enterocytes from the intestine [5]. SCFAs are considered important biomarkers to monitor intestinal health in chickens, where a good balance is fundamental to health and growth performance in chickens. It is important to note that, after the production of SCFAs, these are rapidly and efficiently absorbed, meaning that less of the 10% of SCFAs would be excreted in the feces [1]. This means that the sample pre-treatment and quantification accuracy must be as efficient as possible.
Numerous methodologies and pre-treatments allow for the quantification of SCFAs; however, these tend to be complex, laborious, and poorly accessible due to the cost and availability of the equipment used for this determination. SCFAs can be analyzed by different analytical methods, such as gas–liquid chromatography (GC), high-performance liquid chromatography (HPLC), nuclear magnetic resonance (NMR), capillary electrophoresis, and enzymatic detection [4]. The most-used technique is GC, as it is the most precise and quickly developed method. Nevertheless, GC analysis can cause structural modification to the acids due to the thermic degradation that occurs during the process, ending in total destruction of the sample in some cases. This technique also requires some sample pretreatments, such as filtration, centrifugation, and acidification, which may affect the structural and actual quantification of the sample [6,7,8]. These pre-treatments may carry some impurities, be time-consuming, or cause the loss of acid due to evaporation, which complicates the quantification of the three acids. This generates the need to develop a simple, economically effective, and robust SCFAs method for routine quantification. When discussing HPLC, the reverse phase is the most common stationary phase, along with a hydrophilic mobile phase, usually water, a buffer, or a polar solvent. This technique does not require high temperatures to separate the compounds compared to GC, which allows for the determination of thermally labile compounds [9]. However, it also requires samply pre-treatment and the optimization of running conditions for a more accurate analysis to enhance UV detection. The most common sample pretreatments for HPLC analysis include derivatization, centrifugation and acidification, with the latter being the most common [10,11,12]. However, according to the literature, the detection limits of SCFAs using HPLC highly depend on the sensitivity of the applied detector [4]. Different types of detectors have been used to quantify SCFAs by HPLC (UV, variable-length detectors, electrochemical, conductivity, and refractive index detectors) [13,14,15,16]. However, these detectors are not as accessible, require additional sample preparation, or are specific to certain types of compounds. Among these detectors, the diode array detector (DAD) stands out, belonging to the group of variable-length detectors, where the absorption is monitored at different wavelengths, allowing for the simultaneous detection of one or several analytes [17]. This makes it a very versatile detector for HPLC in experiments where the goal is to identify and quantify several compounds of interest.
The feces consist of a mixture of many components produced during the gastrointestinal process by the intestinal microbiota, which makes it a difficult sample to quantify. It is for this reason that sample pre-treatment is a crucial step in the detection of SCFAs. Different efforts have been developed to quantify SCFAs using HPLC. Some of these pre-treatments may be fast, have good purity, and require a low-temperature processes. However, some disadvantages of these methods include column overload, loss of SCFAs, time consumption, and unspecific results [4]. SCFAs are partially hydrophilic, which makes their quantitative extraction in hydrophobic organic solvents difficult. However, acidification is often applied to keep acids protonated in the sample, facilitating better extraction [18]. Knowing this, it is important to develop a method for the better determination of the SCFAs. One of these possible paths is SPE, a green and simple technique for the pre-treatment of samples. This serves to concentrate the analyte due to the capacity to retain the compounds of interest through interaction with the solid phase. The complexity of the samples and the physicochemical characteristics of SPE establishes a powerful tool to remove interferences. SPE proved to be a very effective technique for cleaning up samples with a good extraction capacity and allows for enrichment of the analyte, which improves its selectivity [19]. SPE is based on the polarity of the solid phase and the target analyte, which is key to analyte attachment and other compounds’ discard [20]. SPE is a low organic solvent-consumption technique, where the adsorbent material is the most important factor when cleaning up the sample, benefitting the lifespand of the column and equipment.
The aim of this study is to develop an accurate SPE method for the retention and posterior quantification of SCFAs from chicken feces’ samples using HPLC-DAD. This will allow for the development of a rapid, simple, rentable, and validated method to determine the presence of acetic, propionic, and butyric acid in chicken feces.

2. Materials and Methods

2.1. Chemicals and Reagents

Sulfuric acid, acetic acid, propionic acid, butyric acid, and monobasic potassium phosphate were supplied by Sigma-Aldrich (St. Louis, MO, USA). Acetonitrile, methanol, and water of analytical grade for HPLC were purchased from JT Baker (Radnor, PA, USA).

2.2. Sample Collection

For studies with chicken feces, these were donated by local farms in the city of Guadalajara, Jalisco, Mexico. Samples were collected directly from the chicken cloaca and were homogenized before being used for analysis.

2.3. Instrumentation and Chromatographic Conditions

The chromatographic analysis was performed on an HPLC (Agilent 1260 Infinity, Santa Clara, CA, USA). It consisted of a solvent cabinet, quaternary pump, autosampler, a thermostated column compartment, and a diode array detector. A Luna Omega Polar C18 (150 × 4.6 mm, 5 μm) (Phenomenex, Torrance, CA, USA) column at 40 °C was used as the stationary phase, with a gradient elution program for the mobile phase and flow rate, as shown in Table 1. An injection volume of 20 µL was used in a 15 min run, and the UV absorbance was measured at 210 nm using a DAD detector.

2.4. Preparation of Standard Stock Solution

A solution composed of a mixture of 50 μL of acetic acid, propionic acid, and butyric acid with 850 μL of water (HPLC grade) was used as the standard stock solution (50 mg/mL). Then, 500 μL of the standard stock solution with 500 μL of water was used as the intermediate standard solution (25 mg/mL). The latter was used for linearity analysis.

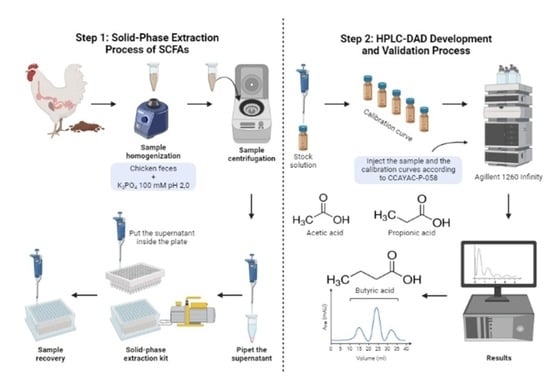
2.5. Solid-Phase Extraction (SPE)

SPE extraction of SCFAs was carried out using a polymeric strong anion STRATATM-X-A (Phenomenex, Torrance, CA, USA) 96-well cartridge connected to a vacuum manifold. For sample treatment, 100 mg of chicken feces was weighed in an Eppendorf tube and mixed with 1 mL of phosphate of potassium solution(K2HPO4) 100 mM pH 2.0. The sample was homogenized for 5 min, and then centrifugated for 10 min at 10,000 rpm; the supernatant was recovered for SPE. For cartridge pre-treatment, each well was conditioned with 500 µL of methanol, then equilibrated with 500 µL of HPLC water, followed by sample loading of the previously obtained supernatant. Then, 500 µL of K2HPO4 20 mM pH 2.0 was added to the cartridge and dried for 5 min to obtain the first sample elution. Finally, 500 µL of methanol was added until dried to collect the second sample elution in HPLC vials.

2.6. Validation Method

The analytical method for the determination was validated to demonstrate that the method is suitable for its intended purpose. The method was validated following the instructions of CCAYAC-P-058 for the validation of physicochemical methods, a document authorized by Secretaría de Salud of México. The subsequent performance parameters were evaluated according to this guideline. High-purity AA, PA, and BA were used as standards for method development and validation.

2.6.1. Linearity and Range

To verify the linearity and range parameters of the method, analyses were carried out in triplicate for each prepared solution in five different concentrations (1.0, 1.25, 1.5, 1.75, and 2.0 mg/mL). For linearity, results were plotted (mAU vs. concentration) and a regression analysis was conducted; results were expressed as determination coefficient (R2). In the case of the range, this was determined by plotting the concentration obtained vs. added concentration, obtaining the slope (m) and correlation coefficient (R).

2.6.2. Limit of Detection (LOD) and Limit of Quantification (LOQ)

LOD and LOQ were evaluated with five concentrations (1.0, 1.25, 1.5, 1.75, and 2.0 mg/mL) in triplicate. Based on this, the slope (m), and standard deviation of the origin ordinate (sb0) of the analytical response vs. added concentration were calculated. To determine the limits, the following formulas were used:
LOD = 3.3 * sb 0 m
LOQ = 10 * sb 0 m

2.6.3. Accuracy Study

The accuracy of the method was evaluated at five levels (1.0, 1.25, 1.50, 1.75, and 2.0 mg/mL) in triplicate. This was calculated as the percentage of recovered concentration for each level of added concentration.

2.6.4. Precision Study

Repeatability

To demonstrate the closeness between individual analytical results for repeatability, three concentration levels (1.0, 1.5, and 2.0 mg/mL) of the calibration curve were evaluated in triplicate by the same analyst, using the same equipment on two different days. Results were expressed as recovery (%), and mean; standard deviation and RSD % of recovery were calculated for each level.

Reproducibility

To demonstrate the reproducibility of the method, three concentration levels (1.0, 1.5, and 2.0 mg/mL) of the calibration curve were evaluated in triplicate, using the same equipment, on three different days; they were evaluated by a second analyst on the third day. Results were expressed as recovery (%), and mean; standard deviation and RSD % of recovery were calculated for each level.

2.6.5. Robustness

Changes in the chromatographic conditions were made to test the robustness of the developed method. Table 2 presents these variations in the method for the quantification of SCFAs. Each modification was evaluated independently, and each analysis was performed in duplicate according to the validation guide. A medium concentration of 1.5 mg/mL of each acid was used as a reference standard.

2.6.6. Recovery

Recovery of SCFAs from the sample was evaluated in duplicate with feces samples spiked with a concentration of 1.5 mg/mL of each acid and a standard solution mixture at the same concentration. Both were processed by the previously described SPE method and the percentage recovery was calculated for each SCFA compared to the processed standard solution.

3. Results

Different mobile phases, flow rates, and column temperatures were tested to improve the detection and resolution and decrease the retention time of the three acids in a single run. Firstly, during the development of the method, acids were tested separately to monitor their behavior and find their retention times. Then, a mixed solution with the same acid concentration was used for posterior studies to optimize the chromatographic run. The use of low pH values was essential during the chromatographic process, mainly for the SPE. In the same way, the increase in temperature column improved peaks’ symmetry, where a reversed-phase C18 column was the suitable stationary phase. At the end of the method’s development, three SCFA standards were efficiently separated and quantified: acetic acid (retention time = 2.62 min), propionic acid (rt = 4.88 min), and butyric acid (rt = 9.90 min).

3.1. Solid-Phase Extraction Process

For the SPE process, different elution solutions, concentrations, solvents, and pH variations were tested to find the best conditions for cartridge and sample preparation. Finally, the best conditions consisted of the use of a solution of K2HPO4 100 mM pH 2.0 for sample pre-treatment. For the elution, K2HPO4 20 mM pH 2.0 for the first elution and methanol for the second elution resulted in the best SCFAs quantification process. The use of cartridges served as an efficient solid-phase extraction process to partially purify the acids and make their quantification possible.

3.2. Validation Method

The quantification method of HPLC-DAD was validated to determine AA, PA, and BA in chicken feces. The corresponding values of these parameters are shown in Table 3.

3.2.1. Linearity and Range

The linearity and range of the method were determined based on five different concentrations (1, 1.25, 1.5, 1.75, and 2 mg/mL) of AA, PA, and BA, tested in triplicate. The method showed a linear relationship in a range of 1–2 mg/mL (Figure 2), with a coefficient of determination of R2 = 0.9987, 0.9985, and 0.9966 for AA, PA, and BA, respectively. Figure 3 shows the chromatographs of the mobile phase blank (a), while the bottom of the figure shows the standard curve (b) used for method validation.

3.2.2. LOD and LOQ

The range of concentrations used could satisfactorily determine these two parameters, with an LOD as low as 0.1456, 0.1496, and 0.1428 mg/mL for AA, PA, and BA, respectively. For LOQ determination, the obtained values were 0.4412, 0.4533, and 0.4327 mg/mL for AA, PA, and BA, respectively. These results represent the lowest amount of compound used, which can be reliably detected and quantified.

3.2.3. Accuracy

In terms of accuracy, the concentration percentages were 99.98 ± 1.58%, 99.98 ± 1.27%, and 99.98 ± 1.40% for AA, PA, and BA, respectively. These results represent the average recovery of each acid at all concentrations over the three days of analysis and the three daily curves.

3.2.4. Precision

According to CCAYAC-P-058, this parameter denotes repeatability (intraday) and reproducibility (interday). These results are shown in Table 4, where it is possible to appreciate the recovery, RSD, and SD of each acid at three concentration levels (1.0, 1.5, 2.0 mg/mL). Accuracy in all cases is between 99 and 100%, while RSD % values are below 1.63%.

3.2.5. Robustness

Four conditions of the developed method were modified to determine its effect on the quantification of the SCFAs. According to the robustness results shown in Table 5, the wavelength factor resulted in a significant difference in the accuracy percentage of the acids, while other modified conditions remained constant. With respect to retention time, an increase in column temperature (50 °C) decreased the retention time of the three acids with respect to normal conditions, affecting the peak shapes.

3.2.6. Recovery Analysis of Chicken Feces Samples

To evaluate the applicability of the validated HPLC-DAD method, fresh samples of chicken feces were analyzed. The method was tested for an SPE of a standard mixture of AA, PA, and BA compared to spiked feces samples at a concentration of 1.5 mg/mL. As seen, the sample processed by the SPE method showed good recoveries of 76.05%, 95.60%, and 81.56% for AA, PA, and BA, respectively, compared to those obtained by a standard mixture of the acids. Figure 4a shows the chromatogram of the first elution obtained by SPE, while chromatogram (b) shows the second elution obtained during the SPE.

4. Discussion

Short-chain fatty acids represent valuable biomarkers of chicken intestinal health, and their role in metabolism, immune processes, inflammation, and tumor proliferation has also been demonstrated. Therefore, the monitoring of these molecules provides very important information regarding the state of health, quality, and productivity in the poultry industry. Different methods for the quantification of SCFAs in chicken using gas chromatography have been developed [21,22,23,24]. However, their quantification represents a challenge, since the sample pretreatment processes can be rough and time-consuming, and the equipment and consumables are expensive, making this a technology with low accessibility.
An exploration of the quantification of SCFAs by HPLC was undertaken; however, these methodologies are based on an analysis of these acids produced by the fermentation of in vitro cultured bacteria [25,26]. In this study, a developed and validated HPLC-DAD method was presented as an alternative to a simple, accurate, precise, and selective methodology for the quantification of SCFAs in chicken feces. This method has advantages over other developed methodologies, since it represents a simple SPE process for sample pre-treatment, and a 15 min analysis runtime can quantify AA, PA, and BA, the three most important acids for intestinal health, with the use of a single chromatographic run. The developed method was efficiently validated, fulfilling all CCAYAC parameters. It proved to be linear, with good quantification and detection limits, as well as efficient accuracy processes, with repeatability and reproducibility. The validated method resulted in noticeable robustness, with the results showing that these changes did not alter the quantification of the acids except for the column temperature. When there is an increase in temperature, the retention time of the three acids decreased significantly, causing the peaks, although quantifiable, to change their retention time considerably. However, this can be explained by an increase in the internal pressure of the column, which leads to an acceleration in the elution of the compounds [27].
Although the developed methodology is challenging to validate, the behavior of the conditions is very different when an analysis is performed with biological samples. The main reason for the research was to use the developed method in the actual analysis of chicken feces samples. A feces sample is a complex mix of biomolecules, organic compounds, and microorganisms, presenting a challenge regarding the isolation and identification of several components using chromatographic methods [28]. A possible solution to this issue is sample pre-treatment using an SPE cartridge, which is designed to clean biological samples by removing interferences and concentrating the analyte, increasing the chances of its quantification. The SPE STRATATM-X-A cartridge consists of a strong anion exchange reverse phase of di-methyl butyl quaternary amine ligand. Thus, it can retain weak acids with a pKa > 2, which indicates an affinity for this type of compound. This is why it works for the retention of SCFAs, since AA, PA, and BA are weak acids with a pKa of 4.76, 4.87, and 4.82, respectively, indicating that these compounds exist in their anionic form [29]. This is shown by the similarity of the structures of the three acids, which share the -CH2COOH termination [30]. However, when we look at the chromatograms obtained from the HPLC analysis of the spiked sample, AA is revealed in the first elution, while PA is revealed in both elutions and butyric acid is revealed in the second elution. This can be explained by the structure of the molecule. Although sharing much of its structure, BA has two additional carbons in its structure, which allows it to have a more stable and stronger interaction with the quaternary amine in the solid phase of the cartridge. In the case of PA, a partial retention can be observed in the cartridge; however, this interaction is not strong enough, so it is necessary to quantify it in both elutions, which still yields reliable and congruent results. Wang et al. [31] employed an SPE pretreatment to quantify SCFAs in human feces, detecting up to 10 acids using an HPLC-UV-Vis. Nevertheless, they performed a 3-nitrophenylhydrazine derivatization of the acids, developing a multi-step SPE. However, the pretreatment included a segmented elution of the acids, requiring a couple of gradient chromatographic runs of up to 50 min each per sample.
When a comparison was made of the treated standards and the spiked feces sample, the recovery of the acids was very good, up to 95.60% for PA, and 81.56% for BA. However, in the analysis of AA, a lower recovery of the acid can be observed (76.05%). This may be because, when the sample is subjected to the SPE process, the acetic acid may be lost, as it is considered one of the main volatile organic acids [32]. These results are comparable with those obtained by other authors [26,31,33] for the analysis of SCFAs by HPLC; however, these studies are focused on humans and a more complex and time-consuming sample pre-treatment process. Dobrowolska-Iwanek et al. [33] reported the use of HPLC-DAD to quantify SCFAs in neonatal meconium, with recovery rates higher than 90%. However, the extraction process consisted of drying, ultrasound exposition, agitation, and filtration of the sample, generating a pre-treatment of more than 2.5 h per sample. In addition to risking the integrity of the acids due to their volatility, this method requires the use of two different conditions to quantify all the acids in 35 min runs.
A simple and fast method was validated and meets the ideal characteristics, with the capacity to quantify three compounds in a single chromatographic run in a relatively short time. The main contribution of this study was to capture the use of the cartridge and overcome the long and multistep traditional process. In addition, few publications focused on the direct quantification of SCFAs using HPLC-DAD in chicken feces, which, at the final step, corresponds to monitoring the health of one of the most-consumed products worldwide. These results open up the possibility of employing this method with another matrix from other organisms to quantify the SCFAs. However, future studies need to be made to adapt the methodology to the matrix that is to be analyzed and improve the selection of the acids, allowing for a better and easier quantification of SCFAs.

5. Conclusions

The SCFAs of chicken feces samples can be quantified simultaneously in a single HPLC-DAD run, supported by a pre-treatment with SPE. This validated method proved to be lineal, accurate, precise, and robust. Is important to note that all parameters suggested by CCAYAC-P-058 were achieved for the validation of the method. This methodology represents a simple and fast process for the routine quantification of SCFAs of chicken feces in HPLC, since the incorporation of an SPE cartridge can allow for the analysis of multiple samples. Despite being a complex matrix, the good recoveries of SCFAs from chicken feces demonstrated the utility and reliability of the developed method for extraction with SPE and HPLC-DAD quantification of the acetic, propionic, and butyric acid.

Author Contributions

Conceptualization, A.M.M.-L. and M.E.M.-R.; methodology, K.J.P.-S.; validation, L.R.D.-C. and R.S.M.-A.; formal analysis, L.R.D.-C.; investigation, A.H.M.-P.; resources, A.Z.-O.; data curation, K.J.P.-S.; writing—original draft preparation, L.R.D.-C.; writing—review and editing, K.J.P.-S., A.M.M.-L. and S.J.G.-M.; supervision, A.M.M.-L. All authors have read and agreed to the published version of the manuscript.

Funding

This research received no external funding.

Data Availability Statement

The data presented in this study is available on request from the corresponding author.

Acknowledgments

We are grateful for the support provided by the Centro Universitario de Ciencias Exactas e Ingenierías of the Universidad de Guadalajara for this research.

Conflicts of Interest

The authors declare no conflict of interest.

References

  1. Hu, J.; Lin, S.; Zheng, B.; Cheung, P.C.K. Short-chain fatty acids in control of energy metabolism. Crit. Rev. Food Sci. Nutr. 2018, 58, 1243–1249. [Google Scholar] [CrossRef]
  2. Ali, Q.; Ma, S.; La, S.; Guo, Z.; Liu, B.; Gao, Z.; Farooq, U.; Wang, Z.; Zhu, X.; Cui, Y.; et al. Microbial short-chain fatty acids: A bridge between dietary fibers and poultry gut health: A review. Anim. Biosci. 2022, 35, 1461–1478. [Google Scholar] [CrossRef]
  3. den Besten, G.; van Eunen, K.; Groen, A.K.; Venema, K.; Reijngoud, D.J.; Bakker, B.M. The role of short-chain fatty acids in the interplay between diet, gut microbiota, and host energy metabolism. J. Lipid Res. 2013, 54, 2325–2340. [Google Scholar] [CrossRef]
  4. Primec, M.; Mičetić-Turk, D.; Langerholc, T. Analysis of short-chain fatty acids in human feces: A scoping review. Anal. Biochem. 2017, 526, 9–21. [Google Scholar] [CrossRef]
  5. Liu, L.; Li, Q.; Yang, Y.; Guo, A. Biological Function of Short-Chain Fatty Acids and Its Regulation on Intestinal Health of Poultry. Front. Vet. Sci. 2021, 8, 1–13. [Google Scholar] [CrossRef] [PubMed]
  6. Chen, H.M.; Yu, Y.N.; Wang, J.L.; Lin, Y.W.; Kong, X.; Yang, C.Q.; Yang, L.; Liu, Z.J.; Yuan, Y.Z.; Liu, F.; et al. Decreased dietary fiber intake and structural alteration of gut microbiota in patients with advanced colorectal adenoma. Am. J. Clin. Nutr. 2013, 97, 1044–1052. [Google Scholar] [CrossRef] [PubMed]
  7. Cuervo, A.; Salazar, N.; Ruas-Madiedo, P.; Gueimonde, M.; González, S. Fiber from a regular diet is directly associated with fecal short-chain fatty acid concentrations in the elderly. Nutr. Rsch. 2013, 33, 811–816. [Google Scholar] [CrossRef] [PubMed]
  8. Weir, T.L.; Manter, D.K.; Sheflin, A.M.; Barnett, B.A.; Heuberger, A.L.; Ryan, E.P. Stool Microbiome and Metabolome Differences between Colorectal Cancer Patients and Healthy Adults. PLoS ONE 2013, 8, e70803. [Google Scholar] [CrossRef] [PubMed]
  9. Fernández, R.; Dinsdale, R.M.; Guwy, A.J.; Premier, G.C. Critical analysis of methods for the measurement of volatile fatty acids. Crit. Rev. Environ. Sci. Technol. 2016, 46, 209–234. [Google Scholar] [CrossRef]
  10. Torii, T.; Kanemitsu, K.; Wada, T.; Itoh, S.; Kinugawa, K.; Hagiwara, A. Measurement of short-chain fatty acids in human faeces using high-performance liquid chromatography: Specimen stability. Ann. Clin. Biochem. Int. J. Lab. Med. 2010, 47, 447–452. [Google Scholar] [CrossRef] [PubMed]
  11. Kotani, A.; Miyaguchi, Y.; Kohama, M.; Ohtsuka, T.; Shiratori, T.; Kusu, F. Determination of Short-chain Fatty Acids in Rat and Human Feces by High-Performance Liquid Chromatography with Electrochemical Detection. Anal. Sci. 2009, 25, 1007–1011. [Google Scholar] [CrossRef] [PubMed]
  12. Underwood, M.A.; Salzman, N.H.; Bennett, S.H.; Barman, M.; Mills, D.; Marcobal, A.; Tancredi, D.J.; Bevins, C.L.; Sherman, M.P. A Randomized Placebo-controlled Comparison of 2 Prebiotic/Probiotic Combinations in Preterm Infants: Impact on Weight Gain, Intestinal Microbiota, and Fecal Short-chain Fatty Acids. J. Pediatr. Gastroenterol. Nutr. 2009, 48, 216–225. [Google Scholar] [CrossRef] [PubMed]
  13. Ferrario, C.; Taverniti, V.; Milani, C.; Fiore, W.; Laureati, M.; De Noni, I.; Stuknyte, M.; Chouaia, B.; Riso, P.; Guglielmetti, S. Modulation of Fecal Clostridiales Bacteria and Butyrate by Probiotic Intervention with Lactobacillus paracasei DG Varies among Healthy Adults. J. Nutr. 2014, 144, 1787–1796. [Google Scholar] [CrossRef]
  14. Farnworth, E.R.; Chouinard, Y.P.; Jacques, H.; Venkatramanan, S.; Maf, A.A.; Defnoun, S.; Jones, P.J. The effect of drinking milk containing conjugated linoleic acid on fecal microbiological profile, enzymatic activity, and fecal characteristics in humans. Nutr. J. 2007, 6, 1787–1796. [Google Scholar] [CrossRef]
  15. Okazaki, M.; Matsukuma, S.; Suto, R.; Miyazaki, K.; Hidaka, M.; Matsuo, M.; Noshima, S.; Zempo, N.; Asahara, T.; Nomoto, K. Perioperative synbiotic therapy in elderly patients undergoing gastroenterological surgery: A prospective, randomized control trial. Nutrition 2013, 29, 1224–1230. [Google Scholar] [CrossRef]
  16. Shimizu, K.; Ogura, H.; Asahara, T.; Nomoto, K.; Matsushima, A.; Hayakawa, K.; Ikegawa, H.; Tasaki, O.; Kuwagata, Y.; Shimazu, T. Gut microbiota and environment in patients with major burns—A preliminary report. Burns 2015, 41, e28–e33. [Google Scholar] [CrossRef]
  17. Wysocki, J.; Dong, M. Ultraviolet detectors: Perspectives, principles, and practices. LCGC N. Am. 2019, 37, 750–759. [Google Scholar]
  18. Zhao, G.; Nyman, M.; Åke-Jönsson, J. Rapid determination of short-chain fatty acids in colonic contents and faeces of humans and rats by acidified water-extraction and direct-injection gas chromatography. Biomed. Chromatogr. 2006, 20, 674–682. [Google Scholar] [CrossRef]
  19. Zheng, J.; Kuang, Y.; Zhou, S.; Gong, X.; Ouyang, G. Latest Improvements and Expanding Applications of Solid-Phase Microextraction. Anal. Chem. 2023, 95, 218–237. [Google Scholar] [CrossRef]
  20. Hu, T.; Chen, R.; Wang, Q.; He, C.; Liu, S. Recent advances and applications of molecularly imprinted polymers in solid-phase extraction for real sample analysis. J. Sep. Sci. 2021, 44, 274–309. [Google Scholar] [CrossRef] [PubMed]
  21. Gong, Y.; Hua, Y.; Xin, W.; Wenrui, X.; Wentao, L.; Yingping, X.; Xiaoting, Z. Early Intervention with Cecal Fermentation Broth Regulates the Colonization and Development of Gut Microbiota in Broiler Chickens. Front. Microbiol. 2019, 10, 1422. [Google Scholar] [CrossRef] [PubMed]
  22. Qiu, M.; Hu, J.; Peng, H.; Li, B.; Xu, J.; Song, X.; Kong, F. Research Note: The gut microbiota varies with dietary fiber levels in broilers. Poult. Sci. 2022, 101, 101922. [Google Scholar] [CrossRef] [PubMed]
  23. Zhang, J.; Liu, M.; Gu, X.Y.; Xu, W.; Jiao, H.Y.; Zhao, H.C.; Lin, H. Different effects of probiotics and antibiotics on the composition of microbiota, SCFAs concentrations and FFAR2/3 mRNA expression in broiler chickens. J. Appl. Microbiol. 2021, 131, 913–924. [Google Scholar] [CrossRef]
  24. Zhang, J.; Cai, K.; Mishra, R.; Jha, R. In ovo supplementation of chitooligosaccharide and chlorella polysaccharide affects cecal microbial community, metabolic pathways, and fermentation metabolites in broiler chickens. Poult. Sci. 2020, 99, 4776–4785. [Google Scholar] [CrossRef]
  25. Hati, S.; Patel, M.; Mishra, B.K.; Das, S. Short-chain fatty acid and vitamin production potentials of Lactobacillus isolated from fermented foods of Khasi Tribes, Meghalaya, India. Ann. Microbiol. 2019, 69, 1191–1199. [Google Scholar] [CrossRef]
  26. De Baere, S.; Eeckhaut, V.; Steppe, M.; De Maesschalck, C.; De Backer, P.; Van Immerseel, F.; Croubels, S. Development of a HPLC–UV method for the quantitative determination of four short-chain fatty acids and lactic acid produced by intestinal bacteria during in vitro fermentation. J. Pharm. Biomed. Anal. 2013, 80, 107–115. [Google Scholar] [CrossRef] [PubMed]
  27. Idroes, R.; Idroes, G.M.; Suhendra, R. The effect of column and temperature variation on the determination of the dead time in gas chromatographic systems using indirect methods. Heliyon 2020, 6, e03302. [Google Scholar] [CrossRef]
  28. Matysik, S.; Le Roy, C.I.; Liebisch, G.; Claus, S.P. Metabolomics of fecal samples: A practical consideration. Trends Food Sci. Technol. 2016, 57, 244–255. [Google Scholar] [CrossRef]
  29. Hurst, N.R.; Kendig, D.M.; Murthy, K.S.; Grider, J.R. The short chain fatty acids, butyrate and propionate, have differential effects on the motility of the guinea pig colon. Neurogastroenterol. Motil. 2014, 26, 1586–1596. [Google Scholar] [CrossRef]
  30. Zidwick, M.J.; Chen, J.S.; Rogers, P. The Prokaryotes: Organic Acid and Solvent Production: Propionic and Butyric Acids and Ethanol, 4th ed.; Springer Reference: New York, NY, USA, 2013; pp. 135–167. [Google Scholar]
  31. Wang, H.Y.; Wang, C.; Guo, L.X.; Zheng, Y.F.; Hu, W.H.; Dong, T.T.; Tsim, K.W. Simultaneous determination of short-chain fatty acids in human feces by HPLC with ultraviolet detection following chemical derivatization and solid-phase extraction segmental elution. J. Sep. Sci. 2019, 42, 2500–2509. [Google Scholar] [CrossRef]
  32. Zhang, L.; Tsui, T.H.; Loh, K.C.; Dai, Y.; Tong, Y.W. Acidogenic Fermentation of Organic Wastes for Production of Volatile Fatty Acids in Biomass, Biofuels, Biochemicals; Elsevier: Amsterdam, The Netherlands, 2022; pp. 343–366. [Google Scholar] [CrossRef]
  33. Dobrowolska-Iwanek, J.; Lauterbach, R.; Huras, H.; Paśko, P.; Prochownik, E.; Woźniakiewicz, M.; Zagrodzki, P. HPLC-DAD method for the quantitative determination of short-chain fatty acids in meconium samples. Microchemical. J. 2020, 155, 104671. [Google Scholar] [CrossRef]
Figure 1. Short-chain fatty acids, (a) acetic acid (AA), (b) propionic acid (PA), and (c) butyric acid (BA).
Separations 10 00308 g001
Figure 2. Lineal regression of acetic acid, propionic acid, and butyric acid at five different concentrations (1.0, 1.25, 1.5, 1.75, and 2.0 mg/mL).
Separations 10 00308 g002
Figure 3. Chromatograms of (a) mobile phase blank and (b) standard curve (1–2 mg/mL) of (1) acetic acid, (2) propionic acid, and (3) butyric acid.
Separations 10 00308 g003
Figure 4. Chromatograms of (a) first elution of SPE and (b) second elution of SPE of spiked chicken feces sample with (1) acetic acid, (2) propionic acid, and (3) butyric acid.
Separations 10 00308 g004
Table 1. Gradient elution program of the developed HPLC-DAD method.
Time (min)Flow (mL/min)Sulfuric Acid (5 mM)Acetonitrile
0.001.01000
4.001.01000
4.201.2982
11.901.2982
15.001.21000
Table 2. Robustness parameters of the developed HPLC-DAD method.
Operational ParameterLowOptimalHigh
Wavelength (nm)205210215
Mobile phase H2SO4 concentration (mM)258
Column temperature (°C)304050
H2SO4 % change time on gradient (min)3.74.24.7
Table 3. Parameters obtained for the three acids using the developed HPLC-DAD method.
ParametersAcetic AcidPropionic AcidButyric Acid
Linearity (R2)0.99870.99850.9966
Range (R, m) 10.9993, 0.99870.9992, 0.99850.9983, 0.9966
LOD (mg/mL)0.140.140.14
LOQ (mg/mL)0.440.450.43
Accuracy (%)99.98 ± 1.58%99.98 ± 1.27%99.98 ± 1.40%
1 R2: coefficient of determination, R: correlation coefficient, m: slope, LOD: limit of detection, LOQ: limit of quantification.
Table 4. Results obtained for the three acids for precision parameters.
AcidAceticPropionicButyricid
Concentration (mg/mL)1.01.52.01.01.52.01.01.52.0
Intraday (n = 6)
Recovery (%)99.42100.099.6799.4699.9599.7199.4999.9399.72
RSD 1 (%)1.111.050.691.441.450.951.621.301.16
SD 21.101.050.691.431.450.951.611.301.15
Interday (n = 9)
Recovery (%)99.26100.299.6199.32100.199.6699.3100.199.68
RSD 1 (%)1.441.741.631.381.271.531.351.441.62
SD 21.431.741.621.371.271.531.341.441.61
1 RSD: relative standard deviation. 2 SD: standard deviation.
Table 5. Robustness results of the developed HPLC-DAD method.
ParameterModificationRetention Time (min)Accuracy (%)RSD (%)DE
Optimal condition 1-AAPABAAAPABAAAPABAAAPABA
2.624.889.9097.1998.0497.830.000.030.160.000.030.15
Wavelength (nm)2052.624.889.89105.9102.398.600.080.120.470.090.130.46
2152.624.889.8778.4982.3584.320.020.000.060.020.000.05
Mobile phase H2SO4 concentration (mM)22.624.879.6697.0698.1397.900.010.010.030.010.010.03
82.614.859.6696.9197.6596.740.020.040.150.020.040.14
Column temperature (°C)302.735.2310.696.3997.2396.260.020.010.060.020.010.06
502.534.559.0697.14n.q.n.q.0.01n.q.n.q.0.01n.q.n.q.
H2SO4 % change time on gradient (min)1.72.624.779.5796.9497.8897.010.020.000.100.020.000.09
4.72.614.9310.096.8898.0397.170.000.010.100.000.010.10
1 Optimal condition: wavelength 210 nm, mobile phase H2SO4 concentration 5 mM, column temperature 40 °C, and H2SO4 % change time on gradient 4.2 min. AA: acetic acid, PA: propionic acid, and BA: butyric acid; n.q. not quantified.
Disclaimer/Publisher’s Note: The statements, opinions and data contained in all publications are solely those of the individual author(s) and contributor(s) and not of MDPI and/or the editor(s). MDPI and/or the editor(s) disclaim responsibility for any injury to people or property resulting from any ideas, methods, instructions or products referred to in the content.

