Abstract
A simple, sensitive, accurate and inexpensive UV-reversed-phase high-performance liquid chromatographic method was developed for the determination of ascorbic acid in tablet formulations. The method was based on the separation of ascorbic acid using a mobile phase of an acetonitrile-NaH2PO4-H3PO4 buffer solution (pH = 3) (5:95 v/v) with a UV detection wavelength of 245 nm and a flow rate of 0.8 mL min−1 at ambient column temperature. The variables of the proposed method, such as acetonitrile fraction (%), flow rate (mL min−1) and column temperature (°C), were optimized on the peak area by response surface methodology via the Box–Behnken design. The mobile phase was passed isocratically, and the separation of ascorbic acid was performed at the retention time of 4.1 min. A calibration graph was obtained and found to be linear in the concentration range of 10–180 µg mL−1. The method suitability was assessed and an asymmetry factor of 1.15 was obtained. The proposed method was successfully applied for the determination of ascorbic acid in tablet formulations and statistically compared with the results of the reference method. The performance of the proposed method was excellent and in agreement with the reference method. The recovery percentage of the proposed and reference methods was in the range of 99.98–100.04% and showed compliance (100 ± 2%) with regulatory guidelines.
1. Introduction
Ascorbic acid (vitamin C) is chemically known as (5R)-5-[(1S)-1,2-Dihydroxyethyl]-3,4-dihydroxyfuran-2(5H)-one. It is a white, crystalline powder. It is easily oxidized when exposed to high temperatures, oxygen, alkaline pH, traces of metal ions and some enzymes [1]. The drug is freely soluble in distilled water and sparingly soluble in ethanol. The drug is listed in the British Pharmacopoeia [2], United States Pharmacopoeia [3], European pharmacopoeia [4] and British National Formulary 2021 [5]. The drug is used to prevent scurvy. The clinical signs of scurvy disease appear in men when the whole-body content of ascorbic acid is less than 300 mg [6] or at intakes lower than 10 mg of ascorbic acid per day [7]. Such intakes are recognized with a plasma ascorbic acid concentration less than 11 μmol L−1 or leukocyte levels below 2 nmol per 108 cells [8]. In recent years, health agencies have recommended the use of ascorbic acid for the treatment of patients with moderate to severe COVID-19 disease [9,10]. Ascorbic acid is one of the most important essential micronutrients used for maintenance, growth and development of all body tissues. In addition, ascorbic acid is involved in many biochemical functions and utilized for the neutralization of free radicals and absorption of iron at the gastrointestinal level. It leads to synthesis and protection from oxidation of collagen, catecholamines, cholesterol, amino acids and some peptide hormones as an essential enzyme cofactor [11]. Ascorbic acid plays a major role in the initiation and progression of diverse chronic and acute diseases related to oxidative damage and inflammation [12]. The increasing interest in ascorbic acid as a micronutrient makes this entity the subject of significant investigation. Ascorbic acid can be supplemented through pharmaceutical tablets. Hence, the preparation of tablets with active ascorbic acid in pharmaceutical formulations is a very essential part of the pharmaceutical industry to provide safety and efficacy to patients. Therefore, it is important to quantitate active ascorbic acid in pharmaceutical formulations by accurate and validated analytical methods. The British Pharmacopeia and European Pharmacopoeia assayed ascorbic acid by titrimetry. In literature, some research studies have focused on the analysis of drugs and their impurities [13,14,15,16,17]. Ascorbic acid with inactive ingredients in tablet formulations could be given orally to patients with great ease. The important inactive ingredients of ascorbic acid tablets are microcrystalline cellulose, macrogol 6000, lactose monohydrate, magnesium stearate, sodium starch glycolate (Type A) and colloidal anhydrous silica.
Various other analytical methods, such as spectrophotometry [18,19,20,21,22,23], thin layer chromatography [24,25,26,27,28], capillary electrophoresis [29] and voltammetry [30], have been published for the determination of ascorbic acid in pharmaceutical formulations and biological fluids. UV-HPLC methods render more advantages over spectrophotometry, thin layer chromatography, capillary electrophoresis and voltammetry in terms of the multicomponent analysis of analytes (even more than two components), sensitivity, wide linear dynamic range, selectivity and specificity via separation. Therefore, the UV-HPLC method is frequently used for drug analysis and is considered much better than UV spectrophotometry alone. Samples may be contaminated to give a falsely high concentration of the desired analyte in a UV protocol. UV-HPLC provides the possibility of separating out these interfering compounds.
Analytical methods based on HPLC are also popular because of high accuracy, specificity, sensitivity, separation capability and short analysis time [31,32]. Several HPLC methods [33,34,35,36,37,38,39,40,41,42,43,44,45,46,47,48,49,50,51,52] have been reported for the determination of ascorbic acid in fruits, vegetables, indigenous spice plants, drug formulations and biological fluids. Moreover, several factors, such as composition of the mobile phase, pH, column temperature and flow rate, affect the performance of HPLC methods. Therefore, a response surface methodology (RSM) was utilized for optimizing the variables of the analytical methods to achieve the best performance [53,54,55,56]. The Box–Behnken design was selected because it provides a fewer number of experimental runs to optimize the variables. Recently, RSM via Box–Behnken design (BBD) was applied to optimize the flow rate, mobile phase composition and pH for separation and quantitation of domperidone and lansoprazole by HPLC method [57].
Keeping in view the quality and quantitative aspects of ascorbic acid in pharmaceutical formulations and biological fluids, we planned to develop a rapid, effective and sensitive UV-reversed phase high performance liquid chromatographic method for the determination of ascorbic acid in tablet formulations. The separation conditions of ascorbic acid through the column were optimized by response surface methodology using a Box–Behnken design. The proposed method was validated as per the International Council for Harmonization guidelines [58].
2. Materials and Methods
2.1. Apparatus
An HPLC (Dionex Ultimate 3000, Thermo Fisher Scientific, Sunnyvale, CA, USA) with an autosampler (ASI-100 automated sample injector, Sunnyvale, CA, USA) of 20 μL and a UV-visible diode array detector (Dionex Ultimate 3000, Thermo Fisher Scientific, Sunnyvale, CA, USA) were used. The separation was performed with a chromatographic column AcclaimTM 120 C18 5 μm 120A0 (4.6 × 250 mm, Dionex bonded silica products, Sunnyvale, CA, USA). A Chromeleon 6 Service Pack product (Version 2000, Thermo Fisher, Sunnyvale, CA, USA) was applied for peak integration and sample analysis to quantify ascorbic acid. An LDV-A12 Diaphragm vacuum pump (Labtron, Camberley, UK) was used for suction operation to drive liquid movement and accelerate filtration of the filtered solutions.
A UV-visible spectrophotometer (UV 1900 Shimadzu, Kyoto, Japan) equipped with 1-cm quartz cells was used to record the spectrum of ascorbic acid. pH values of the test solutions were measured using a Hanna benchtop pH meter (HI5222, Woonsocket, RI, USA). A Milli-Q Direct 8 Ultrapure Water System (Millipore, Molsheim, France) was used to purify demineralized water. A Branson Sonicator 2800 (Branson Ultra Sonics Corporation, Danbury, CT, USA) was used to dissolve ascorbic acid. The tablet solutions were filtered using a 0.45µm polyethersulfone membrane filter (ISOLAB, Wertheim, Germany). Design-Expert software (Version 13, StatEase, Minneapolis, MN, USA) was utilized to generate the Box–Behnken design (BBD) matrix for optimizing variables involved in developing HPLC method. OriginPro 2020b software (OriginLab Corporation, Northampton, MA, USA) was used to generate a linear regression equation to assay ascorbic acid in tablets.
2.2. Reagents and Standards
All solvents and mobile phases were degassed in an ultrasonic water bath and filtered in an HPLC filtration flask through a 0.45 µm polyethersulfone membrane filter (ISOLAB, Wertheim, Germany) using a vacuum pump. Acetonitrile, sodium dihydrogen phosphate, potassium dihydrogen phosphate, orthophosphoric acid (HPLC grade) and ascorbic acid were obtained from Sigma Aldrich, USA. Tablets of ascorbic acid, such as Redoxon (1000 mg, Bayer, Basel, Switzerland) and C-Tamin (500 mg, Vital-Health, Las Vegas, NV, USA), were purchased from a local Omani pharmacy shop.
2.2.1. Preparation of Buffer Solutions for HPLC Method Development
Phosphate buffer solutions of varying pH (pH 3.0, 3.5, 4.0 and 4.65) were prepared by mixing a fixed volume of aqueous sodium dihydrogen phosphate solution (0.4%) with varied volumes of orthophosphoric acid. The pH of the buffer solutions was measured using a Hanna pH meter.
2.2.2. Preparation of Mobile Phases for HPLC Method Development
The mobile phases of 2.5, 5.0 and 7.5% acetonitrile fraction were prepared by mixing 2.5, 5.0 and 7.5 mL of acetonitrile (Sigma Aldrich, St. Louis, MO, USA) with 97.5, 95.0 and 92.5 mL of phosphate buffer solution with a pH of 3. The mobile phases were degassed in an ultrasonic water bath and filtered through a 0.45μm filter using a vacuum filtration for HPLC studies.
2.2.3. Preparation of Standard Solutions of Ascorbic Acid
Both 0.02% and 0.05% ascorbic acid (200 & 500 μg mL−1, Sigma-Aldrich, St. Louis, MO, USA) standard solutions were prepared for UV spectra and HPLC method development, respectively. The said respective solutions of 0.02% and 0.05% ascorbic acid were prepared by dissolving 0.02 g and 0.05 g ascorbic acid in 150 mL Erlenmeyer stoppered conical flasks with 75 mL of distilled water. The ascorbic acid solutions were sonicated using the sonicator at 30 ± 1 °C for half an hour. The solutions were mixed thoroughly and transferred into 100 mL standard volumetric flasks. The solutions were diluted up to the mark with distilled water.
2.3. Procedure to Determine λmax of Ascorbic Acid by UV Specrophotometry
A total of 1 mL of ascorbic acid (200 μg mL−1) solution was put into a series of 10 mL standard volumetric flasks and diluted with respective mobile phases of different pH: 3.0, 3.5, 4.0 and 4.65 corresponding to 20 μg mL−1 ascorbic acid (after dilution). The UV-visible spectrum of the drug solution at different pH levels was scanned in the wavelength range of 190 to 340 nm against the reagent blank prepared similarly without ascorbic acid solution. The absorbance at λmax of ascorbic acid was recorded and compared to finalize the UV detection wavelength for HPLC studies.
2.4. Optimization of Variables for HPLC Method Development
A response surface methodology (RSM) via a Box–Behnken design (BBD) was applied to optimize the variables of the proposed HPLC method. In this study, the range and levels of each variable were investigated by preliminary experiments and taken as a fraction of acetonitrile (2.5–7.5%), flow rate (0.7–0.9 mL min−1) and column temperature (20–30 °C). Design-Expert software was utilized to generate the BBD matrix, which consisted of 17 experimental runs. The experiments were executed according to the BBD matrix and the coefficients of the response model were determined by fitting the measured data into a second-degree polynomial equation. The relationship between the predicted response and the variables involving linear, quadratic and interaction terms is expressed as [59,60]:
where A is the peak area (predicted); β0, βi, βii and βij are the constant, linear, quadratic and interaction coefficients of the model, respectively; Xi and Xj represent coded variables; and ɛ is the random error. The validity of the model was verified by analysis of variance (ANOVA).
2.5. Procedure for the Determination of Ascorbic Acid by Proposed Method
Aliquots (0.2–3.6 mL) of ascorbic acid (500 μg mL−1) were pipetted into a series of 10 mL standard volumetric flasks and diluted up to the mark with mobile phase: acetonitrile-NaH2PO4-H3PO4 buffer solution (pH = 3) (5:95 v/v) equivalent to 10–180 μg mL−1 ascorbic acid (after dilution). The mobile phase was passed isocratically and delivered thoroughly to clean the HPLC column. Then, 20 μL of each ascorbic acid test solution was injected into the sample port with a flow rate of 0.8 mL min−1 and the column temperature was maintained at 25 ± 1 °C. The detection was carried out at 245 nm. The HPLC chromatogram was partitioned for retention time and peak area. The calibration graph was plotted between the peak area and the initial concentration of ascorbic acid. The linear equation was generated using calibration data points of ascorbic acid concentration and the peak area through OriginPro 2020b software and utilized for assay of active ascorbic acid in tablets.
2.6. Procedure for the Determination of Ascorbic Acid by Reference Method [61]
Different aliquots (0.3–2.4 mL) of ascorbic acid (500 μg mL−1) were pipetted into a series of 10 mL standard volumetric flasks and diluted up to the mark with mobile phase: methanol-KH2PO4-H3PO4 buffer solution (pH = 3) (5:95 v/v) corresponding to 15–120 μg mL−1 ascorbic acid (after dilution). The said mobile phase was passed thoroughly to clean the HPLC column. A total of 20 μL of each ascorbic acid solution was injected into the sample port with a flow rate of 1.0 mL min−1 and the column temperature was maintained at 25 ± 1 °C. An isocratic elution procedure was followed with UV detection at 248 nm. Separation was performed and the HPLC chromatogram was partitioned for retention time and peak area. In addition, theoretical plates and asymmetry factors were recorded. The calibration curve was plotted between the peak area and the initial concentration of ascorbic acid. The linear regression equation was obtained using calibration data by OriginPro 2020b software. The amount of ascorbic acid was estimated in tablets using a linear regression equation.
2.7. Procedure for the Assay of Ascorbic Acid in Tablets
Two tablets of Redoxon and C-Tamin were taken from the container and weighed at 8.277 g and 1.155 g, respectively. The contents of said tablets were finely powdered in agate mortar and pestle separately. The Redoxon tablet fine powder (0.207 g) and C-Tamin tablet fine powder (0.058 g) equivalent to 50 mg of active ascorbic acid were weighed and transferred into 150 mL Erlenmeyer conical flasks. To each flask, 60 mL of distilled water was added and the solid residue was dissolved. The contents of the flasks were sonicated using the sonicator at 30 ± 1 °C for 30 min. The solutions were filtered through a filter funnel equipped with Whatmann No. 42-filter paper into a 100 mL standard volumetric flask. The solid residue was washed well with 3 × 10 mL portions of doubly distilled water and the filtrate was diluted up to the mark with distilled water. The tablet solutions of ascorbic acid were passed through a 0.45 µm polyethersulfone membrane filter in the syringe and the filtrates were assayed for active ascorbic acid content in tablet formulations following the procedures given in Section 2.5 and Section 2.6.
3. Results and Discussion
The development of the HPLC method was based mainly on mobile phase selection and UV detection wavelength. Therefore, prior to development of the HPLC method, ascorbic acid solution was scanned spectrophotometrically in various solvents to finalize the UV detection wavelength. The UV visible absorption spectra of 20 μg mL−1 ascorbic acid in distilled water and the mobile phase consisting of acetonitrile (5 mL) and phosphate buffer solution (95 mL of varying pH 3.0, 3.5, 4.0 or 4.65) were scanned in the wavelength range of 190–340 nm and the results are summarized in Table 1. It is clear from Table 1 that the ascorbic acid in the mobile phases made up of acetonitrile (5 mL) and phosphate buffer solution of pH 3 and 3.5 (95 mL each) provided absorption peaks at 245 & 247 nm, respectively. Therefore, the absorption peak at 245 nm due to ascorbic acid and the mobile phase (acetonitrile, 5 mL: phosphate buffer pH 3.0; 95 mL) were selected for the HPLC method development.

Table 1.
Absorbance and peak of 20 μg mL−1 ascorbic acid in distilled water and mobile phases of different pH.
The UV-visible spectra of 20 μg mL−1 ascorbic acid in distilled water and mobile phase with different pH are shown in Figure 1.
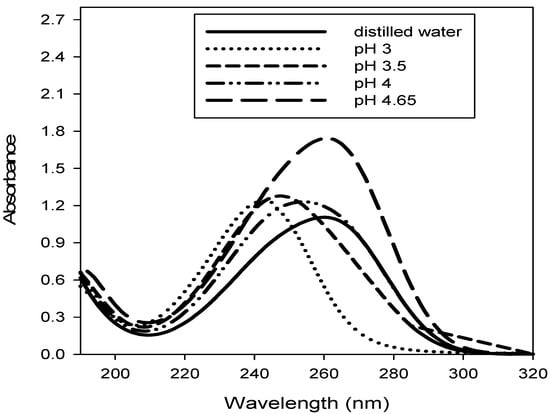
Figure 1.
UV- visible spectra of 20 μg mL−1 ascorbic acid in distilled and mobile phase of different pH.
3.1. BBD Design for HPLC Optimization
For optimization of the HPLC method, 17 experimental runs involving different combinations of selected variables were conducted to measure the response (peak area) and the results are reported in Table 2.
Table 2.
Box–Behnken design matrix with experimental and predicted peak area.
The experimental data were fitted to linear, interactive and quadratic models. The statistical parameters are given in Table 3.
Table 3.
Summary statistics of the BBD model for development of the HPLC method.
The predicted R2 is in reasonable agreement with adjusted R2 if the difference between them is 0.2. In this study, the quadratic model was selected based on (i) the difference of 0.0004 (less than 0.2) between predicted R2 (0.9995) and adjusted R2 (0.9999), (ii) high value of R2 (1.0000) and (iii) low value of standard deviation (7.46 × 10⁻²) and PRESS (6.22 × 10⁻¹). The multi-regression analysis of measured data gave a relationship between the peak area and the selected variables. The predicted response can be computed using the following Equation (2) in terms of coded factors:
Peak area = 53.42 + 0.7349A + 0.6974B + 0.275C − 0.0252AB − 0.575AC − 0.76BC − 17.43A2 − 0.6471B2 − 0.9169C2
In the selected model, the main interaction and quadratic effects were evaluated. For the sake of finding the most important effects and interactions, the analysis of variance (ANOVA) of the quadratic model equation was performed. The results are given in Table 4.
Table 4.
Analysis of variance for the quadratic model related with the optimization of variables for the development of the HPLC method.
The quadratic model terms are significant when p < 0.05. In this study, the p-value for the quadratic model terms was very low (<0.0001). This demonstrates that the quadratic model was highly significant for the observed results. Additionally, all model terms (AC, BC, A2, B2, C2) except AB were significant because p-values were less than 0.0001. The p-value of model term AB was 0.5198, indicating that the model term AB was insignificant. Therefore, Equation (2) was modified and expressed as:
Peak area = 53.42 + 0.7349A + 0.6974B + 0.275C − 0.575AC − 0.76BC − 17.43A2 − 0.6471B2 − 0.9169C2
Furthermore, the F-value of the quadratic model was much higher (26,352.64) than the critical F-value at 95% confidence level for 9 degrees of freedom (3.179), which suggests that the selected model was significant. The adequacy of the quadratic model was also confirmed from the plot of the predicted response versus the actual response (Figure 2).
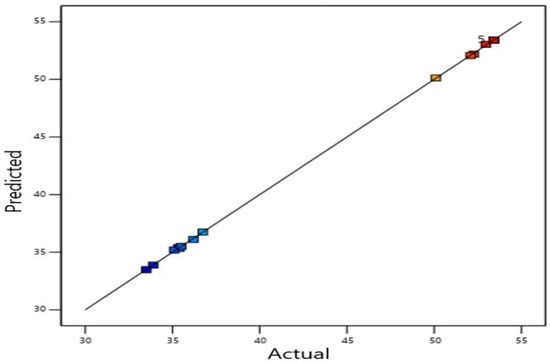
Figure 2.
Plot of experimental versus predicted peak area.
3.2. Response Surface Plots
The response surface plots are the graphical representation of the quadratic equation to assess the interactive effect of variables on the response (peak area). Figure 3(BC) shows the response surface plot as a function of flow rate (mL min−1) and column temperature (°C) and their mutual interaction on the peak area at a fixed concentration of vitamin C (50 µg mL−1). The peak area increased with increase in flow rate (mL min−1) and column temperature (°C) and a maximum peak area of 53.42 was obtained at a flow rate of 0.8 mL min−1 and column temperature of 25 °C. The combined effect of column temperature (°C) and acetonitrile fraction (%) on the peak area is shown in Figure 3(AC). As can be seen in Figure 3(AC), the peak area was found to increase with an increase in temperature and acetonitrile fraction (%). The highest peak area was observed at a column temperature of 25 °C and 5% acetonitrile. The response surface plots of quadratic model terms (BC and AC) were significant. The optimum conditions for independent variables were: flow rate 0.8 mL min−1, 5.0% acetonitrile and 25 °C column temperature.
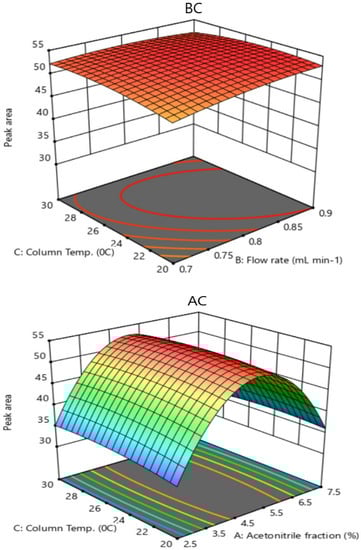
Figure 3.
Three-dimensional response surface plots as a function of (BC): flow rate (mL min−1) and column temperature (°C) and (AC): acetonitrile fraction (%) and column temperature (°C) at 50 μg mL−1 concentration of ascorbic acid on the peak area.
3.3. Method Validation
Method validation is the process of ensuring that the proposed method is accurate, reproducible and sensitive within the selected analysis range for the intended application, such as the assay of ascorbic acid in tablets. The data elements required for method validation [58] are (i) system suitability, (ii) robustness, (iii) linearity and range, (iv) limits of detection and quantitation, (v) precision, (vi) specificity and (vii) accuracy.
3.3.1. System Suitability
The optimization process for HPLC method development was performed (n = 6) using a UV detection wavelength of 245 nm, acetonitrile fraction (%), flow rate (mL min−1) and column temperature (°C) at 50 µg mL−1 of vitamin C on the peak area. The system suitability parameters were assessed and the results are summarized in Table 5.
Table 5.
HPLC responses at varied acetonitrile fractions with a constant flow rate and column temperature at 50 μg mL−1 ascorbic acid.
As can be seen from the table, at the optimized parameters through BBD, system suitability parameters were at the highest rank (level) and yielded theoretical plates of 13,785, a retention time of 4.1 min and an asymmetry factor of 1.15. The HPLC chromatogram at 50 µg mL−1 of ascorbic acid is shown in Figure 4.
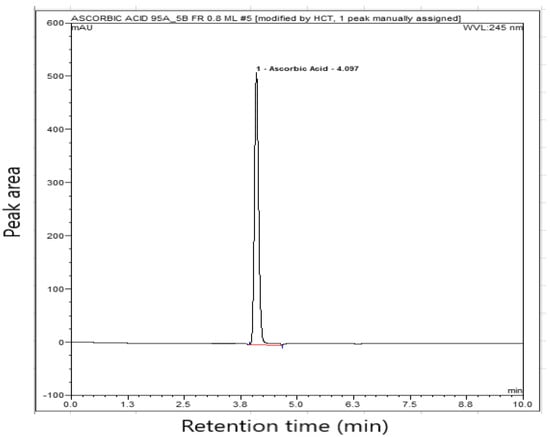
Figure 4.
HPLC chromatogram of ascorbic acid at 50 µg mL−1 (mobile phase-acetonitrile: NaH2PO4-H3PO4 buffer solution (pH = 3) (5:95 v/v).
3.3.2. Robustness
Robustness is a measure of the performance of the proposed method in terms of the peak area when small and deliberate changes are made to the optimized method parameters. Robustness evaluation was performed by change in the AcclaimTM 120 C18 column, 4.6 (id) × 250 mm, 5µm particle size (Dionex, Sunnyvale, CA, USA) with the Lunar C18 column, 4.6 (id) × 250 mm, 5µm particle size (Phenomenex, Torrance, CA, USA) and a small change in the phosphate buffer pH (±0.2) did not affect the peak area.
3.3.3. Linearity and Range
Under the optimized experimental conditions, different volumes of 0.05% ascorbic acid corresponding to 10, 50, 80, 100, 130, 150 and 180 µg mL−1 ascorbic acid were loaded into the sample port at a flow rate of 0.8 mL min−1 with the mobile phase of acetonitrileNaH2PO4-H3PO4 buffer solution (pH = 3) (5:95 v/v) and a UV detection wavelength of 245 nm at ambient column temperature (25 °C). The calibration graph was constructed by plotting the peak area against the initial concentration of ascorbic acid and found to be linear in the range of 10–180 μg mL−1 with a correlation coefficient (r) of 0.999. The high value of r demonstrates the good linearity of the calibration graph and the significant relationship between the peak area and the concentration of ascorbic acid. The parameters for analytical performance of the proposed and reference methods are summarized in Table 6.
Table 6.
Analytical and regression characteristics of the proposed and reference HPLC methods.
3.3.4. Limits of Detection and Quantitation
The limits of detection (LOD) and quantitation (LOQ) of the proposed and reference methods were calculated as per the ICH guidelines [49] for the validation of analytical procedures using the following formula:
where S0 is the standard deviation of the calibration line and b is the slope of the regression equation. Both LOD and LOQ were found to be 0.44 and 1.34 μg mL−1 for the proposed method and 0.30 and 0.91 μg mL−1 for the reference method. The limits of detection and quantitation are in agreement if both values are less than the lowest concentration level of the linear dynamic range. In this study, both methods provided LOD and LOQ, which are less than the lowest concentration level of the proposed (10 μg mL−1) and reference methods (15 μg mL−1). Hence, the proposed method was acceptable and in agreement with the reference method. The proposed method was superior in terms of higher linear dynamic range with lower intercept and higher slope values as compared to the reference method.
LOD = (3.3S0)/b
LOQ = (10S0)/b
The statistical analysis of the calibration data was evaluated in terms of error (Sc) encountered in the determination of the initial concentration of ascorbic acid using the following expression [62,63]:
where and ȳ are the average concentration of ascorbic acid and peak area, respectively at 7 different concentrations of ascorbic acid in 10–180 µg mL−1; and b and S0 are the slope and standard deviation of the calibration line, respectively. The uncertainty in the determination of ascorbic acid at 95% confidence level with 5 degrees of freedom was calculated and is shown in Figure 5. As can be seen from the figure, the least error of 0.143 μg mL−1 was achieved at 100 μg mL−1 of ascorbic acid, which demonstrates the acceptable precision of the proposed method.
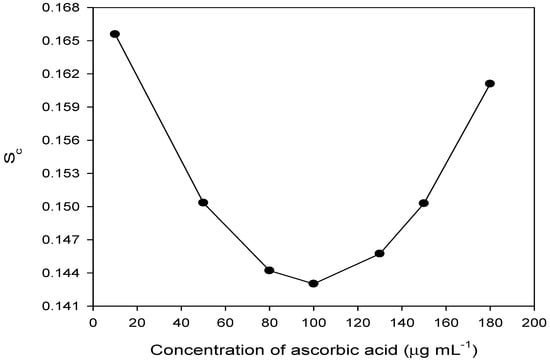
Figure 5.
Uncertainty error (Sc) in the determination of ascorbic acid.
The value of Sc was considered to determine the % uncertainty confidence limit (UCL) at 95% confidence level with 5 degrees of freedom using the following the equation:
The % uncertainty confidence limit was calculated and the results are shown in Figure 6 by plotting % uncertainty confidence limit against the concentration of ascorbic acid (μg mL−1).
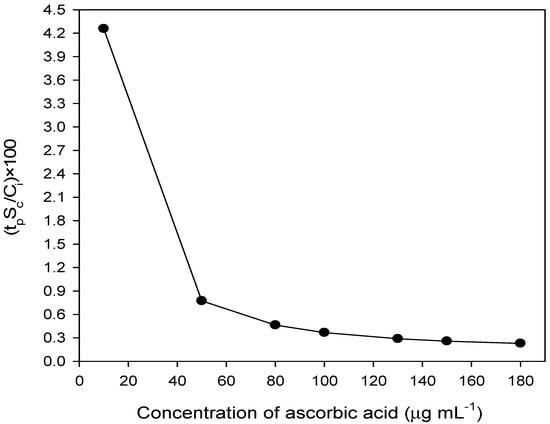
Figure 6.
% Uncertainty confidence limit in the determination of ascorbic acid at 95% confidence level.
3.3.5. Precision
The intra-day and inter-day precision of the proposed HPLC method were investigated by performing 5 replicate independent analyses at 3 different concentration levels (low, medium and high) of ascorbic acid (40, 120 and 160 µg mL−1) within the linear dynamic range on the same day (intra-day) and on 5 consecutive days (inter-day). The results of the analyses are summarized in Table 7. The % relative standard deviation and % recovery for intra-day and inter-day assays were in the range of 0.059–0.122% and 99.92–100.08%; and 0.074–0.162% and 99.94–100.11, respectively. The results reveal that the % recovery of ascorbic acid was in the permissible range of 100 ± 2% [64], indicating that the proposed method is precise within the acceptable limit. Furthermore, the RSD values were less than 2%, hence the proposed method is precise within the acceptable limits.
Table 7.
Intra-day and inter-day precisions of the proposed HPLC method.
3.3.6. Specificity
The selectivity and specificity of the proposed HPLC method for quantitation of ascorbic acid in tablet formulations of Redoxon 1 g (Bayer, Basel, Switzerland) and C-Tamin 0.5 g (Vital Health, Las Vegas, NV, USA) was assessed. The excipients found in the tablets were mostly eliminated during tablet solution preparations through filtration via Whatmann filter paper, as well as by filtration through a 0.45 µm polyethersulfone membrane with the help of a syringe. The same drug solutions were assayed at 100 μg mL−1 of ascorbic acid concentration by the proposed and reference methods and did not show any significant change in peak area nor retention time. Hence, the proposed method is specific and selective in the presence of excipients (microcrystalline cellulose, macrogol 6000, lactose monohydrate, magnesium stearate, sodium starch glycolate and colloidal anhydrous silica), even when encountered in tablet formulations.
3.3.7. Accuracy
The accuracy of the proposed method was evaluated and the % recovery of ascorbic acid was compared with the reference method. The amount of active ascorbic acid in tablets of ascorbic acid, such as Redoxon 1 g (Bayer, Basel, Switzerland) and C-Tamin 0.5 g (Vital Health, Las Vegas, NV, USA), was assayed by the proposed HPLC and reference methods. Five independent replicated analyses at 100 μg mL−1 of active ascorbic acid from tablet solutions were performed. The amount of active ascorbic acid in both tablets was determined by the proposed and reference methods using the following regression equations:
C = (Peak area − 2.57 × 10⁻³)/1.069 (Proposed method)
C = (Peak area − 0.1046)/1.064 (Reference method)
The obtained peak area at 100 μg mL−1 of active ascorbic acid was substituted in the said regression equation and the amount of ascorbic acid was calculated. The % recovery of active ascorbic acid in both tablets by the proposed and reference methods was in the range of 99.98 to 100.04%. The increase or decrease in % recovery results were less than ±2% [64], hence the proposed method is accurate and comparable to the reference method.
The significance of the proposed and reference methods was evaluated by an interval hypothesis test at the same concentration of ascorbic acid (100 μg mL−1). The results are summarized in Table 8. Paired t- and F-values for both tablets by the proposed and reference methods were calculated [65] and found to be less than the tabulated t (ν = 0 8, 2.306) and F-values (ν = 4, 4; 6.39) at 95% confidence level. Hence, it is evidenced through calculated t- and F-values that that there is no significant difference between the proposed HPLC and reference methods.
Table 8.
Significance of testing between the proposed HPLC and reference methods at 100 µg mL−1 of active ascorbic acid in tablet formulations at 95% confidence level.
The % recovery of ascorbic acid in Redaxon and C-Tamin by the proposed and reference methods were in the range of 99.98–100.04. The bias of ±2% in % recovery is allowed [64], hence the results of both methods were in agreement and accurate. The bias in recovery results by the proposed and reference methods was calculated by an interval hypothesis test using the following quadratic equation [66,67]:
The 2 roots (lower limit, θL and upper limit, θU) of the quadratic equation were calculated and found to be in the range of 0.999 (θL between 0.98–1.00) to 1.002 (θU between 1.00–1.02) for Redaxon and C-Tamin. As evidenced, the results are acceptable and in compliance with regulatory Canadian Health Protection Branch guidelines [64].
3.4. Comparison of the Proposed Method with Other Published HPLC Methods
The performances of the proposed HPLC method and other published HPLC methods are presented in Table 9.
Table 9.
Performances of the proposed HPLC method and other published HPLC methods for determination of ascorbic acid.
It is clear from the table that most of the published high performance liquid chromatographic methods [33,34,35,36,37,38,39,40,41,42,43,44,45,46,47,60] have a linear dynamic range between 0.05–125 µg mL−1. These methods used more typical mobile phases with typical buffer solutions, such as sodium pentane sulphonate, in the presence of formic acid along with methanol [35], hexadecyltrimethyl ammonium bromide along with KH2PO4 [36], tetrabutyl ammonium hydroxide in the presence of H3PO4 along with methanol [37], a combination of acetonitrile and dichloromethane along with an acidic buffer solution [38] and a 15mM phosphate buffer (90–80%, pH 2.7) with methanol (10–20%) gradient mode [39] for elution of ascorbic acid. Hence, these methods involve more steps prior to analysis with a lower linear dynamic range, which makes these methods tedious and expensive. The proposed method utilizes a mobile phase of acetonitrile along with a phosphate buffer solution with a pH of 3, providing a higher linear dynamic range (10–180 µg mL−1), a retention time of 4.1 min, an asymmetry factor of 1.15 and a theoretical plate of 13,785 at room temperature. Hence, the overall performance of the proposed method is satisfactory and within the permissible limits, and can therefore be used as alternate method for routine quality control analysis of active ascorbic acid in tablet formulations.
3.5. Greenness Profile of the Proposed Method
The analytical ecoscale [68] was utilized to evaluate the greenness of the proposed method for determining ascorbic acid in tablet formulations. The analytical ecoscale penalty points of 34 was assigned to the proposed method on using the link (http://ecoscale.cheminfo.org/calculator) with parameters in software in the order/sequence of 24.358 mM of sodium dihydrogen phosphate dihydrate (CAS No. 13472-35-0), 3.515 mM of phosphoric acid (CAS No. 7664-38-2), 4.756 mM of acetonitrile (CAS No. 75-05-8), an instrument for controlled addition of chemicals, room temperature ˂ 1 h and adding solvent.
The greenness point can be achieved by subtracting the penalty points from 100. The greenness of the adopted method can be (i) excellent (if greenness point > 75), (ii) acceptable (if greenness point > 50) or not up to the mark (if greenness point < 50). In this study, the greenness point of the proposed method was 66, hence the proposed method was acceptable to assay ascorbic acid in tablet formulations. In addition, the greenness points of the reported HPLC methods were calculated and are given in Table 9. It is evident from the table that the proposed HPLC method was found to be greener (66 greenness points) than the majority of the reported HPLC methods [33,35,36,39,40,41,42,43,45,46,47,48,49,50,52,61], or similar to the reported HPLC method [38] but less green than four reported HPLC methods [34,37,44,51]. In all three reported methods [34,37,44] where the greenness points of 71 were obtained, each has a lower linear dynamic range than the proposed HPLC method. The reported HPLC method [51] where the highest greenness point of 75 was achieved has a comparable linear dynamic range (0–200 µg mL−1) to the proposed HPLC method, but involves more reagents and solvent (1-hexane sulfonic acid, acetic acid, triethylamine and acetonitrile), which makes this reported HPLC method tedious and cumbersome. Hence, due to the merits listed above, a greener quality approach and successful application of the proposed HPLC method in assaying ascorbic acid in tablets renders this method novel and superior.
4. Conclusions
The proposed HPLC method is simple, sensitive, accurate and inexpensive. The proposed HPLC method was not impeded by common excipients present in tablet formulations. The results of the proposed HPLC method are in agreement with those of the reference method and show compliance with regulatory guidelines in terms of % recovery of ascorbic acid in tablet formulations. The proposed method follows system suitability parameters, such as a asymmetry factor of 1.15 (less than 1.8) and a higher theoretical plate of 13,785. These merits, high reproducibility, ease of operation and sensitivity make the proposed method more suitable for routine quality control analysis of ascorbic acid in pharmaceutical industries, hospitals and academic institutions.
Author Contributions
The conceptualization, writing of the original draft and methodology development were contributed by S.N.H.A., U.A.H. and N.R. The investigations, formal analysis and data curation were performed by J.O.S.A.M., B.M.S.A.M., B.S.A.R.A.J. and A.S.S.A.R. The data validation using Design Expert software was performed by S.N.H.A., M.N. and N.R. The format editing and review of the manuscript were performed by S.M.H., S.A.K., Q.U.A. and Z.A.Z. Article processing charges were paid by Z.A.Z. All authors have read and agreed to the published version of the manuscript.
Funding
This research received no external funding.
Data Availability Statement
Data is contained within the article. The analytical Eco scale weblink of (http://ecoscale.cheminfo.org/calculator) was accessed on 26 October 2022 for assessing greenness points. The pH was monitored through the weblink of (http://www.omnicalculator.com/chemistry/henderson-hasselbalch) (accessed on accessed on 26 October 2022).
Acknowledgments
The authors thank the higher-ups and the Vice Chancellor of the University of Technology and Applied Sciences (Higher College of Technology Muscat) Sultanate of Oman, for support in carrying out this work. The authors are grateful to all technical staff for their help and unwavering support through the entire research work. In addition to this, all authors thank the University Malaysia Sabah for its generous support and financial assistance in order to pay the article processing charges of the manuscript.
Conflicts of Interest
The authors declare no conflict of interest.
References
- Valente, A.; Albuquerque, T.G.; Sanches-Silva, A.; Costa, H.S. Ascorbic acid content in exotic fruits: A contribution to produce quality data for food composition databases. Food Res. Int. 2011, 44, 2237–2242. [Google Scholar] [CrossRef]
- British Pharmacopoeia Commission. British Pharmacopoeia, Vol. I; Her Majesty Stationary Office: London, UK, 2018; pp. 203–204. [Google Scholar]
- USP 42. In United States Pharmacopoeia; The United States Pharmacopeial Convention: Rockville, MD, USA, 2018; pp. 377–378.
- European Pharmacopoeia. European Pharmacopoeia, 9th ed.; European Directorate for the Quality of Medicines & HealthCare: Strasbourg, France, 2017; pp. 1760–1761. [Google Scholar]
- NHS. British National Formulary 81, Chapter 9: Blood and Nutrition; Royal Pharmaceutical Society: London, UK, 2021; p. 1132. [Google Scholar]
- Baker, E.M.; Hodges, R.E.; Hood, J.; Sauberlich, H.E.; March, S.C. Metabolism of ascorbic-1–14C acid in experimental human scurvy. Am. J. Clin. Nutr. 1969, 22, 549–558. [Google Scholar] [CrossRef]
- Krebs, N.A.; Peters, R.A.; Coward, K.H. Vitamin C requirement of human adults: Experimental study of vitamin C deprivation in man. Lancet 1948, 254, 853–858. [Google Scholar]
- World Health Organization and Food and Agriculture Organization of the United Nations. Vitamin C. In Vitamin and Mineral Requirements in Human Nutrition, 2nd ed.; World Health Organization and Food and Agriculture Organization of the United Nations: Geneva, Switzerland, 2004; p. 132. [Google Scholar]
- Rossetti, C.A.; Real, J.P.; Palma, S.D. High dose of ascorbic acid used in Sars COVID-19 treatment: Scientific and clinical support for is therapeutic implementation. Ars Pharm. 2020, 61, 145–148. [Google Scholar]
- Hiedra, R.; Lo, K.B.; Elbashabsheh, M.; Gul, F.; Wright, R.M.; Albano, J.; Azmaiparashvili, Z.; Patarroyo Aponte, G. The use of IV vitamin C for patients with COVID-19: A case series. Expert Rev. Anti Ther. 2020, 18, 1259–1261. [Google Scholar] [CrossRef] [PubMed]
- Dasgupta, A.; Klein, K. Chapter 15—Antioxidant Vitamins and Minerals, in Antioxidants. In Food, Vitamins and Supplements; Elsevier: San Diego, CA, USA, 2014; pp. 277–294. [Google Scholar]
- Grosso, G.; Bei, R.; Mistretta, A.; Marventano, S.; Calabrese, G.; Masuelli, L.; Giganti, M.G.; Modesti, A.; Galvano, F.; Gazzolo, D. Effects of vitamin C on health: A review of evidence. Front. Biosci. 2013, 18, 1017–1209. [Google Scholar]
- Azmi, S.N.H.; Iqbal, B.; Al Humaimi, N.S.H.; Al Salmani, I.R.S.; Al Ghafri, N.A.S.; Rahman, N. Quantitative analysis of cefixime via complexation with palladium (II) in pharmaceutical formulations by spectrophotometry. J. Pharm. Anal. 2013, 3, 248–256. [Google Scholar] [CrossRef]
- Husain, A.; Iram, F.; Siddiqui, A.A.; Almutairi, S.M.; Mohammed, O.B.; Khan, S.A.; Azmi, S.N.H.; Rahman, N. Identification of metabolic pathways involved in the biotransformation of eslicarbazepine acetate using UPLC-MS/MS, human microsomal enzymes and in silico studies. J. King Saud Univ. Sci. 2021, 33, 101281. [Google Scholar] [CrossRef]
- Siddiqui, M.R.; Al-Othman, Z.A.; Rahman, N. Analytical techniques in pharmaceutical analysis: A review. Arab. J. Chem. 2017, 10, S1409–S1421. [Google Scholar] [CrossRef]
- Al Othman, Z.A.; Rahman, N.; Siddiqui, M.R. Review on pharmaceutical impurities, stability studies and degradation products. Rev. Adv. Sci. Eng. 2013, 2, 155–166. [Google Scholar] [CrossRef]
- Rahman, N.; Azmi, S.N.H.; Wu, H.F. The importance of impurity analysis in pharmaceutical products: An integrated approach. Accredit. Qual. Assur. 2006, 11, 69–74. [Google Scholar] [CrossRef]
- Qureshi, S.Z.; Saeed, A.; Haque, S.; Rahman, N. Spectrophotometric method for the estimation of Vitamin C in drug formulations. Anal. Lett. 1990, 23, 995–1003. [Google Scholar] [CrossRef]
- Salkić, M.; Selimović, A. Spectrophotometric determination of L-Ascorbic Acid in pharmaceuticals based on its oxidation by potassium peroxymonosulfate and hydrogen peroxide. Croat. Chem. Acta 2015, 88, 73–79. [Google Scholar] [CrossRef]
- Shishehbore, M.R.; Aghamiri, Z. A highly sensitive kinetic spectrophotometric method for the determination of ascorbic acid in pharmaceutical samples. Iran. J. Pharm. Res. 2014, 13, 373–382. [Google Scholar]
- Hussein, A.Z.M. Spectrophotometric determination of ascorbic acid in aqueous solutions and in pharmaceuticals formulations. J. Al-Nahrain Univ. 2013, 16, 65–71. [Google Scholar] [CrossRef]
- Mowry, S.; Ogren, P.J. Kinetics of methylene blue reduction by ascorbic acid. J. Chem. Educ. 1999, 76, 970–973. [Google Scholar] [CrossRef]
- Hasegawa, Y.; Sugawara, T. Thermodynamic parameters of complexation of lanthanoid (III) with ascorbic acid. Inorg. Chim. Acta 1988, 143, 277–280. [Google Scholar] [CrossRef]
- Pyka-Pajak, A.; Dołowy, M.; Parys, W.; Bober, K.; Janikowska, G. A simple and cost-effective TLC-densitometric method for the quantitative determination of acetylsalicylic acid and ascorbic acid in combined effervescent tablets. Molecules 2018, 23, 3115. [Google Scholar] [CrossRef]
- Akasaka, K. Simple determination of L-ascorbic acid on TLC by visual detection using autocatalytic reaction. Anal. Sci. 2013, 29, 505–509. [Google Scholar] [CrossRef][Green Version]
- Polak, B.; Pajurek, E. Separation of some vitamins in reversed-phase thin-layer chromatography and pressurized planar electrochromatography with eluent containing surfactant. Sci. Rep. 2021, 11, 21851. [Google Scholar] [CrossRef]
- Alam, P.; Kamal, Y.T.; Alqasoumi, S.I.; Foudah, A.I.; Alqarni, M.H.; Yusufoglu, H.S. HPTLC method for simultaneous determination of ascorbic acid and gallic acid biomarker from freeze dry pomegranate juice and herbal formulation. Saudi Pharm. J. 2019, 27, 975–980. [Google Scholar] [CrossRef] [PubMed]
- Peter, E.L.; Kaligirwa, A.; Lukwago, T. Stability indicating high-performance thin-layer chromatography method for estimation of ascorbic acid in Hibiscus sabdariffa L. aqueous extract. J. Complement. Med. Res. 2019, 10, 50–57. [Google Scholar] [CrossRef]
- Koh, E.V.; Bissell, M.G.; Ito, R.K. Measurement of vitamin C by capillary. electrophoresis in biological fluids and fruit beverages using a stereoisomer as an internal standard. J. Chromatogr. 1993, 633, 245–250. [Google Scholar] [CrossRef]
- Amayreh, M.; Hourani, W.; Hourani, M.K. Voltammetric determination of ascorbic acid in pharmaceutical formulations using modified iodine-coated platinum electrode. J. Vitae 2021, 28, 346228. [Google Scholar] [CrossRef]
- Nojavan, S.; Khalilian, F.; Kiaie, F.M.; Rahimi, A.; Arabanian, A.; Chalavi, S. Extraction and quantitative determination of ascorbic acid during different maturity stages of Rosa canina L. fruit. J. Food Compos. Anal. 2008, 21, 300–305. [Google Scholar] [CrossRef]
- Russel, L.F. Food Analysis by HPLC. In Quantitative Determination of Water-Soluble Vitamins, 2nd ed.; Nollet, L.M.L., Ed.; Marcel Dekker: New York, NY, USA, 2000; pp. 403–476. [Google Scholar]
- Ibrahim, F.; El-Enany, N.; El-Shaheny, R.N.; Mikhail, I.E. Development and validation of a new HPLC method for the simultaneous determination of paracetamol, ascorbic acid, and pseudoephedrine HCl in their co-formulated tablets. Application to in vitro dissolution testing. Anal. Sci. 2015, 31, 943–947. [Google Scholar] [CrossRef] [PubMed]
- El-Din, M.S.; Eid, M.; Zeid, A.M. Development and validation of RP-HPLC method for simultaneous determination of ascorbic acid and salicylamide in their binary mixtures: Application to combined tablets. J. Chromatogr. Sep. Tech. 2012, 3, 1000137. [Google Scholar] [CrossRef]
- Tsvetkova, B.; Pencheva, I.; Zlatkov, A.; Peikov, P. Simultaneous high-performance liquid chromatography determination of paracetamol and ascorbic acid in tablet dosage forms. Afr. J. Pharm. Pharmacol. 2012, 6, 1332–1336. [Google Scholar] [CrossRef]
- Kim, Y.; Kim, M.G. HPLC-UV method for the simultaneous determinations of ascorbic acid and dehydroascorbic acid in human plasma. Transl. Clin. Pharmacol. 2016, 24, 37–42. [Google Scholar] [CrossRef]
- Hu, L.; Li, L.; Luo, Z.; Yang, J.; Liu, W. Determination of trace vitamin C by ion-pair HPLC with UV detection in calcium gluconate and vitamin C compound oral solution. J. Chromatogr. Sci. 2012, 50, 102–107. [Google Scholar] [CrossRef]
- Mahmood, H.S.; Ahmad, R.R. High performance liquid chromatographic determination of ascorbic acid in pharmaceutical preparations, fruit juices and human Serum. Rafidain J. Sci. 2018, 27, 79–92. [Google Scholar]
- Stana, M.; Sorana, M.L.; Marutoiub, C. Extraction and HPLC Determination of the ascorbic acid content of three indigenous spice plants. J. Anal. Chem. 2014, 69, 998–1002. [Google Scholar] [CrossRef]
- Chebrolu, K.K.; Jayaprakasha, G.K.; Yoo, K.S.; Jifon, J.L.; Patil, B.S. An improved sample preparation method for quantification of ascorbic acid and dehydroascorbic acid by HPLC. Food Sci. Technol. 2012, 47, 443–449. [Google Scholar] [CrossRef]
- Gennaro, M.C.; Bertolo, P.L. L-Ascorbic acid determination in fruits and medical formulations by ion interaction reagent reverse phase HPLC technique. J. Liq. Chromatogr. 1990, 13, 1419–1434. [Google Scholar] [CrossRef]
- Lloyd, L.L.; Warner, F.P.; White, C.A.; Kennedy, J.F. Quantitative reversed phase HPLC analysis of L-ascorbic acid (vitamin C) and identification of its degradation products. Chromatographia 1987, 24, 371–376. [Google Scholar] [CrossRef]
- Garnero, C.; Longhi, M. Development of HPLC and UV spectrophotometric methods for the determination of ascorbic acid using hydroxypropyl-β-cyclodextrin and triethanolamine as photostabilizing agents. Anal. Chim. Acta 2010, 659, 159–166. [Google Scholar] [CrossRef]
- Maia, A.M.; Baby, A.R.; Yasaka, W.J.; Suenaga, E.; Kaneko, T.M.; Velasco, M.V.R. Validation of HPLC stability-indicating method for Vitamin C in semisolid pharmaceutical/cosmetic preparations with glutathione and sodium metabisulfite, as antioxidants. Talanta 2007, 71, 639–643. [Google Scholar] [CrossRef]
- Novakova, L.; Solichova, D.; Pavlovicova, S.; Solich, P. Hydrophilic interaction liquid chromatography method for the determination of ascorbic acid. J. Sep. Sci. 2008, 31, 1634–1644. [Google Scholar] [CrossRef]
- Kand’ar, R.; Zakova, P. Determination of ascorbic acid in human plasma with a view to stability using HPLC with UV detection. J. Sep. Sci. 2008, 31, 3503–3508. [Google Scholar] [CrossRef]
- Ahmida, M.H.S. Determination of ascorbic acid in vitamin C (tablets) by high-performance liquid chromatography. Asian J. Chem. 2009, 21, 6463–6467. [Google Scholar]
- Mitić, S.S.; Kostić, D.A.; Nasković-Dokić, D.C.; Mitic, M.N. Rapid and reliable HPLC method for the determination of vitamin C in pharmaceutical samples. Trop. J. Pharm. Res. 2011, 10, 105–111. [Google Scholar] [CrossRef]
- Abe-Matsumoto, L.T.; Sampaio, G.R.; Bastos, D.H.M. Is titration as accurate as HPLC for determination of vitamin C in supplements? Am. J. Anal. Chem. 2020, 11, 269–279. [Google Scholar] [CrossRef]
- Klimczak, I.; Gliszczyńska-Świgło, A. Comparison of UPLC and HPLC methods for determination of vitamin C. Food Chem. 2015, 175, 100–105. [Google Scholar] [CrossRef] [PubMed]
- Muller, L.D. Improved extraction methods for avoiding the interference of copper in the LC determination of ascorbic acid in multivitamin-mineral tablets. J. Pharm. Biomed. Anal. 2001, 25, 985–994. [Google Scholar] [CrossRef]
- Koblová, P.; Sklenářová, H.; Brabcová, I.; Solich, P. Development and validation of a rapid HPLC method for the determination of ascorbic acid, phenylephrine, paracetamol and caffeine using a monolithic column. Anal. Methods 2012, 4, 1588–1591. [Google Scholar] [CrossRef]
- Rahman, N.; Sameen, S.; Kashif, M. Application of Box–Behnken design and desirability function in the optimization of spectrophotometric method for the quantification of WADA banned drug: Acetazolamide. J. Mol. Liq. 2019, 274, 270–277. [Google Scholar] [CrossRef]
- Rahman, N.; Khan, S. Experimental design approach in the optimization of potentiometric method for lansoprazole determination using lansoprazole-tungstate based ion-selective electrode. Ind. Eng. Chem. Res. 2018, 57, 9351–9361. [Google Scholar] [CrossRef]
- Azmi, S.N.H.; Al-Jassasi, B.M.H.; Al-Sawafi, H.M.S.; Al-Shukaili, S.H.G.; Rahman, N.; Nasir, M. Optimization for synthesis of silver nanoparticles through response surface methodology using leaf extract of Boswellia sacra and its application in antimicrobial activity. Environ. Monit. Assess. 2021, 193, 497. [Google Scholar] [CrossRef]
- Azmi, S.N.H.; Al-Masrouri, Z.N.; Al-Lamki, I.R.; Al-Jabri, A.K.; Rahman, N.; Nasir, M.; Abdelrahman, K.; Fnais, M.S.; Alam, M. Development and validation of spectrophotometric method for determination of imipramine hydrochloride in tablets (solid materials). J. King Saud Univ.-Sci. 2022, 34, 101823. [Google Scholar] [CrossRef]
- Afzal, M.; Muddassir, M.; Alarifi, A.; Ansari, M.T. Box-Behnken assisted validation and optimization of an RP-HPLC method for simultaneous determination of domperidone and lansoprazole. Separations 2021, 8, 8010005. [Google Scholar] [CrossRef]
- International Council for Harmonization. ICH Q14, Analytical Procedure Development and Revision of Q2(R1) Analytical Validation (Concept Paper); ICH: Geneva, Switzerland, 2018. [Google Scholar]
- Demirel, C.; Kabutey, A.; Herák, D.; Sedlacek, A.; Mizera, C.; Dajbych, O. Using Box–Behnken design coupled with response surface methodology for optimizing rapeseed oil expression parameters under heating and freezing conditions. Processes 2022, 10, 490. [Google Scholar] [CrossRef]
- Azmi, S.N.H.; Al Lawati, W.M.; Al Hoqani, U.H.A.; Al Aufi, E.; Al Hatmi, K.; Al Zadjali, J.S.; Rahman, N.; Nasir, M.; Rahman, H.; Khan, S.A. Development of a Citric-Acid-Modified Cellulose Adsorbent Derived from Moringa peregrina Leaf for Adsorptive Removal of Citalopram HBr in Aqueous Solutions. Pharmaceuticals 2022, 15, 760. [Google Scholar] [CrossRef] [PubMed]
- Thao, N.M.P.; Vi, N.T.T.; Van, N.T.N. Determination of vitamin C in multivitamin effervescent tablets by high-performance liquid chromatography. Can Tho J. Med. Pharm. 2019, 5, 108–117. [Google Scholar]
- Rahman, N.; Ahmad, Y.; Azmi, S.N.H. Kinetic spectrophotometric method for the determination of norfloxacin in pharmaceutical formulations. Eur. J. Pharm. Biopharm. 2004, 57, 359–367. [Google Scholar] [CrossRef]
- Miller, J.C.; Miller, J.N. Errors in instrumental analysis; regression and correlation. In Statistics for Analytical Chemistry, 3rd ed.; Ellis Horwood: Chichester, UK; Prentice Hall: Hoboken, NJ, USA, 1993; p. 119. [Google Scholar]
- Canada Health Protection Branch. Drugs Directorate guidelines, Acceptable Methods; Draft; Ministry of National Health and Welfare: Ottawa, ON, Canada, 1994. [Google Scholar]
- Rahman, N.; Haque, S.M.; Azmi, S.N.H.; Rahman, H. Optimized and validated spectrophotometric methods for the determination of amiodrone hydrochloride in commercial dosage forms using N-bromosuccinimide and bromothymol blue. J. Saudi Chem. Soc. 2017, 21, 25–34. [Google Scholar] [CrossRef]
- Rahman, N.; Sameen, S.; Kashif, M. Spectroscopic study on the interaction of haloperidol and 2,4-dinitrophenylhydrazine and its application for the quantitation in drug formulations. Anal. Chem. Lett. 2016, 6, 874–885. [Google Scholar] [CrossRef]
- Hartmann, C.; Smeyers-Verbeke, J.; Pinninckx, W.; Heyden, Y.V.; Vankeerberghen, P.; Massart, D.L. Reappraisal of hypothesis testing for method validation: Detection of systematic error by comparing the means of two methods or of two laboratories. Anal. Chem. 1995, 67, 4491–4499. [Google Scholar] [CrossRef]
- Płotka-Wasylka, J. A new tool for the evaluation of the analytical procedure: Green analytical procedure index. Talanta 2018, 181, 204–209. [Google Scholar] [CrossRef]


Publisher’s Note: MDPI stays neutral with regard to jurisdictional claims in published maps and institutional affiliations. |
© 2022 by the authors. Licensee MDPI, Basel, Switzerland. This article is an open access article distributed under the terms and conditions of the Creative Commons Attribution (CC BY) license (https://creativecommons.org/licenses/by/4.0/).