Abstract
Human scent traces are often the only pieces of evidence providing information about individuals that were present at a crime scene. In this study, the possibility of sex differentiation using detailed chemical analyses of human scent samples for forensic purposes is discussed. The human scent samples were analyzed through the use of headspace-gas chromatography/mass spectrometry (HS-GC/MS). The results of these chemical analyses were evaluated using several data processing approaches (Linear Support Vector Machine, Quadratic Discriminant Analysis, and Ridge Regression), which were applied to distinguish between sexes from the human scent samples obtained from the palms of six volunteers for twelve weeks. This study indicates that sex differentiation based on the chemical analysis of human scent samples using HS-GC/MS is possible. The best results were obtained using the Ridge Regression with thresholding providing accuracy and a critical sensitivity of the sex differentiation of better than 91%.
1. Introduction
Human skin scent is a complex mixture of several thousand organic compounds with different volatilities and relative concentrations. The chemical composition of the human scent, from both the qualitative and the quantitative points of view, is influenced by many factors, such as genetics, metabolism, diet, stress, immune status, environmental factors, etc. The main presumption of the scent research consists of the fact that human body scent is unique for each individual. This uniqueness is then given by the quantitative representation, especially the mutual ratios between the volatile organic compounds (VOCs) present [1]. Detailed chemical analyses of the human scent may be beneficial for research on personal identifications in forensic science. It is also believed that human scent chemical analyses could allow class identifications of individuals, such as the possibility to distinguish between people of the same sex [2,3], ethnic origin [2,4], having the same disease(s) [5], using equivalent drugs, etc.
At the forefront of this paper is an effort to distinguish the sex by the chemical analyses of the human skin scent. Current knowledge is predominantly based on chemical analyses of axillary sweat. The results obtained by Zeng et al. [6,7] indicate that feminine and masculine scents are qualitatively similar; the differences are primarily in the relative abundances of some scent compounds. Similar findings were obtained by Curran et al. [8]. Some other studies then used multivariate methods to create models separating male and female scent samples with different degrees of accuracy (71% [2], 75% [3]) 84% [9]).
In addition to sex distinction, this study presents the possibility of using a dynamic headspace with a Tenax trap as a sampling method. Previous studies [2,3,6,7,8,9] used different approaches, such as (Solid-Phase MicroExtraction (SPME) or Stir Bar Sorptive Extraction (SBSE) as extraction methods, Twisters and gauze as the sampling material, and last but not least, a different source of scent (axillary scent).
For the determination of volatile compounds in human scent samples, gas chromatography allows several selective sampling methods (static headspace, dynamic headspace or solid-phase microextraction), which also represent preconcentration techniques enabling trace analysis [10]. All of these techniques have a common thermal desorption step, during which analytes are released from the sample after heating into the carrier gas flow. This approach often includes one or more stages of concentration of analytes in a smaller volume of refrigerated sorbent, e.g., Tenax®. After thorough thermal desorption, the focused analytes are transferred to the column.
Headspace techniques are divided into static and dynamic headspace according to the method of implementation. In the static headspace method, a defined volume of gas is transferred to a chromatographic column after the formation of equilibrium conditions in a hermetically sealed vial with the sample. In the dynamic headspace method, an inert gas is introduced into the space above the sample, which either flows above the sample surface or through it (purge and trap analysis). The inert gas further passes through a sorption tube where the released volatiles are trapped. The trapped volatiles are then desorbed through the rapid heating of the sorption tube. Another possible technique is direct thermal desorption [11]. The sample is placed directly into a desorption tube. This is a fast technique requiring minimal sample handling, but the sample must be small enough to be placed into a tube. Penn et al. [3] and Dixon et al. [9] used this approach for the analysis of human scent in combination with scent collection on twisters with a polydimethylsiloxane (PDMS) sorption phase.
A special case of static headspace is solid-phase microextraction. This method is based on the sorption of volatile substances on a fiber coated with a sorbent, e.g., PDMS. After the sorption, the fiber is placed in the injection space of the gas chromatograph, where the substances are thermally desorbed. The SPME technique has been used for human scent analysis in a number of studies, e.g., Colón Crespo et al. [2] and Curran et al. [8]. Although the SPME technique is faster and simpler than dynamic headspace with the Tenax trap, the latter technique provides a broader spectrum of volatiles [12].
2. Materials and Methods
2.1. Chemicals and Materials
Hexane was purchased from Sigma-Aldrich (St. Louis, MO, USA) of the quality required for GC/MS. Common chemicals such as ethanol (for UV-VIS spectroscopy, min 99.8%), sulfuric acid (purum p.a.), potassium dichromate (crystalline p.a.), and hydrogen peroxide (30% p.a.) were purchased from Penta (CZ). The distilled water was purified in a PureLab Classic system (Veolia, UK). The non-perfumed soap Amadeus Neutral was purchased from Cormen (CZ). Helium 5.5 (purity ≥ 99.9995) and nitrogen 5.0 (purity ≥ 99.9990) from Linde (CZ) was used as the carrier gas and drying gas, respectively. Glass beads made of sodium–calcium glass (diameter 4.86 mm) were obtained from Glass Sphere (CZ). Standards of alkanes (C10–C32) were obtained from Sigma Aldrich (St. Louis, MO, USA).
2.2. Cleaning of the Sampling Material
Glass beads were used as the optimal sampling material, which is inexpensive and easy to clean. The cleaning procedure [13] was the following: glass beads were stored in a chromosulfuric mixture for 24 h. The sampling material was then washed with diluted hydrogen peroxide (5%). The next step was rinsing the glass beads three times with purified water, three times with ethanol, three times with hexane, and three times with ethanol again. The clean beads were dried in a dryer and stored in a desiccator for further usage. The experiment was run over 12 weeks, and the glass beads were cleaned for each week separately. The analytical cleanliness of the sampling glass beads was verified through HS-GC/MS analysis of the blank samples prior to sample collection. Forty clean glass beads (which corresponds to a volume of approximately 6 mL) were used for the scent collection for each sample, including the blank samples. The beads were counted and transferred to the 20 mL headspace vials using clean tweezers.
2.3. Method for Scent Samples Handling
The scent samples were collected (The collection was taken in the aired-out sampling room (there were always one volunteer and a person taking samples) from the palms of volunteers (four women, two men aged 23 to 25 years old, Europoid race, non-smokers, healthy, and no regular medications except contraception in two cases) onto glass beads once a week for three months. The volunteers were asked not to use any cosmetic products (perfumes, antiperspirants, creams, make-up, etc.) at least 24 h before the sampling to reduce undesirable influences. The volunteers washed their hands with a non-perfumed soap (The background of the soap was analyzed. It was verified that in combination with subsequent thorough hand washing, it did not contribute to an increase in the proportion of tertiary scents in the samples) for 30 s, and then the soap was rinsed off under warm tap water (approx. 2 min). The palms were left to dry in the air, and after that, by rubbing the palms together, and then the palm glands were left for 5 min to activate and produce the human scent. Then, the volunteers squeezed and rubbed the clean glass beads in the dried palms together for 10 min (The time for preparing the palms for scent collection and the time for scent collection have been optimized with the help of 4 volunteers). The volunteers then poured the sampled beads from their palms into the 20 mL headspace vials, and the vials were crimped. Each volunteer provided 12 samples in this way for 12 consecutive weeks. The samples were analyzed within 24 h of collection. Until then, they were stored in a refrigerator at 7 °C. Prior to the main sampling, the protocol was preliminarily tested three times, each with samples of four volunteers. The samples for this testing were taken from each volunteer within 1 h. The samples from individual volunteers were qualitatively and quantitatively similar, but the absolute amounts of individual VOCs varied slightly. However, the trends in the relative proportion of VOCs among samples from one volunteer were the same.
Unlike previous papers where the scent samples were collected from the armpit [3,6,7,8,9] or from other parts of the body that produce apocrine sweat, in all our studies [14,15], the scent samples were taken from washed palms. A similar approach was used by Colón-Crespo et al. [2]. We believe that the washed palms are significantly less contaminated by impurities and especially by various bacteria that, under suitable circumstances, (e.g., moist heat) decompose human scent compounds to other VOCs [16,17]. In addition, hands are our primary interaction tools with our surroundings [18]. This fact makes hand scent samples very interesting, especially for forensic disciplines. Mainly due to the complexity of the human scent, the elimination of impurities was critical since this study focuses on experiments under laboratory conditions rather than field applications.
All of the volunteers agreed to fill in questionnaires with personal data. The volunteers answered questions such as age, sex, race, medication taken, addictive substances used, physical activity, and food consumed over the past 48 h, but also mood and stress during sampling. The scent samples were analyzed by headspace (HS) gas chromatography coupled with mass spectrometry (HS-GC/MS).
2.4. Analysis of Scent Samples Using HS-GC/MS
The measurements were carried out on a GC-MS-TQ 8030 (Shimadzu, Japan) device equipped with an SLB-5ms column (30 m × 0.25 mm × 0.25 μm, Supelco, St. Louis, MO, USA). The samples were injected by the dynamic headspace technique [19] onto the column using an HS-20 Series Headspace Sampler (Shimadzu, Japan). This model is equipped with an electronic trap cooling that concentrates the volatile compounds into a trap filled with TENAX®, enabling their detection at lower concentrations. Thanks to the use of hydrophobic TENAX®, it is also possible to analyze samples containing moisture. Extraction from the headspace was performed as follows. Heating the vials with samples for equilibration was carried out at 160 °C for 30 min; the vial helium pressurization was carried out at a pressure of 70 kPa of helium pressurization gas and a temperature of 160 °C for 2 min three times. After pressurization, the volatile compounds were loaded into the trap, and the load time was 0.6 min after each pressurization. The trap cooling was set to −8 °C (the trap was dried with nitrogen gas); for subsequent dosing on the column, the trap was quickly heated to 280 °C, and the injection was performed in the splitless mode with a 2 min sampling time. The separation of compounds used the following protocol: 70 °C—2 min—8 °C/min—300°C—15 min; the total time of the analysis was 45.75 min. The helium carrier gas was used at a constant pressure of 100 kPa. The transfer line was tempered at 300 °C and the ion source at 250 °C. The ionization energy was set to 70 eV, and the range of m/z was from 25 to 600, and the data acquisition frequency was 5 Hz.
We monitored instrument performance and retention indices using results from repeated measurements of standard samples before each sequence. A mixture of alkanes (C10–C32) was prepared at a concentration of 50 mg L−1 of each component in hexane. Then, 1 µL of this mixture (corresponding to 50 ng of each component in the sample) was injected into a 20 mL headspace vial with the glass beads. These samples were measured under the same conditions as the scent samples. The smallest relative standard deviation for the peak area of docosane was 8.18% (n = 12). The absolute variation for this peak area was 2.43 ± 0.20 (peak area × 106, mean ± standard deviation). The biggest relative standard deviation for the peak area of tridecane was 10.44% (n = 12). The absolute variation for this peak area was 2.30 ± 0.31 (peak area × 106, mean ± standard deviation). Each sequence also included a blank analysis, which verified the purity of the sampling material and monitored impurities from the analytical procedure.
Sixty-nine samples were obtained (two female samples and one male sample of the original seventy-two samples were excluded due to poor sample quality caused by the insufficient (in female samples’ cases) or excessive (in a male sample’s case) adsorption of chemical compounds onto the sampling material).
The obtained data were analyzed in the GC-MS Postrun Analysis program (Shimadzu, Japan). The compounds present in the scent samples were identified based on the retention indices and similarity with the Spectra library NIST MS Search 2.0 [20]. The retention indices calculation was based on linear retention indices (LRIs) [21]. The retention indices standard uncertainties were estimated as one.
2.5. Data Preprocessing
The preprocessing of the chromatographic data was necessary and was performed in the Matlab environment using the Statistical Toolbox. Since the composition of the human scent is very similar in men and women, the question of the composition of an individual’s scent must be solved quantitatively and the data normalized in some way. The reference to the internal standard is not appropriate in our case because the absolute amount of the scent collected is individual and cannot be easily controlled. The amount taken can be related, for example, to physical exertion, temperature, and humidity. Using the internal standard in this way, we could only say that the amount of scent collected was higher or lower than on other days. Therefore, we used a similar approach as other authors (not relating the representation of VOCs to the internal standard but evaluating their relative representation) [3,9], and the data were reprocessed as follows.
In the first step, the referential compound ref for the calculation of the ratios was chosen. The selection of the referential compound is described in the Section 3 and Section 4. Then, the logarithmic ratio of the k-th compound was calculated as where are areas under the peaks of the k-th and the referential compounds in the given sample, is a ratio tolerance (further details about tolerance choice can be found below in this paragraph). The ratios of the areas under chromatographic peaks were used instead of their absolute values because the ratios are scaling invariant. Concerning the fact that some compounds have trace concentrations while others are relatively large, their values and ratios vary by several orders of magnitude. Therefore, we suppose the log-normal distribution of concentration values. In this case, the logarithms of concentrations and their ratios have the normal distribution, which increases classification power in the sense of accuracy, and critical sensitivity. Another problem could be caused by small positive or zero areas under the peaks in the given sample because the logarithmic transformation is, unfortunately, very sensitive to small ratio values. The ratio values constrained by a suitable threshold value (tolerance) suppress this negative property. Therefore, the zero values in the numerators were treated by the ratio tolerance choice. The lower threshold values generate outliers, but higher thresholds make the transform insensitive. The optimal threshold value of 0.001 is a result of experimental investigation and was applied in all the chromatographic peaks, with their areas lower than 0.1% of the peak area of the referential compound. The zero denominators do not appear when the referential compound is contained in all the samples.
In the next step of the data preprocessing, we reduced the number of logarithmic ratios to the reasonably small value H by applying the nonparametric statistical test. Specifically, we used the Wilcoxon-Mann–Whitney test (WMW) [22] of median equality on the significance level for every logarithmic ratio to obtain significant differences between females’ (F) and males’ (M) samples.
2.6. Female/Male Classifiers
There are many various approaches to the final female/male classifier design. We applied three of them, which represent traditional and efficient learning techniques of various origins. The first of them was the so-called Linear Support Vector Machine (SVM) [23]. The second approach was Ridge Regression (RR) [24], followed by thresholding. This approach was used to obtain another classifier with the same output response as the linear SVM but with another learning strategy. The third method used was Quadratic Discriminant Analysis (QDA) [25] with Data Whitening [26] as an improvement of Principal Component Analysis (PCA) [27], which enables more efficient QDA. The selection of significant compounds responsible for the distribution of samples by sex depends on the method used and its parameters. For details on individual methods, see Supplementary Materials S1—A more detailed explanation of how the selected classification methods work.
2.7. Cross-Validation Technique
The Leave-One-Out [28] cross-validation technique was used for classifier evaluation. In the case of a few data samples, the leave-one-out strategy of cross-validation is the strongest possible choice for how to obtain statistically valid results. The learning occurs after the removal of the i-th sample, which is used only for cross-validation. The resulting contingency table is set by samples and enables the evaluation of the quality criteria [29]. The classifier quality criteria are accuracy (acc), sensitivity (se), specificity (sp), and critical sensitivity (se*) as the minimum of se and sp. The female class is denoted as positive with P members, and the male class is denoted as negative with N members. Successfully classified female samples are denoted as true positive and their number as TP. Successfully classified male samples are denoted as true negative and their number as TN. The ratio TP/P is called the sensitivity, and the ratio TN/N is called the specificity as particular cases of class sensitivities. The flowchart of the procedure to obtain the female/male classifiers is shown in Figure 1.
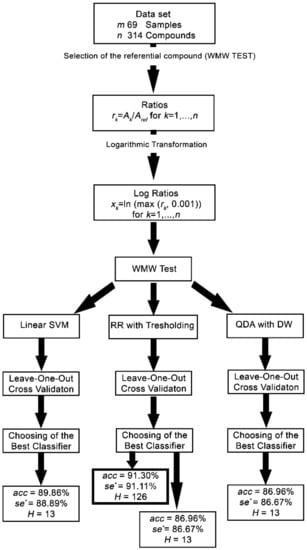
Figure 1.
Flowchart of the procedure to obtain the female/male classifiers. WMW—Wilcoxon-Mann–Whitney; SVM—Support Vector Machine; RR—Ridge Regression; QDA—Quadratic Discriminant Analysis; acc = accuracy; se* = critical selectivity; H = reduced number of significant compounds.
3. Results
In all the chromatograms, 314 different scent compounds were identified (a table with all raw data visualized as a heat map is provided in the Supplementary Materials S2—RawData_Heatmap). Compounds known to arise from the analytical procedure (known from the measurement of blanks), e.g., siloxanes, were removed. Through the repeated sampling of the volunteers, we lowered the risk of involving ad hoc chemical compounds in the experimental statistical models. Multiple sampling of every volunteer allows the identification of chemical compounds that are common in an individual’s skin scent. Their number and relative concentrations varied not only from person to person but also from day to day or week to week for each individual. Forty-eight compounds were present in at least 75% of samples, and twenty-eight of them in 90%. These most common human scent VOCs and their retention indices are summarized in Table 1. An example of a human scent chromatogram is shown in Figure 2.

Table 1.
Compounds contained in at least 75%, 90% of samples and in all the samples with their retention indices.
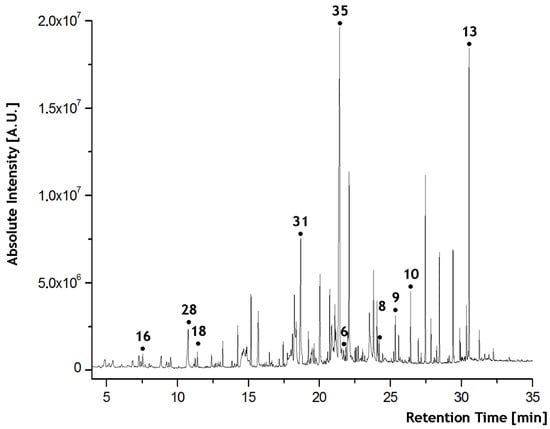
Figure 2.
An example of a human scent chromatogram indicating some selected compounds (numbering corresponds to Table 1).
Only eight compounds (Nonanal, Undecanal, Docosane, Tricosane, Tetracosane, Nonanoic acid, Tetradecanoic acid, and Hexadecanoic acid; they are marked in Figure 2) appeared in all the samples as candidates for the referential compound.
The Wilcoxon–Mann–Whitney (WMW) two-sample nonparametric test was used to select the best logarithmic ratios of the chromatographic peak areas, which distinguish between the female and male samples. The best ratio was with p-value < 5 × 10⁻⁹ in the WMW test (Eicosane is marked with the no. 6 in Figure 2). The obtained sensitivity was 82.22% when eight female and three male samples were misclassified. Therefore, tetradecanoic acid was used as a reference in all our investigations (Other compounds can also be used as referential ones with similar classification power. We used only one compound as a reference in order to reduce the volume of the data). The reasons for selecting the reference compound are described in the Section 2.5.
The WMW test was used to select the most significant compounds for various significance levels α. The test results are collected in Table 2, along with the variance content of the first three principal components, for better data description.
Table 2.
WMW test of area ratios: Significant differences between F/M.
Then, the cross-validations of linear SVM, RR with thresholding, and QDA with data whitening were performed for various significance levels, α. Due to the small data sample, the weight estimates of Ridge Regression are biased, which complicates the classification. However, the resulting prediction bias is diminished by the Leave-One-Out cross-validation strategy.
As seen in Table 3, the best linear SVM was obtained for α = 0.2 (126 initial compounds selected by the WMW test) and C = 2 (the regularization parameter) when H = 13 (the new reduced number of significant compounds). These compounds were 2-hexyl-1-octanol, 2-hexyl-1-decanol, 1-hexadecanol, benzoic acid, dodecanoic acid, hexadecanoic acid, x-heptadecenoic acid, dodecyl ester of hexadecanoic acid, x-heptadecene, docosane, 1-chlordodecane, and octadecanamide. The best accuracy and critical sensitivity were 89.86% and 88.89%, with five female samples and two male samples being misclassified.
Table 3.
Leave-One-Out Cross-Validation of Linear SVM.
The RR with thresholding had the best performance (see Table 4) for α = 0.2 and μ = 0.5 when H = 126, and the best accuracy and critical sensitivity were 91.30% and 91.11% when four female samples and two male samples were misclassified.
Table 4.
Leave-One-Out Cross-Validation of thresholded Ridge Regression.
This classifier indicates that unsaturated fatty acids (x-pentadecenoic, 9-hexadecenoic and x-heptadecenoic acid) are found to a greater extent in the scent of men (in terms of median), while in the scent of women, saturated acids predominate (dodecanoic, pentadecanoic, hexadecanoic, and octadecanoic acid). Aldehydes (nonanal, dodecanal, pentadecanal, benzeneacetaldehyde), ketones (2-nonanone, 6,10-dimethyl-5,9-undecadien-2-one), and hydrocarbons (octadecane, nonadecane, eicosane, heneicosane, hexacosane, and octacosane) are also observed to a greater extent (in terms of median) in the women’s scents. The box charts of these compounds are in the Supplementary Material S3—BoxCharts. Women’s scents also contain many compounds reported by various sources as part of cosmetics (2-pentylfuran dodecyl to pentadecyl benzoates, isopropyl myristate, isopropyl palmitate, 1-octyl-4-methoxycinnamate, 2-ethylhexyl-4-methoxycinnamate, octocrylene). The male scents, on the other hand, contain low volatile compounds with longer carbon chains (nonadecanoic acid and eicosanoic acid).
This RR with thresholding classifier offered the best results, but using 126 compounds and their logarithmic ratios were necessary (The critical sensitivity criterion se* is preferred as the most stringent one. The accuracy acc and classifier complexity H are presented as traditional ones. Therefore, the best results have been obtained in the case of Ridge Regression (RR) when se* = 91.11%). However, if we use α = 0.0000035 and μ = 0.1, it is sufficient to use 13 significant compounds as in the case of linear SVM. These compounds were octanoic acid, x-pentadecenoic acid, x-heptadecenoic acid, eicosane, docosane, tricosane, tridecyl benzoate, tetradecyl benzoate, 2-ethylhexyl-4-methoxycinnamate, 1-octyl-4-methoxycinnamate, 2-pentylfuran, octanal, and nonanal. This classifier with comparable complexity had decreased accuracy and a critical sensitivity of 86.96% and 86.67%, with six female samples and three male samples being misclassified.
The results of QDA with data whitening are collected in Table 5. The best accuracy of 86.96% and critical sensitivity of 86.67%, when six female samples and three male samples were misclassified, were obtained for α = 0.0000035 and D = 10 with the use of 13 compounds. These compounds were the same as when using ridge regression for α = 0.0000035.
Table 5.
Leave-One-Out Cross-Validation of QDA with optimal whitening dimension D.
4. Discussion
A simple method for the collection of the human palm scent and its subsequent HS-GC/MS analysis was presented. The palm’s scent could be more forensically interesting than commonly examined axillary sweat. This postulate comes from the fact that palms and hands, in general, are the main “interacting” tool when it comes to manipulating various objects (such as door handles, knives and items of everyday life) [18]. The advantage of using the headspace technique [19] with glass beads as sampling material is the simple sample preparation (lengthy, often up to 24 h extraction per fiber is eliminated) and the possibility to observe a broader spectrum of compounds than the traditional SPME-GC/MS technique which was used, e.g., in [30,31,32,33]. These findings could be applied, e.g., for the headspace analysis of samples collected using non-contact human scent sampling devices (e.g., STU-100 [34,35]) that have been proposed for sampling in forensic practice.
Three approaches to data processing (RR, linear-SVM, QDA) were successfully applied for scent sex differentiation with classifiers’ accuracies of 86.96–91.30%. The results confirm the assumption that relative ratios with the selected reference compound (here, tetradecanoic acid) can be used to search for differences in scent between the sexes. However, it should be emphasized that the quantitative differences for the compounds mentioned in the previous section are not dramatic, and even if the median values between female and male scent samples differ, the range of measured values overlaps for both sexes (see Supplementary Materials S3—BoxCharts). Except for unsaturated acids (x-pentadecenoic, 9-hexadecenoic, and x-heptadecenoic acids) and compounds with a longer carbon chain (nonadecanoic and eicosanoic acids), all other compounds have a higher median in female scent samples. In the case of female scent samples, there is also a broader range of measured values, and there are many outliers. This may be related to several things: the set of female scent samples was more numerous than male ones, the female scents are affected by changing hormones during the menstrual cycle, and women have different lifestyles than men, especially regarding the use of beauty products. Many compounds used by the presented classifiers probably help to distinguish between female and male scent samples not based on genetic or metabolic differences (i.e., a primary or secondary component of the scent [31]) but based on exogenous scents (so-called tertiary scents [31]).
For example, the SVM classifier uses three alcohols (out of 13 significant compounds, specifically 2-hexyl-1-octanol, 2-hexyl-1-decanol, and hexadecanol) as key factors for identification. All of these compounds are used for the production of soaps and shower gels. Moreover, these compounds, together with x-heptadecene, which this classifier also uses, were found in only a few samples. Thus, it is very likely that this classifier would not work when expanding the data set.
The QDA classifier (or RR classifier) with 13 significant compounds also uses compounds probably originating from cosmetics (tridecyl and tetradecyl benzoates, 1-octyl-4-methoxycinnamate, and 2-ethylhexyl-4-methoxycinnamate). However, these compounds occur in almost all samples regardless of sex, as well as all other nine significant compounds. The most interesting group of compounds here are the alkanes (eicosane, docosane, tricosane), for which the largest median differences between the sexes can be observed, together with the smallest overlap of the range of values, see Figure 3.
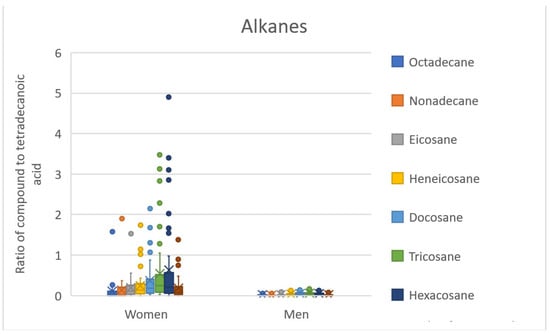
Figure 3.
BoxCharts—ratios of alkanes to tetradecanoic acid. Range of values for female and male scent samples.
The RR classifier with 126 significant compounds expands these alkanes by octadecane, nonadecane, heneicosane, hexacosane, and octacosane, see Figure 3. Octadecane, nonadecane, and docosane have already been identified as significant compounds in previous publications [2,3] (see Table 6). The importance of hydrocarbons (alkanes, alkenes) is discussed in many publications in connection with communication in the insect kingdom (partner selection, caste differences in ants, etc.) [36,37,38]. A study by Omura et al. [39] then identifies higher alkanes together with fatty acids as the compounds responsible for sexual dimorphism in scent in Papilio protenor butterflies. Fatty acids are the second interesting group of compounds that have already been mentioned in connection with the scent difference in sex in humans (specifically dodecanoic, pentadecanoic, and hexadecanoic acids, [2,3] see Table 6). It is possible that alkanes and fatty acids can play an important role in sex differentiation in humans; however, we have too little data available for these conclusions.
Table 6.
Comparison of results with other studies dealing with the determination of sex from human scent.
For unambiguous statistical evaluation, more experiments with a significantly extended dataset are desirable. Nevertheless, multiple sampling of the volunteers lowered the risk of involving ad hoc chemical compounds in experimental statistical models. Repeated sampling of every volunteer gave us the opportunity to identify compounds that are commonly found in human scents (see Table 1).
In addition, we plan to extend our chromatographic experiments by using methods not discriminating against low volatile compounds (such as fatty esters). According to recent studies [13,14], these esters have crucial importance among the primary human scent compounds, and these low volatile compounds remain at a crime scene for a long time.
5. Conclusions
This study presented a simple and rapid method for sex differentiation on the basis of the chemical analysis of human scent through the use of HS-GC/MS. The human scent was sampled from the palms with glass beads as the sampling material. Glass beads are cheap and can be easily and reproducibly cleaned. On top of that, glass beads allow rapid adsorption and desorption of a wide range of VOCs, making it possible to monitor more analytes than in the case of SPME extraction [12]. The main advantage of the headspace sampling approach is that there is no need for further sample preparation. Additionally, HS, in combination with a Tenax® trap, allows for the concentration of volatile chemical compounds and the detection of compounds with very low concentrations. The combination of HS-GC/MS analysis with the concentration of compounds in a Tenax® trap has not yet been reported in connection with the analysis of human scent. Based on the described measurement method, a chemical analysis of scent differences between sexes was performed. The tested models have accuracies of about 90%. The differences in scent between the sexes are in the relative abundances of common VOCs, such as alkanes, acids, esters, aldehydes, or alcohols. However, the quantitative differences in the representation of individual compounds are not significant, and the variances of the values overlap in the scent samples of men and women. Therefore, the samples cannot be simply classified according to the presence of certain VOCs in a certain amount. Samples should always be assessed comprehensively based on different VOCs in different proportions. It is also likely that some of the significant VOCs helped to divide the samples not based on sexes but based on the different lifestyles of the volunteers. These results indicate the possibility of using scent analyses as a supporting proof in forensic investigations. At present, scent trails are mainly investigated with the help of specially trained dogs [40] (so-called olfactory analysis); additional instrumental (so-called olfactronic) analysis could thus represent support for this olfactory form of scent analysis, especially with the emphasis on possible classification of certain characteristics; for example, sex from unknown samples. Considering the lower precision score of the presented results in comparison with DNA analysis [41], further experiments with a larger sample pool are needed.
Supplementary Materials
The following supporting information can be downloaded at: https://www.mdpi.com/article/10.3390/separations10050293/s1, S1. A more detailed explanation of how the selected classification methods work; S2. RawData_Heatmap; S3. BoxCharts. Ref. [42] is cited in the Supplementary Materials S1.
Author Contributions
Conceptualization, P.P., N.L. and V.Š.; methodology, P.P. and J.K.; software, J.K.; validation, J.K.; formal analysis, P.P.; resources, Š.U.; data curation, P.P.; writing—original draft preparation, P.P.; writing—review and editing, P.P., N.L., V.Š. and Š.U.; visualization, N.L.; supervision, Š.U.; project administration, Š.U.; funding acquisition, Š.U. All authors have read and agreed to the published version of the manuscript.
Funding
This research was funded by the Ministry of the Interior of the Czech Republic projects no. VJ01010123 and VK01010240.
Institutional Review Board Statement
This study was approved by the Institutional Review Board of the University of Chemistry and Technology, Prague (approval number EK/8/2020) and complies with the Declaration of Helsinki for Medical Research involving Human Subjects.
Informed Consent Statement
The recruited volunteers were verbally instructed regarding the sampling method and analysis. They signed an agreement (written consent) regarding using his/her scent samples in this experiment and publishing the results obtained. The samples of the volunteers were used for this experiment only, and then these samples were destroyed.
Data Availability Statement
The data presented in this study are available from the corresponding author.
Conflicts of Interest
The authors declare no conflict of interest. The funders had no role in the design of the study; in the collection, analyses, or interpretation of data; in the writing of the manuscript; or in the decision to publish the results.
Abbreviations
| acc | accuracy |
| C | regularization parameter (in linear SVM method) |
| D | number of uncorrelated PCA components (in QDA with data whitening method) |
| GC/MS | Gas Chromatography/Mass Spectrometry |
| H | number of significant compounds that differ between the males’ and females’ samples |
| HS | Headspace |
| LDA | Linear Discriminant Analysis |
| PCA | Principal Component Analysis |
| PDMS | Polydimethylsiloxane |
| PLS-DA | Partial Least Squares Discriminant Analysis |
| QDA | Quadratic Discriminant Analysis |
| RR | Ridge Regression |
| se | sensitivity |
| se* | critical sensitivity (minimum of se and sp) |
| sp | specificity |
| SBSE | Stir Bar Sorptive Extraction |
| SPME | Solid Phase MicroExtraction |
| SVM | Support Vector Machine |
| VOCs | Volatile Organic Compounds |
| WMW | Wilcoxon-Mann–Whitney test |
| α | significance level |
| μ | ratio estimate of the data noise variance and prior weight variance (in RR method) |
References
- Prada, P.A.; Curran, A.M.; Furton, K.G. Human Scent Evidence; CRC Press: New York, NY, USA, 2014. [Google Scholar]
- Colón-Crespo, L.J.; Herrera-Hernández, D.; Holness, H.; Furton, K.G. Determination of VOC marker combinations for the classification of individuals by gender and race/ethnicity. Forensic Sci. Int. 2017, 270, 193–199. [Google Scholar] [CrossRef] [PubMed]
- Penn, D.J.; Oberzaucher, E.; Grammer, K.; Fischer, G.; Soini, H.A.; Wiesler, D.; Novotny, M.V.; Dixon, S.J.; Xu, Y.; Brereton, R.G. Individual and gender fingerprints in human body odour. J. R. Soc. Interface 2007, 4, 331–340. [Google Scholar] [CrossRef] [PubMed]
- Prokop-Prigge, K.A.; Greene, K.; Varallo, L.; Wysocki, C.J.; Preti, G. The Effect of Ethnicity on Human Axillary Odorant Production. J. Chem. Ecol. 2016, 42, 33–39. [Google Scholar] [CrossRef]
- Shirasu, M.; Touhara, K. The scent of disease: Volatile organic compounds of the human body related to disease and disorder. J. Biochem. 2011, 150, 257–266. [Google Scholar] [CrossRef]
- Zeng, X.N.; Leyden, J.J.; Lawley, H.; Sawano, K.; Nohara, I.; Preti, G. Analysis of characteristic odors from human male axillae. J. Chem. Ecol. 1991, 17, 1469–1492. [Google Scholar] [CrossRef]
- Zeng, X.N.; Leyden, J.J.; Spielman, A.I.; Preti, G. Analysis of characteristic human female axillary odors: Qualitative comparison to males. J. Chem. Ecol. 1996, 22, 237–257. [Google Scholar] [CrossRef]
- Curran, A.M.; Rabin, S.I.; Prada, P.A.; Furton, K.G. Comparasion of the Volatile Organic Compounds Present in Human Odor Using SPME-GC/MS. J. Chem. Ecol. 2005, 31, 1607–1619. [Google Scholar] [CrossRef]
- Dixon, S.J.; Xu, Y.; Brereton, R.G.; Soini, H.A.; Novotny, M.V.; Oberzaucher, E.; Grammer, K.; Penn, D.J. Pattern recognition of gas chromatography mass spectrometry of human volatiles in sweat to distinguish the sex of subjects and determine potential discriminatory marker peaks. Chemom. Intell. Lab. Syst. 2007, 87, 161–172. [Google Scholar] [CrossRef]
- Plutowska, B.; Wardencki, W. Aromagrams—Aromatic profiles in appreciation of food quality. Food Chem. 2007, 101, 845–872. [Google Scholar] [CrossRef]
- Piryaei, M. Direct thermal desorption technique as a very fast, easy and low-cost method for analysis of volatile components compounds by gas chromatography with mass spectrometry. Sep. Sci. Plus 2019, 2, 416–421. [Google Scholar] [CrossRef]
- Kanavouras, A.; Kiritsakis, A.; Hernandez, R.J. Comparative study on volatile analysis of extra virgin olive oil by dynamic headspace and solid phase micro-extraction. Food Chem. 2005, 90, 69–79. [Google Scholar] [CrossRef]
- Pojmanová, P.; Ladislavová, N.; Škeříková, V.; Kania, P.; Urban, Š. Human scent samples for chemical analysis. Chem. Pap. 2020, 74, 1383–1393. [Google Scholar] [CrossRef]
- Doležal, P.; Furton, K.G.; Lněničková, J.; Kyjaková, P.; Škeříková, V.; Valterová, I.; Pinc, L.; Urban, Š. Multiplicity of human scent signature. Egypt. J. Forensic Sci. 2019, 9, 7. [Google Scholar] [CrossRef]
- Doležal, P.; Kyjaková, P.; Valterová, I.; Urban, Š. Qualitative analyses of less-volatile organic molecules from female skin scents by comprehensive two dimensional gas chromatography–time of flight mass spectrometry. J. Chromatogr. A 2017, 1505, 77–86. [Google Scholar] [CrossRef]
- Ramotowski, R.S. Composition of Latent Print Residue. In Advances inf Fingerprint Technology; Lee, H.C., Gaensslen, R.E., Eds.; CRC Press: New York, NY, USA, 2001; pp. 63–104. [Google Scholar]
- Curran, A.M.; Ramirez, C.F.; Schoon, A.A.; Furton, K.G. The frequency of occurrence and discriminatory power of compounds found in human scent across a population determined by SPME-GC/MS. J. Chromatogr. B 2007, 846, 86–97. [Google Scholar] [CrossRef]
- Brown, J.S.; Prada, P.A.; Curran, A.M.; Furton, K.G. Applicability of emanating volatile organic compounds from various forensic specimens for individual differentiation. Forensic Sci. Int. 2013, 226, 173–182. [Google Scholar] [CrossRef]
- Moldoveanu, S.C.; David, V. Chapter 9—Headspace Sampling Techniques in Gas Chromatography. In Journal of Chromatography Library; Moidoveanu, S.C., David, V., Eds.; Elsevier: Amsterdam, The Netherlands, 2002; Volume 65, pp. 267–285. [Google Scholar] [CrossRef]
- Stein, S.; Linstrom, P.; Mirokhin, Y.; Tchekhovskoi, D.; Yang, X. NIST Mass Spectral Search Program (Version 2.0g); NIST (National Institute of Standards and Technology): Gaithersburg, MD, USA, 2011. [Google Scholar]
- Van Den Dool, H.; Kratz, P.D. A generalization of the retention index system including linear temperature programmed gas—Liquid partition chromatography. J. Chromatogr. A 1963, 11, 463–471. [Google Scholar] [CrossRef] [PubMed]
- Fay, M.P.; Proschan, M.A. Wilcoxon-Mann-Whitney or t-test? On assumptions for hypothesis tests and multiple interpretations of decision rules. Stat. Surv. 2010, 4, 1. [Google Scholar] [CrossRef]
- Steinwart, I.; Christmann, A. Support Vector Machines; Springer Science+Business Media: New York, NY, USA, 2008. [Google Scholar]
- Golub, G.; Heath, M.; Wahba, G. Generalized cross-validation as a method for choosing a good ridge parameter. Technometrics 1979, 21, 215–223. [Google Scholar] [CrossRef]
- Etemad, K.; Chellappa, R. Discriminant analysis for recognition of human face images. J. Opt. Soc. Am. A 1997, 14, 1727–1733. [Google Scholar] [CrossRef]
- Kessy, A.; Lewin, A.; Strimmer, K. Optimal Whitening and Decorrelation. Am. Stat. 2018, 72, 309–314. [Google Scholar] [CrossRef]
- Jolliffe, I.T. Principal Component Analysis; Springer: New York, NY, USA, 2002. [Google Scholar]
- Stone, M. Asymptotics for and against cross-validation. Biometrika 1977, 64, 29–35. [Google Scholar] [CrossRef]
- Fawcett, T. An introduction to ROC analysis. Pattern Recognit. Lett. 2006, 27, 861–874. [Google Scholar] [CrossRef]
- Caroprese, A.; Gabbanini, S.; Beltramini, C.; Lucchi, E.; Valgimigli, L. HS-SPME-GC-MS analysis of body odor to test the efficacy of foot deodorant formulations. Ski. Res. Technol. 2009, 15, 503–510. [Google Scholar] [CrossRef]
- Curran, A.M.; Prada, P.A.; Furton, K.G. The Differentiation of the Volatile Organic Signatures of Individuals Through SPME-GC⁄MS of Characteristic Human Scent Compounds. J. Forensic Sci. 2010, 55, 50–57. [Google Scholar] [CrossRef]
- Prada, P.A.; Curran, A.M.; Furton, K.G. The evaluation of human hand odor volatiles on various textiles: A comparison between contact and noncontact sampling methods. J. Forensic Sci. 2011, 56, 866–881. [Google Scholar] [CrossRef]
- Syed, Z.; Leal, W.S. Acute olfactory response of Culex mosquitoes to a human- and bird-derived attractant. Proc. Natl. Acad. Sci. USA 2009, 106, 18803–18808. [Google Scholar] [CrossRef]
- DeGreeff, L.E.; Curran, A.M.; Furton, K.G. Evaluation of selected sorbent materials for the collection of volatile organic compounds related to human scent using non-contact sampling mode. Forensic Sci. Int. 2011, 209, 133–142. [Google Scholar] [CrossRef]
- Caraballo, N.I.; Mendel, J.; Holness, H.; La Salvia, J.; Moroose, T.; Eckenrode, B.; Stockham, R.; Furton, K.; Mills, D. An investigation into the concurrent collection of human scent and epithelial skin cells using a non-contact sampling device. Forensic Sci. Int. 2016, 266, 148–159. [Google Scholar] [CrossRef]
- Snellings, Y.; Herrera, B.; Wildemann, B.; Beelen, M.; Zwarts, L.; Wenseleers, T.; Callaerts, P. The role of cuticular hydrocarbons in mate recognition in Drosophila suzukii. Sci. Rep. 2018, 8, 4996. [Google Scholar] [CrossRef]
- Pulliainen, U.; Bos, N.; d’Ettorre, P.; Sundström, L. The Scent of Ant Brood: Caste Differences in Surface Hydrocarbons of Formica exsecta Pupae. J. Chem. Ecol. 2021, 47, 513–524. [Google Scholar] [CrossRef] [PubMed]
- Seidelmann, K.; Rolke, D. Advertisement of unreceptivity—Perfume modifications of mason bee females (Osmia bicornis and O. cornuta) and a non-existing antiaphrodisiac. PLoS ONE 2019, 14, e0215925. [Google Scholar] [CrossRef] [PubMed]
- Omura, H.; Yanai, N.; Honda, K. Sexual dimorphism in scent substances and cuticular lipids of adult Papilio protenor butterflies. Z. Für Nat. C 2012, 67, 331–341. [Google Scholar] [CrossRef] [PubMed]
- Woidtke, L.; Dreßler, J.; Babian, C. Individual human scent as a forensic identifier using mantrailing. Forensic Sci. Int. 2018, 282, 111–121. [Google Scholar] [CrossRef] [PubMed]
- Lieberman, J.D.; Carrell, C.A.; Miethe, T.D.; Krauss, D.A. Gold versus platinum: Do jurors recognize the superiority and limitations of DNA evidence compared to other types of forensic evidence? Psychol. Public Policy Law 2008, 14, 27–62. [Google Scholar] [CrossRef]
- Sierksma, G.; Zwols, Y. Linear and Integer Optimization: Theory and Practice, 3rd ed.; CRC Press: New York, NY, USA, 2015. [Google Scholar]


Disclaimer/Publisher’s Note: The statements, opinions and data contained in all publications are solely those of the individual author(s) and contributor(s) and not of MDPI and/or the editor(s). MDPI and/or the editor(s) disclaim responsibility for any injury to people or property resulting from any ideas, methods, instructions or products referred to in the content. |
© 2023 by the authors. Licensee MDPI, Basel, Switzerland. This article is an open access article distributed under the terms and conditions of the Creative Commons Attribution (CC BY) license (https://creativecommons.org/licenses/by/4.0/).