Article

Cross-Contamination of Ignitable Liquid Residues on Wildfire Debris—Detection and Characterization in Matrices Commonly Encountered at Wildfire Scenes

1
Department of Civil, Geological and Environmental Engineering, University of Saskatchewan, 57 Campus Drive, Saskatoon, SK S7N 5A9, Canada
2
Department of Earth and Environmental Sciences, Mount Royal University, 4825 Mount Royal Gate SW, Calgary, AB T3E 6K6, Canada
3
Chemistry Matters Inc., 104-1240 Kensington Rd NW Suite 405, Calgary, AB T2N 3P7, Canada
4
Department of Chemistry and Physics, Mount Royal University, 4825 Mount Royal Gate SW, Calgary, AB T3E 6K6, Canada
5
Department of Geography and Environment, University of Lethbridge, 4401 University Drive W, Lethbridge, AB T1K 3M4, Canada
*
Author to whom correspondence should be addressed.
Separations 2023, 10(9), 491; https://doi.org/10.3390/separations10090491
Submission received: 28 July 2023 / Revised: 28 August 2023 / Accepted: 7 September 2023 / Published: 11 September 2023
(This article belongs to the Special Issue Chemical Separations in Criminalistics)

Abstract

:
Ignitable liquid residue (ILR) samples play an important role in fire investigations. Similar to other types of forensic evidence, maintaining sample integrity depends on the prevention of cross-contamination during both storage and transport. This study examines cross-contamination in ILR samples on various sample matrices (gravel, soil, wood). After inducing leaks in a controlled environment, sample analysis by GC×GC-ToF MS allowed for sensitive detection and in-depth characterization of cross-contamination processes. The potential for false positive identification of ILR is notably present due to cross-contamination. Compound transmission for a mid-range ILR (gasoline), for instance, was detectable after a 1 h exposure, with a complete profile transfer occurring after 8 h regardless of the matrix type. Visual comparisons and uptake rate calculations further confirmed matrix interaction effects taking place in the form of inherent native compound interference and adsorbate–adsorbate interaction during transmission and extraction processes for soil and wood matrices. Chemometric analysis highlighted the advantage of employing statistical analysis when investigating samples under matrix interactions by identifying several statistically significant compounds for reliably differentiating cross-contamination from background and simulated positive samples in different volatility ranges and compound classes. Untargeted analysis tentatively identified three additional compounds of interest within compound classes not currently investigated in routine analysis. The resulting classification between background, contaminated, and simulated positive samples showed no potential for false positive ILR identification and improved false negative errors, as evidenced by classification confidences progressing from 88% for targeted and 93% for untargeted to 95% for a diagnostic ratio analysis of three ratios deployed in tandem.

Graphical Abstract

1. Introduction

Arson investigations play a crucial role in determining the causes and origins of fires, often requiring meticulous analysis of evidence to establish if an accelerant was employed to start the fire intentionally. One vital aspect of these investigations involves the detection and identification of ignitable liquid residue (ILR), which serves as compelling evidence in proving arson. To ensure the reliability and defensibility of data, it is essential to maintain utmost confidence in the integrity of each scene sample throughout the entire process, from collection to analysis. Due to the high carbon content of fire debris, it is possible that the sample matrix may absorb non-ILR related compounds from the environment if not collected or stored properly.
Contamination, the unwanted transfer of material from another source [1], can occur on scene or in the laboratory due to improper handling. However, cross-contamination, which refers to the unwanted transfer of material between two or more sources of evidence [1], is commonly known to occur during transport and storage. This cross-contamination is often caused by poor seals, highly impacted samples, and container degradation during storage. Because the transport and storage of ILR debris can be a lengthy process, especially in remote fire scenes with long intervals between sample collection and judicial proceedings, it becomes crucial to ensure sample integrity during this period. Achieving this largely depends on the use of clean, non-contaminated, chemical-resistant, and vapour-tight containers for storage until extraction [2,3].
The durability, purity, and permeability of containers can have implications on the interpretation of results. Several studies have evaluated the performance of containers, such as metal cans [2], glass mason jars [2,3], polyethylene containers [4], DUO bags [5], nylon bags [5,6], and AMPAC bags [5]. A comparison found that glass jars had the highest leak rate, closely followed by metal cans, and, lastly, polymer bags, which could be attributed to their sealing mechanisms [2]. No glass or metal container formed a perfect seal, and improper seals for polymer bags were visually indistinguishable from well-sealed bags [2]. While polymer- or plastic-based containers have been shown to seal more reliably, they must be vetted before official use in fire investigations. The material porosity has the potential to absorb important ILR compounds, which can result in further loss prior to extraction [5].
Although the impact of background matrices is well known [7,8,9], most cross-contamination studies are conducted without a background matrix present [2,3,5], or concentrate on non-competing matrix substitutions, such as clean wipes [6,10]. Existing studies investigating the cross-contamination potential for ILR have been conducted using one-dimensional GC-MS, which does not allow for the separation of trace ILR compounds from a busy matrix—something the increased separation potential of comprehensive multidimensional gas chromatography (GC×GC) can address. Additionally, the detection of cross-contamination is not uniformly defined within the literature. Because studies are commonly performed in order to test materials under controlled conditions, the presence of any individual or combination of several compounds expected to be encountered within the ignitable liquid used in a study is considered sufficient to determine cross-contamination [2,3,5,6]. While the chemical compound group and individual compounds detected differ between packing materials and ignitable liquid sources under investigation, they typically comprise more volatile compounds due to the nature of passive transfer.
The existing literature concentrates on sources of potential contamination and cross-contamination, with no recent advancements into differentiating cross-contamination from positive samples as part of the data interrogation process. Investigations extending the relationship between cross-contamination and fire debris interpretation focus on the potential for false positive interpretation [3], with no current foray into false negative error determination. Furthermore, studies investigating chemometric tools to aid interpretation [11,12] focus on classification and background matrices commonly encountered in house or industrial fires as opposed to detecting cross-contamination in wildfire matrices.
Where the previous literature did not include competing matrixes, the study presented herein aims to analyze and characterize the uptake of ILR onto non-impacted matrices commonly encountered in wildfire debris, including a non-competing matrix (gravel) and matrices known for their interference potential (soil, wood). The goal is to detect cross-contamination by employing advanced analytical techniques (GC×GC over one-dimensional GC) and investigating the entire ILR volatility spectrum to fully characterize cross-contamination in a simulated scenario where the seal of metal quart cans has failed. In addition to full characterization by investigating major compound types and relative distributions thereof between background, contaminated, and simulated positive samples, this study further aims to evaluate false positive and false negative error occurrences by employing targeted and untargeted chemometric analysis methods.

2. Materials and Methods

2.1. Standards and Reagents

Benzene (99.9%), carbon disulfide (99.9%), naphthalene-d8 (AC174960010), ethylbenzene-d10 (AC321360010), dichloromethane (99.9%), methanol (99.9%), and toluene (99.9%) were obtained from Fisher Scientific (Ottawa, ON, Canada). 1,3,5-trimethylbenzene-d12 (372374-1G) was purchased from Sigma Aldrich (Supelco, Bellefonte, PA, USA) and 1,2,4,5-tetramethylbenzene-d14 (D-0269) was purchased from CDN isotopes (Pointe-Claire, QC, Canada). Deuterated Kovats–Lee retention index mix (KLI mix) was acquired from Cambridge Isotope Laboratories, Inc. (Tewksbury, MA, USA).
A recovery standard was created by combining naphthalene-d8, ethylbenzene-d10, and 1,2,4,5-tetramethylbenzene-d14 in methanol at a concentration of 500 ng/mL each. An internal standard mixture was prepared by combining KLI mix and 1,3,5-trimethylbenzene-d12 in carbon disulfide at 500 ng/mL. A gasoline sample (87% octane) was purchased in Calgary, AB, Canada.

2.2. Analysis by GC×GC-TOFMS

All analyses were performed using the method developed by Boegelsack et al. [13] on an Agilent 7890A GC (Palo Alto, CA, USA), retrofitted with an Insight flow modulator (Sepsolve, Peterborough, UK) and coupled to a Markes BenchTOF-Select mass spectrometer (Llantrisant, UK). The injector was operated at 250 °C in split mode with a 5:1 ratio, and 1 μL of sample was injected via Agilent G4567A (Palo Alto, CA, USA) autosampler. Helium was used as a carrier gas with an average linear velocity of 4.0 cm s−1. The column set consisted of a non-polar, 5% diphenyl, 1D column (25 m × 0.18 mm i.d. 0.18 µm film thickness) coupled with a semi-polar, 50% diphenyl, 2D column (5 m × 0.25 mm i.d. 0.18 µm film thickness) with a flow ratio of 40. The modulator set-up consisted of a 25 cm × 0.53 mm loop, a 2 m length × 0.1 mm i.d. bleed line, a 2 m × 0.25 mm FID transfer line (acting as a bleed line), and a 0.8 m × 0.25 mm MS transfer line, with a 4 s modulation period PM. The oven was operated at an initial temperature of 40 °C held for 5 min, followed by a 4 °C/min ramp to 280 °C and held for 3 min. The MS transfer line and ion source were operated at 250 °C. The electron energy applied was 70 eV, and the scanned mass range was 50–400 m/z in electron ionization mode.

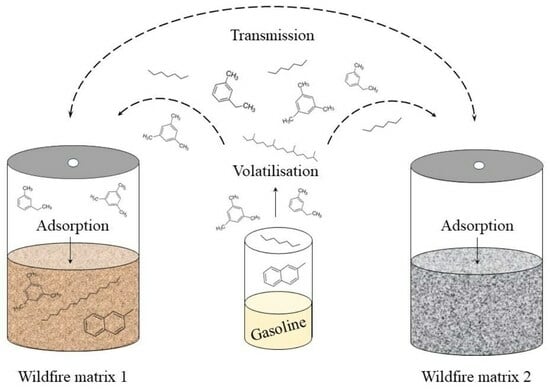
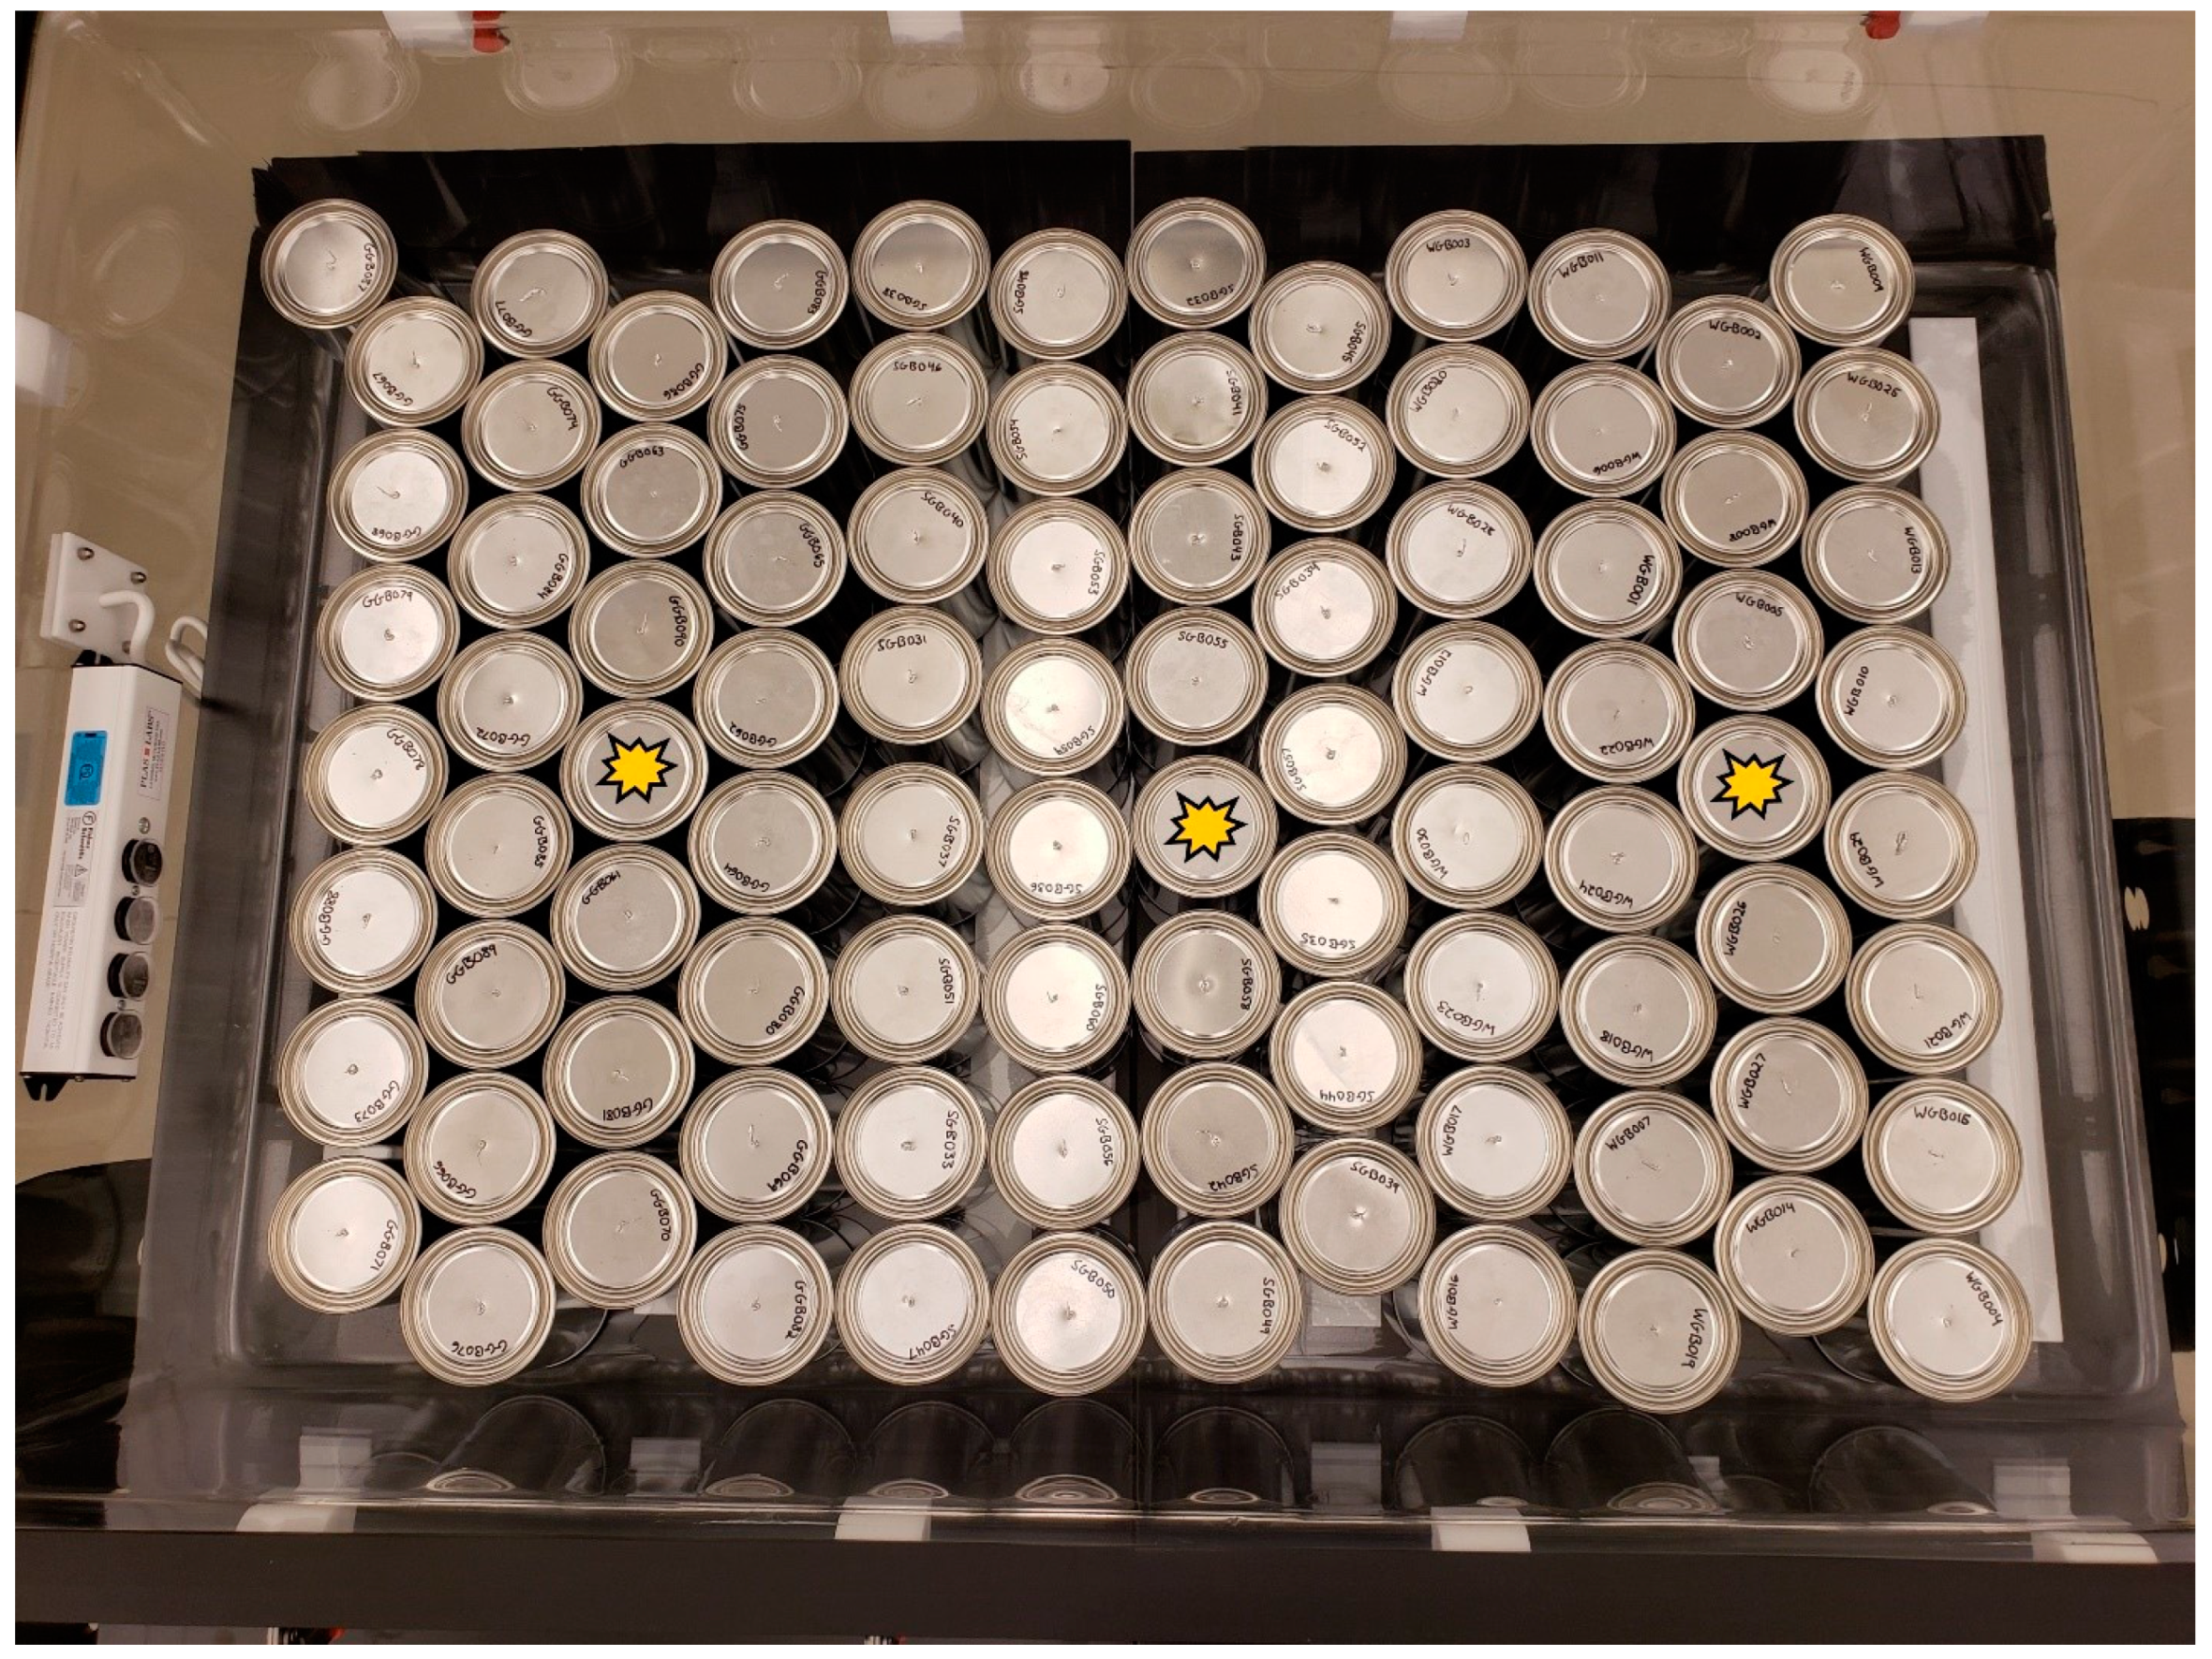
2.3. Glovebox Experiment

The experimental study was completed at room temperature in a two-piece laboratory glovebox (Plas-Labs–Cole Palmer) sealed with stainless steel clamps to form an air- and water-tight barrier. Ten grams (10 g) of either gravel, soil, or 50% charred wood chips was added to quart cans (Uline). Imperfect metal-to-metal seals and subsequent leaks are known to happen from experimental observation of trip blanks becoming cross-contaminated over time, as well as from the published literature [2]. They are, however, near impossible to predict (as they are highly dependent on the individual seal) or detect prior to analysis. To counteract the intermittent occurrence and to collect comparable data, a 1/16 inch hole was drilled into the lid of each quart can to mimic consistent leaks from a bad seal. Quart cans were evenly spaced in the open glovebox. Space was left to allow the addition of neat gasoline. The chamber was sealed and then purged and filled with high purity nitrogen (99%) five times. Gasoline vials were introduced via a transfer chamber, and the lids were removed (time 0) to allow VOC transfer. The setup of samples and gasoline sources in the glovebox is shown in Figure 1. The gasoline-spiked and blank matrix samples were extracted in triplicate for reference.
Samples were taken at ten timepoints: 0, 1, 2, 3, 4, 8, 24, 48, 72, 96, and 120 h. At each sampling point, three cans of each matrix were removed from the glovebox and extracted in accordance with previously employed protocols [13]. An activated charcoal strip (A-1503, Arrowhead Forensics, Lenexa, KS, USA) and recovery standard were added to each can, the lid was exchanged for a clean one without a hole, and samples were extracted in a temperature-controlled oven at 90 °C for 16 h. After extraction, the charcoal strips were transferred into pre-labelled vials, and 1 mL of carbon disulfide with internal standard was added.

2.4. Data Acquisition, Processing, and Analysis

The data were acquired and processed using ChromCompare+ (V2.1.3, Sepsolve, Peterborough, UK). After alignment and baseline correction, a deconvolution algorithm was applied for integration following the method developed in Boegelsack et al. [13]. Target analysis was conducted with a minimum ion count of 300, a minimum absolute area and height of 1000, and a peak merging at 10% overlap. The untargeted analysis integrated aligned data files without background correction using the TileSum algorithm, with no peak filters active, and the same peak merging settings as the targeted analysis. A total of 122 target compounds were analysed in each sample, including deuterated internal and recovery standards (n = 10). Table 1 shows the native target compounds in their respective compound groups, which can further be differentiated regarding their volatility/molecular weight as light, medium, or heavy. Light compounds (most volatile) refer to an equivalent n-alkane range up to nonane, such as lighter cyclohexanes (methyl- and ethyl-) and alkylated aromatics (benzene, toluene, ethylbenzene, and p- and m-xylene). Heavy compounds (least volatile) refer to larger compounds with an equivalent n-alkane range starting at nonane and exceeding eicosane, referring to alkylated indanes and condensed ring aromatics in the context of gasoline. Medium compounds are considered within the equivalent n-alkane range of octane to tridecane, which includes most alkylated aromatics and indanes listed, and up to hexylcyclohexane.
Internal and recovery standards were used to correct the data for variance from instrumental or extraction performance. Data tabulation and graphing, as well as uptake rate calculations, were completed in Microsoft Excel 365 (Microsoft, Redmond, WA, USA). Uptake rates were modeled mathematically to follow the cross-contamination process for each compound class using the two standard simplified adsorption models for activated charcoal: Langmuir and Freundlich. Both were used to calculate the uptake rates for each compound. For this dataset, Langmuir provided a better linear correlation coefficient to model uptake.
Studies currently investigating the use of chemometric analysis in domestic and industrial fires use a targeted approach, such as a comparison of target peak lists, to achieve classification goals. Conversely, untargeted chemometric analysis has become popular for exploratory research in metabolomic studies, such as detecting previously unknown disease biomarkers [14]. Untargeted analysis does not rely on a given list of target peaks but instead explores the entirety of the data spectrum to look for statistically meaningful differences between designated groups. These differences can then be related back to the chromatographic data. Because this approach has proven successful on complex sample matrices (e.g., breath, bacterial profiles [14,15]), a combined approach of targeted and untargeted analysis was employed to investigate the characterization of cross-contamination in wildfire debris analysis.
Chemometric analysis was accomplished using ChromCompare+. Each sample was assigned a variable for the matrix (gravel, soil, wood), uptake (none, active, passive), and timepoint and aligned with the automated alignment feature, which deploys a localized compression and decompression algorithm across chromatograms. The targeted analysis built an unsupervised principal component analysis (PCA) with its respective list of target compounds (Table 1) and their integrated peak areas corrected for recovery. The untargeted analysis built an unsupervised PCA using the tile-based fisher ratio approach [16] to compare features (retention-time-based bins for each m/z channel) across chromatograms. Data for both targeted and untargeted analyses were normalized using probabilistic quotient normalization (PQN) to the mean. This normalization method assigns a dilution factor to each sample in comparison to a reference based on the quotient of spectral intensities and normalizes each sample according to this dilution factor. Predictive models for uptake classification according to the respective PCA were built for each analysis method to calculate the classification confidence. Each model employed a random forest design and used a nearest neighbor algorithm for class prediction of uptake variable result (none, active, passive).
A diagnostic ratio analysis was developed based on the untargeted PCA loadings plot to evaluate uptake classification confidence against full PCA scores plots of targeted and untargeted analyses.

3. Results and Discussion

3.1. Detection of Cross-Contamination

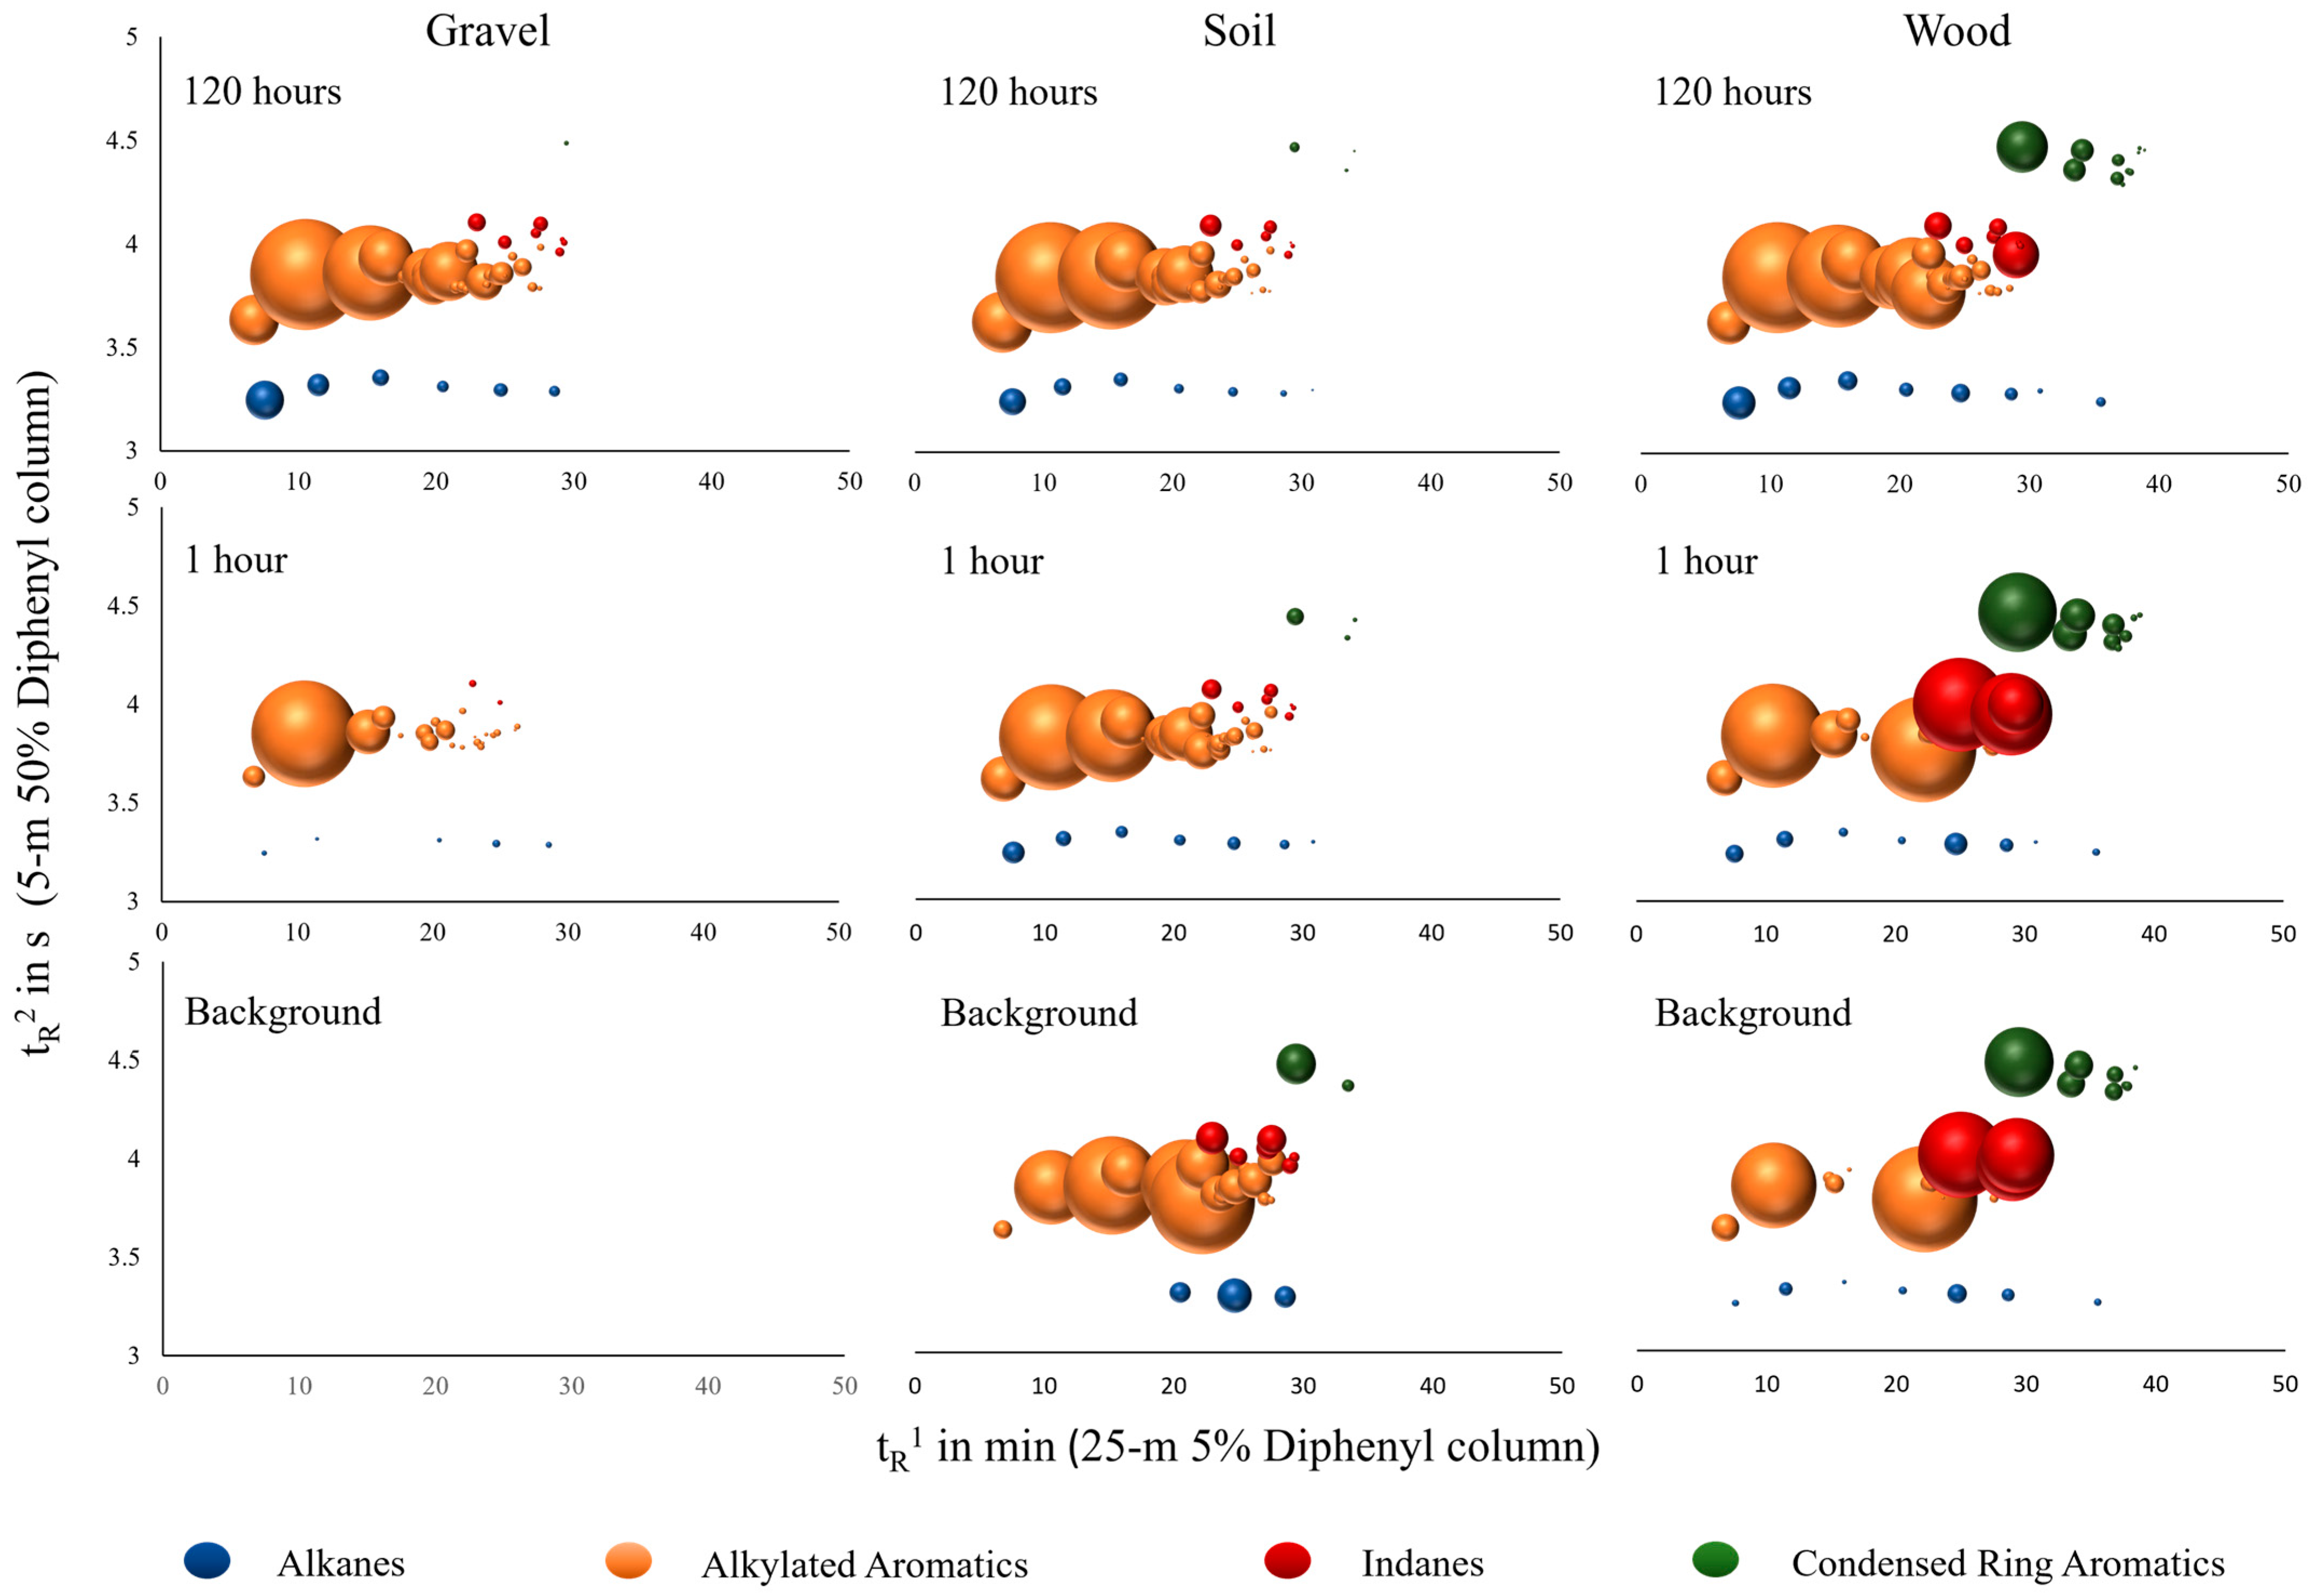
3.1.1. Visual Comparison

When conducting visual comparisons, it is imperative to compare relative distributions (i.e., ILR patterns) rather than absolute abundances, as many factors contribute to differences in absolute abundance, including, but not limited to, matrix, weathering, potential on-scene dilution from fire extinguishing efforts, and extraction efficiency.
Figure 2 shows a comparison of averages for replicates of matrix blanks (bottom) with cross-contaminated samples after 1 h (middle) and 120 h (top) of exposure. Compound groups of interest for gasoline are highlighted in ascending secondary retention time order for each chromatogram as n-alkanes (blue), alkylated aromatics (orange), indanes (red), and condensed ring aromatics (green), with bubble sizes relating to the individual compound abundances within those groups as the relative distribution to the total area.
The overall progression of compound uptake across matrices, as displayed in Figure 2, follows the same trajectory for light, medium, and heavy compounds, with early uptake of light compounds, quickly followed by medium compounds filling in, and, lastly, heavy compounds where applicable. Most early to mid-eluting gasoline compounds could be detected on all matrices after 1 h of exposure. Alkane uptake appeared evenly across the target range, whereas aromatic groups showed higher concentrations for earlier eluting compounds. Exceptions to this were heavier compounds on gravel. For instance, it took 8 h to detect 2,4-dimethylindane on gravel compared to 1 h on soil and wood. Condensed ring aromatics were not detected in any gravel samples. These heavier gasoline compounds also proved to be the exception to the general uptake pattern in other matrices, following an inverse trajectory in soil and wood with higher relative abundances for early sampling points. This relationship is likely due to matrix combustion effects causing higher background levels and competitive adsorption between the matrix and charcoal strip taking place.
For gasoline, the most common ILR encountered in wildfire debris, a common composition includes compounds within the n-alkane range, typically between C4 and C12 for a fresh fuel, with the heptane (C7) to dodecane (C12)-equivalent range being the most prominent. The pattern comparison is expected to display abundant aromatics in a specific pattern, with select indanes and condensed ring aromatics but no significant amounts of cycloalkanes [17]. Heavier ignitable liquids commonly encountered in wildfires contain wider n-alkane equivalent ranges with more abundant cyclohexanes, branched alkanes/alkenes, indanes, and condensed ring aromatics in comparison. Normal alkanes and alkylated aromatics are commonly still encountered and present in abundance but with varying reference patterns.
The visual comparison from Figure 2 shows that the relevant compound groups are visible from cross-contamination. Especially for light- or mid-range ignitable liquids, including gasoline, cross-contamination has the potential of leading to false positive ILR identification regardless of the matrix, as compound transmission is detectable after a 1 h exposure for most target compounds within groups of interest.

3.1.2. Uptake Rates

The potential for VOC transfer and resulting cross-contamination is typically based on volatility, which is commonly expressed as the equivalent n-alkane range instead of vapour pressure within the context of ILR analysis. The general assumption of transfer is that more volatile compounds display a higher likelihood of transfer than less volatile compounds. This was confirmed in the overall progression of cross-contamination under the non-competing matrix (gravel) in Figure 2. Competing matrices (soil, wood), on the other hand, showed that additional partition effects are taking place. As a result, representative compounds of major compound groups within the equivalent n-alkane range in gasoline were chosen to investigate uptake rates on different background matrices in Table 2.
Expectations for uptake rates were based on chemical properties outlined in Table 2. The air/water partition coefficient, Henry’s law constant (KH), describes the degree of volatility versus water solubility for a given compound, which impacts how readily a compound moves from its originating ignitable liquid into headspace for transmission. Octanol-water partition coefficient (KOW) values describe the degree of hydrophobicity/lipophobicity of a compound and usually range from −3 (very hydrophilic/lipophobic) to +10 (extremely hydrophobic/lipophilic). Often used in environmental fate analysis, they can also give insight into the overall polarity of a compound, with higher values signifying greater net neutrality across the compound surface.
The results for chemical properties in Table 2 show that all compound groups are predominantly hydrophobic, with n-alkanes having the highest log KOW; therefore, they are the least polar compound group. Regarding volatility, n-alkanes display a trend of increasing volatility with decreasing carbon numbers. In contrast to n-alkanes, alkylated aromatics exhibit greater transferability than indanes and condensed ring aromatics, making them the optimal reference point for cross-contamination analysis and ratio determination. As expected, these findings were confirmed by the visual examination (see Figure 2). Alkanes, which have a much lower KH and higher log KOW than the remaining compound groups, transferred more readily across the entire volatility range (C7 to C12). This is supported by the calculated adsorption rates for each compound group using the Langmuir isotherm, where they rank among the higher rates across the matrices (shown in Table 2 along with their respective linear regression fits, as represented by r2).
Alkanes exhibited one of the highest adsorption rates across all tested matrices. Both rates were an order of magnitude greater than most other compound groups in gravel, with more mixed results for competing matrices, and they reached their uptake plateau within 8 h as opposed to 24 h for other compounds of interest. In contrast, uptake rates for condensed ring aromatics were the lowest, with indanes and alkylated aromatics falling in between and displaying relative uptake differences for individual compounds across matrixes. Alkylated indanes and condensed ring aromatics were expected to require more time or additional heat to facilitate headspace transfer because they had the highest KH values. This was consistent with the visual results presented in Figure 2 for the gravel matrix. However, the soil and wood matrices, which naturally contained many compounds in these compound groups, did not adhere to these expectations. Additionally, condensed ring aromatics displayed the lowest regression fit and a negative adsorption slope in soil and wood, indicating that they did not follow a first-order kinetic uptake model in these matrices. This suggests that condensed ring aromatics are more strongly affected by matrix interaction effects than other compound groups, which is one of the main limitations of the Langmuir isotherm model because it cannot account for direct and indirect adsorbate–adsorbate interactions. As evidenced by the degree of variability in correlation factors (r2) for the same compound across different matrices, as well as for different compounds within the same matrix, this suggests that a high degree of these interactions is present. As shown in Figure 2, ILR compounds of interest and larger compound groups can be natively present in matrix blanks at various concentrations. Limitations in the extraction technique can therefore lead to negative uptake rates (Table 2) where competitive adsorption takes place. Other matrix interaction effects resulting in poor regression fit for the Langmuir isotherm adsorption model highlight that the detection of cross-contamination or interpretation for ILR presence is further complicated by matrix presence. Even on gravel (a non-competing matrix for adsorption), the latest-eluting compound transfer took place after 8 h.
In terms of compound groups, condensed ring aromatics displayed the lowest correlation factors (and highest interaction effects), followed by alkylated indanes. Lower carbon number alkanes and indanes alongside alkylated aromatics had the highest correlation factors and were modelled for their uptake rate with a higher degree of confidence by Langmuir isotherm. In general, gravel had the highest correlation factors, and, therefore, the lowest interaction effects, followed by wood, and, lastly, soil.
Besides time, another anticipated effect for cross-contamination was the distance from the source can. When investigated, the first 24 h showed minor differences in abundance, with samples closer to the nearest source can (<15 cm) displaying higher intensities than samples further away (>15 cm). This was more pronounced in light and medium compounds. Heavy compounds displayed more independence from the distance, related to their lower affinity for the headspace (see Table 2). Timepoints after 24 h no longer exhibited significant differences based on distance, indicating an equilibrium in the glovebox headspace.

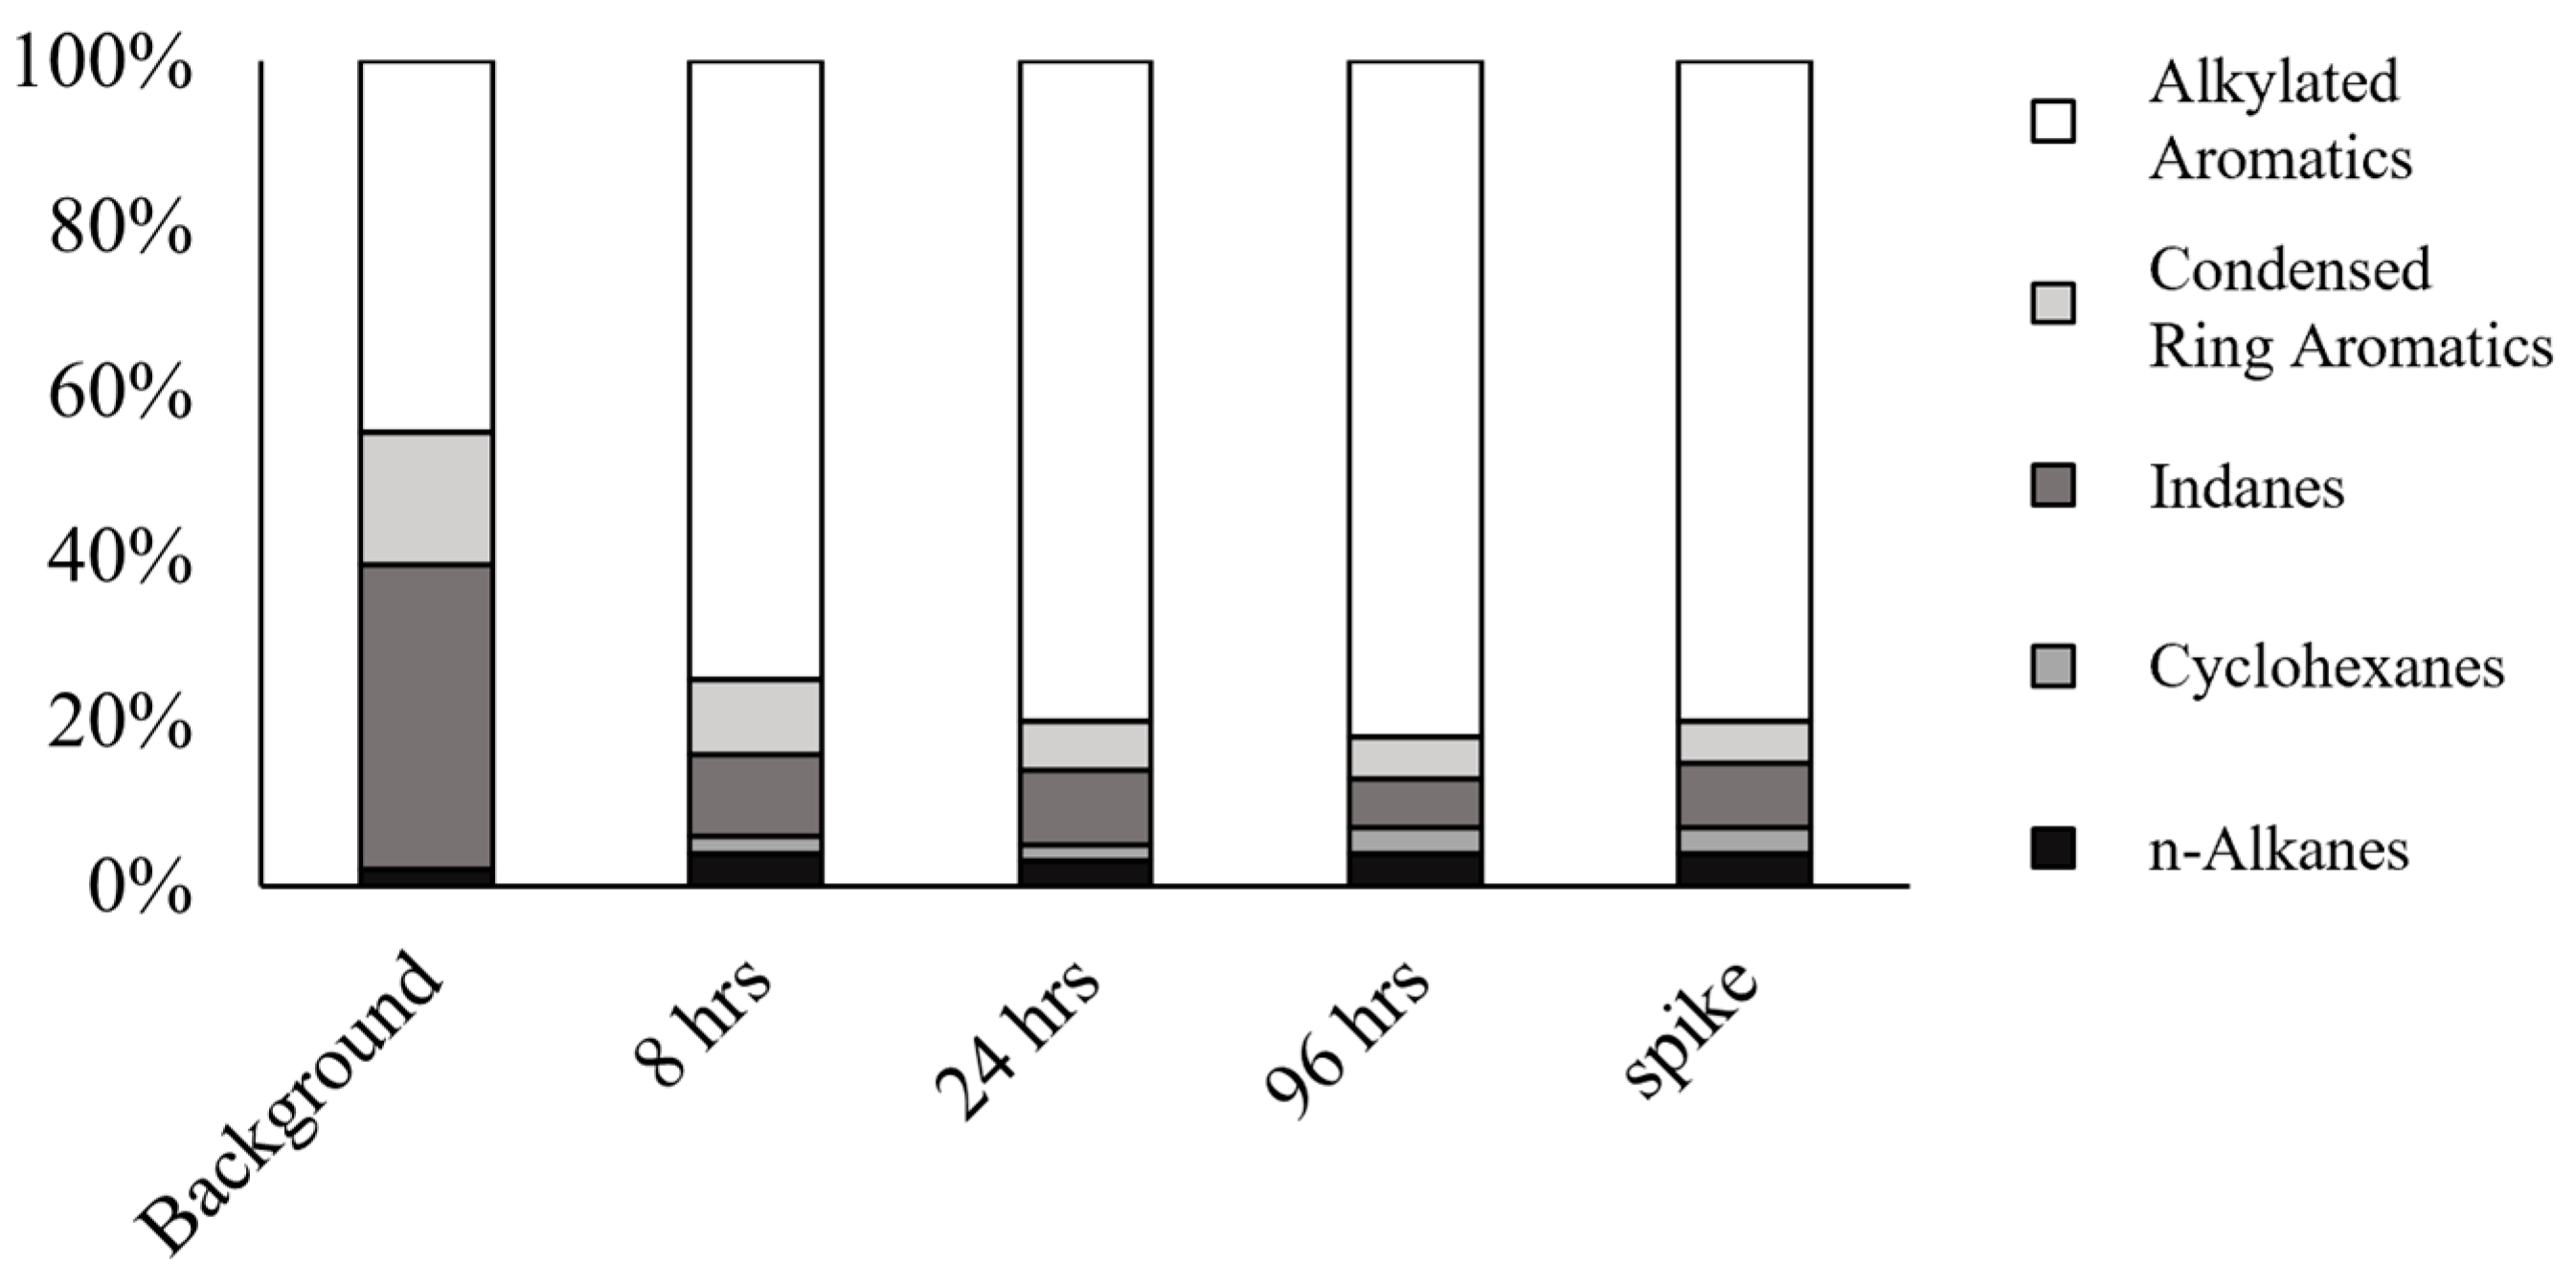
3.2. Major Compound Groups and Relative Distribution

A summary of the group type analysis based on extracted ion profiles is displayed in Figure 3. The final distributions of spiked samples are very similar regardless of the matrix, whereas the background composition varies drastically. Other timepoints also display large differences between matrices until the relative distribution pattern resembles a positive sample, which occurs between 8 and 24 h of exposure. For all matrices, alkylated aromatics make up most of the target compounds at any stage, as is typical of gasoline.
Wood showed a relative compound distribution comparable to a true positive sample after 24 h of exposure. In contaminated samples, gravel is missing condensed ring aromatics entirely, and it is largely missing indanes as well. Contaminated soil samples are also largely lacking indanes.
The expected pattern of distribution change over time, which is characteristic of cross-contamination (i.e., an initial drastic increase in light compounds followed by a decrease over time and an increase in the medium and heavy range uptake), was only observed in gravel. Because no compounds were present in the gravel background and matrix interaction effects were negligible, the uptake pattern for this matrix follows the expected passive cross-contamination. Other matrices showed a less prominent increase in light compounds, with a stable distribution for light and heavy ranges, and minor changes in the relative abundance of medium compounds. This, in turn, makes it harder to differentiate cross-contamination from a low-concentration-positive sample based on the relative distributions of overall compound groups and the presence/absence of compounds of interest without prior knowledge of the background composition.
Complex matrices affect the expected uptake pattern via inherent native compounds, as well as interaction effects during transmission and, later, extraction. As a result, cross-contaminated samples of competing matrices, such as soil or wood, appear as positive matches for ILR earlier than non-competing matrices (e.g., gravel), highlighting the need to employ more advanced statistical tools to differentiate cross-contamination.

3.3. Chemometric Analysis of Cross-Contamination

3.3.1. Principal Component Analysis and Volcano Plot Interrogation

The PCA results for the targeted (A) and untargeted (B) analyses are provided in Figure 4. For the targeted PCA, the background samples grouped very closely together in the bottom right quadrant, with contaminated gravel and wood samples grouping next to background and contaminated soil and spiked matrices further to the left along PC1. Contaminated samples showed an upwards trend along PC2 compared to background and spiked samples.
The same trends are apparent in the untargeted analysis (shown in Figure 4B). Upon initial observation, the untargeted PCA revealed better distinctions among the samples. In this analysis, the background samples were in the bottom right quadrant, the spiked samples were in the bottom left quadrant, and the contaminated samples were in the top quadrants depending on the matrix and timepoint. Samples from later timepoints were located further away from the background samples and closer to the upper quadrants. Upon closer inspection, however, it becomes clear that the separation along PC2 may be due to an axis scaling effect. In the targeted analysis (Figure 4A), one contaminated soil sample drives the axis to 0.8 units, with the remainder of the samples between 0.0 and 0.4, as is shown in the untargeted PCA (Figure 4B). A similar effect can be observed along PC1, where one spiked soil sample does not group as closely to the others. Undertaking a comparison with these effects in mind, the untargeted PCA still separates contaminated samples more distinctly from background samples (this is particularly applicable to gravel and wood matrices along both axes). It also groups spiked soil and wood matrices further away from the contaminated samples along PC1, whereas spiked gravel is grouped closer to the contaminated sample cluster along PC1 but better separated from it along PC2.
A chemometric model based on five nearest neighbours resulted in 88% prediction confidence for targeted and 93% prediction confidence for untargeted analysis (based on the top 50 features with the same settings as targeted models). The increase in confidence between models stems exclusively from better separation of contaminated samples from background clusters and subsequent classifications for early contamination timepoints. This means that there is no potential for false positive conclusions under the given conditions.
Corresponding loading plots showed that toluene and xylenes were the main compounds that differentiated cross-contaminated samples in the targeted analysis (see Figure S1). However, their corresponding volcano plots showed no statistically significant differences for toluene and xylenes. Volcano plots show statistical significance at the 95% confidence limit (as calculated by ChromCompare+ software, V2.1.3) for isobutylbenzene, methyl- and ethylcyclohexane, and 1,3,5-trimethylbenzene between background and contaminated samples, as well as 1-ethyl-2,5-dimethylbenzene, methylindanes, tetramethylbenzenes, 1,2,4-triethylbenzene, 1-ethyl-2,3-dimethylbenzene, and 1-tert-butyl-2-methylbenzene between contaminated and spiked samples. Volcano plots for the untargeted analysis showed more statistically significant features than the targeted analysis, as was expected, because the number of features is likewise larger than the number of peaks in a chromatogram.
Table 3 shows the curated list of statistically significant features from the untargeted analysis volcano plots comparing the contaminated and background/spiked positive samples, respectively. Each feature relates to a signal present in the chromatograms at the designated time stamp and m/z channel. After the removal of overlapping features and ensuring that features did not correspond to background signal changes, library matching tentatively identified the remaining peaks. Eight peaks gave library matches with a reverse match factor > 700 for reasonable confidence in the identification (Table 3).
Five of these features (3-ethyltoluene, 1,2,4-trimethylbenzene, and ethyl-dimethylbenzenes) are currently considered compounds of interest as mid-range alkylated aromatics (C9–C12 equivalent n-alkane range), and three have not been investigated to this point as tentatively identified light-range branched alkanes and cycloalkanes (C8–C9 equivalent n-alkane range). Mid-range alkylated aromatics are very common in ignitable liquids of various classifications and are often used as reference points for cross-contamination. Because theory prescribes a drastic uptake in light-range compounds but consistent distribution of mid- and heavy-range compounds, the significant features fit expectations.
With only a single source of gasoline used in this study, however, it is possible that these three compounds are proprietary to the gasoline signature used herein. With all three compounds tentatively identified as branched alkanes, alkenes, and cycloalkanes in the octane range, it is likely that they would be present in higher-grade gasolines than the one used in this study (87 octane rating), as branching generally increases the octane rating. Their KH values lie within the expected uptake rates for n-alkanes, whereas their KOW lies between n-alkane and alkylated aromatic ranges, meaning they would readily move into headspace and would generally be suitable as monitoring compounds for cross-contamination.

3.3.2. Diagnostic Ratio Analysis

The diagnostic ratio analysis (Table 4) was developed based on untargeted PCA loading plots (used in the untargeted model) as a more practical alternative to full chemometric modeling. From the features driving differences between the groups, the following compounds could be correlated: heptane and toluene to represent light compounds for alkanes and alkylated aromatics, 4-isopropyltoluene and 1-ethyl-2,4-dimethylbenzene for medium compounds (alkylated aromatics), and 2-methylnaphthalene to represent heavy compounds and condensed ring aromatics. 1-ethyl-2,4-dimethylbenzene was included as the most influential compound from the Stauffer target compounds currently used to detect ILR.
Hexylcyclohexane was found to be a heavy compound driving between-group variability for the transmission type of this specific gasoline signature, but it was excluded from further investigation due to its large variability between sample matrices. Additionally, cyclohexanes are not necessarily present in other formulations [17], making them an unreliable marker compound. Although the targeted PCA loadings plot showed that xylenes were a differentiator for cross-contaminated samples, they showed the least potential as a differentiator between background, contaminated, and positive samples according to volcano plots and investigated ratios. Thus, xylenes were excluded from the final ratio analysis.
Theoretically, there should be a difference observed in relation to medium compounds. Assuming a first-order kinetic uptake, contaminated samples should show higher results for light:medium ratios and lower results for heavy:medium ratios than positive samples. Although each ratio was informative, each was associated with drawbacks as well.
Ratio one highlights a light:medium ratio incorporating two compound groups, n-alkanes for the light range (heptane) and alkylated aromatics for the medium range (1-ethyl-2,4-dimethylbenzene). This ratio was initially considered a good all-around indicator as it was not present in any of the blank matrices and displayed consistent positive ratios across all matrices averaging at 0.6 and higher averages between 1 and 2 for impacted samples. However, upon closer investigation, the potential for false positive identification was shown to be 9% due to overlap between contaminated and positive ranges in gravel and soil.
Ratio two also examined light:medium compounds but from the same compound group in this instance (alkylated aromatics), with toluene and 1-ethyl-2,4-dimethylbenzene. It was highly indicative of a contaminated sample and very consistent across matrices for impacted samples, with results > 15.7, as compared to <5.7 for any other sample. A drawback to this ratio was the overlap between positive samples and the soil background.
Ratio three, on the other hand, examined the medium:heavy ratio across compound groups, with alkylated aromatics representing the medium range (4-isopropyltoluene) and condensed ring aromatics representing the heavy range (2-methylnaphthalene). It was a strong indicator of a true positive sample as it consistently showed small ratios between 0 and 1.8 across matrices, with much larger ratios for contaminated or negative samples. The downside to this ratio was the overlap between background and contaminated values in soil and wood, as well as its lacking presence in contaminated gravel.
Despite each individual ratio showing a specific drawback, using two or more ratios in tandem could be used to circumvent the matrix issue. Utilizing all three ratios in tandem produced results in which 94% of contaminated samples were correctly classified as such, with two gravel samples from timepoint one (1 h) and four wood samples from timepoints one and two (1 and 2 h, respectively) mistakenly classified as the background (negative). This led to a total 95% correct classification rate between all positive, contaminated, and negative results.
Although the compounds used for ratios are commonly abundant in gasoline and other ignitable liquid formulations, it is possible that these ratios depend on proprietary gasoline signatures, as only a single source of gasoline was used for this study. Hence, further studies may be required for the use of these ratios on other gasoline sources or other types of ignitable liquids.

3.4. Practical Considerations for Sampling and Storage

The detection of cross-contamination is strongly linked to the characterization of compound groups and their relative abundance to one another within equivalent n-alkane ranges (i.e., light, medium, and heavy range). The improved separation power of GC×GC over GC is an invaluable tool for separating the individual compound groups based on their chemical properties and drawing ILR target compounds away from unrelated matrix compounds. This improved power of separation and the use of relating second-dimension retention indices can simplify a visual comparison between chromatograms [19]. Especially for matrices commonly encountered in wildfire debris, which are complex in signature and highly abundant in comparison to ILR compounds, a visual comparison can be a challenging prospect [9].
Including a requirement for background samples to be collected, which is currently optional, could support improved detection and characterization of ignitable liquids in wildfire samples, as more accurate conclusions about the expected matrix composition and the effects on extraction can be drawn. At the same time, they may also create additional (practical) complications, such as determining where to collect the background to obtain a representative sample that is not situated in the potentially impacted zone. Trip blanks—empty sample containers with a carbon strip to evaluate potential contamination during transport—are often included in current sample batches, as they would display a similar response to gravel in this study. However, they cannot indicate a bad seal on other cans, and they do not provide additional information for background interpretation.
Based on visual comparison results in this study, the potential for a positive interpretation under room temperature storage conditions exists for gravel at 24 h, soil at 8 h, and wood at 3 h. Soil and wood samples showed a full gasoline profile after 24 and 8 h, respectively. Key compounds for mid-range alkylated aromatics (ethyltoluenes and trimethylbenzenes) were largely present, making the distinction between cross-contamination and genuine ILR components difficult without further chemometric assessment. Packaging and storage types are commonly employed to prevent or slow down cross-contamination processes, but they have to be evaluated either under controlled environments or on an individual case basis for weathering [7,10,20]. Different sampling containers have different sealing effectiveness and can potentially lead to compound additions to the background [2,3,4,6].
To fully evaluate storage conditions for real forensic samples, chemical changes potentially caused by matrix interactions [8,9,21], effects of thermal environment and combustion during the fire [22,23], as well as known effects of different extraction methods [24,25,26,27,28] must be taken into consideration. Based on current best practices for interpretation [17], false positive interpretations are rare [21,29], but the potential for inconclusive or false negative interpretations prevails [9,29]. The diagnostic ratio analysis in this study was more user-friendly than, and equal in prediction reliability to, full chemometric modelling, potentially making it a suitable tool to assist analysts in detecting cross-contamination for samples undergoing long transport (e.g., from remote fire scenes) or long-term storage. Mathematical tools, such as the ones presented herein, to assist in assessment could provide greater confidence in transport and storage methods with resulting sample evaluation by introducing interpretation error ranges for quality control purposes.

4. Conclusions

Analysis of cross-contamination is commonly studied under non-competing matrix conditions. It is assumed to follow uptake strictly based on the vapour pressure of relevant compounds of interest, with early uptake of very volatile compounds, followed quickly by semi-volatile, and, lastly, less volatile compound uptake. As a result, current research evaluates cross-contamination without a competing background matrix, and only within the context of the potential for a false positive error.
However, this study confirmed that matrices commonly encountered in wildfires (soil, wood) caused interaction effects and matrix-dependent displacement. As a result, they displayed the potential for ILR profile identification much earlier than gravel. Compound transmission was apparent after 1 h, with an overall positive relative compound group distribution pattern shown between 8 and 24 h. The advanced separation potential offered by GC×GC over GC analysis proved beneficial in separating complex matrices, such as the ones investigated herein. Regardless, advanced statistical analysis was required to fully characterize cross-contamination under matrix effects. Untargeted analysis better differentiated between cross-contamination and true positive/negative samples than targeted analysis. Statistically significant compounds for group differentiation identified by volcano plot interrogation showed six mid-range alkylated aromatics of interest and three compounds not currently included in compound groups of interest for gasoline. They were tentatively identified as a branched alkane, branched alkene, and branched cycloalkane. Early alkylated aromatics showed promise for differentiation between groups in the PCA loadings plot but displayed no statistical significance in volcano plot comparisons.
A diagnostic ratio analysis was employed as a more user-friendly alternative to full chemometric analysis, and it combined the assessment of three chemical marker ratios: 4-isopropyltoluene:2-methylnaphthalene, toluene:1-ethyl-2,4-dimethylbenzene, and heptane:1-ethyl-2,4-dimethylbenzene. The diagnostic ratio analysis provided the highest correct classification rate in distinguishing cross-contaminated samples from non-impacted backgrounds and positive samples, with a 95% success rate and six total false negative identifications (occurring at timepoints one and two) as opposed to 88% for targeted and 93% for untargeted chemometric analysis. As opposed to traditional compound group analysis, there was no potential for false positive ILR identifications under chemometric analysis. Higher success rates between chemometric methods were caused by improving the differentiation of contaminated samples from the background (improving the false negative error potential).
As this study concentrated on gasoline as the most common ignitable liquid used in North America, the methodology proposed herein should be verified further using the ILR of extended carbon ranges, such as medium or heavy petroleum distillate mixtures, or diesel. The statistical approaches presented herein also require validation under storage and packaging conditions to account for potentially interfering VOC or losses caused by common packaging material.

Supplementary Materials

The following supporting information can be downloaded at: https://www.mdpi.com/article/10.3390/separations10090491/s1, Figure S1: PCA loadings plot for targeted analysis (target compounds from Table 1) as relating to targeted PCA from Figure 4.

Author Contributions

N.B.: Conceptualization, Methodology, Investigation, Formal Analysis, Validation, Writing—Original Draft, Writing—Review and Editing, Visualization. J.W.: Investigation. C.D.S.: Conceptualization, Writing—Review and Editing. J.M.W.: Writing—Review and Editing, Funding Acquisition. D.W.M.: Writing—Review and Editing, Funding Acquisition. G.O.: Conceptualization, Methodology, Investigation, Resources, Funding Acquisition, Writing—Review and Editing, Supervision. All authors have read and agreed to the published version of the manuscript.

Funding

This research was funded by Dena W. McMartin, the Natural Sciences and Engineering Council of Canada (NSERC), grant number DWM 2020-04014, and Gwen O’Sullivan, the Canada Foundation for Innovation (CFI), project number 40177.

Data Availability Statement

The data presented in this study are available on request from the corresponding author.

Conflicts of Interest

The authors declare no conflict of interest.

References

  1. Justice, N.I.O. Glossary for Crime Scene Investigation: Guides for Law Enforcement; U.S. Department of Justice: Washington, DC, USA, 2009. Available online: https://nij.ojp.gov/topics/articles/glossary-crime-scene-investigation-guides-law-enforcement (accessed on 10 June 2023).
  2. Williams, M.R.; Sigman, M. Performance Testing of Commercial Containers for Collection and Storage of Fire Debris Evidence. J. Forensic Sci. 2007, 52, 579–585. [Google Scholar] [CrossRef] [PubMed]
  3. Lang, T. A Study of Contamination in Fire Debris Containers. Can. Soc. Forensic Sci. J. 1999, 32, 75–83. [Google Scholar] [CrossRef]
  4. Borusiewicz, R.; Kowalski, R. Volatile organic compounds in polyethylene bags—A forensic perspective. Forensic Sci. Int. 2016, 266, 462–468. [Google Scholar] [CrossRef] [PubMed]
  5. Grutters, M.M.P.; Dogger, J.; Hendrikse, J.N. Performance Testing of the New AMPAC Fire Debris Bag Against Three Other Commercial Fire Debris Bags. J. Forensic Sci. 2012, 57, 1290–1298. [Google Scholar] [CrossRef] [PubMed]
  6. Belchior, F.; Andrews, S. Evaluation of Cross-contamination of Nylon Bags with Heavy-loaded Gasoline Fire Debris and with Automotive Paint Thinner. J. Forensic Sci. 2016, 61, 1622–1631. [Google Scholar] [CrossRef] [PubMed]
  7. Chalmers, D.; Yan, S.; Cassista, A.; Hrynchuk, R.; Sandercock, P. Degradation of Gasoline, Barbecue Starter Fluid, and Diesel Fuel by Microbial Action in Soil. Can. Soc. Forensic Sci. J. 2001, 34, 49–62. [Google Scholar] [CrossRef]
  8. Borusiewicz, R. Substrate interferences in identifying flammable liquids in food, environmental and biological samples: Case studies. Sci. Justice 2015, 55, 176–180. [Google Scholar] [CrossRef] [PubMed]
  9. Kates, L.N.; Richards, P.I.; Sandau, C.D. The application of comprehensive two-dimensional gas chromatography to the analysis of wildfire debris for ignitable liquid residue. Forensic Sci. Int. 2020, 310, 110256. [Google Scholar] [CrossRef]
  10. Baerncopf, J.; Hutches, K. Evaluation of long term preservation of ignitable liquids adsorbed onto charcoal strips: 0 to 2 years. Forensic Chem. 2020, 18, 100234. [Google Scholar] [CrossRef]
  11. Sinkov, N.; Sandercock, P.; Harynuk, J. Chemometric classification of casework arson samples based on gasoline content. Forensic Sci. Int. 2014, 235, 24–31. [Google Scholar] [CrossRef]
  12. Sigman, M.; Williams, M. Chemometric applications in fire debris analysis. WIRE’s Forensic Sci. 2020, 2, e1368. [Google Scholar] [CrossRef]
  13. Boegelsack, N.; Hayes, K.; Sandau, C.; Withey, J.M.; McMartin, D.W.; O’Sullivan, G. Method development for optimizing analysis of ignitable liquid residues using flow-modulated comprehensive two-dimensional gas chromatography. J. Chromatogr. A 2021, 1656, 462495. [Google Scholar] [CrossRef] [PubMed]
  14. Barberis, E.; Amede, E.; Khoso, S.; Castello, L.; Sainaghi, P.P.; Bellan, M.; Balbo, P.E.; Patti, G.; Brustia, D.; Giordano, M.; et al. Metabolomics Diagnosis of COVID-19 from Exhaled Breath Condensate. Metabolites 2021, 11, 847. [Google Scholar] [CrossRef] [PubMed]
  15. Franchina, F.; Purcaro, G.; Burklund, A.; Beccaria, M.; Hill, J. Evaluation of different adsorbent materials for the untargeted and targeted bacterial VOC analysis. Anal. Chim. Acta 2019, 1066, 146–153. [Google Scholar] [CrossRef]
  16. Parsons, B.; Marney, L.; Siegler, W.; Hoggard, J.; Wright, B.; Synovec, R. Tile-Based Fisher Ratio Analysis of Comprehensive Two-Dimensional Gas Chromatography Time-of-Flight Mass Spectrometry (GC×GC–TOFMS) Data Using a Null Distribution Approach. Anal. Chem. 2015, 87, 3812–3819. [Google Scholar] [CrossRef] [PubMed]
  17. ASTM E1618-19. Standard Test Method for Ignitable Liquid Residues in Extracts from Fire Debris Samples by Gas Chromatography-Mass Spectrometry. ASTM International: West Conshohocken, PA, USA, 2019. [CrossRef]
  18. Sander, R. Compilation of Henry’s law constants (version 4.0) for water as solvent. Atmos. Chem. Phys. 2015, 15, 4399–4981. [Google Scholar] [CrossRef]
  19. Boegelsack, N.; Sandau, C.; McMartin, D.; Withey, J.; O’Sullivan, G. Development of retention time indices for comprehensive multidimensional gas chromatography and application to ignitable liquid residue mapping in wildfire investigations. J. Chromatogr. A 2021, 1635, 461717. [Google Scholar] [CrossRef] [PubMed]
  20. Pandohee, J.; Hughes, J.G.; Pearson, J.R.; Jones, O.A.H. Chemical fingerprinting of petrochemicals for arson investigations using two-dimensional gas chromatography-flame ionisation detection and multivariate analysis. Sci. Justice 2020, 60, 381–387. [Google Scholar] [CrossRef] [PubMed]
  21. Rankin, J.G.; Petraco, N. Interpretation of Ignitable Liquid Residues in Fire Debris Analysis: Effects of Competitive Adsorption, Development of an Expert System and Assessment of the False Positive/Incorrect Assignment Rate; U.S. Department of Justice: Washington, DC, USA, 2014; not published.
  22. Jin, J.; Chi, J.; Xue, T.; Xu, J.; Liu, L.; Li, Y.; Deng, L.; Zhang, J. Influence of thermal environment in fire on the identification of gasoline combustion residues. Forensic Sci. Int. 2020, 315, 110430. [Google Scholar] [CrossRef] [PubMed]
  23. Stauffer, E.; Dolan, J.A.; Newman, R. Fire Debris Analysis; Academic Press: Burlington, MA, USA, 2008. [Google Scholar]
  24. ASTM E1412-19. Standard Practice for Separation of Ignitable Liquid Residues from Fire Debris Samples by Passive Headspace Concentration With Activated Charcoal. ASTM International: West Conshohocken, PA, USA, 2019. [CrossRef]
  25. ASTM E1386-15. Standard Practice for Separation of Ignitable Liquid Residues from Fire Debris Samples by Solvent Extraction. ASTM International: West Conshohocken, PA, USA, 2015. [CrossRef]
  26. ASTM E1388-17. Standard Practice for Static Headspace Sampling of Vapors from Fire Debris. ASTM International: West Conshohocken, PA, USA, 2017. [CrossRef]
  27. ASTM E1413-19. Standard Practice for Separation of Ignitable Liquid Residues from Fire Debris Samples by Dynamic Headspace Concentration. ASTM International: West Conshohocken, PA, USA, 2019. [CrossRef]
  28. ASTM E2154-15a. Standard Practice for Separation and Concentration of Ignitable Liquid Residues from Fire Debris Samples by Passive Headspace Concentration with Solid Phase Microextraction (SPME). ASTM International: West Conshohocken, PA, USA, 2015. [CrossRef]
  29. Almirall, J.; Arkes, H.; Lentini, J.; Mowrer, F.; Pawliszyn, J. Forensic Science Assessments: A Quality and Gap Analysis—Fire Investigation. AAAS: Washington, DC, USA, 2017. [Google Scholar]
Figure 1. Top view of glovebox setup with marked matrix cans (hole in lid) and placement of source cans containing 33.33 mL of gasoline in 40 mL VOA vials, highlighted by multipoint stars.
Separations 10 00491 g001
Figure 2. Bubble plots displaying chromatographic comparison of matrix blanks and contaminated samples after 1 h and 120 h highlighting the location of compound groups of interest with x-axis showing first dimension retention, y-axis showing second dimension retention, and bubble size indicating abundance of individual compounds of interest in each compound group. Alkanes are shown in blue, alkylated aromatics in orange, indanes in red, and condensed ring aromatics in green. (See Table 1 for full list of compounds of interest in each group).
Separations 10 00491 g002
Figure 3. Relative compound class distribution in wood for targeted analysis, with alkanes represented by black, cycloalkanes by grey, indanes by dark grey, condensed ring aromatics by light grey, and alkylated aromatics by white (from bottom to top).
Separations 10 00491 g003
Figure 4. PCA comparison for targeted analysis ((A) target compounds from Table 1) and untargeted analysis ((B) top 50 features by uptake type; none, passive, spike).
Separations 10 00491 g004
Table 1. Target compounds used in the evaluation of cross-contamination in affiliation with their respective compound groups.
GroupTarget Compounds
n-Alkanesheptane, octane, nonane, decane, undecane, dodecane, tridecane, tetradecane, pentadecane, hexadecane, heptadecane, pristane, octadecane, phytane, nonadecane, eicosane, heneicosane, docosane, tricosane, tetracosane, pentacosane, hexacosane, heptacosane, octacosane
Cyclohexanesmethylcyclohexane, ethylcyclohexane, propylcyclohexane, butylcyclohexane, pentylcyclohexane, hexylcyclohexane, heptylcyclohexane, octylcyclohexane, nonylcyclohexane, decylcyclohexane
Alkylated aromaticsbenzene, toluene, ethylbenzene, p-&m-xylene, o-xylene, isopropylbenzene, propylbenzene, 3-ethyltoluene, 4-ethyltoluene, 1,3,5-trimethylbenzene, 2-ethyltoluene, 1,2,4-trimethylbenzene, isobutylbenzene, sec-butylbenzene, 3-, 4-, & 2-isopropyltoluene, 1,2,3-trimethylbenzene, 1,3-diethylbenzene, 3-&4-propyltoluene, 1,4-diethylbenzene, 1-ethyl-3,5-dimethylbenzene, n-butylbenzene, 1,2-diethylbenzene, 2-propyltoluene, 1-ethyl-2,5-dimethylbenzene, 1-ethyl-3,4-dimethylbenzene, 1-ethyl-2,4-dimethylbenzene, 1-ethyl-2,6-dimethylbenzene, 1-ethyl-2,3-dimethylbenzene, isopentylbenzene, 1,2,4,5-tetramethylbenzene, 1,2,3,5-tetramethylbenzene, 1-tert-butyl-2-methylbenzene, 1,2,3,4-tetramethylbenzene, pentylbenzene, 1,3,5-triethylbenzene, 1,2,4-triethylbenzene, hexylbenzene
Indanesindane, 1-methylindane, 5-methylindane, 2-methylindane, 4,7-dimethylindane dimethylindane isomers
Condensed ring
aromatics
naphthalene, 2-methylnaphthalene, 1-methylnaphthalene, 2-ethylnaphthalene, 1-ethylnaphthalene, 2,6- & 1,3- & 1,7-dimethylnaphthalene, 1,6-dimethylnaphthalene, 1,4-dimethylnaphthalene, 1,2-dimethylnaphthalene, 1,8-dimethylnaphthalene, 2,3-dimethylnaphthalene, 2,3,5-trimethylnaphthalene, trimethylnaphthalene isomers, acenaphthylene, acenaphthene, fluorene, phenanthrene, anthracene, fluoranthene, pyrene, benz(a)anthracene
Table 2. Select compounds of relevant compound groups for gasoline, as taken from ASTM E1618 [17] (Section 10.2.1) with chemical properties and Langmuir isotherm adsorption rates based on chromatographic abundance with their respective linear regression fit (r2).
CompoundCompound GroupHenry’s Law Constant (KH) aOctanol/Water Coefficient
(log KOW) b
Langmuir Isotherm Adsorption Rates
Gravel (r²)Soil (r²)Wood (r²)
Heptanen-alkanes5.40 × 10−64.66128.6 (0.88)13.3 (0.69)23.8 (0.89)
Dodecanen-alkanes1.10 × 10−66.110.5 (0.63)23.3 (0.69)6.4 (0.29)
Indaneindanes1.20 × 10−23.183 × 10⁻⁵ (0.82)3 × 10⁻⁶ (0.60)1 × 10⁻⁵ (0.97)
4,7-Dimethylindaneindanesn/a3.5n/a3 × 10−6 (0.60)3 × 10⁻⁷ (0.25)
3-Ethyltoluenealkylated aromatics1.30 × 10−33.985 × 10⁻⁶ (0.97)7 × 10⁻⁷ (0.74)3 × 10⁻⁶ (0.94)
4-Ethyltoluenealkylated aromatics1.40 × 10−33.637 × 10⁻⁶ (0.56)1 × 10⁻⁶ (0.67)1 × 10⁻⁵ (0.97)
1,3,5-Trimethylbenzenealkylated aromatics1.40 × 10−33.424 × 10⁻⁶ (0.87)1 × 10⁻⁶ (0.70)3 × 10⁻⁶ (0.84)
2-Ethyltoluenealkylated aromatics1.80 × 10−33.531 × 10⁻⁵ (0.93)2 × 10⁻⁶ (0.70)1 × 10⁻⁵ (0.92)
1,2,4-Trimethylbenzenealkylated aromatics2.10 × 10−33.633 × 10⁻⁶ (0.93)4 × 10⁻⁷ (0.66)2 × 10⁻⁶ (0.96)
Naphthalenecondensed ring aromatics3.20 × 10−23.3n/a−1 × 10−6 (0.26)−7 × 10⁻⁸ (0.51)
2-Methylnaphthalenecondensed ring aromatics2.80 × 10−23.86n/a−6 × 10−7 (0.00)−3 × 10⁻⁷ (0.37)
1-Methylnaphthalenecondensed ring aromatics2.60 × 10−23.87n/a−1 × 10−5 (0.11)−3 × 10⁻⁷ (0.44)
a KH in m o l m 3 P a determined by method Q [18]; b log KOW taken from respective PubChem web entry for Experimental Properties > logP; Computed properties > XlogP3 value indicated in italics where no experimental value available.
Table 3. Significant features to determine cross-contamination from untargeted analysis with their correlating library match (RMF > 700) and target compound affiliation.
tR1 (min)tR2 (s)m/zLibrary MatchTarget Affiliation
14.32.9552,6-dimethyloctanenone
15.12.9853-Octene, 2,2-dimethyl-none
15.13.784Cyclopropane, 1,1,2-trimethyl-3-(2-methylpropyl)-none
19.43.7913-&4-ethyltolueneAlkylated Aromatics
21.03.71161,2,4-trimethylbenzeneAlkylated Aromatics
23.43.71191-Ethyl-3,5-DimethylbenzeneAlkylated Aromatics
24.23.71051-Ethyl-2,5-dimethylbenzeneAlkylated Aromatics
24.73.71191-Ethyl-2,4-dimethylbenzeneAlkylated Aromatics
Table 4. Result ranges for the final selection of ratios.
Ratio123
Matrix Heptane: 1-Ethyl-2,4-dimethylbenzeneToluene: 1-Ethyl-2,4-dimethyl-benzene4-Isopropyltoluene:
2-Methylnaphthalene
GravelBackground (n = 3)n/an/an/a
Contaminated (n = 33)0.1–7.415.7–555.1n/a
Spiked Background (n = 3)0.5–0.64.6–5.70.1–0.2
SoilBackground (n = 3)04.2–5.157.6–104.9
Contaminated (n = 33)0.3–3.020.5–71.220.8–293.6
Spiked Background (n = 3)0.6–0.84.4–4.90.6–1.0
WoodBackground (n = 3)n/an/a14.1–15.4
Contaminated (n = 34)1.1–6.317.9–192.88.1–14.9
Spiked Background (n = 3)0.6–0.74.3–4.81.5–1.8
Disclaimer/Publisher’s Note: The statements, opinions and data contained in all publications are solely those of the individual author(s) and contributor(s) and not of MDPI and/or the editor(s). MDPI and/or the editor(s) disclaim responsibility for any injury to people or property resulting from any ideas, methods, instructions or products referred to in the content.

