Abstract
SARS-CoV-2 is a serious viral pathogen, and agents that inhibit its replication are in high demand. In the present work, we prepared two novel tryptanthrin derivates bearing a thiosemicarbazone moiety as potential antiviral agents. Both compounds displayed potent chelation activity against Fe(III/II) ion-associated COVID-19. The molecular docking results suggest that the compounds can display significant affinity towards SARS-CoV-2 papain-like proteases and SARS-CoV-2 main proteases. In addition, administering T8H-TSC can repress viral replication in the used model (Vero cells). Moreover, the therapeutic potential of the prepared compounds was predicted and analysed in terms of Lipinski’s rules, drug-likeness and drug score.
Keywords:
tryptanthrin; phaitanthrin A; thiosemicarbazone; SARS-CoV-2; antiviral; chelation; molecular docking 1. Introduction
Transition metal ions have significant roles in living systems. For example, copper and iron ions are necessary for cellular homeostasis, but higher levels of these metals can be toxic [1,2,3]. Copper plays an important role in many biological functions, namely, ATP generation, the production of various mediators and transcription control. On the other hand, Cu(II) ions can displace zinc ions in metalloproteins, induce their denaturation and inhibit their enzymatic activity [2]. In addition, free Cu(II) ions stimulate ROS formation and cause subsequent oxidative damage to biomolecules (e.g., proteins, nucleic acids and lipids). Copper-induced oxidative stress is deeply associated with many serious diseases, such as oncological, cardiovascular and neurodegenerative disorders (Alzheimer’s, Menkes, Wilson’s and prion diseases, and familial amyotrophic lateral sclerosis) [2,4,5].
Iron is important for various cellular processes, such as DNA replication and transcription, protein synthesis, and transport and cellular respiration. It is also necessary for of a number of enzymes (mainly oxidoreductases) [6,7,8]. Due to its exceptional physiological reactivity, iron is a key component of numerous biochemical systems. On the other hand, because of its reactivity, iron is extremely cytotoxic, and can play significant part in many diseases [1,2,4]. For example, hyperferritinemia is important phenomenon in the pathogenesis of COVID-19, as increased serum ferritin can significantly correlate with a high risk of cytokine storms [9]. Higher levels of free iron are associated with aggressive mycotic rhino-orbital-cerebral mucormycosis infections (called black fungus) in patients with COVID-19 [10]. Furthermore, it is probable that ferroptosis significantly contributes to multiorgan damage in patients with COVID-19 [11].
The impact of copper in COVID-19’s progression is ambiguous. Although exposure to copper inactivates the viral genome and exhibits spike protein dispersal, an increase in the Cu/Zn ratio due to high serum Cu levels is correlated with an enhanced risk of infections [12].
Tryptanthrin is a natural, weakly basic alkaloid compound found in several plant species [13]. Tryptanthrins can bind metal ions, which are accompanied by absorption changes and are studied as colorimetric receptors, especially for transition metal ions [14,15]. Liang et al. and Wang et al. prepared new derivatives of the tryptanthrin receptor for Cu(II) ions [14,16]. Kawakmi et al. synthetized a derivative of tryptanthrin that can chelate a number of metal ions [15].
In addition, tryptanthrins show inhibitory activity against certain iron-dependent oxidoreductases, such as 5-lipoxygenase. Many biological studies have shown that tryptanthrin and its derivatives display numerous therapeutically significant activities (e.g., antibacterial, anti-inflammatory, antiparasitic), but they are also classified as potential anticancer agents against breast, lung and central nervous system cancers [13,14,15,17,18,19].
In addition, some relevant studies strongly suggest that tryptanthrins could be potent antiviral agents. For example, Tsai et al. reported that tryptanthrin represses HCoV-NL63 replication (IC50 = 0.06 M) by the inhibition of viral RNA genome synthesis and papain-like protease 2 [20]. In the case of SARS-CoV-2, docking studies suggest that trypthanthrin could represent a promising structural motif for inhibiting some proteases, such as Mpro and PLpro (SARS-CoV-2 main protease and the papain-like protease) [21,22].
Constructing conjugates of two or more pharmacophores is among the most promising methods of preparing original drugs with a combined mechanism of action. To increase the antiviral effects of tryptanthrin derivatives, we decided to add a thiosemicarbazone moiety to the tryptanthrin molecule. Thiosemicarbazones are known for their broad biological effects, including anticancer, antiviral and antimicrobial effects [23,24,25,26]. In addition, thiosemicarbazones are great metal chelators [27].
Thus, we designed and prepared tryptanthrin- and phaitanthrin A-based thiosemicarbazones, tested their metal-binding properties and investigated their potential interactions with Mpro and PLpro using in silico docking studies and also the in vitro inhibition of virus replication in Vero cells.
2. Materials and Methods
Used chemicals and solvents were obtained commercially and used without further purification. All NMR spectra were recorded on a Bruker Avance III 500 MHz (500 MHz for 1H and 125 MHz for 13C) (Bruker, Germany) in DMSO-d6 (room temperature). The chemical shifts (δ) and coupling constants (J) are presented in ppm and in Hz, respectively. The program MestReNova ver. 14 was used to process the NMR spectra. Electrospray ionisation (ESI) with a triple quadrupole mass spectrometer (TSQ Quantum Access) and an LTQ Orbitrap spectrometer (HRMS) was used for recording of mass spectra.
2.1. Synthesis
Synthesis of tryptanthrin derivatives is shown in Scheme 1.
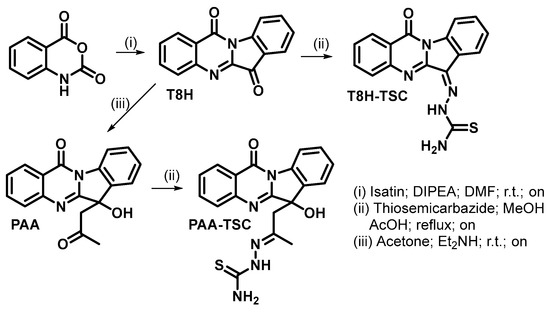
Scheme 1.
Preparation of tryptanthrin derivatives.
2.1.1. Synthesis of Tryptanthrin (T8H)
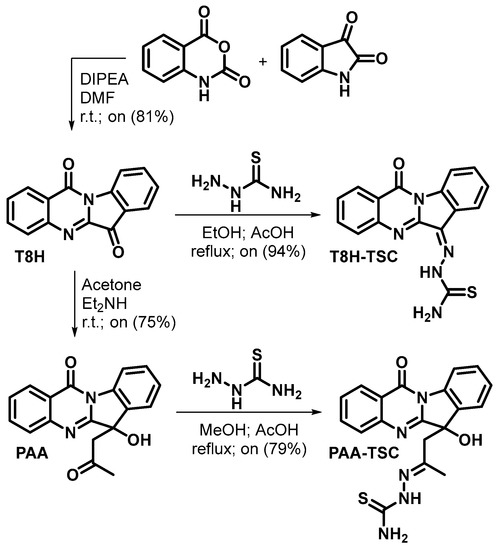
Isatoic anhydride (2447 mg; 15 mmol) and isatin (2207 mg; 15 mmol) were dissolved in DMF (40 mL, anhydrous). DIPEA (8 mL; 46 mmol) was added, and the reaction mixture was stirred (r.t., 24 h). Then, the yellow suspension was diluted with a mixture of organic solvents (diethyl ether: hexane, 1:1 v/v, 300 mL) and filtered. The obtained yellow solid was washed (diethyl ether, 2 × 100 mL) and vacuum-dried. Tryptanthrin was obtained in the form of yellow solid (3000 mg, 81% yield). 1H and 13C data were in accordance with the published data.
2.1.2. Synthesis of Phaitanthrin A (PAA)
Diethylamine (0.3 mL; 3 mmol) was added to a suspension of tryptanthrin (248 mg; 1 mmol) in acetone (5 mL), and the reaction mixture was stirred (r.t., 24 h). Subsequently, the reaction mixture was evaporated to dryness (under reduced pressure), and the crude product was purified by column chromatography (Silicagel; eluent dichloromethane: methanol, 9:1 v/v). Phatanthrin A was obtained in the form of off-white solid (228 mg, 75% yield). 1H and 13C data were in accordance with the published data.
2.1.3. Synthesis of T8H-TSC
Tryptanthrin (87 mg; 0.35 mmol) and thiosemicarbazide (91 mg; 1 mmol) in ethanol (96%; 15 mL) and acetic acid (0.15 mL) were stirred at 75 °C overnight. Then, the reaction mixture was poured into ice-cold water (100 mL). The solid product was filtered, washed with water (2 × 25 mL) and vacuum-dried. T8H-TSC was obtained as a yellow solid in a yield of 106 mg (94%). 1H NMR (DMSO-d6): 7.46 (t, J = 7.6 Hz, 1H); 7.60 (t, J = 7.8 Hz, 1H); 7.69 (t, J = 7.6 Hz, 1H); 7.78 (d, J = 8.1 Hz, 1H); 7.96 (d, J = 7.8 Hz, 1H); 8.04 (d, J = 7.6 Hz, 1H); 8.32 (d, J = 7.9 Hz, 1H); 8.39 (d, J = 8.1 Hz, 1H); 8.85 (s, 1H); 9.15 (s, 1H); 13.00 (s, 1H). 13C NMR (DMSO-d6): 116.34; 121.15; 121.68; 123.14; 126.47; 126.82; 127.75; 128.66; 130.85; 131.06; 135.10; 139.39; 145.77; 157.78; 178.76. HRMS (ESI−): when calcd. for C16H10N5OS [M-H]− 320.06061, a value of 320.06113 was found.; when calcd. for C32H20N10NaO2S2 [2M-2H+Na]− 663,11098, a value of 663.11169 was found. When (ESI+) was calcd. for C16H11N5NaOS [M+Na]+ 344.05820, a value of 344.05856 was found; and when calcd for C32H22N10NaO2S2 [2M+Na]+ 665.12663, a value of 665.12720 was found.
2.1.4. Synthesis of PAA-TSC
Phaitanthrin A (123 mg; 0.4 mmol) and thiosemicarbazide (146 mg; 1.6 mmol) in methanol (10 mL) and acetic acid (0.1 mL) were stirred at 65 °C overnight. Then, the reaction mixture was poured into ice-cold water (40 mL). The solid product was filtered, washed with water (2 × 25 mL) and vacuum-dried. PAA-TSC was obtained as an off-white solid in a yield of 120 mg (79%). 1H NMR (DMSO-d6) (2 diastereoisomers): 1.80 (1.87) (s, 3H); 3.35 (m, 2H); 5.92 (s, 1H); 6.53 (s, 1H); 7.39 (t, J = 7.7 Hz, 1H); 7.51 (t, J = 7.7 Hz, 1H); 7.63 (m, 2H); 7.80 (d, J = 8.2 Hz, 1H); 7.89 (m, 2H); 8.29 (8.46) (d, J = 8.0 Hz, 1H); 8.41 (d, J = 8.0 Hz, 1H); 9.79 (10.45) (s, 1H). 13C NMR (DMSO-d6) (2 diastereoisomers): 17.88; 45.98; 75.83 (76.44); 115.97 (116.26); 121.17 (121.49); 124.34; 126.51 (126.36); 126.69; 127.52 (127.77); 129.67 (130.24); 134.11 (132.89); 134.92 (134.84); 138.44 (138.30); 146.95 (146.77); 150.52 (148.67); 158.74 (158.90); 160.71 (160.09); 178.22 (178.44). HRMS (ESI+): when calcd. for C19H17N5NaO2S [M+Na]+ 402.10007, a value of 402.10049 was found; and when calcd. for C38H34N10NaO4S2 [2M+Na]+ 781.21036, a value of 781.21051 was found.
2.2. Derivates of Tryptanthrin Derivates and Metal Guests
The synthetic derivates of tryptanthrin (PAA-TSC, T8H-TSC) and studied guests in the form of nitrates (Al(III), Co(II), Cu(II), Fe(III), Pb(II), Zn(II), Mg(II), Ca(II), K(I) and Na(I) ion) and perchlorate (Fe(II) ion) were obtained from Sigma-Aldrich (Czech Republic, Prague).
2.3. Spectroscopic Studies on the Interactions of Tryptanthrin Derivates with Metal Guests
For the UV–Vis “on-off” study, 35 mg of each synthetic compound was dissolved in 1 mL DMSO. The calculated volume of the solution of tryptanthrin derivates was placed into a 10 mL flask, and water was added to a final volume. The obtained concentration in the stock solution was 100 μM.
Defined amounts of metal salts were dissolved in measured tryptanthrin solution in a 10 mL volumetric flask for a final concentration of the metal cation of 5000 µM.
UV–Vis spectra of the tryptanthrin derivates were measured by SpectraMax ABS Plus in the presence and absence of the used metal guests. Data were collected in the range of 200–800 nm with 1 nm data spacing in 96 UV–Vis well plates. Before the first measurement, prepared solutions were shaken for 180 s.
2.4. Determining the Conditional Binding Constants and the Complex Stoichiometry of Tryptanthrin Derivates with Cu(II), Fe(II) and Fe(III) Ions
The interactions of tryptanthrin derivates with Cu(II), Fe(II) and Fe(III) ions were studied using UV–Vis spectroscopy. The concentration of PAA-TSC and T8H-TSC was 100 μM. The concentration of Cu(II), Fe(II) and Fe(III) ions was 5000 μM. It is known that binding constants are dependent on the solvent used. All titrations were performed in the same solvent system, and the concentration of tryptanthrin solutions was maintained at 100 μM. Conditional constants (K values) were calculated from the absorbance changes (ΔA) of tryptanthrin derivates and their complexes with Cu(II), Fe(II) and Fe(III) ions at their spectral maximum by regression analysis (Letagrop Spefo 2005 software). The details of computational model have been described and discussed by Silen et al. [28], and the same method was used to analyse the binding affinity of the organic receptors for metal ions in aqueous media [29,30,31,32,33,34,35,36]. Solutions were mixed in the cuvette during the whole titration and after each addition of metal guests.
2.5. Studying PAA-TSC, T8H-TSC and Their Copper Complex through Raman and Infrared Spectroscopy
The sample was prepared in the solid state; 10 mg of receptor was dissolved in 1 mL of dichloromethane, and 5 mg of copper nitrate was dissolved in 1 mL of methanol. Prepared solutions were mixed and covered with ether.
For the measuring of Raman spectra, a Bruker FT Raman (FRA 106/S, Equinox 55/S) spectrometer equipped with a Nd:YAG laser was used with an excitation wavelength in the NIR range (λ = 1064 nm, Coherent) and a Ge detector cooled with liquid nitrogen. Glass vials were used for measurements. The measurements were performed by collecting 1024 scans with a resolution of 4 cm−1 for each sample. The laser power was set to 250 mW.
An AVATAR 320 (Nicolet) infrared spectrometer with Fourier transformation (FT-IR) was used to measure the sample spectra in the spectral range of 4000–400 cm−1. For measurements, the attenuated total reflection (ATR) technique with a ZnSe crystal was used. The measurements were performed by collecting 640 scans with a resolution of 4 cm−1 for each sample. Before each measurement, a new background was measured, and the ATR crystal was cleaned between each measurement. The obtained spectra were corrected by subtracting the spectrum of water as a background and the spectrum of water vapour. Prior to measurement, all samples were crushed in an agate dish to suppress the Christiansen effect.
2.6. Study of the Interaction of PAA-TSC and T8H-TSC Receptors with Cu(II) Ions by NMR
NMR spectra were recorded using a Bruker Avance III 500 Hz spectrometer for 1H NMR spectra at 25 °C in DMSO–d6. Copper(II) perchlorate hexahydrate was used as a source of Cu(II) ions.
2.7. In Silico Docking of Tryptanthrins to CoV-2 Proteases
The 3D structural model of the CoV-2 proteases (Mpro and PLpro) was obtained from the protein data bank database. PDB ID was 6LU7 and 3E9S Mpro and PLpro, respectively. In the structures obtained from the PubChem database, all bound water molecules and ligands were removed and saved using UCSF Chimera software as pdb files. The three-dimensional structures of the tested compounds (tryptanthrinss) were obtained with 3D Chemdraw software.
Molecular docking was performed by AutoDockTools (ADT). We analysed the interaction of Mpro and PLpro with the tested compounds using ADT, UCSF Chimera and BIOVIA Discovery Studio Visualiser to identify and describe the protein–ligand binding site. All docking poses from this cavity (binding site) were visually evaluated with BIOVIA Discovery Studio Visualiser and UCSF Chimera, and 2D and 3D models of the protein–ligand interaction were generated and are presented.
2.8. Antiviral Effects of T8H-TSC and PAA-TSC
Vero cells (1.5 × 10⁵/well) were infected with an isolate of SARS-CoV-2 provided by the Centre of Biological Protection in Těchonín, Czech Republic. The infectious inoculum contained 2.38E+07 copies of the E-gene of SARS-CoV-2. After 1 h of inoculation, the cells were supplemented with 1 mL of Dulbecco’s modified Eagle’s medium containing 2% foetal bovine serum (2% FBS-DMEM) and increasing concentrations (0–10 µM) of the compounds T8H-TSC and PAA-TSC. After 24 and 48 h of incubation, replication of SARS-CoV-2 and/or virus particles was characterised in an aliquot of culture supernatant by one-step RT–qPCR.
Viral RNA was isolated from 200 µL of culture supernatant using magnetic beads. SARS-CoV-2 RNA was quantified by amplification of E-gen SARS-CoV-2 (Generi Biotech) with a SensiFast Probe One-Step Kit (BioLine) and Light Cycler 480 II (Roche) using absolute quantification and calibration curves. The primers and probe used together with their sequences are summarised in Table 1. Statistical analysis of the obtained data for finding significant differences (* p < 0.05) was performed using a one-tailed unpaired Student’s t-test with Welch correction.

Table 1.
Primers and probe used.
3. Results and Discussion
3.1. Synthesis
Firstly, tryptanthrin (T8H) was prepared by the reaction of equimolar amounts of isatoic anhydride and isatin [13,37] in the presence of DIPEA as a base in DMF at laboratory temperature with an 81% yield. Phaitanthrin A (PAA) was prepared by a catalytic aldol reaction of tryptanthrin with acetone in the presence of diethylamine [37,38] with a 75% yield. The thiosemicarbazones were prepared by reacting thiosemicarbazide with tryptanthrin in ethanol and with phaitanthrin A in methanol, respectively, with catalytic amounts of acetic acid in both cases. T8H-TSC was formed with a 94% yield, and PAA-TSC was formed with a 79% yield (Scheme 2). The tryptanthrin derivatives were fully characterised by 1H and 13C NMR and HRMS analyses.
Scheme 2.
Synthesis of compounds.
Phaitanthrin A was formed as a racemate. PAA-TSC was formed as a mixture of diastereoisomers (due to the chiral centre at the indoline core and geometrical stereoisomerism about the C=N double bond). The ratio of the diastereoisomers calculated from the 1H NMR signal for methyl (1.80/1.87) as well as from the signal for NH (9.79/10.45) was 7:1.
3.2. Spectroscopic Study
First, the interaction of nitrogen receptors and metal guests (Al(III), Co(II), Cu(II), Fe(III), Pb(II), Zn(II), Mg(II), Ca(II), K(I), Na(I) and Fe(II) ions) was analysed using UV–Vis spectroscopy. The receptor concentration was 100 μM, and the metal ion concentration was 5000 μM. The PAA-TSC receptor produced observable bands in the 264 nm, 315 nm and 329 nm regions (Figure 1). The addition of Cu(II) caused a significant change in the absorption spectrum of the PAA-TSC solution and a decrease in its absorption intensity, while the original bands disappeared. Furthermore, a decrease in absorbance intensity was observed after Fe(III) was added to the receptor solution. In the 264 nm region, the absorbance intensity decreased by approximately 30%, and in the 315 nm and 329 nm regions, a decrease in intensity of approximately 10% was observed. A small decrease in absorbance intensity (approximately 8%) in the region of 264 nm was observed in the presence of Fe(II). The other tested metal ions did not induce significant spectral changes.
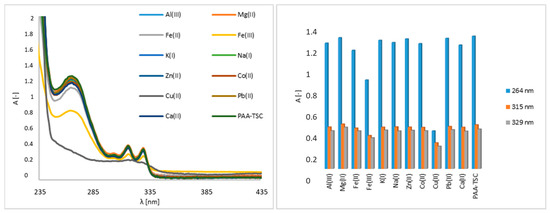
Figure 1.
UV–Vis spectra of the PAA-TSC receptor (100 μM) without and with metal ions (5000 μM) in water (water/DMSO, 99:1, v/v), including a bar graph of the absorption maxima (264 nm, 315 nm, 329 nm).
In the case of the T8H-TSC receptor, bands in regions of 252 nm, 405 nm and 425 nm are observable in the original spectrum (Figure 2). As with the PAA-TSC receptor, spectral changes can be observed after Cu(II), Fe(III) and Fe(II) are added, and no significant spectral changes are observed for the remaining metal ions. After Cu(II) was added to the T8H-TSC receptor, there was again a significant change in the spectrum and a decrease in the absorbance intensity. After Fe(III) was added, there was a slight decrease in the absorbance intensity (approximately 15%). After Fe(II) was added, there was a slight increase in the absorbance intensity (approximately 2%).
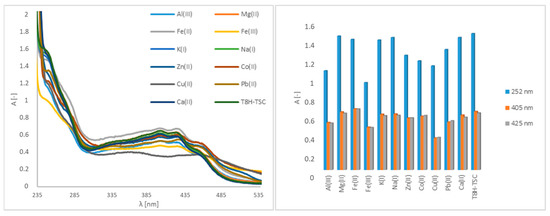
Figure 2.
UV–Vis spectra of the T8H-TSC receptor (100 μM) without and with metal ions (5000 μM) in water (water/DMSO, 99:1, v/v), including a bar graph of the absorption maxima (252 nm, 405 nm, 425 nm).
A titration experiment was used to determine the interaction between Cu(II) and the PAA-TSC receptor, and we specified the linear range and limit of detection. As shown in Figure 3, in the region of 265 mn, the absorbance intensity trend decreases after the addition of Cu(II). The addition of 0.52 equivalents of Cu(II) decreased the absorbance intensity by approximately 25%, and after the addition of 6.25 equivalents, the decrease was approximately 90%. The presence of Cu(II) also increased the absorbance intensity in the 315 and 329 nm regions. In those regions, after the addition of 0.52 equivalents of Cu(II), the absorbance intensity increased by approximately 26% in the case of 315 nm and 23% in the case of 329 nm. The addition of 6.25 equivalents decreased the absorbance intensity by approximately 83% at 315 nm and 84% at 329 nm.
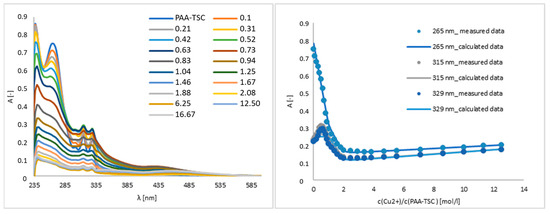
Figure 3.
Titration and titration curves of the PAA-TSC receptor with Cu(II) ions in water (water/DMSO, 99:1, v/v). Titration curves were measured at the absorption maxima (265 nm, 315 nm, 329 nm) of the PAA-TSC receptor.
The Ka values of the receptor complexes (PAA-TSC, T8H-TSC) with transition metal ions (Cu(II), Fe(III) and Fe(II)) were calculated in Letagrop Spefo 2005, and the Ka values and stoichiometry are shown in Table 2. In the case of the PAA-TSC receptor, the Cu(II) ion shows the highest affinity, and in the case of the T8H-TSC receptor, the Fe(III) ion exhibits the highest affinity. Therefore, this suggests that the receptors we synthesized can be used as chelators for copper and iron ions.
Table 2.
Ka values and stoichiometry of receptors (PAA-TSC, T8H-TSC) in complex with metals (Cu(II), Fe(III), Fe(II)) in water (water/DMSO, 99:1, v/v).
Chemical sensors are often used as receptors for metal ions. The detection limits and linear range (Table S1) suggest that the T8H-TSC receptor (6.6 µM and 0–4 µM) could be used for the determination of copper ions in drinking water; the maximum tolerable limit is 30 μM (2 mg/L), and the normal range for the copper concentration is 10 to 25 μmol/L in serum [39]. The strong interaction of both compounds with Cu(II) is associated with a colour change (Figure S6); nevertheless, its spectral properties limit its applicability.
FTIR, FT Raman and NMR Analysis of Cu Complex
From the comparison of the FTIR and FT Raman spectra of the pure substances (PAA-TSC, T8H-TSC; Figure 4 and Figure 5 with their Cu(II) complexes (detail of FTIR and Raman spectra are shown in Figures S7–S10)), there was a significant change in the spectra and therefore, it is evident that complexes of the PAA-TSC and T8H-TSC receptors with the Cu(II) ion were formed. The vibrational spectroscopic changes observed during complexation indicate that the thiourea residue is primarily involved in metal binding, while the rest of the receptor molecule can significantly stabilize the complex, primarily due to the participation of the nitrogen atom in the cyclic structure. In addition, thiourea residue can bind copper(II) cations both through sulphur and through nitrogen. The bonding of the metal through sulphur leads to a decrease in the order of the carbon–sulphur bond with the carbon–nitrogen bond approaching a double bond. As a result, the ν(CS) frequency should decrease and the ν(CN) frequency should increase. Moreover, if the place of the metal bond is nitrogen, then a decrease in the frequency of the N-H vibrations is observed, while in the case of coordination through sulphur, such changes are not observed [40].
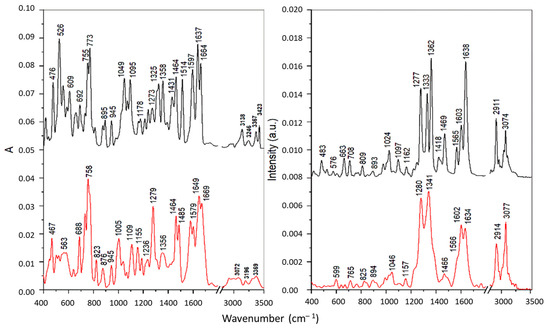
Figure 4.
FTIR (left) and Raman spectra (right) of the PAA-TSC receptor (black) and its complex with Cu(II) ions (red).
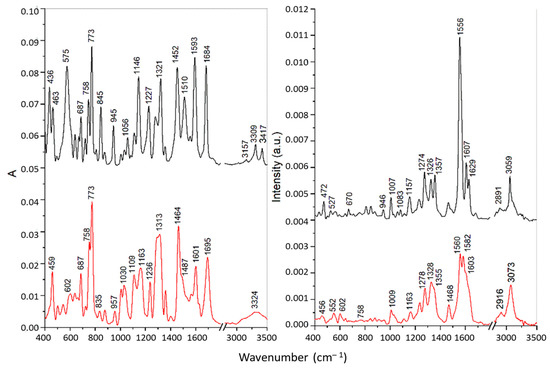
Figure 5.
FTIR (left) and Raman spectra (right) of the T8H-TSC receptor (black) and its complex with Cu(II) ions (red).
The IR bands of pure substances PAA-TSC and T8H-TSC at 3138–3157, 3246–3309 and 3417–3423 cm−1, attributed to the stretching of the NH2 and N-H groups of the thiourea residue, were shifted towards lower frequencies for the corresponding Cu(II) complexes, which indicates the participation of nitrogen atoms in the metal binding. However, the band of PAA-TSC at 3367 cm−1 assigned to the OH stretching showed only a slight shift for the Cu(II) complex; therefore, the hydroxyl group does not participate in the binding. For the complexes, all these bands were significantly broadened, especially for T8H-TSC, probably due to the presence of hydrogen bonds [40]. Similarly, the IR band of the pure substances at 1510–1514 cm−1 (antisymmetric CN stretching) and 1321–1325 cm−1 (NH bending) was shifted to 1485–1487 and 1279–1313 cm−1, respectively, upon the Cu(II) complexation. These spectral changes also confirmed metal bonding via nitrogen atoms. The intense sharp band of pure substances at 773 cm−1 was assigned to the CS stretching vibration of the thiourea residue [41]. This band showed no shift for the Cu(II) complex of T8H-TSC, and it is present as a shoulder near 770 cm−1 for the Cu(II) complex of PAA-TSC because it overlaps the more intense band at 758 cm−1 assigned to the τ(NH2) vibration [41]. These features indicate that in both complexes sulphur does not participation in the metal binding.
The FT Raman spectra of the pure substances are dominated by intense peaks in the regions of 1550–1650 and 1270–1370 cm−1 corresponding mainly to the C=N/C=C stretching and ring vibrations of the tryptanthrin cyclic structure. In the first region the most intense bands were found at 1638 cm−1 for PAA-TSC and at 1556 cm−1 for T8H-TSC. These bands were assigned to the C=N stretching in the open side chains. A significant shift of the latter band towards lower wavenumbers is explained by the strong conjugation with the cyclic system. The complexation with Cu(II) leads to significant changes in this spectral region that can be explained by the participation of cyclic and open-chain nitrogen atoms in the metal binding. In the second region, more significant changes, indicating the formation of Cu(II) complexes, were found in the case of PAA-TSA. Thus, effective chelation can be achieved with this substance due to the greater flexibility of the longer open chain.
The comparison of the NMR spectra of the pure substances PAA-TSC and T8H-TSC with their in situ formed Cu(II) complexes showed a significant change in the spectra; therefore, it is evident that a complex of the PAA-TSC and T8H-TSC receptors with the Cu(II) guests (one equivalent) was formed. In the spectra of PAA-TSC, the peaks with chemical shifts of 5.92 ppm and 6.53 ppm disappeared after the Cu(II) complexation. Furthermore, the peaks with chemical shifts of 9.79 and 10.45 ppm also changed (Figure 6). In the spectra of T8H-TSC, the peaks with chemical shifts of 8.85 and 9.15 ppm disappeared after the Cu(II) complexation, and the peak with a chemical shift of 13.00 ppm moved (Figure 7).
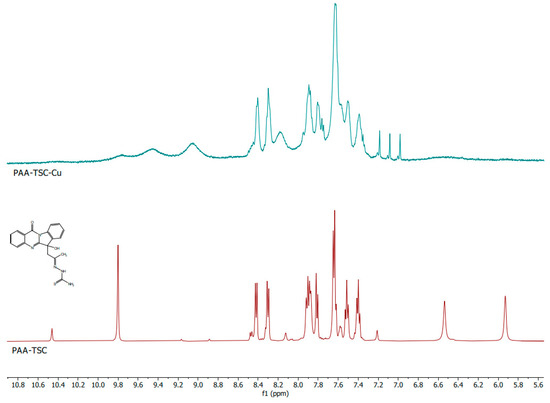
Figure 6.
1H NMR spectra of the PAA-TSC (below; maroon colour) receptor and comparison with the corresponding complex with Cu(II) ions (above; teal colour).
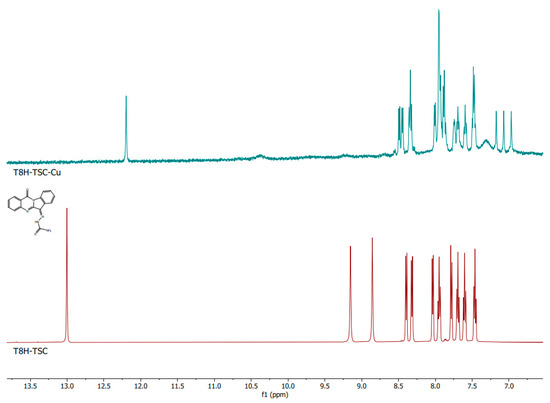
Figure 7.
1H NMR spectra of the T8H-TSC (below; maroon colour) receptor and comparison with the corresponding complex with Cu(II) ions (above; teal colour).
3.3. In Silico Docking of PLpro and Mpro with Tested Tryptanthrins
For the docking studies, model complexes of PLpro and Mpro with the tested compounds were constructed. The 3D structures of the protease were obtained from the protein data bank database with PDB ID 3E9S and PDB ID 6LU7 for PLpro and Mpro, respectively. The 3D structure of the tryptanthrin derivatives was obtained with the 3D Chemdraw software. In the structures obtained from the PubChem database, all the bound water molecules and ligands were extracted by the UCSF Chimera software and saved as pdb files. During the docking process, the proteins were considered a receptor and the tryptanthrin derivatives were considered a ligand, and we used a grid box for the receptor. In this study, the three-dimensional structure of the protease was considered a receptor. The tested compounds were considered ligands.
For the in silico analysis, AutoDockTools (ADT) was used [42] for the preparation of the receptors and ligands. Nonessential water molecules, including heteroatoms, were removed using UCSF Chimera before the continuation of the docking test. Furthermore, ADT was used in the preparation of the tryptanthrin derivatives for the docking analysis (extraction of the solvent molecules and addition of polar hydrogen and partial charges). Finally, the molecular docking was done using ADT. The interactions of SARS- PLpro and Mpro with the tested compounds were analysed using ADT, UCSF Chimera and BIOVIA Discovery Studio Visualiser to identify and describe the protein–ligand binding site.
We conducted a detailed analysis of ligand–protein complexes (e.g., the value of the binding energy, the role of hydrogen bonds and π–π interactions, and amino acid residues in the process of binding). The 3D structures were converted to the pdbqt format using ADT. The size of the grid box was 126 _ 126 _ 126, and the centre that contained the maximum of the protein surface for the blind docking was selected.
After the AutoGrid and AutoDock analyses, ten possible conformations were obtained and the best conformation was selected based on the binding energy and number of H-bonds. The better binding sites (conformations) obtained from the docking process were found with ADT by the function “analysis-conformation-ranked by energy”. Subsequently, the pdbqt files were obtained and converted from pdbqt to pdb using the OpenBabelGUI software. The obtained complexes were analysed in UCSF Chimera and BIOVIA Discovery Studio Visualiser [43]. The binding affinity, binding energy, H-bonds and existence of π-π interactions of the tested compounds to SARS-PLpro and Mpro were analysed using ADT. A more detailed analysis of the binding pockets (e.g., role of the amino acid residues) was performed by using the UCSF Chimera software [44]. Furthermore, the UCSF Chimera software was used for rendering pictures labelling the amino acid residues for a better visualisation of the binding site. Complete information and images are given in separate documents below.
3.3.1. Molecular Docking of PLpro with PAA, Tryptanthrin (T8H) and Their Derivates (PAA-TSC and T8H-TSC)
For the docking calculation, the structural model of the SARS-PLpro (PDB ID 3E9S) catalytic domain was used. The compounds PAA, T8H, PAA-TSC and T8H-TSC were docked to the structural model of PLpro using the AutoDock Tools software. All docking poses from the protein binding site were visually analysed with UCSF Chimera and BIOVIA Discovery Studio Visualiser, and 2D interaction diagrams with 3D visualisations of the protein–ligand complex were constructed (Figure 8, Figure 9, Figure 10 and Figure 11). The computed values of the interaction energy and association constant for PLpro and the tested compounds PAA, T8H, PAA-TSC and T8H-TSC are shown in Table 3.
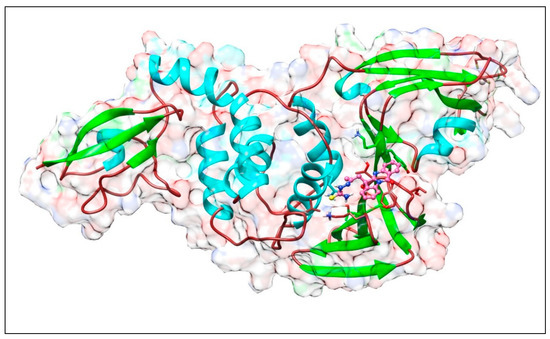
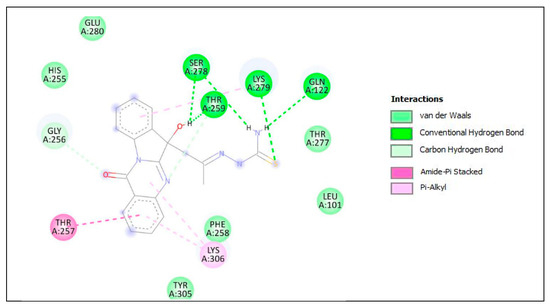
Figure 8.
Complex of PLpro with PAA-TSC. The upper panel shows a 3D model of PLpro with a binding site (cavity) on its surface for the PAA-TSC compound. The lower panel shows the interaction of PAA-TSC with the amino acid residues of PLpro. Figure was created with UCSF Chimera (upper panel) and BIOVIA Discovery Studio Visualiser (lower panel) and shows the best docking pose of compound PAA-TSC on the PLpro protease. We can also see where the PAA-TSC is placed on the Plpro surface and a general view of the complex of Plpro (green–cyan–brown) with PAA-TSC (pink). The secondary structure of the protease behind the molecular surface (created with 90% transparency for better presentation of the molecule) is also shown.
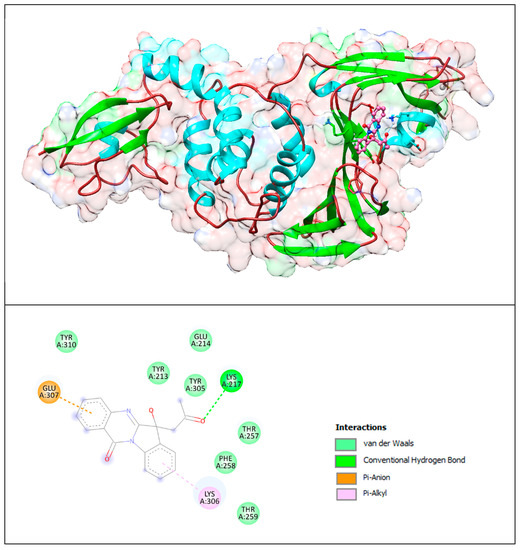
Figure 9.
Complex of PLpro with PAA. The upper panel shows a 3D model of PLpro with a binding site (cavity) on its surface for the PAA compound. The lower panel shows the binding mode of PAA with the amino acid residues of PLpro. Figure was created with UCSF Chimera (upper panel) and BIOVIA Discovery Studio Visualiser (lower panel) and shows the best docking pose of compound PAA on PLpro. We should also see where PAA is placed on the PLpro surface and a general view of the complex of PLpro (green–cyan–brown) with PAA (pink). The secondary structure of the protease behind the molecular surface (created with 90% transparency for better presentation of the molecule) is also shown.
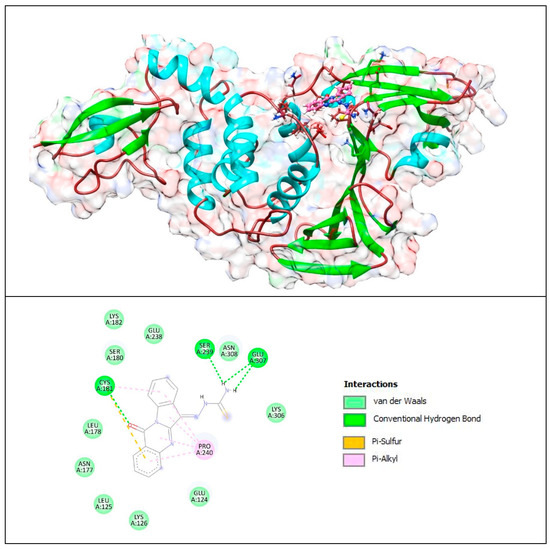
Figure 10.
Complex of PLpro with T8H-TSC. The upper panel shows a 3D model of PLpro with a binding site (cavity) on its surface for the T8H-TSC compound. The lower panel shows the binding mode of T8H-TSC with the amino acid residues of PLpro. Figure was created with UCSF Chimera (upper panel) and BIOVIA Discovery Studio Visualiser (lower panel) and shows the best docking pose of Compound T8H-TSC on PLpro. We can also see where T8H-TSC is placed on the PLpro surface and a general view of the complex of PLpro (green–cyan–brown) with T8H-TSC (pink). The secondary structure of the protease behind the molecular surface (created with 90% transparency for better presentation of the molecule) is also shown.
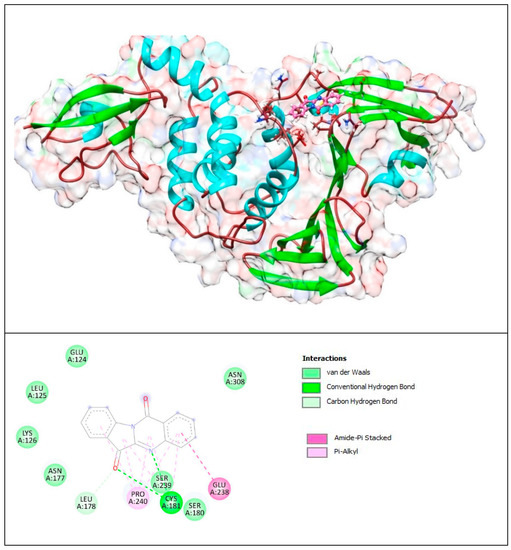
Figure 11.
Complex of PLpro with T8H (tryptanthrin). The upper panel shows a 3D model of PLpro with a binding site (cavity) on its surface for tryptanthrin. The lower panel shows the binding mode of T8H-TSC with the amino acid residues of PLpro. Figure was created with UCSF Chimera (upper panel) and BIOVIA Discovery Studio Visualiser (lower panel) and shows the best docking pose of tryptanthrin on PLpro. We can also see where tryptanthrin is placed on the PLpro’s surface and the general view of the PLpro (green–cyan–brown) complex with tryptanthrin (pink). The secondary structure of the protease behind the molecular surface (created with 90% transparency for better presentation of the molecule) is also shown.
Table 3.
Binding energy and association constant of PAA, PAA and T8H and T8H-TSC for PLpro.
Based on the data obtained during molecular docking, we can conclude that the tryptanthrin derivative (T8H-TSC) exhibits a higher affinity for PLpro than that of tryptanthrin and the rest of our compounds (PAA and PAA-TSC).
The lower panel of Figure 8 was generated with BIOVIA Discovery Studio Visualiser and shows a 2D diagram of the interactions between Plpro and PAA-TSC.
Based on these images, we see that the following amino acids form the binding pocket: LYS306, TYR305, THR259, GLN122, THR257, PHE258, LEU101, LYS279, SER278 and THR277.
If we look in more detail at the lower panel, we can make conclusions about the types of interactions and where they interact with PAA-TSC. Amino acids, such as SER278, LYS279, THR259 and GLN122, participate in the formation of conventional H–bonds. The hydroxyl (-OH) group interacts with the SER278 and THR259 aa via conventional H–bonds. The amino (-NH2) group also interacts with SER278 and GLN122 aa via conventional H–bonds. LYS279 interacts with sulphur via conventional H–bonds and with benzene via π–alkyl bonds. Oxygen and nitrogen from the quinazolinone group interact with GLY256 and THR259 via carbon H–bonds. The quinazolinone group also interacts with LYS306 via π–alkyl bonds. The quinazolinone part of PAA-TSC interacts with LYS306 and THR257 via π–alkyl and amide–π stacked bonds. Other aa (HIS255, GLU280, THR277, LEU101, PHE258 and TYR305) can participate in van der Waals (vdW) interactions.
The lower panel of Figure 9 was generated with BIOVIA Discovery Studio Visualiser and shows a 2D diagram of the interactions between PLpro and the PAA compound.
Based on these images, we see that the following amino acids form the binding pocket: TYR310, GLU214, TYR213, TYR305, LYS217, GLU307, THR257, PHE258, LYS306 and THR259.
If we look in more detail at the lower panel, we can make conclusions about the types of interactions and where they interact with PAA. Amino acid LYS217 participates in the formation of conventional H–bonds with keto groups. The indoline group of the PAA compound interacts with LYS306 via the π–alkyl bond, and the quinazolinone group interacts with GLU307 via the π–anion interaction.
Other aa (TYR310, TYR213, GLU214, TYR305, THR257, PHE258 and THR259) participate in forming vdW interactions.
The lower panel of Figure 10 was generated with BIOVIA Discovery Studio Visualiser and shows a 2D diagram of the interactions between PLpro and T8H-TSC.
Based on these images, we see that the following amino acids form the binding pocket: ASN177, SER180, LYS182, CYS181, LEU178, GLU238, LYS126, SER239, LEU125, PRO240, ASN308, GLU124, GLU307 and LYS306.
If we look in more detail at the lower panel, we can make conclusions about the types of interactions and where they interact with T8H-TSC. Amino acids, such as CYS181, SER239 and GLU307, participate in the formation of conventional H–bonds. The amino (-NH2) group interacts with SER239 and GLU307 via conventional H–bonds. CYS181 also interacts with the carbonyl group via conventional H–bonds. However, this aa (CYS181) also takes part in the formation of the π–sulfur and π–alkyl bonds with aryl groups.
Other aa (ASN177, SER180, LYS182, LEU178, GLU238, LYS126, LEU125, ASN308, GLU124, LYS306) take part in forming vdW interactions.
The lower panel of Figure 11 was generated with BIOVIA Discovery Studio Visualiser and shows a 2D diagram of the interactions between PLpro and tryptanthrin.
Based on these images, we see that the following amino acids form the binding pocket: ASN177, SER180, CYS181, LEU178, GLU238, LYS126, SER239, LEU125, PRO240, ASN308, GLU124 and LYS306. In the formation of conventional H–bonds, CYS181 interacts with nitrogen from the quinazolinone group and with oxygen from the indolinone group. Aa LEU178 interacts with oxygen from the indolinone carbonyl group via carbon–hydrogen bonds. Each of the benzene groups of tryptanthrin interacts with PRO240 via π–alkyl bonds, and only one interacts with GLU238 via amide–π stacked bonds.
Other aa (GLU124, LEU125, ASN308, LYS126, ASN177, SER180) participate in vdW interactions.
As seen in the images and diagrams, the binding pocket for tryptanthrin (T8H) is more similar to the T8H-TSC compound (Figure 12 and Figure 13) than to PAA-TSC and PAA and includes almost the same set of amino acids for both ligands.
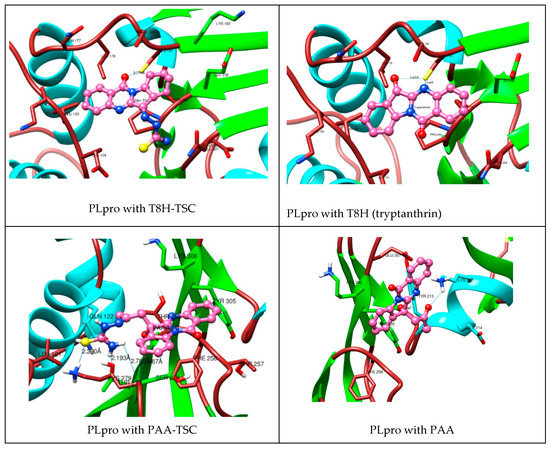
Figure 12.
Comparison of complexes PLpro with tryptanthrin derivates (TSC compounds) (left) with tryptanthrin and PAA (right). During the creation of the magnified image, the hydrogen atoms were hidden for aesthetic reasons.
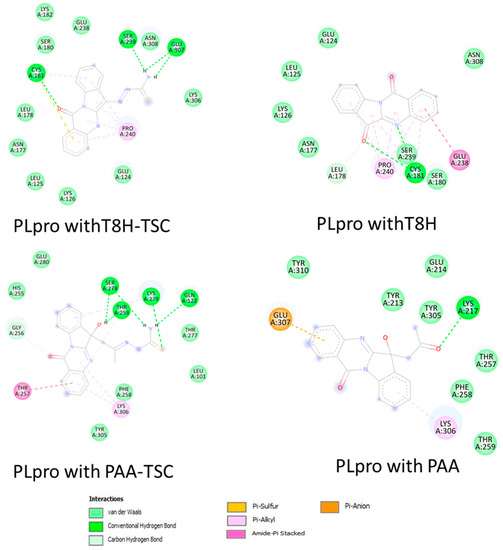
Figure 13.
Comparison of 2D diagrams of interaction complexes PLpro with traptanthrin derivates (TSC compounds) (left) with tryptanthrin and PAA (right).
The docking studies suggest that tryptanthrin and its derivative T8H-TSC bind to PLpro via their common interactions with SER180, ASN177, LEU178, CYS181, GLU238, SER239, LYS126, LEU125, PRO240 GLU124, ASN308 and CYS181, and they have almost the same position in the binding pocket.
However, little difference in the mode of interaction was found. For example, T8H-TSC forms more conventional hydrogen bonds (SER239, GLU307, CYS181) than tryptanthrin (only CYS181) but does not have π–amide interactions with GLU238. On the other hand, both compounds have similar interactions with PRO240 via π–alkyl bonds. It should also be noted that, in addition to hydrogen, CYS181 also provides π–sulphur bonds.
Now, we will compare the interactions between the two tryptanthrin derivates. As noted above, PAA-TSC and T8H-TSC have completely different binding pocket locations. However, they also share a common trend of connection to the receptor. In particular, they have more hydrogen bonds than tryptanthrin and both have π–alkyl bonds (LYS306 with PAA-TSC and PRO240 with T8H-TSC). In addition, PAA-TSC forms a π–amide bond with THR 257 and theoretically has less potential than T8H-TSC (by comparing the binding energies).
3.3.2. Molecular Docking of Mpro with PAA, Tryptanthrin (T8H) and Their Derivates (PAA-TSC and T8H-TSC)
For the docking calculation, a structural model of the Mpro (PDB ID 6LU7) catalytic domain was used. The compounds PAA, T8H, PAA-TSC and T8H-TSC were docked to the structural model of Mpro using the AutoDock Tools software. All the docking poses from the protein binding site were visually analysed with UCSF Chimera and BIOVIA Discovery Studio Visualiser, and 2D interaction diagrams with 3D visualisations of the protein–ligand complex were constructed (Figure 14, Figure 15, Figure 16 and Figure 17). The computed values of the interaction energy and association constant for Mpro and the tested compounds PAA, T8H, PAA-TSC and T8H-TSC are shown in Table 4.
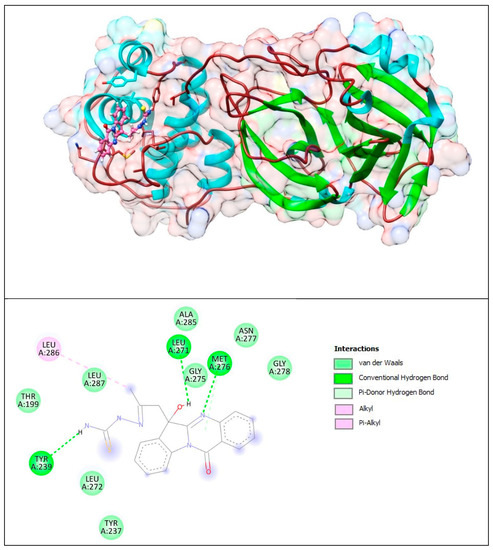
Figure 14.
Complex of Mpro with PAA-TSC. The upper panel shows a 3D model of Mpro with a binding site (cavity) on its surface PAA-TSC. The lower panel shows the binding mode of PAA-TSC with the amino acid residues of Mpro. Figure was created with UCSF Chimera (upper panel) and BIOVIA Discovery Studio Visualiser (lower panel) and shows the best docking pose of PAA-TSC on Mpro. We can also see where the PAA-TSC is placed on the Mpro surface and a general view of the complex of Mpro (green–cyan–brown) with PAA-TSC (pink). The secondary structure of the protease behind the molecular surface (created with 90% transparency for better presentation of the molecule) is also shown.
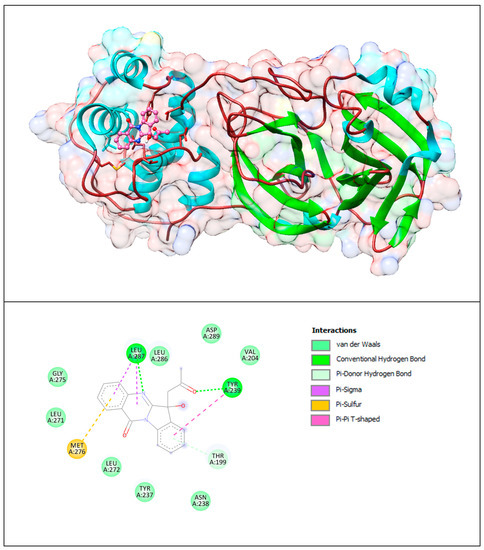
Figure 15.
Mpro with PAA. The upper panel shows a 3D model of Mpro with a binding site (cavity) on its surface PAA. The lower panel shows the binding mode of the PAA compound with the amino acid residues of Mpro. Figure was created with UCSF Chimera (upper panel) and BIOVIA Discovery Studio Visualiser (lower panel) and shows the best docking pose of PAA on Mpro. We can also see where PAA is placed on the Mpro surface and a general view of the complex of Mpro (green–cyan–brown) with PAA (pink). The secondary structure of the protease behind the molecular surface (created with 90% transparency to better illustrate the molecule) is also shown.
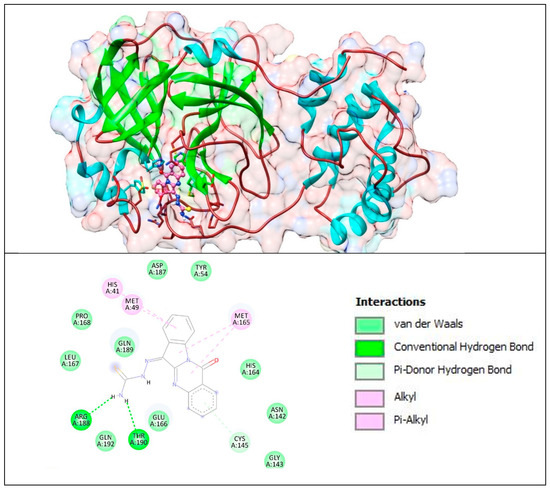
Figure 16.
Complex of CoV-2 Mpro with T8H-TSC. The upper panel shows a 3D model of Mpro with a binding site (cavity) on its surface T8H-TSC. The lower panel shows the binding mode of the T8H-TSC compound with the amino acid residues of Mpro. Figure was created with UCSF Chimera (upper panel) and BIOVIA Discovery Studio Visualiser (lower panel) and shows the best docking pose of T8H-TSC on Mpro. We can also see where T8H-TSC is placed on the Mpro surface and a general view of the complex of Mpro (green–cyan–brown) with T8H-TSC (pink). The secondary structure of the protease behind the molecular surface (created with 90% transparency to better illustrate the molecule) is also shown.
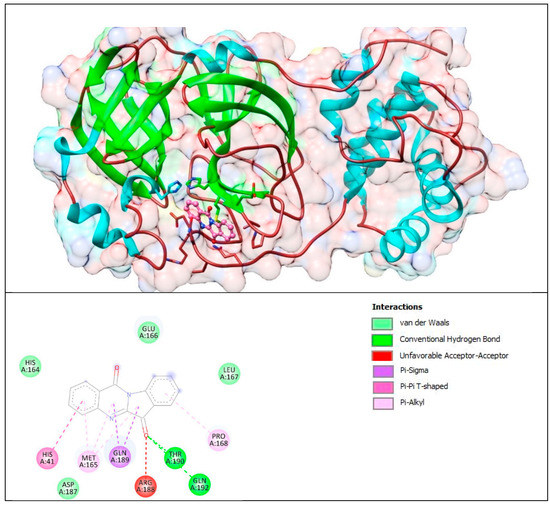
Figure 17.
Complex of Mpro with T8H (tryptanthrin). The upper panel shows a 3D model of Mpro with a binding site (cavity) on its surface T8H. The lower panel shows the binding mode of T8H with the amino acid residues of Mpro. Figure was created with UCSF Chimera (upper panel) and BIOVIA Discovery Studio Visualiser (lower panel) and shows the best docking pose of T8H on Mpro. We can also see where T8H is placed on the Mpro surface and a general view of the complex of Mpro (green–cyan–brown) with T8H (pink). The secondary structure of the protease behind the molecular surface (created with 90% transparency for better presentation of the molecule) is also shown.
Table 4.
Binding energy and association constant of PAA, PAA and T8H and T8H-TSC for Mpro.
Based on the data obtained during molecular docking, we can conclude again that the tryptanthrin derivative (T8H-TSC) exhibits a higher affinity for Mpro protease than tryptanthrin and the rest of our compounds (PAA and PAA-TSC). However, in this case, we can also observe the higher affinity of PAA-TSC to Mpro than we saw before with Plpro.
The lower panel of Figure 14 was generated with BIOVIA Discovery Studio Visualiser and shows a 2D diagram of the interactions between Mpro and PAA-TSC.
Based on these images, we see that the following amino acids form the binding pocket: ALA285, ASN277, LEU286, LEU271, MET276, GLY278, LEU287, GLY275, TYR239, LEU272 and TYR237. The formation of conventional H–bonds involves LEU271 with the hydroxyl group of PAA-TSC, MET276 with nitrogen from the quinazolinone ring and TYR239 with the thiosemicarbazone amino group (CSNH2). LEU 286 interacts with the methyl group via alkyl and π–alkyl bonds.
Other aa (ALA285, ASN277, GLY278, LEU287, GLY275, LEU272, TYR237, THR199) participate in vdW interactions with PAA-TSC.
The lower panel of Figure 15 was generated with BIOVIA Discovery Studio Visualiser and shows a 2D diagram of the interactions between Mpro and PAA.
Based on these images, we see that the following amino acids form the binding pocket: ASP289, LEU287, LEU286, VAL204, GLY275, TYR239, LEU271, MET276, THR199, LEU272, TYR237 and ASN238. In the formation of conventional H–bonds, LEU287 has nitrogen from the quinazolinone ring of PAA and TYR 239 has a keto group. THR199 forms a π–donor hydrogen bond with PAA (benzene group). MET276 participates in the formation of the π–sulfur bond with the quinazolinone ring. In addition to the described H-bonds, LEU287 and TYR239 form π-sigma and π–π T–shaped bonds with an aromatic ring of PAA.
Other aa (ASP289, LEU286, VAL204, GLY275, LEU271, LEU272, TYR237, ASN238) participate in vdW interactions with PAA.
The lower panel of Figure 16 was generated with BIOVIA Discovery Studio Visualiser and shows a 2D diagram of the interactions between Mpro and T8H-TSC.
Based on these images, we see that the following amino acids form the binding pocket: ASP 187, TYR54, HIS41, MET49, PRO168, MET165, GLN189, LEU167, HIS164, ARG188, GLN192, THR190, GLU166, CYS145, ASN142 and GLY143. In the formation of conventional H-bonds, ARG188 and THR190 interact with the amine group of T8H-TSC. CYS145 participates in forming π–donor H–bonds. HIS41, MET49 and MET165 participate in the formation of alkyl and π–alkyl bonds with aromatic rings of T8H-TSC.
Other aa (ASP187, TYR54, PRO168, GLN189, LEU167, HIS164, GLN192, GLU166, ASN142, GLY143) participate in forming vdW interactions with T8H-TSC.
The lower panel of Figure 17 was generated with BIOVIA Discovery Studio Visualiser and shows a 2D diagram of the interactions between Mpro and T8H.
Based on these images, we see that the following amino acids form the binding pocket: GLU166, HIS164, LEU167, HIS41, MET165 GLN189, THR190, PRO168, ASP187, ARG188 and GLN192. In the formation of conventional H–bonds, GLN 192 and THR190 interact with carbonyl oxygen from the indolinone group of T8H. HIS41, MET165, PRO168, and GLN189 take part in forming the π–bonds, π–π T–shaped, π–alkyl and π–sigma, respectively.
Another aa (GLU166, HIS164, LEU167, ASP187) participates in forming vdW interactions with tryptanthrin.
As in the case of PLpro, the T8H-TSC compound has a similar binding pocket (cavity) as tryptanthrin and includes almost the same set of amino acids for both ligands (Figure 18 and Figure 19). However, in this example, we can see that the PAA-TSC and PAA have a similar location.
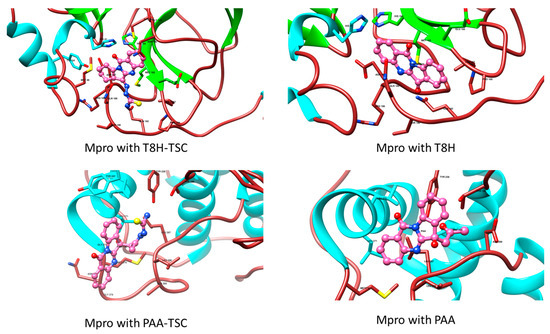
Figure 18.
Comparison of Mpro with tryptanthrin derivates (TSC compounds, the left side of figure) with tryptanthrin and PAA (right side). During the creation of the magnified image, the hydrogen atoms were hidden for aesthetic reasons.
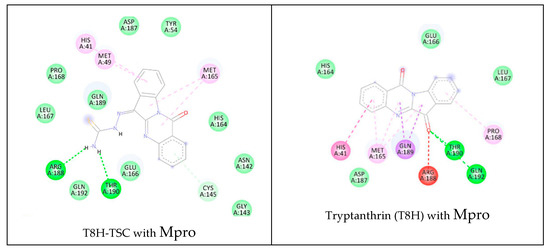
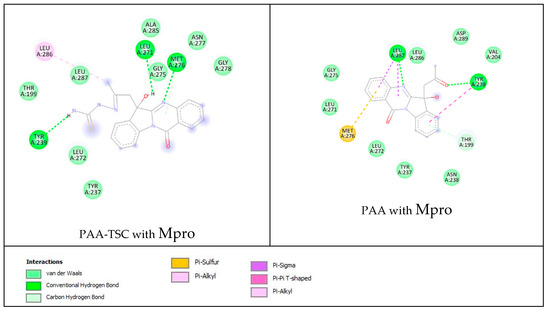
Figure 19.
Comparison of 2D diagrams of interactions complexes Mpro with traptanthrin derivates (TSC compounds, the left side of figure) with tryptanthrin and PAA (right).
Similar to the previous docking studies with PLpro, these computer calculations suggest that tryptanthrin and its derivative T8H-TSC bind to Mpro via their common interactions with ASP187, HIS41, PRO168, MET165, LEU167, GLN189, HIS164, ARG188, GLN192, THR190 and GLU166, and they have almost the same position in the binding pocket.
Nevertheless, again, we found little difference in the mode of interaction. For example, T8H-TSC forms common conventional hydrogen bonds (THR190) with tryptanthrin, but tryptanthrin forms an unfavourable acceptor–acceptor interaction with ARG 188 instead of regular H–bonds with it (similar to those of tryptanthrin).
Additionally, we should note that PAA-TSC has a higher binding energy than PAA (−7.94 kcal/mol instead of −6.32 kcal/mol).
Now, we will compare the interactions between the two derivates of tryptanthrin. As noted above, PAA-TSC and T8H-TSC have completely different binding pocket locations (certain sides of the proteases), and in contrast to the previous calculations, they do not have a common link.
3.4. Inhibition of SARS-CoV-2 Replication in Vero Cells
The predicted antiviral effect of the prepared compounds was tested in an in vitro model using Vero cells. In the presence of the two compounds, a significant decrease in the levels of SARS-CoV-2 RNA in culture supernatants representing viral particles was observed (Figure 20). Though T8H-TSC displayed inhibitory effects at both 10 and 1 μM (a decrease to 40% of that of the controls), the effects of PAA-TSC were rather insignificant, with an inhibitory effect observed only at 10 μM. Accordingly, a significantly higher binding ability for the SARS-CoV-2 proteases (Mpro and PLpro) and iron ions was found in T8H-TSC.
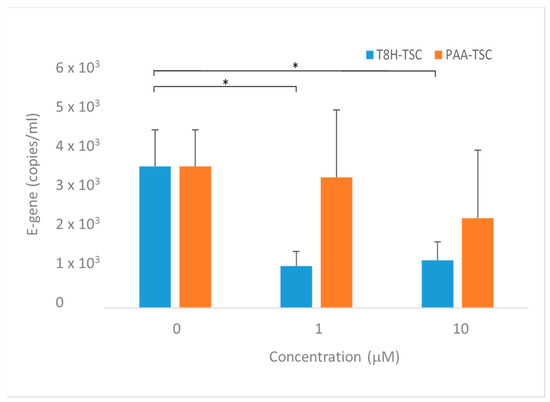
Figure 20.
Effect of tested Compounds 1 (PAA-TSC) and 2 (T8H-TSC) on SARS-CoV-2 replication in Vero cells. Forty-eight hours after infection. Graphs represent mean +/− S.E.M. Statistically significant differences at * p < 0.05 (one-tailed unpaired Student’s t-test with Welch correction).
The observed results strongly suggest that tryptanthrin represents a promising structural motif for designing novel antiviral agents.
3.5. Lipinski’s Rule Analysis, Drug-likeness and Drug Score Factor
Lipinski’s rules use five criteria to analyse if a substance is drug-like (ensuring its potential oral bioavailability). The rules are as follows: a molecule must have hydrogen bond acceptors (maximally ten), hydrogen bond donors (maximally five), a suitable molecular weight (under 500 Da), a cLogP lower than 5 and no more than one violation of the above four rules [45]. In addition, another standard, evaluated criterion is regarding polar surface area (lower than 140 A2). All the compounds fulfilled Lipinski’s five criteria; the data are summarised in Table 5. Moreover, drug-likeness and the drug score factors were determined using Osiris Property Explorer [46]. The drug-likeness score is a parameter that describes a substance with respect to Lipinski’s rules, including substructure fragment contributions. A positive value suggests that a compound predominantly contains fragments which are frequently present in commercial drugs. The drug score is function of the drug-likeness factor, cLogP, logS, molecular weight and predicted toxicity of analysed compounds. It allows us to predict the compound’s overall potential in the drug design; the drug scores of all compounds were higher than 0.53 (Table 5). It is comparable with the drug score of many antiviral agents used.
Table 5.
Lipinski’s rule parameters for tryptanthrin derivatives.
The drug score of T8H-TSC (0.92) was significantly higher than that of PAA_TSC (0.71). This suggests that T8H-TSC could be a more prospective antiviral agent than PAA_TSC. According to this hypothesis, T8H-TSC displays a higher affinity for Fe(II) and Fe(III) ions and PLpro and Mpro proteases. On the other hand, PAA_TSC displays a significantly higher binding ability for Cu(II) ions. The calculated values of the binding constants imply that T8H-TSC displays a preference for iron ions, whereas PAA_TSC exhibits potent selectivity for Cu(II) ions. Nevertheless, we cannot exclude the possibility that a higher iron level is a risk factor for COVID-19, and chelation has been studied as a treatment method [9,10,11]. However, the role of Cu(II) ions may be ambiguous, and their possible chelation can also have a negative effect on COVID-19 therapy [12]. More importantly, the antiviral activity of T8H-TSC was significantly more potent than that of PAA_TSC. Accordingly, the calculated values of the binding energy and associated constant for both Mpro and PLpro were highest for T8H-TSC. It could be suggested that T8H-TSC represents a suitable structural motif for treating COVID-19.
However, this result still does not necessarily mean that the combination of thiourea and the T8H structure motif is the optimal method for designing anti-COVID-19 agents. For example, the original drug score of T8H (0.94) was slightly better than that of T8H-TSC. Nevertheless, the predicted affinity to SARS-CoV-2 proteases represented by binding energy was calculated to be higher for T8H-TSC than for T8H. It could be suggested that T8H alone represents a promising building block, and its substitution by thiourea could be a possible method for preparing novel pharmacophores. In addition, for PAA, this substitution increases its drug score from 0.53 to 0.71. Nevertheless, both values are significantly lower than in this case of the original T8H. Admittingly, this fact could strongly limit the usability of this design strategy, and the effect of the discussed substitution on the antiviral effectivity of tryptanthrin derivates should be further validated in future studies.
4. Conclusions
In this study, we prepared two novel trypantrine derivatives (PAA-TSC and T8H-TSC) with a chelation group (thioguanine) for Fe(II/III) and Cu(II) ions. PAA-TSC and T8H-TSC display a significant preference for Cu(II) and Fe(III) ions, respectively. The results from the molecular docking strongly imply that the prepared compounds, especially T8H-TSC, displayed potent inhibitory effects against the PLpro and Mpro proteases. Accordingly, T8H-TSC potently represses SARS-CoV-2 replication in Vero cells. The antiviral effect of PAA-TSC was significantly smaller. The obtained results suggest that the structural motif of thiosemicarbazone could represent a promising starting point for designing novel antiviral agents.
Supplementary Materials
The following supporting information can be downloaded at https://www.mdpi.com/article/10.3390/separations10020073/s1: Figure S1: Titration and titration curves of PAA-TSC receptor with Fe(III) ion; Figure S2: Titration and titration curves of PAA-TSC receptor with Fe(II) ion; Figure S3: Titration and titration curves of T8H-TSC receptor with Cu(II) ion; Figure S4: Titration and titration curves of T8H-TSC receptor with Fe(III) ion; Figure S5: Titration and titration curves of T8H-TSC receptor with Fe(II) ion; Figure S6: Colour change after addition of Cu(II) ion to receptors (PAA-TSC and T8H-TSC); Figure S7: Infrared spectra of PAA-TSC receptor and its complex with Cu(II) ion; Figure S8: Raman spectra of PAA-TSC receptor and its complex with Cu(II) ion; Figure S9: Infrared spectra of T8H-TSC receptor and its complex with Cu(II) ion; Figure S10: Raman spectra of T8H-TSC receptor and its complex with Cu(II) ion; Table S1: Determination of limit of detection and linear range for PAA-TSC and T8H-TSC complexes with Cu (II) and Fe(II/III).
Author Contributions
K.V., Z.M., P.D., N.A., A.S. and O.V.: Investigation, Methodology, Validation, Writing—original draft. R.K., Z.K.: Conceptualization, Investigation, Writing—original draft; P.M.: Conceptualization, Resources, Supervision. M.J.: Conceptualization, Resources, Visualization, Supervision, Writing—original draft. All authors have read and agreed to the published version of the manuscript.
Funding
This work was supported by the project of Charles University in Prague (SVV260521; UNCE 204064) and the Ministry of Education, Youth, and Sports of Czech Republic, grant no. LM2018133 (EATRIS-CZ). We were also supported by the Cooperation Program of Charles University, as well as the project of Charles University in Prague Progress Q26-38/LF1 and Prague Progress Q27/LF1. The research study was also supported by the Technology Agency of the Czech Republic within projects nos. TN01000013 and FW02020128. We also acknowledge the Operational Programme Research, Development, and Education within the project Center for Tumor Ecology—Research of the Cancer Microenvironment Supporting Cancer Growth and Spread (reg. no.CZ.02.1.01/0.0/0.0/16_019/0000785). This work was also supported by the Ministry of Health of Czech Republic, grant nos. NU21-08-00407 and NU22-08-00160. We also thank the project National Institute for Cancer Research (Programme EXCELES, ID project no. LX22NPO5102) funded by the European Union—Next Generation EU. This work was also supported by the National Institute for Neurological Research (Programme EXCELES, ID Project No. LX22NPO5107) funded by the European Union—Next Generation EU.
Data Availability Statement
Not applicable.
Conflicts of Interest
The authors declare no conflict of interest. The funders had no role in the design of the study; in the collection, analyses, or interpretation of data; in the writing of the manuscript; or in the decision to publish the results.
References
- Flora, S.J.; Pachauri, V. Chelation in metal intoxication. Int. J. Environ. Res. Public Health 2010, 7, 2745–2788. [Google Scholar] [CrossRef] [PubMed]
- Lawson, M.K.; Valko, M.; Cronin, M.T.D.; Jomová, K. Chelators in Iron and Copper Toxicity. Curr. Pharmacol. Rep. 2016, 2, 271–280. [Google Scholar] [CrossRef]
- Prachayasittikul, V.; Prachayasittikul, S.; Ruchirawat, S.; Prachayasittikul, V. 8-Hydroxyquinolines: A review of their metal chelating properties and medicinal applications. Drug Des. Dev. Ther. 2013, 7, 1157–1178. [Google Scholar] [CrossRef] [PubMed]
- Bleackley, M.R.; Macgillivray, R.T. Transition metal homeostasis: From yeast to human disease. Biometals 2011, 24, 785–809. [Google Scholar] [CrossRef]
- Tisato, F.; Marzano, C.; Porchia, M.; Pellei, M.; Santini, C. Copper in diseases and treatments, and copper-based anticancer strategies. Med. Res. Rev. 2010, 30, 708–749. [Google Scholar] [CrossRef]
- Diaz-Ochoa, V.E.; Jellbauer, S.; Klaus, S.; Raffatellu, M. Transition metal ions at the crossroads of mucosal immunity and microbial pathogenesis. Front. Cell. Infect. Microbiol. 2014, 4, 2. [Google Scholar] [CrossRef]
- Chen, A.Y.; Adamek, R.N.; Dick, B.L.; Credille, C.V.; Morrison, C.N.; Cohen, S.M. Targeting Metalloenzymes for Therapeutic Intervention. Chem. Rev. 2019, 119, 1323–1455. [Google Scholar] [CrossRef]
- Charbonnier, M.; González-Espinoza, G.; Kehl-Fie, T.E.; Lalaouna, D. Battle for Metals: Regulatory RNAs at the Front Line. Front. Cell. Infect. Microbiol. 2022, 12, 952948. [Google Scholar] [CrossRef]
- Bozkurt, F.T.; Tercan, M.; Patmano, G.; Bingol Tanrıverdi, T.; Demir, H.A.; Yurekli, U.F. Can Ferritin Levels Predict the Severity of Illness in Patients with COVID-19? Cureus 2021, 13, e12832. [Google Scholar] [CrossRef]
- Tabassum, T.; Araf, Y.; Moin, A.T.; Rahaman, T.I.; Hosen, M.J. COVID-19-associated-mucormycosis: Possible role of free iron uptake and immunosuppression. Mol. Biol. Rep. 2021, 49, 747–754. [Google Scholar] [CrossRef]
- Fratta Pasini, A.M.; Stranieri, C.; Girelli, D.; Busti, F.; Cominacini, L. Is Ferroptosis a Key Component of the Process Leading to Multiorgan Damage in COVID-19? Antioxidants 2021, 10, 1677. [Google Scholar] [CrossRef] [PubMed]
- Engin, A.B.; Engin, E.D.; Engin, A. Can iron, zinc, copper and selenium status be a prognostic determinant in COVID-19 patients? Environ. Toxicol. Pharmacol. 2022, 95, 103937. [Google Scholar] [CrossRef] [PubMed]
- Kaur, R.; Manjal, S.K.; Rawal, R.K.; Kumar, K. Recent synthetic and medicinal perspectives of tryptanthrin. Bioorg. Med. Chem. 2017, 25, 4533–4552. [Google Scholar] [CrossRef] [PubMed]
- Liang, Y.; Wang, X.; Fang, H.; Han, N.; Wang, C.; Xiao, Z.; Zhu, A.; Liu, J. A Highly Selective and Sensitive Colorimetric Probe for Cu2+ Determination in Aqueous Media Based on Derivative of Tryptanthrin. Anal. Sci. 2018, 34, 1111–1115. [Google Scholar] [CrossRef]
- Kawakami, J.; Kinami, Y.; Takahashi, M.; Ito, S. 2-Hydroxytryptanthrin and 1-Formyl-2-hydroxytryptanthrin as Fluorescent Metal-ion Sensors and Near-infrared Fluorescent Labeling Reagents. Trans. Mater. Res. Soc. Jpn. 2018, 43, 109–112. [Google Scholar] [CrossRef]
- Wang, Y.; Ai, Y.; Zhang, Y.; Ren, Y.; Wang, J.; Yao, F.; Li, W.; Zhou, Y.; Sun, Y.; Liu, J.; et al. A new probe with high selectivity and sensitivity for detecting copper ions in traditional Chinese medicine and water sample. Inorg. Chem. Commun. 2021, 128, 108563. [Google Scholar] [CrossRef]
- Kirpotina, L.N.; Schepetkin, I.A.; Hammaker, D.; Kuhs, A.; Khlebnikov, A.I.; Quinn, M.T. Therapeutic Effects of Tryptanthrin and Tryptanthrin-6-Oxime in Models of Rheumatoid Arthritis. Front. Pharmacol. 2020, 11, 1145. [Google Scholar] [CrossRef]
- Kawakami, J.; Takahashi, M.; Ito, S.; Kitahara, H. Photophysical Properties of the 2-Hydroxytryptanthrin and Its Sodium Salt as Near-infrared Dyes for Fluorescent Imaging. Anal. Sci. 2016, 32, 251–253. [Google Scholar] [CrossRef]
- Popov, A.; Klimovich, A.; Styshova, O.; Moskovkina, T.; Shchekotikhin, A.; Grammatikova, N.; Dezhenkova, L.; Kaluzhny, D.; Deriabin, P.; Gerasimenko, A.; et al. Design, synthesis and biomedical evaluation of mostotrin, a new water soluble tryptanthrin derivative. Int. J. Mol. Med. 2020, 46, 1335–1346. [Google Scholar] [CrossRef]
- Tsai, Y.C.; Lee, C.L.; Yen, H.R.; Chang, Y.S.; Lin, Y.P.; Huang, S.H.; Lin, C.W. Antiviral Action of Tryptanthrin Isolated from Strobilanthes cusia Leaf against Human Coronavirus NL63. Biomolecules 2020, 10, 366. [Google Scholar] [CrossRef]
- Narkhede, R.R.; Pise, A.V.; Cheke, R.S.; Shinde, S.D. Recognition of Natural Products as Potential Inhibitors of COVID-19 Main Protease (Mpro): In-Silico Evidences. Nat. Prod. Bioprospect. 2020, 10, 297–306. [Google Scholar] [CrossRef] [PubMed]
- Mani, J.S.; Johnson, J.B.; Steel, J.C.; Broszczak, D.A.; Neilsen, P.M.; Walsh, K.B.; Naiker, M. Natural product-derived phytochemicals as potential agents against coronaviruses: A review. Virus Res. 2020, 284, 197989. [Google Scholar] [CrossRef]
- de Siqueira, L.R.P.; de Moraes Gomes, P.A.T.; de Lima Ferreira, L.P.; de Melo Rêgo, M.J.B.; Leite, A.C.L. Multi-target compounds acting in cancer progression: Focus on thiosemicarbazone, thiazole and thiazolidinone analogues. Eur. J. Med. Chem. 2019, 170, 237–260. [Google Scholar] [CrossRef] [PubMed]
- Shakya, B.; Yadav, P.N. Thiosemicarbazones as Potent Anticancer Agents and their Modes of Action. Mini Rev. Med. Chem. 2020, 20, 638–661. [Google Scholar] [CrossRef]
- Moharana, A.K.; Dash, R.N.; Subudhi, B.B. Thiosemicarbazides: Updates on Antivirals Strategy. Mini Rev. Med. Chem. 2020, 20, 2135–2152. [Google Scholar] [CrossRef] [PubMed]
- Gupta, S.; Singh, N.; Khan, T.; Joshi, S. Thiosemicarbazone derivatives of transition metals as multi-target drugs: A review. Results Chem. 2022, 4, 100459. [Google Scholar] [CrossRef]
- Dilworth, J.R.; Hueting, R. Metal complexes of thiosemicarbazones for imaging and therapy. Inorg. Chim. Acta 2012, 389, 3–15. [Google Scholar] [CrossRef]
- Dyrssen, D.; Ingri, N.; Sillén, L. “Pit-mapping”—A General Approach for Computer Refining of Equilibrium Constants. Acta Chem. Scand. 1961, 15, 694–696. [Google Scholar] [CrossRef]
- Jakubek, M.; Kejík, Z.; Antonyová, V.; Kaplánek, R.; Sýkora, D.; Hromádka, R.; Vyhlídalová, K.; Martásek, P.; Král, V. Benzoisothiazole-1,1-dioxide-based synthetic receptor for zinc ion recognition in aqueous medium and its interaction with nucleic acids. Supramol. Chem. 2019, 31, 19–27. [Google Scholar] [CrossRef]
- Jakubek, M.; Kejík, Z.; Kaplánek, R.; Veselá, H.; Sýkora, D.; Martásek, P.; Král, V. Perimidine-based synthetic receptors for determination of copper(II) in water solution. Supramol. Chem. 2018, 30, 218–226. [Google Scholar] [CrossRef]
- Jakubek, M.; Kejík, Z.; Parchaňský, V.; Kaplánek, R.; Vasina, L.; Martásek, P.; Král, V. Water soluble chromone Schiff base derivatives as fluorescence receptor for aluminium(III). Supramol. Chem. 2017, 29, 1–7. [Google Scholar] [CrossRef]
- Abramenko, N.; Kejík, Z.; Kaplánek, R.; Tatar, A.; Brogyányi, T.; Pajková, M.; Sýkora, D.; Veselá, K.; Antonyová, V.; Dytrych, P.; et al. Spectroscopic study of in situ-formed metallocomplexes of proton pump inhibitors in water. Chem. Biol. Drug Des. 2021, 97, 305–314. [Google Scholar] [CrossRef] [PubMed]
- Jakubek, M.; Kejik, Z.; Kaplanek, R.; Antonyova, V.; Hromadka, R.; Sandrikova, V.; Sykora, D.; Martasek, P.; Kral, V. Hydrazones as novel epigenetic modulators: Correlation between TET 1 protein inhibition activity and their iron(II) binding ability. Bioorg. Chem. 2019, 88, 102809. [Google Scholar] [CrossRef] [PubMed]
- Antonyova, V.; Kejik, Z.; Brogyanyi, T.; Kaplanek, R.; Vesela, K.; Abramenko, N.; Ocelka, T.; Masarik, M.; Matkowski, A.; Gburek, J.; et al. Non-psychotropic cannabinoids as inhibitors of TET1 protein. Bioorg. Chem. 2022, 124, 105793. [Google Scholar] [CrossRef] [PubMed]
- Antonyova, V.; Tatar, A.; Brogyanyi, T.; Kejik, Z.; Kaplanek, R.; Vellieux, F.; Abramenko, N.; Sinica, A.; Hajduch, J.; Novotny, P.; et al. Targeting of the Mitochondrial TET1 Protein by Pyrrolo 3,2-b pyrrole Chelators. Int. J. Mol. Sci. 2022, 23, 25. [Google Scholar] [CrossRef]
- Brogyanyi, T.; Kaplanek, R.; Kejik, Z.; Hosnedlova, B.; Antonyova, V.; Abramenko, N.; Vesela, K.; Martasek, P.; Vokurka, M.; Richardson, D.; et al. Azulene hydrazide-hydrazones for selective targeting of pancreatic cancer cells. Biomed. Pharmacother. 2022, 155, 12. [Google Scholar] [CrossRef]
- Brandão, P.; Pineiro, M.; Burke, A. Tryptanthrin and Its Derivatives in Drug Discovery: Synthetic Insights. Synthesis 2022, 54, 4235–4245. [Google Scholar] [CrossRef]
- Jao, C.-W.; Lin, W.-C.; Wu, Y.-T.; Wu, P.-L. Isolation, Structure Elucidation, and Synthesis of Cytotoxic Tryptanthrin Analogues from Phaius mishmensis. J. Nat. Prod. 2008, 71, 1275–1279. [Google Scholar] [CrossRef]
- Russell, R.; Beard, J.L.; Cousins, R.J.; Dunn, J.T.; Ferland, G.; Hambidge, K.; Lynch, S.; Penland, J.G.; Ross, A.C.; Stoecker, B.J.; et al. Dietary Reference Intakes for Vitamin A, Vitamin K, Arsenic, Boron, Chromium, Copper, Iodine, Iron, Manganese, Molybdenum, Nickel, Silicon, Vanadium, and Zinc; National Academies Press: Washington, DC, USA, 2001. [Google Scholar]
- Morelli, B.; Peluso, P. Spectral Investigation on Ruthenium(III)-allyl Thiourea System. Anal. Lett. 1986, 19, 503–528. [Google Scholar] [CrossRef]
- Gambino, D.; Kremer, E.; Baran, E. Infrared spectra of new Re(III) complexes with thiourea derivatives. Spectrochim. Acta Part A Mol. Biomol. Spectrosc. 2003, 58, 3085–3092. [Google Scholar] [CrossRef]
- Trott, O.; Olson, A.J. AutoDock Vina: Improving the speed and accuracy of docking with a new scoring function, efficient optimization, and multithreading. J. Comput. Chem. 2010, 31, 455–461. [Google Scholar] [CrossRef] [PubMed]
- BIOVIA. BIOVIA Discovery Studio Modeling Environment; BIOVIA: San Diego, CA, USA, 2017. [Google Scholar]
- Pettersen, E.F.; Goddard, T.D.; Huang, C.C.; Couch, G.S.; Greenblatt, D.M.; Meng, E.C.; Ferrin, T.E. UCSF Chimera—A visualization system for exploratory research and analysis. J. Comput. Chem. 2004, 25, 1605–1612. [Google Scholar] [CrossRef] [PubMed]
- Lipinski, C.A.; Lombardo, F.; Dominy, B.W.; Feeney, P.J. Experimental and computational approaches to estimate solubility and permeability in drug discovery and development settings1PII of original article: S0169-409X(96)00423-1. The article was originally published in Advanced Drug Delivery Reviews 23 (1997) 3–25.1. Adv. Drug Deliv. Rev. 2001, 46, 3–26. [Google Scholar] [CrossRef] [PubMed]
- Sander, T. The OSIRIS Property Explorer; Idorsia Pharmaceuticals Ltd.: Allschwil, Switzerland, 2001. [Google Scholar]


Disclaimer/Publisher’s Note: The statements, opinions and data contained in all publications are solely those of the individual author(s) and contributor(s) and not of MDPI and/or the editor(s). MDPI and/or the editor(s) disclaim responsibility for any injury to people or property resulting from any ideas, methods, instructions or products referred to in the content. |
© 2023 by the authors. Licensee MDPI, Basel, Switzerland. This article is an open access article distributed under the terms and conditions of the Creative Commons Attribution (CC BY) license (https://creativecommons.org/licenses/by/4.0/).