Article

Rapid Determination of Five Residual Solvents in Ursodeoxycholic Acid Raw Materials

1
College of Chemical Engineering, Shijiazhuang University, Shijiazhuang 050035, China
2
Office of Research, Shijiazhuang University, Shijiazhuang 050035, China
*
Authors to whom correspondence should be addressed.
Separations 2023, 10(11), 573; https://doi.org/10.3390/separations10110573
Submission received: 20 October 2023 / Revised: 10 November 2023 / Accepted: 15 November 2023 / Published: 17 November 2023

Abstract

:
The chromatographic conditions were optimized using headspace gas chromatography, and a simple and rapid method was established for the simultaneous determination of five residual solvents in ursodeoxycholic acid raw materials. The corresponding quality standards were revised. The research results demonstrate that by utilizing a capillary column with a stationary phase consisting of 5% phenyl-95% dimethylpolysiloxane (HP-5, 30 m × 0.32 mm, film thickness 1.0 µm) and a flame ionization detector in conjunction with a headspace injection system and a programmed temperature ramping method, satisfactory analytical results can be achieved. The specific operating conditions are as follows: an initial column temperature of 45 °C, followed by a column temperature increase at a rate of 5 °C per minute up to 60 °C, then a further increase at a rate of 10 °C per minute up to 100 °C, and finally a rapid increase at a rate of 40 °C per minute up to 200 °C, where it is held for 10 min. Nitrogen is employed as the carrier gas at a flow rate of 1 mL/min with a split ratio of 14:1. The headspace vial temperature is maintained at 100 °C, with a sample equilibration time of 45 min. The concentration of methanol ranged from 0.06 mg/mL to 0.3 mg/mL, and the concentrations of acetone, tert-butanol, ethyl acetate, and triethylamine showed a good linear relationship with the peak area within the range of 0.1 mg/mL to 0.5 mg/mL (r = 0.999); The quantitation limits for methanol, acetone, tert-butanol, ethyl acetate, and triethylamine were 4.2, 0.9, 1.5, 1, and 0.1 μg/mL, respectively, with detection limits of 1.2, 0.25, 0.025, 0.3, and 0.025 μg/mL, respectively. The recovery rates of each solvent ranged from 92.9% to 106.0%, with RSD% (n = 9) less than 3.8%; the method exhibited good repeatability, with RSD% (n = 6) less than 2.5%. Furthermore, the robustness is good. The established method is simple, accurate, specific, and highly sensitive, and can be used for the simultaneous and rapid determination of five residual solvents in ursodeoxycholic acid raw materials.

1. Introduction

Ursodeoxycholic acid (UDCA) is a hydrophilic bile acid extracted from the precious traditional Chinese medicine material—bear bile. This compound has been widely used to treat various liver and gallbladder diseases, and has shown significant therapeutic effects in clinical practice. The main therapeutic mechanism involves accelerating the generation of lipophilic bile acids, such as chenodeoxycholic acid, which are toxic to the liver, reducing their reabsorption and thereby reducing their damage to liver cells [1,2,3,4]. UDCA has the characteristics of non-toxicity and hydrophilicity, so it can competitively prevent the absorption of harmful bile acid in the ileum and replace it to reduce the damage of bile acid to liver cells. Ursodeoxycholic acid was first discovered as a gallstone-dissolving drug in 1920, and its molecular structure was determined in 1937. It began to be used in clinical trials in 1957, and has been widely included in the pharmacopoeias of various countries [5,6,7].
The methods for preparing ursodeoxycholic acid include the traditional bile drainage method [8,9], chemical synthesis method [10,11,12], and biosynthesis method [13,14,15]. The chemical synthesis method is widely used in industrial production because of its simple operation and low reagent cost. In the synthesis process, it is usually necessary to use some organic solvents, such as methanol, acetone, ethyl acetate, etc. [16,17]. However, organic solvents are difficult to completely remove in synthesis reactions. if their residual amount exceeds a certain safety standard, it may be harmful to human health.
Currently, the prevailing methods for the determination of organic solvent residues in both domestic and international standards and literature primarily involve gas chromatography (GC) and headspace gas chromatography (HS-GC). The utilization of HS-GC allows for direct sample introduction into the headspace vial. Subsequently, upon sealing and heating, volatile components are released from the sample matrix and equilibrate between the gas and liquid (or gas and solid) phases, enabling the direct extraction of the headspace gas for chromatographic analysis. This approach effectively eliminates the need for extensive and cumbersome sample pre-treatment, mitigates interference from organic solvents, and reduces the contamination of the chromatographic column and injection port. Although Li Ji [18] determined three residual organic solvents in ursodeoxycholic acid, the quantity of residual solutes detected was relatively few. A simple methodological description was provided, which was lacking an accurate method for robustness data.
According to the preparation process of ursodeoxycholic acid raw material and the requirements of ICHQ3C [19], the solvent residue inspection items of ursodeoxycholic acid raw material in the standard was revised. According to the technical guidelines for the study of residual solvents in chemical drugs [20], a HS-GC method for the simultaneous and rapid analysis of five organic solvent residues was established in China for the first time, and comprehensive methodological research was conducted. This will provide new data support to ensure the quality of raw materials, while also providing reliable raw material guarantee for the subsequent preparation of new formulations. This is crucial for ensuring the quality and safety of drugs.

2. Materials and Methods

2.1. Materials

Analytical-grade reagents such as dimethyl sulfoxide, methanol, acetone, tert-butanol, ethyl acetate, and triethylamine were purchased from Shanghai Maclean Biochemical Technology Co. (Shanghai, China) Deionized water was used throughout. Ursodeoxycholic acid APIs were purchased from Nykom Pharmaceuticals Co. (Shanghai, China).

2.2. Apparatus and Operations

The quantitative HS-GC analysis was performed on an auto-headspace sampler (Agilent GC 7697A, (Agilent Technology Co., Ltd., Beijing, China) connected to a GC system (Agilent GC 7890B, Santa Clara, CA, USA) equipped with a hydrogen flame ionization detector (FID) and a HP-5 capillary column (30 m × 0.32 mm × 1.0 μm, Agilent, Santa Clara, CA, USA). A linear temperature program was used, initially from 45 °C and increased to 60 °C at a rate of 5 °C per minute, then ramped up to 100 °C at a rate of 10 °C per minute; finally, it was raised to 200 °C for 10 min at a rate of 40 °C per minute. At a flow rate of 1.0 mL/min, nitrogen was used as the carrier, and the split ratio was 10:1. The GC injector temperature was 200 °C, and FID was operated at 220 °C. Conditions in headspace sampler: vial temperature = 100 °C; vial equilibration time = 45 min; loop temperature = 110 °C; transfer line temperature = 115 °C; and pressurization pressure = 0.10 MPa.

2.3. Measurement Procedures

In this work, the HS-GC measurement is conducted with automated instrumental systems in which reaction (thermostatting) time and temperature can be accurately controlled. A total of 1.0 mL of sample sheet was immediately placed into a headspace vial and sealed. The headspace vial was placed in the auto-sampler oven at 100 °C for 45 min for the phase equilibration, followed measuring the signals (peak areas) of methanol, acetone, tert-butanol, ethyl acetate, and triethylamine released to vapor phase by HS-GC technique.

2.4. Preparation of Reference Solution and Sample Solution

2.4.1. Preparation of Residual Solvent Localization Solution

A total of 15 mg of methanol, 12.5 mg of acetone, tert-butanol, ethyl acetate, and triethylamine were accurately weighed and placed in a 50 mL volumetric flask. The solution was diluted with dimethyl sulfoxide to the mark, shaken well, and used as the localization solution for each residual solvent.

2.4.2. Preparation of Reference Solution

A total of 30 mg of methanol, 50 mg of acetone, 50 mg of tert-butanol, 50 mg of ethyl acetate, and 50 mg of triethylamine were accurately weighed and placed into a 10 mL volumetric flask. The solution was diluted with dimethyl sulfoxide to the mark, shaken well, and used as a reference stock solution. A total of 1 mL of the reference stock solution was measured into a 10 mL volumetric flask, diluted with dimethyl sulfoxide to the mark, shaken well, and used as the reference solution.

2.4.3. Preparation of Sample Solution

TA total of 1 g of this product was taken, accurately weighed, and 10 mL of dimethyl sulfoxide were added to dissolve in it to make the sample solution.

2.5. Method Validation

Following the ICH-Q2-R1 recommendations, the proposed HS-GC approach for the simultaneous assessment of methanol, acetone, tert-butanol, ethyl acetate, and triethylamine was validated for repeatability, linearity range, detection limits (LOD) and quantification limits (LOQ), accuracy, and robustness.
The repeatability of the present method was investigated through triplicate tests on six different samples. The linearity range for methanol, acetone, tert-butanol, ethyl acetate, and triethylamine were assessed by plotting the concentrations of methanol, acetone, tert-butanol, ethyl acetate, and triethylamine against measured HS-GC response. The linearity for methanol, acetone, tert-butanol, ethyl acetate, and triethylamine were assessed using six different concentrations for both of the compounds in triplicate (n = 3). Using a multiple dilution method, the sensitivity of the proposed HS-GC approach for the simultaneous assessment of methanol, acetone, tert-butanol, ethyl acetate, and triethylamine was evaluated in terms of “LOD and LOQ”.
The accuracy of the proposed HS-GC approach for the simultaneous determination of methanol, acetone, tert-butanol, ethyl acetate, and triethylamine was determined through the percent recovery. For every residue solvent, the accuracy was tested using low-quantity control (LQC), middle-quantity control (MQC), and high-quantity control (HQC) samples. The accuracy was determined in standard compounds. The percent recovery was calculated for each residue solvent quality level (n = 3). The robustness for the proposed HS-GC approach for the simultaneous determination of methanol, acetone, tert-butanol, ethyl acetate, and triethylamine was determined by the slight changes in the flow rates of carrier gas and column temperature.

3. Results and Discussion

3.1. Optimization of Chromatographic Conditions

3.1.1. The Effect of Equilibrium Temperature

Different equilibrium temperatures have a significant impact on the detection of impurities in the test sample. Therefore, it is necessary to determine the optimal equilibrium temperature for the detection of this product. The test sample solution is measured at three equilibrium temperatures of 60 °C, 80 °C, and 100 °C, and the chromatogram is recorded. The separation and detection of each impurity are shown in Table 1.
The results reveal that the test outcomes at different sample equilibrium temperatures comply with system suitability requirements, displaying no significant variance in retention times. As the headspace equilibrium temperature rises, there is a pronounced increase in the peak areas of the target compounds, including acetone, tert-butanol, and triethylamine. When the equilibrium temperature reaches 100 °C, peak symmetry, separation, and column efficiency improve, offering enhanced advantages for product separation. However, considering the potential risks associated with further temperature elevation, such as headspace vial leakage and rupture, as well as the introduction of impurities and moisture that may interfere with the accurate determination of target substances within the chromatographic column, a headspace equilibrium temperature of 100 °C is ultimately selected.

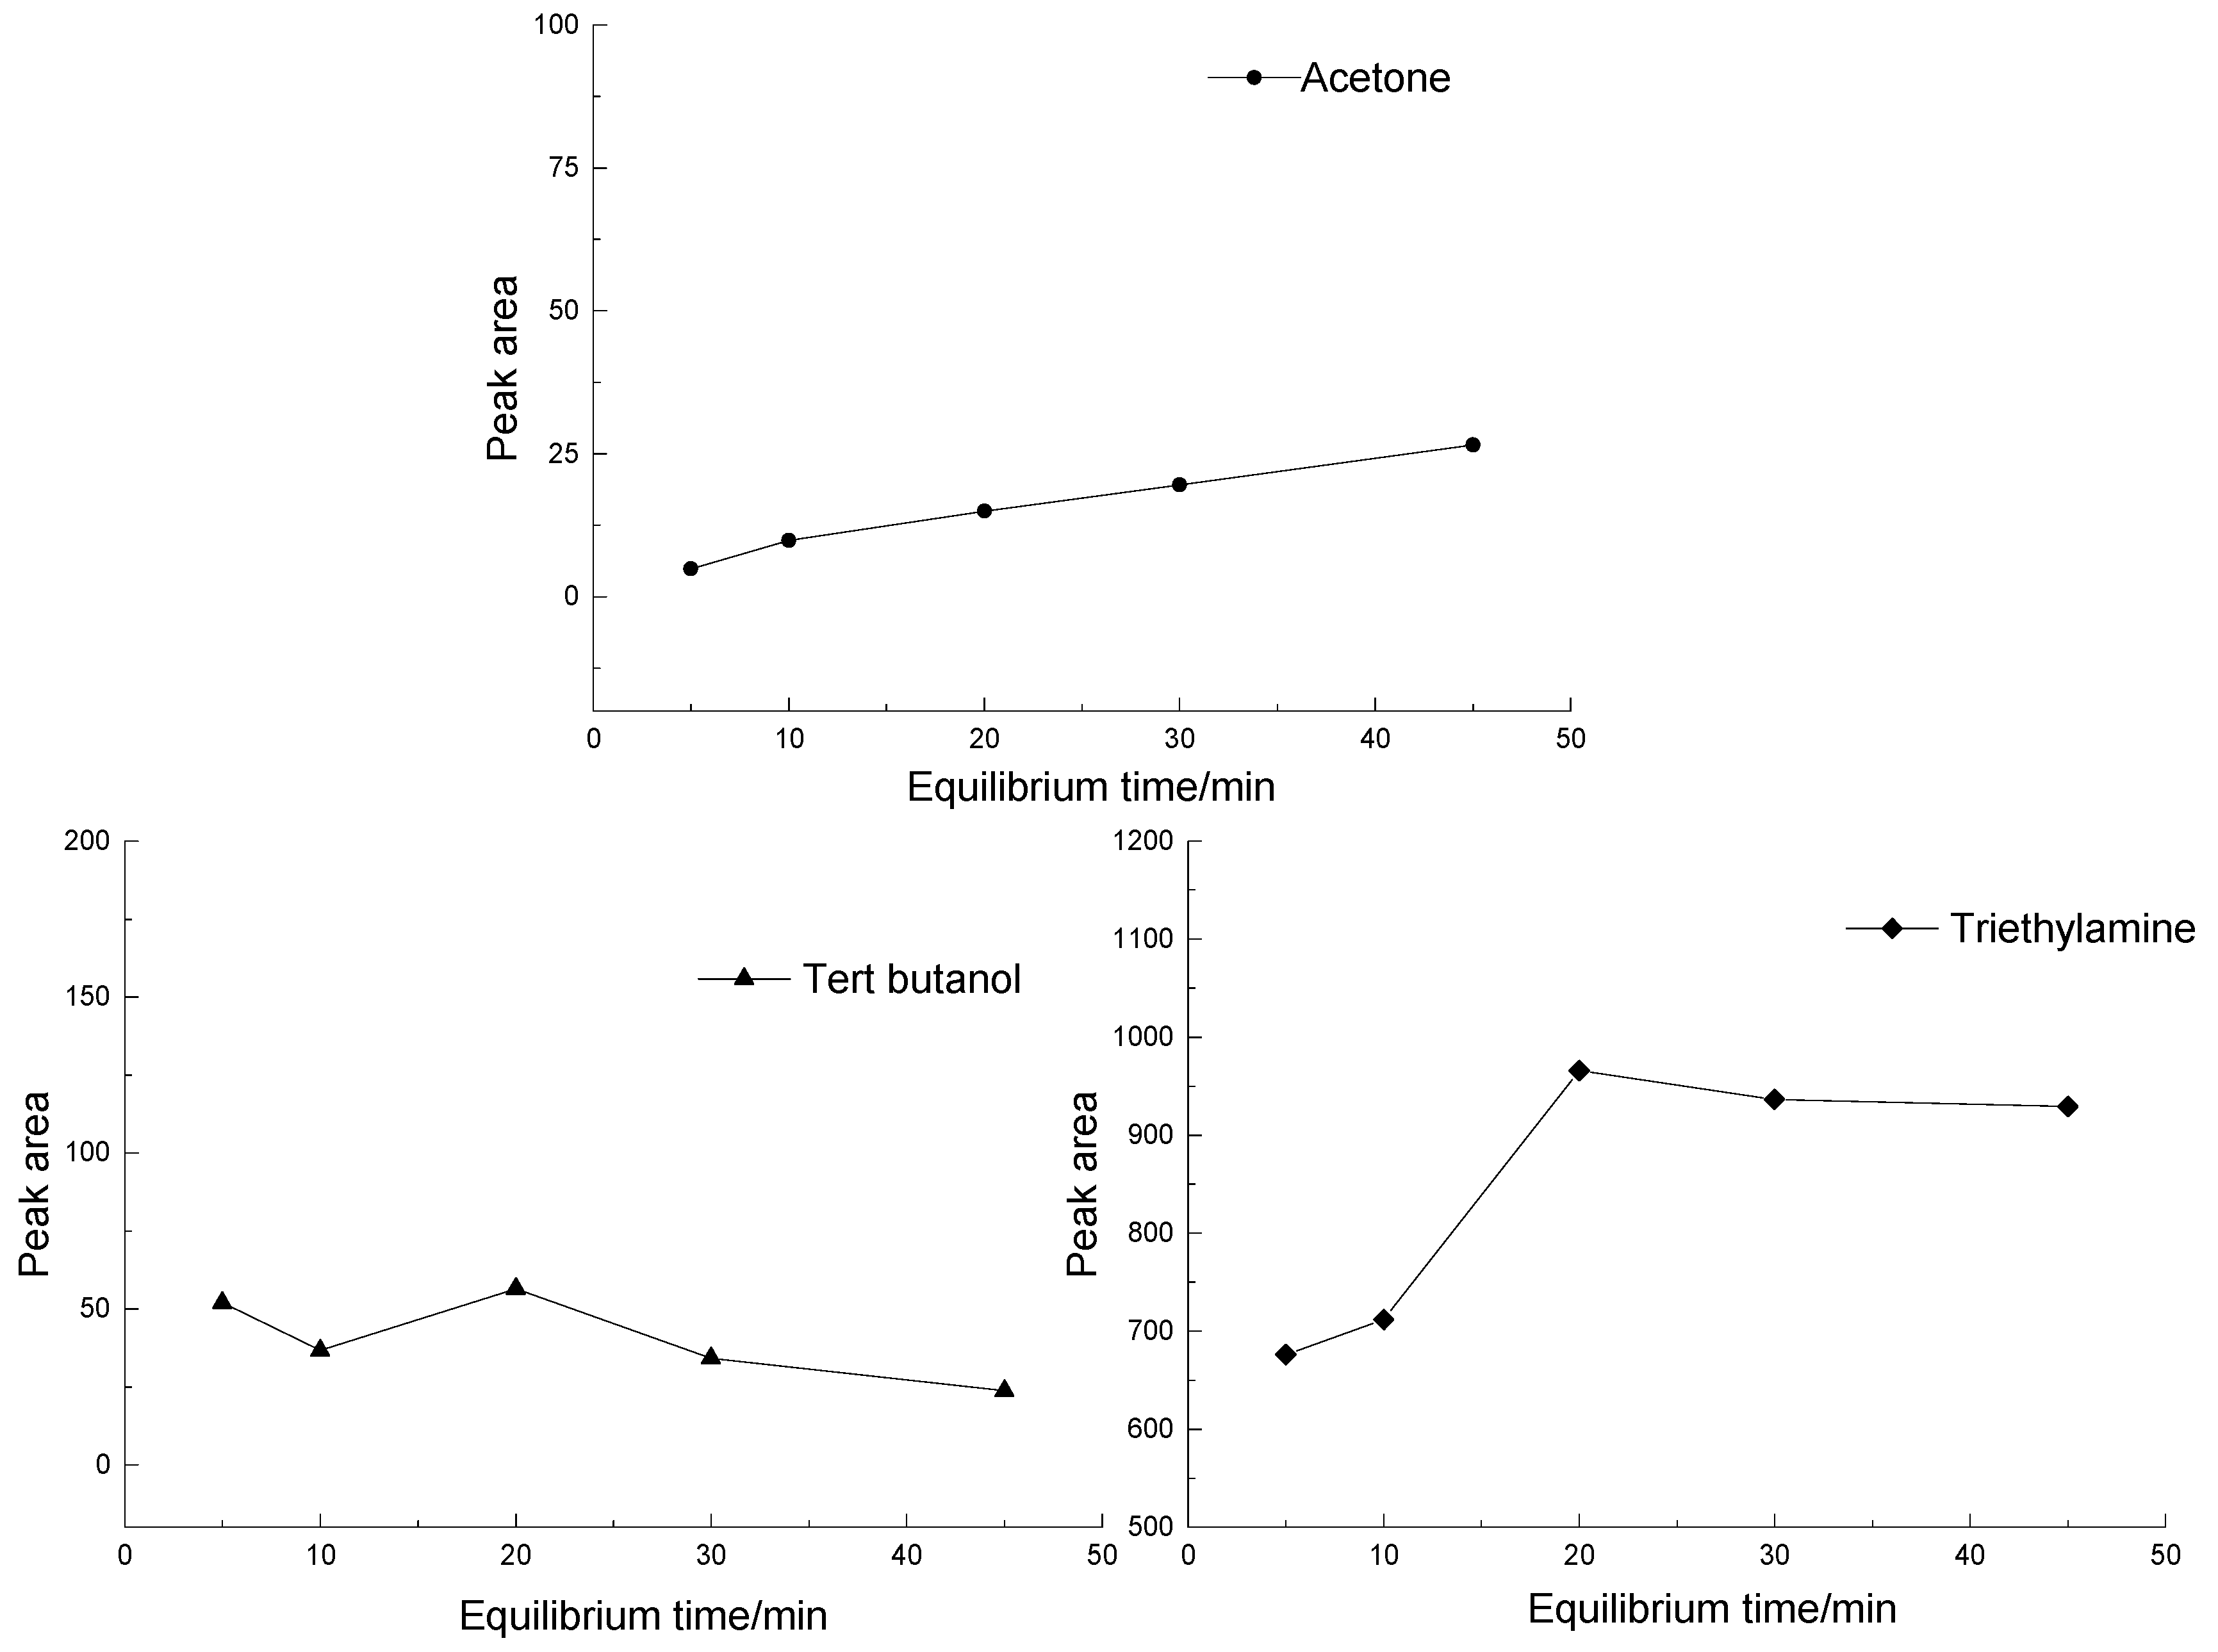
3.1.2. The Effect of Equilibrium Time

Different equilibrium times have a significant impact on the detection of impurities in the test sample. Therefore, it was necessary to determine the optimal equilibrium time conditions for the detection of this product. The test sample solution was taken and measured under five equilibrium time conditions of 5 min, 10 min, 20 min, 30 min, and 45 min. The impact on the peak areas of residual solvents was investigated and the chromatogram was recorded. The separation and detection of each impurity are shown in Figure 1.
The results indicate that the test results of different equilibrium times meet the system suitability requirements, and there is no significant difference in retention time. With the extension of headspace equilibration time, the peak area of acetone and triethylamine increases progressively, reaching its maximum when the equilibration time reaches 45 min. For tert-butanol, the peak area also shows a slight increase with longer equilibration time. However, the change is not very significant. Under the condition of a 45-min equilibration time, the separation factors for acetone, tert-butanol, and triethylamine are 6.036, 2.326, and 23.145, respectively. The theoretical plate numbers are 11,794, 15,745, and 127,108, while the tailing factors are 0.989, 1.027, and 1.701, respectively. Peak symmetry, separation, and column efficiency are all superior to the results obtained under other conditions, further enhancing product separation.

3.2. Method Validation

To confirm the suitability of the method for its intended purpose, the method was validated in accordance with the ICH guidelines for system suitability and specificity.

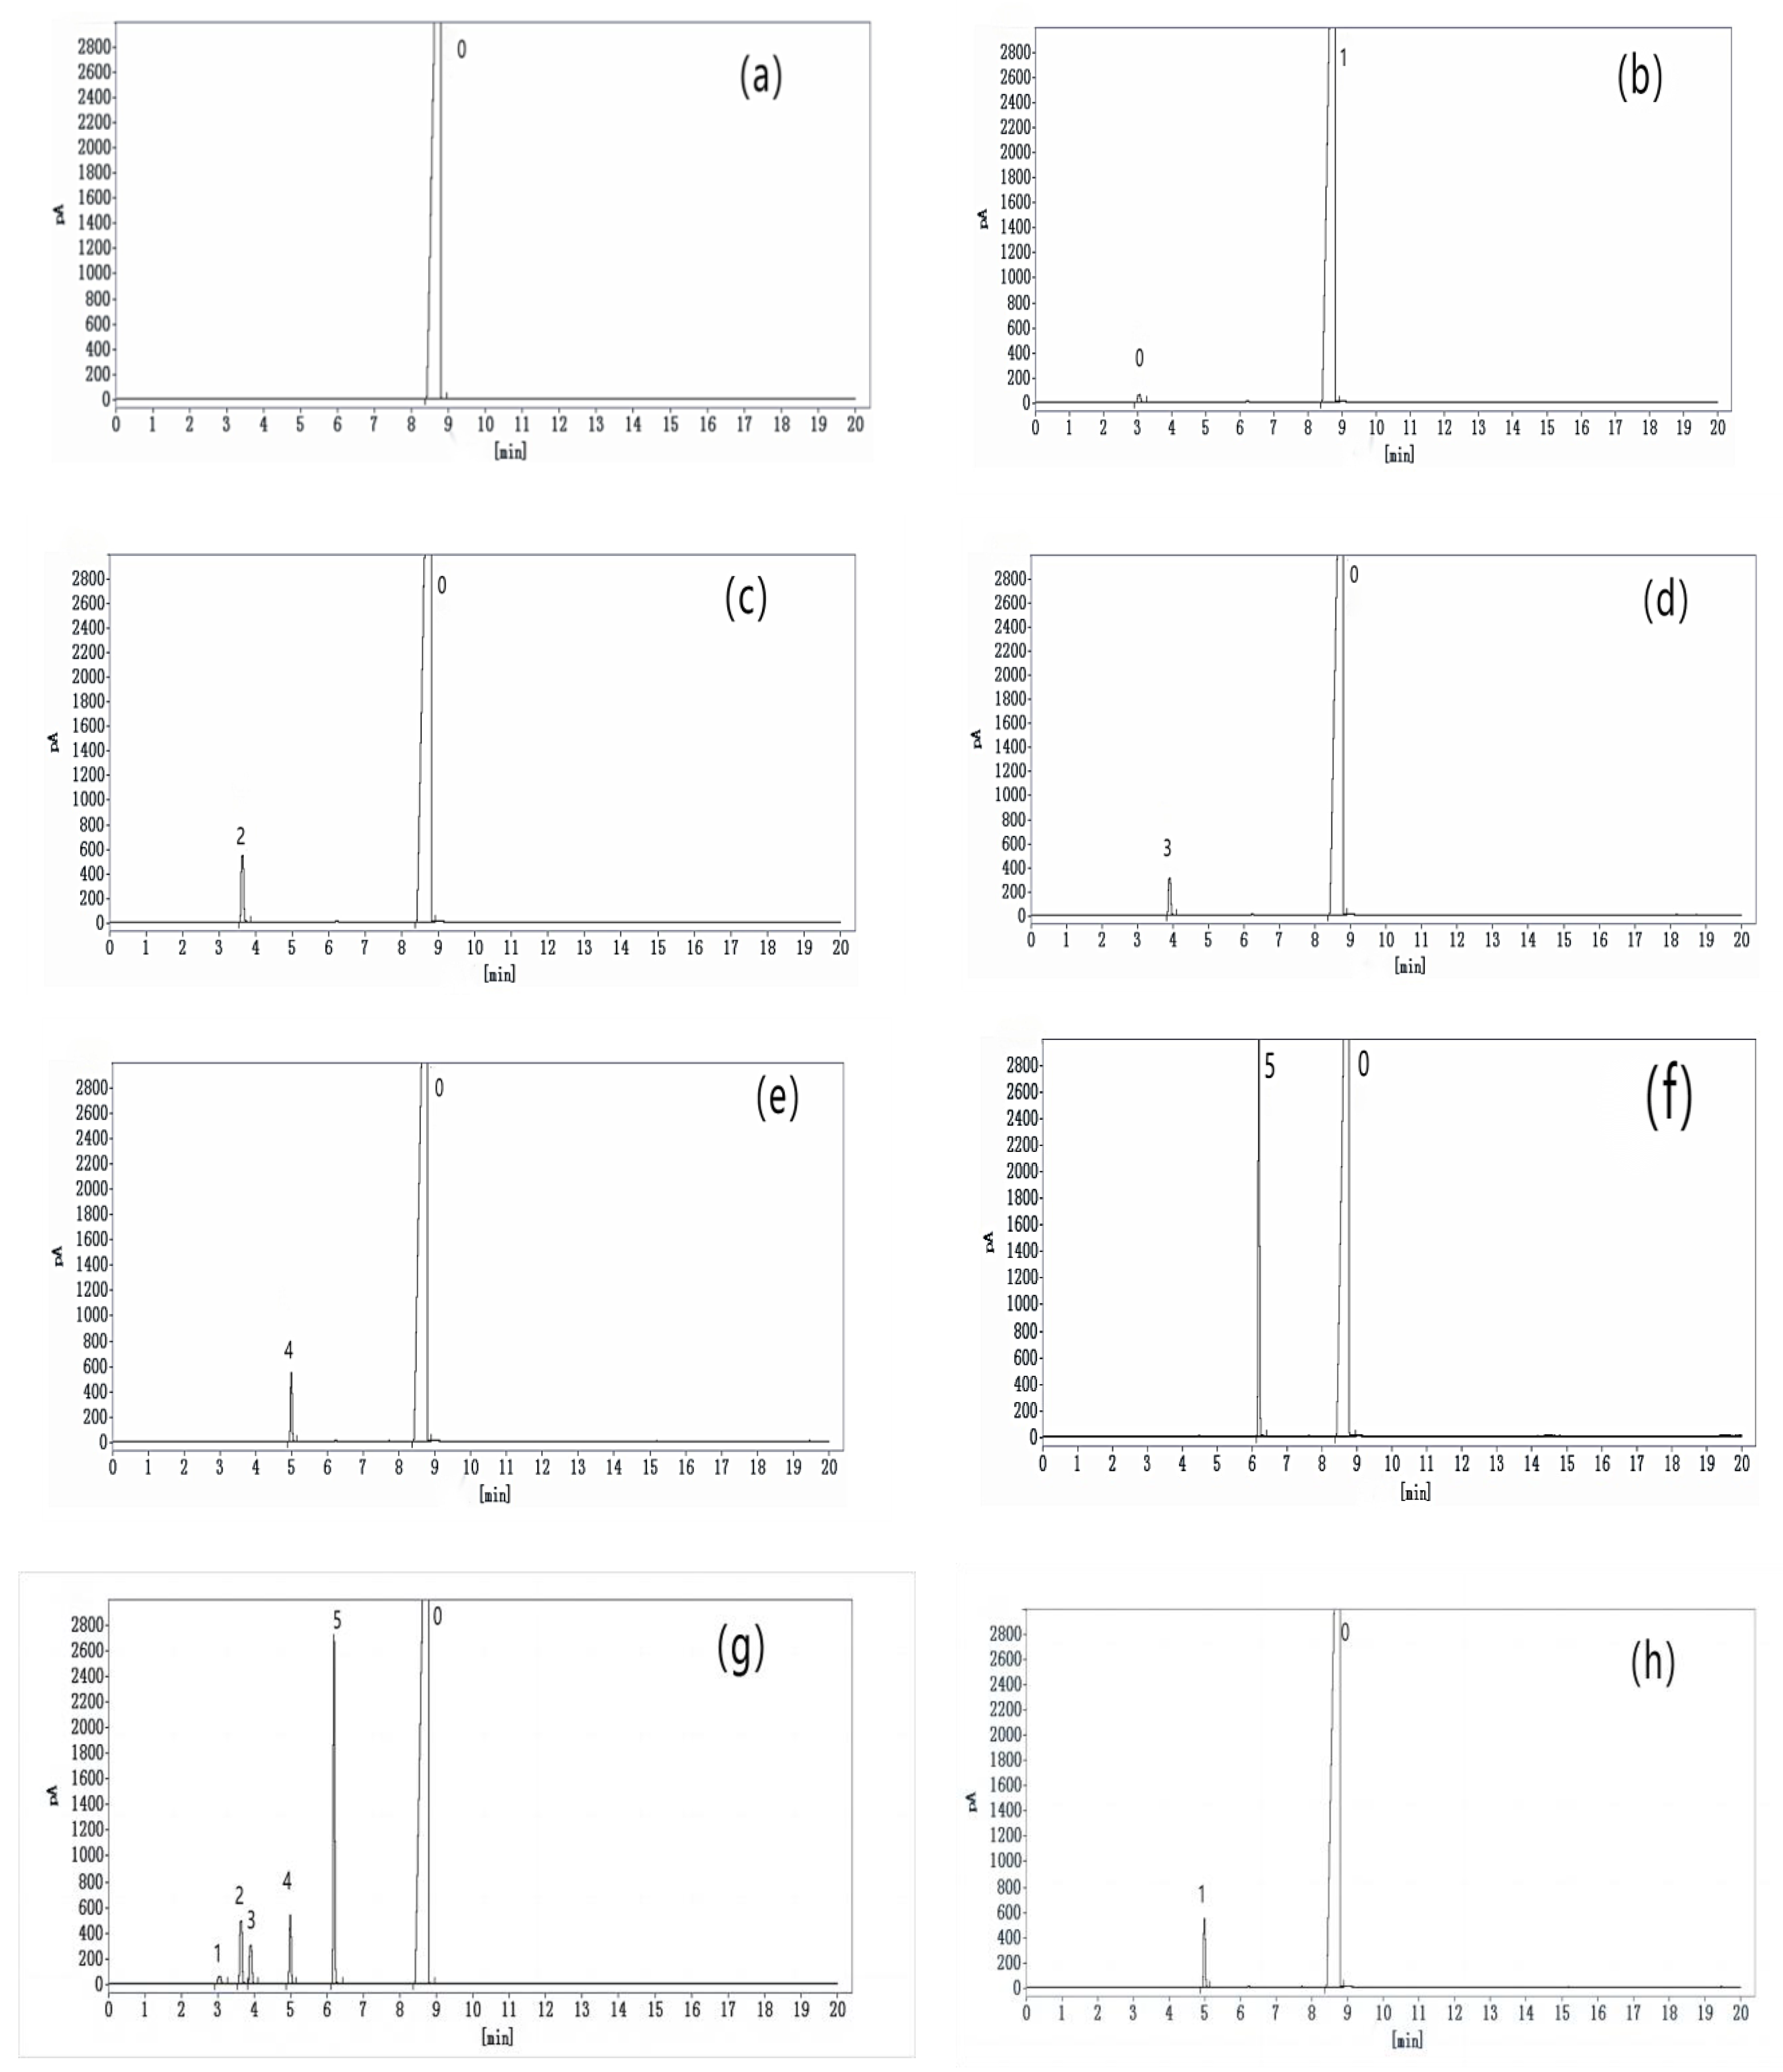
3.2.1. System Suitability

The system suitability test was an integral part of the method development and was used to ensure the adequate performance of the chromatographic system. A total of 1 mL of the localization solution for each residual solvent, the reference solution and sample solution, was taken. Then, it was injected into the gas chromatograph through headspace injection. The chromatogram was recorded. The Resolution (R) and number of theoretical plates (N) were evaluated for six replicate injections of the drug.
The results in Figure 2 show that the largest peak with a retention time of 8.769 min is dimethyl sulfoxide in Figure 2a–f. The retention time of methanol is 3.054 min in Figure 2b,g. The retention time of acetone is 3.641 min in Figure 2c,g. The retention time of tert-butanol is 3.908 min in Figure 2d,g. The retention time of ethyl acetate is 4.991 min in Figure 2e,g, The retention time of triethylamine is 6.192 min in Figure 2f,g. The resolution between the impurity peaks of methanol, acetone, tert-butanol, ethyl acetate, and triethylamine, as well as between impurities and dimethyl sulfoxide solvent, is greater than 2.0. The column efficiency of methanol is greater than 5000, and the column efficiency of other components is greater than 10,000, indicating good column efficiency and optimum mobile phase composition.

3.2.2. Repeatability Test

The repeatability was calculated from six replicate injections of freshly prepared solution, using the same equipment on the same day.
Based on six repeated injections, the result showed that the average peak area of methanol is 316.8, with an RSD of 2.38%; acetone has an average peak area of 2328.9, with an RSD of 1.39%; tert-butanol has an average peak area of 1460.6, with an RSD of 2.29%; ethyl acetate has an average peak area of 1868.6, with an RSD of 1.49%; and triethylamine has an average peak area of 7183.2, with an RSD of 2.24%. The RSD of peak areas for all impurities is less than 10%, indicating that the method was precise.

3.2.3. Linearity

The linearity range for five residue solvents was assessed by plotting the concentrations of them against measured HS-GC response. Methanol, acetone, tert-butanol, ethyl acetate, and triethylamine stock solutions were prepared separately by dissolving the prescribed amounts of methanol, acetone, tert-butanol, ethyl acetate, and triethylamine in the requisite volume of dimethyl sulfoxide to provide a final solution of 3 mg/mL for methanol and 5 mg/mL for other compounds. After that, serial dilutions of this solution were created by diluting with dimethyl sulfoxide with different volumes of methanol, acetone, tert-butanol, ethyl acetate, or triethylamine solution to obtain different concentrations range for both substances.
The linearity for methanol was assessed using six different concentrations, including 0.06, 0.09, 0.12, 0.18, 0.24, and 0.3 mg/g (range 0.06–0.3 mg/mL). The linearity of the other four residue solvents was assessed using six different concentrations, including 0.1, 0.15, 0.2, 0.3, 0.4, and 0.5 mg/g (range 0.1–0.5 mg/mL) for both of the compounds in triplicate (n = 3).
Approximately 1 mL of each concentration of methanol, acetone, tert-butanol, ethyl acetate, and triethylamine was injected into the HS-GC system, and HS-GC response for each concentration of methanol, acetone, tert-butanol, ethyl acetate, and triethylamine was recorded. The calibration curve for methanol, acetone, tert-butanol, ethyl acetate, and triethylamine was constructed by plotting the concentrations of each compound against measured HS-GC response.
The results of the linear regression analysis in Table 2 revealed a strong linear association between residue solvent concentrations and the measured HS-GC responses. For five residue solvents, the regression equations obtained were Y = 981.35X + 10.04, Y = 4517.4X + 78.569, Y = 2756.5X + 45.711, Y = 3507.5X + 56.446, and Y = 14349X + 252.25, respectively, where Y is the peak area and X is the concentration of residue solvent (mg/mL). In addition, the values of regression coefficient (R) were calculated to be 0.9993, 0.9991, 0.9990, 0.9990, and 0.9990, respectively. Good linearity was evidenced by the high value of the correlation coefficient and the low intercept value. These findings showed that the suggested HS-GC approach was suitable for the simultaneous detection of residue solvents in ursodeoxycholic acid raw materials.

3.2.4. LOD and LOQ

LOD was defined as a signal-to-noise ratio of 3:1. LOQ was defined as a signal-to-noise ratio of 10:1. Therefore, the peaks heights were evaluated for this validation parameter. The LOD values of five residue solvents were 1.2 μg/mL, 0.25 μg/mL, 0.025 μg/mL, 0.3 μg/mL, and 0.025 μg/mL, respectively. On the other hand, The LOQ values of five residue solvents were calculated as 4.2 μg/mL, 0.9 μg/mL, 1.5 μg/mL, 1.0 μg/mL, and 0.1 μg/mL, respectively. These findings demonstrated the sensitivity of the proposed HS-GC approach for the simultaneous measurement of five residue solvents in ursodeoxycholic acid raw materials.

3.2.5. Accuracy

The accuracy of the proposed HS-GC approach for the simultaneous determination of five residue solvents was determined through the percent recovery. For methanol, the accuracy was tested using LQC (0.18 mg/mL), MQC (0.24 mg/mL), and HQC (0.3 mg/mL) samples. For the other four residue solvents, the accuracy was tested using LQC (0.3 µg/g), MQC (0.4 µg/g), and HQC (0.5 µg/g) samples. The accuracy was determined in standard compounds. The percent recovery was calculated for each solvent quality level (n = 3) shown in Table 3.
The results showed that the average recovery rate of methanol was 100.6% and the RSD of nine test results was 3.45%; the average recovery rate of acetone was 98.2% and the RSD was 2.60%; the average recovery rate of tert-butanol was 106.0% and the RSD was 3.28%; the average recovery rate of ethyl acetate was 98.8% and the RSD was 2.72%; and the average recovery rate of triethylamine was 92.9% and the RSD was 3.80%. The recovery rate measurement results indicate that the method has good accuracy and the relative deviation meets the requirements.

3.2.6. Robustness

When the flow rates of the carrier gas were 0.9 mL/min, 1.0 mL/min, and 1.1 mL/min, respectively, the impact of the slight changes in flow rate of the carrier gas on the test results was investigated. When the sample equilibrium temperature changes to 90 °C, the impact was investigated.
In Table 4, the results show that acetone, tert-butanol, and triethylamine were detected in the test sample. the concentration of acetone changes from 0.2068 mg/mL to 0.1999 mg/mL, the concentration of acetone changes from 0.2068 mg/mL to 0.1999 mg/mL, and the concentration of acetone changes from 0.2068 mg/mL to 0.1999 mg/mL at the sample equilibrium temperature of 100 °C. The slight change in flow rate and sample equilibrium temperature had no effect on the determination of the test sample. The method had good robustness.

3.3. Simultaneous Determination of Ursodeoxycholic Acid Samples

Four batches of test samples were taken, and triplicate injections were performed under optimized chromatographic conditions to determine solvent residues. The average content was calculated. The results are presented in Table 5.
The results indicate that methanol and ethyl acetate were not detected in the four batches of tested samples. The percentage content of acetone is 0.1803–0.1937%. The percentage content of tert-butanol is 0.0072–0.0077%. The percentage content of triethylamine is 0.0034–0.0077%. The difference between batches is not very obvious. Acetone was found to be present at a concentration of 0.1893%, tert-butanol at 0.0075%, and triethylamine at 0.0053%, all of which are in compliance with the specified standards.

4. Conclusions

Through the development and validation of the established method, we have successfully created a headspace gas chromatographic method for the simultaneous and rapid determination of five residual organic solvents in ursodeoxycholic acid raw material. Using a capillary column with a stationary phase of 5% phenyl-95% methylpolysiloxane (HP-5, 30 m × 0.32 mm, 1.0 µm film thickness) in combination with FID and a headspace injection system with a programmed temperature ramp, satisfactory analytical results were obtained. Under the optimized conditions, the recoveries of various solvents ranged from 92.9% to 106.0%, with an RSD% of less than 3.8% (n = 9). The method exhibited good repeatability and robustness, with an RSD% of less than 2.5% (n = 6). It enables the accurate and rapid analysis of ursodeoxycholic acid raw material. In batch samples, methanol and ethyl acetate were not detected, acetone had a content of 0.1893%, tert-butanol had a content of 0.0075%, and triethylamine had a content of 0.0053%, all of which met the specified standards.
This method utilizes an HP-5 capillary column, which provides excellent separation for polar compounds like methanol and acetone, as well as slightly basic compounds akin to triethylamine. The employment of headspace injection analysis effectively circumvents the complexities associated with direct gas chromatographic injection, addressing analytical drawbacks. The method demonstrates precision and sensitivity that meet the requirements for laboratory analysis and testing.
This method enables reliable quantitative analysis of the five target solvent residues in ursodeoxycholic acid raw material. Through this approach, we can effectively control and monitor the quality of ursodeoxycholic acid raw material, providing a dependable means to establish its quality standards. The method developed in this study possesses distinct specificity and practical value. Its simplicity and high accuracy make it suitable for quality control in industrial production and analytical work in pharmaceutical inspection laboratories. The research results offer reliable data support for solvent residue determination in ursodeoxycholic acid and ensure the quality and safety of the products.

Author Contributions

Conceptualization, supervision—R.Z. and F.W.; methodology—R.Z., F.W., and S.L.; validation—R.Z., Y.S. and X.G.; data curation—F.W.; funding acquisition—J.H. and S.L.; project administration—J.H.; writing, original draft—R.Z.; writing, review and editing—R.Z., F.W. and S.L. All authors have read and agreed to the published version of the manuscript.

Funding

This research was funded by the Research Project on Human Resources and Social Security in Hebei Province (JRSHZ-2023-02316) and Shijiazhuang University Teaching Reform Research and Practice Project (International Construction Project, GJZX-2023009).

Data Availability Statement

Data are contained within the article.

Acknowledgments

The authors are thankful to the Research Project on Human Resources and Social Security in Hebei Province (JRSHZ-2023-02316), Shijiazhuang University Teaching Reform Research and Practice Project (International Construction Project, GJZX-2023009), and Shijiazhuang University College Student Innovation and Entrepreneurship Training Program Project (scxm073) which made this study possible.

Conflicts of Interest

The authors declare no conflict of interest. The funders had no role in the design of the study; in the collection, analyses, or interpretation of data; in the writing of the manuscript; or in the decision to publish the results.

References

  1. Gu, H.Z. The clinical application of ursodeoxycholic acid. Inn. Mong. Tradit. Chin. Med. 2012, 2, 52–53. [Google Scholar]
  2. Qi, Z.; Xu, M.L.; Zheng, Y.Y. Clinical use and research progress of ursodeoxycholic acid. J. Clin. Ration. Drug Use 2016, 9, 84–85. [Google Scholar]
  3. Wan, J.F.; Chu, S.F.; Zhou, X.; Li, Y.T.; He, W.B.; Tan, F.; Luo, P.; Ai, Q.D.; Wang, Q.; Chen, N.N. Ursodeoxycholic acid protects interstitial Cajal-like cells in the gallbladder from undergoing apoptosis by inhibiting TNF-α expression. Acta Pharmacol. Sin. 2018, 39, 1493–1500. [Google Scholar] [CrossRef]
  4. Gazda, J.; Drazilova, S.; Gazda, M.; Martin Janicko, M.; Koky, T.; Macej, M.; Carbone, M.; Jarcuska, P. Treatment response to ursodeoxycholic acid in primary biliary cholangitis: A systematic review and meta-analysis. Dig. Liver Dis. 2023, 55, 1318–1327. [Google Scholar] [CrossRef] [PubMed]
  5. National Pharmacopoeia Commission. Pharmacopoeia of the People’s Republic of China: Part II; China Medical Science and Technology Press: Beijing, China, 2020.
  6. United States Pharmacopoeia Commission. Ursodeoxycholic Acid; USP43; US Pharmacopoeia: New York, NY, USA, 2020. [Google Scholar]
  7. European Pharmacopoeia Commission. Ursodeoxycholic Acid; EP10.0; European Pharmacopoeia: Amsterdam, The Netherlands, 2020. [Google Scholar]
  8. Dawkins, M.S. From an animal’s point of view: Motivation, fitness, and animal welfare. Behav. Brain Sci. 1990, 13, 1–9. [Google Scholar] [CrossRef]
  9. Kim, O.Y.; Lee, S.Y.; Lee, D.Y.; Hur, S.J. Developing a procedure to extract chenodeoxycholic acid and synthesize ursodeoxycholic acid from pig by-products. Heliyon 2023, 9, e18313. [Google Scholar] [CrossRef] [PubMed]
  10. Lu, M.F.; Yin, W.C.; Wang, F.D.; Peng, D.M. Improvement of the synthesis process of ursodeoxycholic acid. Chin. J. Pharm. Ind. 2015, 46, 1058–1059. [Google Scholar]
  11. Chen, W.; Hu, D.; Feng, Z.; Liu, Z. An effective synthesis of ursodeoxycholic acid from dehydroepiandrosterone. Steroids 2021, 172, 108870. [Google Scholar] [CrossRef] [PubMed]
  12. Shen, J.X.; Dong, D.D.; Wang, Z.F.; Wan, J.F.; Cao, X.J. Synthesis of ursodeoxycholic acid by electrochemical stereoselective reduction of 7-ketolithocholic acid in aprotic solvents. Sci. Rep. 2021, 1, 16273. [Google Scholar] [CrossRef] [PubMed]
  13. Fu, D.W.; Fu, J.J.; Li, J.J.; Tang, Y.; Shao, Z.W.; Zhou, D.Y.; Song, L. Efficient encapsulation of curcumin into spent brewer’s yeast using a pH-driven method. Food Chem. 2022, 394, 133537. [Google Scholar] [CrossRef] [PubMed]
  14. Zhang, Y.H. Construction and Application of a Recombinant Yeast Strain for Efficient Synthesis of Ursodeoxycholic Acid. Master’s Thesis, Tianjin University of Science and Technology, Tianjin, China, 2022. [Google Scholar]
  15. Yang, B.Y.; You, Z.N.; Xue, J.T.; Pan, J.; Li, C.X.; Xu, J.H. Clean enzymatic production of ursodeoxycholic acid enabled by a newly identified NADH- dependent 7β-hydroxysteroid dehydrogenase. Mol. Catal. 2023, 537, 112946. [Google Scholar] [CrossRef]
  16. Zhang, C.L.; Li, C.S.; Yu, X.L. Progress in Chinese patents for the effective ingredient ursodeoxycholic acid in bear bile. Chin. J. Tradit. Chin. Med. 2012, 37, 2851–2854. [Google Scholar]
  17. Luo, L.L.; Yu, J.; Wei, H.Q.; Hou, W.B.; Li, W.L. Research progress in the synthesis of ursodeoxycholic acid. Synth. Chem. 2021, 29, 986–996. [Google Scholar]
  18. Li, J.; Li, X.; Wang, F.; Zhao, T.; Wang, C.H. Determination of three residual organic solvents in ursodeoxycholic acid by headspace gas chromatography. Prog. Mod. Biomed. Sci. 2015, 31, 6156–6159. [Google Scholar]
  19. Zhou, H.J. International Technical Requirements for Drug Registration Q3C; People’s Health Publishing House: Beijing, China, 2000; pp. 1–8. [Google Scholar]
  20. State Food and Drug Administration. Technical Guidelines for the Study of Residual Solvents in Chemical Drugs; State Food and Drug Administration: Silver Spring, MD, USA, 2005; pp. 6–7.
Figure 1. The effect of different equilibrium times on test samples.
Separations 10 00573 g001
Figure 2. The chromatogram of system suitability. (a) Blank solvent; (bf) localization solutions of five residual solvents (0—dimethyl sulfoxide; 1—methanol; 2—acetone; 3—tert-butanol; 4—ethyl acetate; 5—triethylamine); (g) reference solution; (h) sample solution.
Separations 10 00573 g002
Table 1. The effect of different equilibrium temperature on test samples.
Equilibrium TemperatureTest Samples
Unknown Peak (2.758 min)AcetoneTert-ButanolTriethylamine
60 °CRt (min)2.7583.6463.9486.218
Resolution ——5.7092.19122.044
Peak area45.542411.7212.78312.881
Tailing factor1.5330.9341.0561.718
Number of theoretical plates426910,62813,918119,444
80 °CRt (min)2.7583.6453.9496.212
Resolution ——5.7022.21522.277
Peak area39.932641.8443.96326.420
Tailing factor1.4791.0920.9231.685
Number of theoretical plates433510,40314,349123,073
100 °CRt (min)2.7403.6333.9356.193
Resolution ——6.3452.28322.551
Peak area3.255712.0489.88336.692
Tailing factor1.3491.1450.9851.500
Number of theoretical plates570811,28715,126118,512
Table 2. Linear results for each residual solvent (n = 3).
Residue SolventRegression EquationsRLinearity Range (mg/mL)
Methanol Y = 981.35X + 10.040.99930.06–0.3
AcetoneY = 4517.4X + 78.5690.99910.1–0.5
Tert-butanolY = 2756.5X + 45.7110.99900.1–0.5
Ethyl acetateY = 3507.5X + 56.4460.99900.1–0.5
TriethylamineY = 14,349X + 252.250.99900.1–0.5
Table 3. Results of recovery tests for each residual solvent (n = 9).
Residue
Solvents
Theoretical Concentration
(mg/mL)
Actual Concentration (mg/mL)Recovery
(%)
Average Recovery (%)RSD
(%)
Methanol 0.180.1808100.4100.6 3.45
0.180.1803100.2
0.180.177398.5
0.240.233697.3
0.240.2410100.4
0.240.2409100.4
0.30.297499.1
0.30.298399.4
0.30.3282109.4
Acetone0.30.3004100.198.22.60
0.30.299099.7
0.30.289496.5
0.40.377994.5
0.40.396299.1
0.40.389097.2
0.50.474694.9
0.50.496699.3
0.50.5107101.8
Tert-butanol0.30.3205106.8106.03.28
0.30.3185106.2
0.30.3096103.2
0.40.4074101.9
0.40.4251106.3
0.40.4270106.7
0.50.5163103.3
0.50.5284105.7
0.50.5695113.9
Ethyl acetate0.30.3027100.998.82.72
0.30.3005100.2
0.30.289796.6
0.40.380495.1
0.40.399199.8
0.40.394698.6
0.50.476295.2
0.50.5002100.0
0.50.5152103.0
Triethylamine0.30.293998.092.93.80
0.30.292297.4
0.30.274491.5
0.40.352788.2
0.40.373393.3
0.40.357289.3
0.50.448589.7
0.50.475595.1
0.50.469493.9
Table 4. Test results of robustness.
Conditions Contents (%)
Flow Rate of Carrier (mL/min)Equilibrium Temperature (°C)AcetoneTert-ButanolTriethylamine
0.9 mL/min100 °C0.20680.00260.0056
1.0 mL/min100 °C0.20360.00240.0057
1.1 mL/min100 °C0.19990.00240.0043
1.0 mL/min90 °C0.19990.00240.0043
Table 5. Determination results of samples.
Batch NumberContent (%)
MethanolAcetoneTert-ButanolEthyl AcetateTriethylamine
113UA2160817--0.18980.0076--0.0077
113UA2160906--0.18030.0072--0.0063
113UA2160917--0.19370.0074--0.0034
113UA2160106--0.19330.0077--0.0039
Average content (%)--0.1893 0.0075 --0.0053
Disclaimer/Publisher’s Note: The statements, opinions and data contained in all publications are solely those of the individual author(s) and contributor(s) and not of MDPI and/or the editor(s). MDPI and/or the editor(s) disclaim responsibility for any injury to people or property resulting from any ideas, methods, instructions or products referred to in the content.

