Article

Mineralogical Characteristics of Baima Vanadium Titanomagnetite during Magnetic Separation Upgrading

1
State Key Laboratory of Vanadium and Titanium Resources Comprehensive Utilization, Pangang Group Research Institute Co., Ltd., Panzhihua 617000, China
2
College of Materials and Chemistry & Chemical Engineering, Chengdu University of Technology, Chengdu 610059, China
*
Authors to whom correspondence should be addressed.
Separations 2023, 10(11), 574; https://doi.org/10.3390/separations10110574
Submission received: 12 October 2023 / Revised: 7 November 2023 / Accepted: 16 November 2023 / Published: 17 November 2023

Abstract

:
The Baima vanadium titanomagnetite deposit, located in the Panzhihua-Xichang (Panxi) metallogenic belt in China, is one of the super-large deposits in the region. The titanomagnetite upgrading process involves grinding the raw ore followed by magnetic separation. To determine the processing characteristics of the ore and assess the upgrading process, this study employs various methods and techniques, including the X-ray fluorescence spectrometer (XRF), chemical element analysis, the electron probe microanalyzer (EPMA), and the advanced mineral identification and characterization system (AMICS). The results show that the Fe grades in the upgraded raw ore, upgraded concentrate, and upgraded tailings are 55.68%, 57.89%, and 15.62%, respectively. After upgrading, the titanomagnetite content increased from 77.41% to 82.10%, and the Fe distribution in titanomagnetite also increased from 91.05% to 93.14%. In the upgraded raw ore, titanomagnetite particles followed a normal distribution, with 50.44% in the 38–74 μm range. In the upgraded concentrate, titanomagnetite was concentrated in the 19–38 μm range. Based on EPMA data, the theoretical Fe grade in titanomagnetite was calculated to be 65.08%, indicating the potential for further improvement through the upgrading process. This study elucidates the mineralogical characteristics during the vanadium titanomagnetite upgrading, providing a theoretical basis to further enhance the Fe recovery rate.

1. Introduction

Vanadium titanomagnetite (VTM) is a valuable multi-element ore composed primarily of iron, titanium, and vanadium, with minor amounts of chromium, nickel and cobalt, gallium and scandium, etc. [1,2,3,4,5]. Global VTM reserves are extremely abundant (over 40 billion tons), found mainly in Russia, South Africa, China, the United States, Canada, Norway, Finland, India, and Sweden [6]. In China, VTM reserves are highly concentrated in the Panzhihua-Xichang (Panxi) region, with the major mining districts being Hongge, Panzhihua, Taihe, and Baima [7,8]. The total Fe grade of iron concentrate produced from ore processing plants in the Panxi region is generally between 54% and 56% [9,10], which is considerably lower than that of typical magnetite ores. The Baima VTM deposit was discovered in 1955 by the geophysical team of the Sichuan Bureau of Geology and large-scale mining operations started in 2008. The intrusion contains 1497 Mt of ore reserves with a mean grade of ∼26% total Fe, ∼7% TiO2, and ∼0.21% V2O5 [7]. Currently, vanadium titanomagnetite concentrate and ilmenite concentrate can be obtained by traditional ore dressing methods such as magnetic separation, gravity separation, and flotation. Generally, low-intensity magnetic separation is first conducted to beneficiate the vanadium titanomagnetite concentrate after grinding of the raw ore. An ore processing plant in Baima produced iron concentrate with an Fe grade of approximately 55.5% using existing beneficiation methods. In order to further increase the Fe grade, the plant implemented an iron concentrate upgrading process. The detailed process flow diagram for the concentrate upgrading is shown in Figure 1. The iron concentrate from magnetic separation at the Baima plant is used as the raw material for upgrading. After mixing in a pump sump, the upgraded raw ore is classified using a cyclone. The coarse underflow from the cyclone enters a tower mill for regrinding. The fine overflow is further classified using a high-frequency vibrating screen. The oversize from the screen also goes into the tower mill for additional grinding. The undersize product from the screen feeds directly into magnetic separators for separation. The magnetic concentrate from the separators undergoes thickening and filtration to produce the final upgraded iron concentrate product. This work takes the upgraded raw ore, upgraded iron concentrate, and upgraded tailings as the research objects, and carries out detailed process mineralogy studies.
Traditional process mineralogy studies mainly utilize analytical techniques such as optical microscopy, X-ray diffraction (XRD), and chemical analysis to investigate the chemical composition, element deportment, mineralogy, and textural relationships of ores [11,12]. However, traditional process mineralogy studies demand a high proficiency from researchers, requiring mineral identification and modal estimation under the microscope, mineral particle size statistics, and manual measurements of mineral liberation, etc. This introduces a considerable experimental error and an enormous workload. With the development of scan electron microscopies and the application of automated mineralogy systems based on scan electron microscopies and energy spectrometers, more and more researchers are utilizing mineral analysis systems such as the Bgrimm process mineralogy analyzer (BPMA) [13], mineral liberation analysis (MLA) [14,15,16,17], and advanced mineral identification and characterization system (AMICS) [18,19,20] for process mineralogical studies and have achieved good results. Compared with other analysis means, the AMICS is the latest generation (the third generation) of automated mineral identification and characterization system, followed by the QEMSCAN and MLA [18]. The AMICS integrates state-of-the-art analytical instrumentation with innovative software for comprehensive ore characterization. The system comprises a high-resolution Zeiss Sigma 500 scanning electron microscope (SEM) equipped with a Bruker XFlash 6160 energy dispersive X-ray spectrometer (EDS). The SEM provides advanced imaging capabilities through a finely-focused electron beam interacting with the sample surface. Meanwhile, the EDS collects X-ray spectrum data at each analysis point, enabling elemental characterization. Unlike conventional SEM-EDS setups, the AMICS further incorporates proprietary software that automates the acquisition and interpretation of vast datasets. Backscatter electron images are processed to generate high-resolution mineral maps. EDS spectra are automatically matched against a standard mineral library to identify mineral species. The software also compiles grain size statistics, mineral associations, liberation analysis, and other process mineralogy parameters. By combining enhanced instrumentation with intelligent data analytics, the AMICS delivers rapid, automated characterization unmatched by previous generations of mineralogy systems. The wealth of process-relevant information produced by the AMICS will aid in the optimization of separation efficiency and product quality. The chemical composition of each mineral grain (micro-area) is analyzed through an energy spectrum analysis, and the backscattering image data of the samples were acquired using an electron microscope. Additionally, the analysis software can support the grainy treatment of complex, multi-component, and paragenetic ore samples and subdivide these ore samples into different mineral compositions. Mineral data and parameters are obtained through a series of data processing, and the mineral composition and other process mineralogy results are presented in a graphical form, as the most cutting-edge analysis and test method in the mineral and geological industry across the world. Therefore, in this study, detailed process mineralogical characterization of iron concentrate upgrading samples from a processing plant in the Baima was carried out using the AMICS. The goal was to provide fundamental process mineralogical data to determine an improved process flow for iron concentrate upgrading.

2. Sample and Analytical Methods
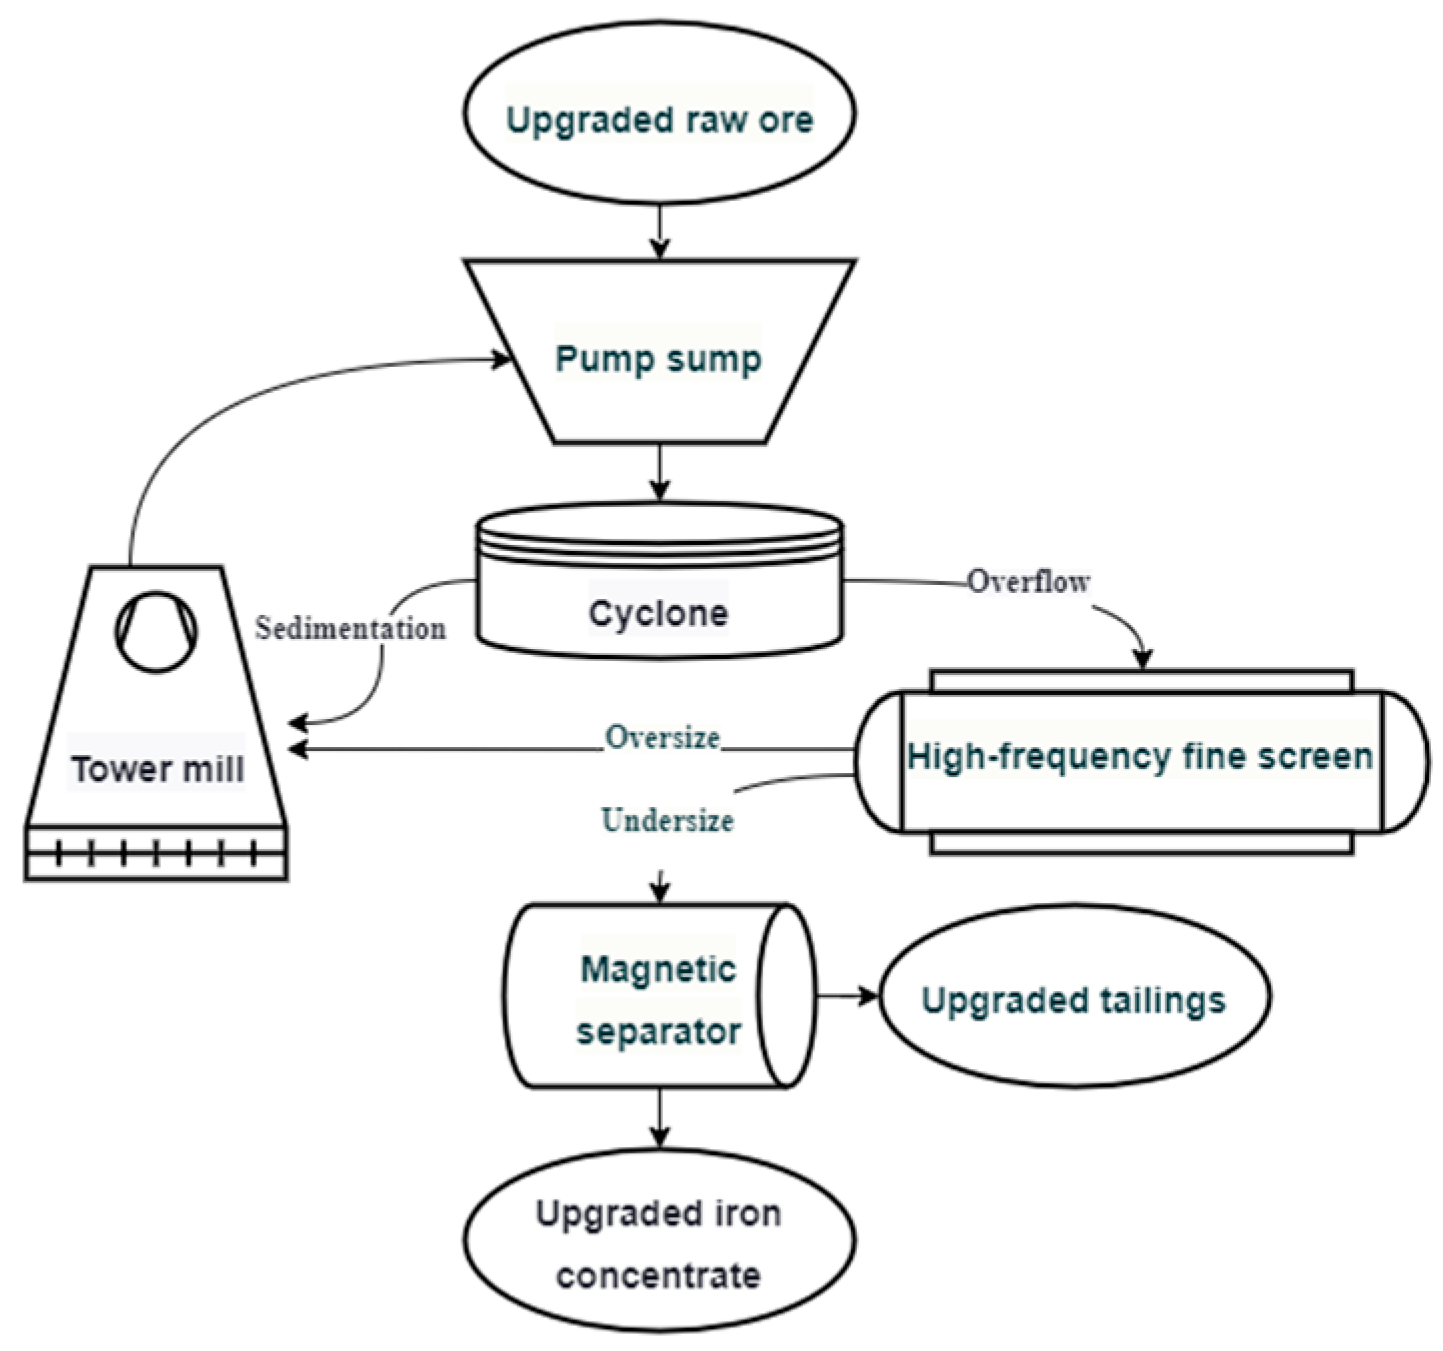
2.1. Sample

This study includes three types of samples: upgraded raw ore, upgraded iron concentrate, and upgraded tailings. All samples for this research were taken from a mineral processing plant located in Baima. The upgraded raw ore is obtained from the vanadium titanomagnetite raw ore in the Baima area through crushing → grinding → magnetic separation (at 3000 Gauss magnetic field intensity with iron recovery of 98.1%) → filtration. After screening, the particle size of the upgraded raw ore is below 200 mesh, accounting for 70%. The upgraded concentrate is obtained by the combined action of the cyclone, tower mill, high-frequency fine screen, and magnetic separator from the upgraded raw ore. The upgraded tailings are the tailings left over from the magnetic separation of the upgraded raw ore. The specific upgrading process is shown in Figure 1.

2.2. Sample Preparation for AMICS Analysis

The three types of specimens were prepared using the same method. Take 3 g of the reduction specimens and put it into a cylindrical mold with a diameter of 30 mm. Add 7 g of epoxy resin and 1.5 g of ethylenediamine (Buehler Company, Waukegan, USA) curing agent, add an appropriate amount of acetone (Chengdu CHRON Chemicals Co., Ltd., Chengdu, China) as a dispersant, stir, and put it into a vacuum impregnation unit (Buehler SimpliVac, Waukegan, IL, USA) to extract the air and let it stand for 12 h. After the resin is cured, an automatic grinding and polishing machine (Buehler EcoMet 300, Waukegan, IL, USA) is used to grind and polish it. Finally, a vacuum evaporator (Quorum Q150R, Brighton, UK) is used to spray gold on the surface to be tested to ensure conductivity.

2.3. Analytical Methods

The chemical composition of iron was analyzed by the potassium dichromate titration method according to International Organization for Standardization ISO/TS 2597-4:2019, Iron ores—Determination of total iron content—Part 4: Potentiometric titration method [21]. This standard method is based on the redox reaction between ferrous iron and potassium dichromate under acidic conditions. The amount of dichromate consumed is equivalent to the iron content. A potentiometric titration is used to determine the endpoint. This technique provides an accurate measurement of the total iron concentration. The X-ray fluorescence spectrometer (XRF) (AxiosmAX PANalytical B.V., Alemlo, The Netherlands) is used for elemental composition and content analysis. The titanomagnetite element distribution was characterized using an electron probe microanalyzer (EPMA) (JXA-IHP200F, JEOL, Shizuoka, Japan). Backscatter images were captured under a field emission scanning electron microscope (Zeiss Sigma500, Jena, Germany). The phase composition, particle size distribution, dissemination state, and degree of liberation analyses of samples were completed using the advanced mineral identification and characterization system (AMICS). The system consists of a Zeiss Sigma500 high resolution field emission scanning electron microscope, a Bruker XFlash 6160 modern fast X-ray spectrometer, and AMICS software. The AMICS operates with a 20 kV acceleration voltage (related to the acceleration voltage of X-ray energy spectrum information in the mineral standard library), high vacuum, backscatter mode, aperture selection 120 micron, and 8.5 mm working distance.

3. Results

Since the particle size of the upgraded iron concentrate and upgraded tailings is very fine, a large number of powder samples agglomerate in the existing AMICS analysis sample preparation method, as shown in Figure 2. Powder agglomeration leads to large errors in the AMICS analysis, especially when measuring the particle size and degree of liberation. To aid particle dispersion, an appropriate amount of acetone dispersant was added during resin embedding, followed by high-intensity ultrasonic vibration for 10 min to break up agglomerates. This work found that adding an appropriate amount of acetone as a dispersant can achieve a good dispersion effect and make the test results more accurate. We have applied for a Chinese invention patent for this method.

3.1. Chemical Composition

The chemical compositions of the upgraded raw ore, upgraded iron concentrate, and upgraded tailings were analyzed using potassium dichromate titration and X-ray fluorescence spectrometry (XRF). The main chemical compositions are shown in Table 1.
The total Fe content of the upgraded raw ore is 55.58 wt%. After magnetic separation upgrading, the total Fe content in the upgraded iron concentrate increased to 57.89 wt%, a rise of 2.21 percentage points. This demonstrates that the upgrading process successfully improved the Fe grade, achieving the intended concentrate enrichment. The TiO2 and V2O5 contents also increased slightly after upgrading. This is attributed to vanadium being primarily hosted in titanomagnetite. The very low V2O5 content (<0.1 wt%) in the upgraded tailings indicates that most of the vanadium was recovered in the iron concentrate.
Overall, the chemical composition results validate the effective separation and enrichment of iron and vanadium minerals from the gangue components into the upgraded concentrate through the magnetic separation process.

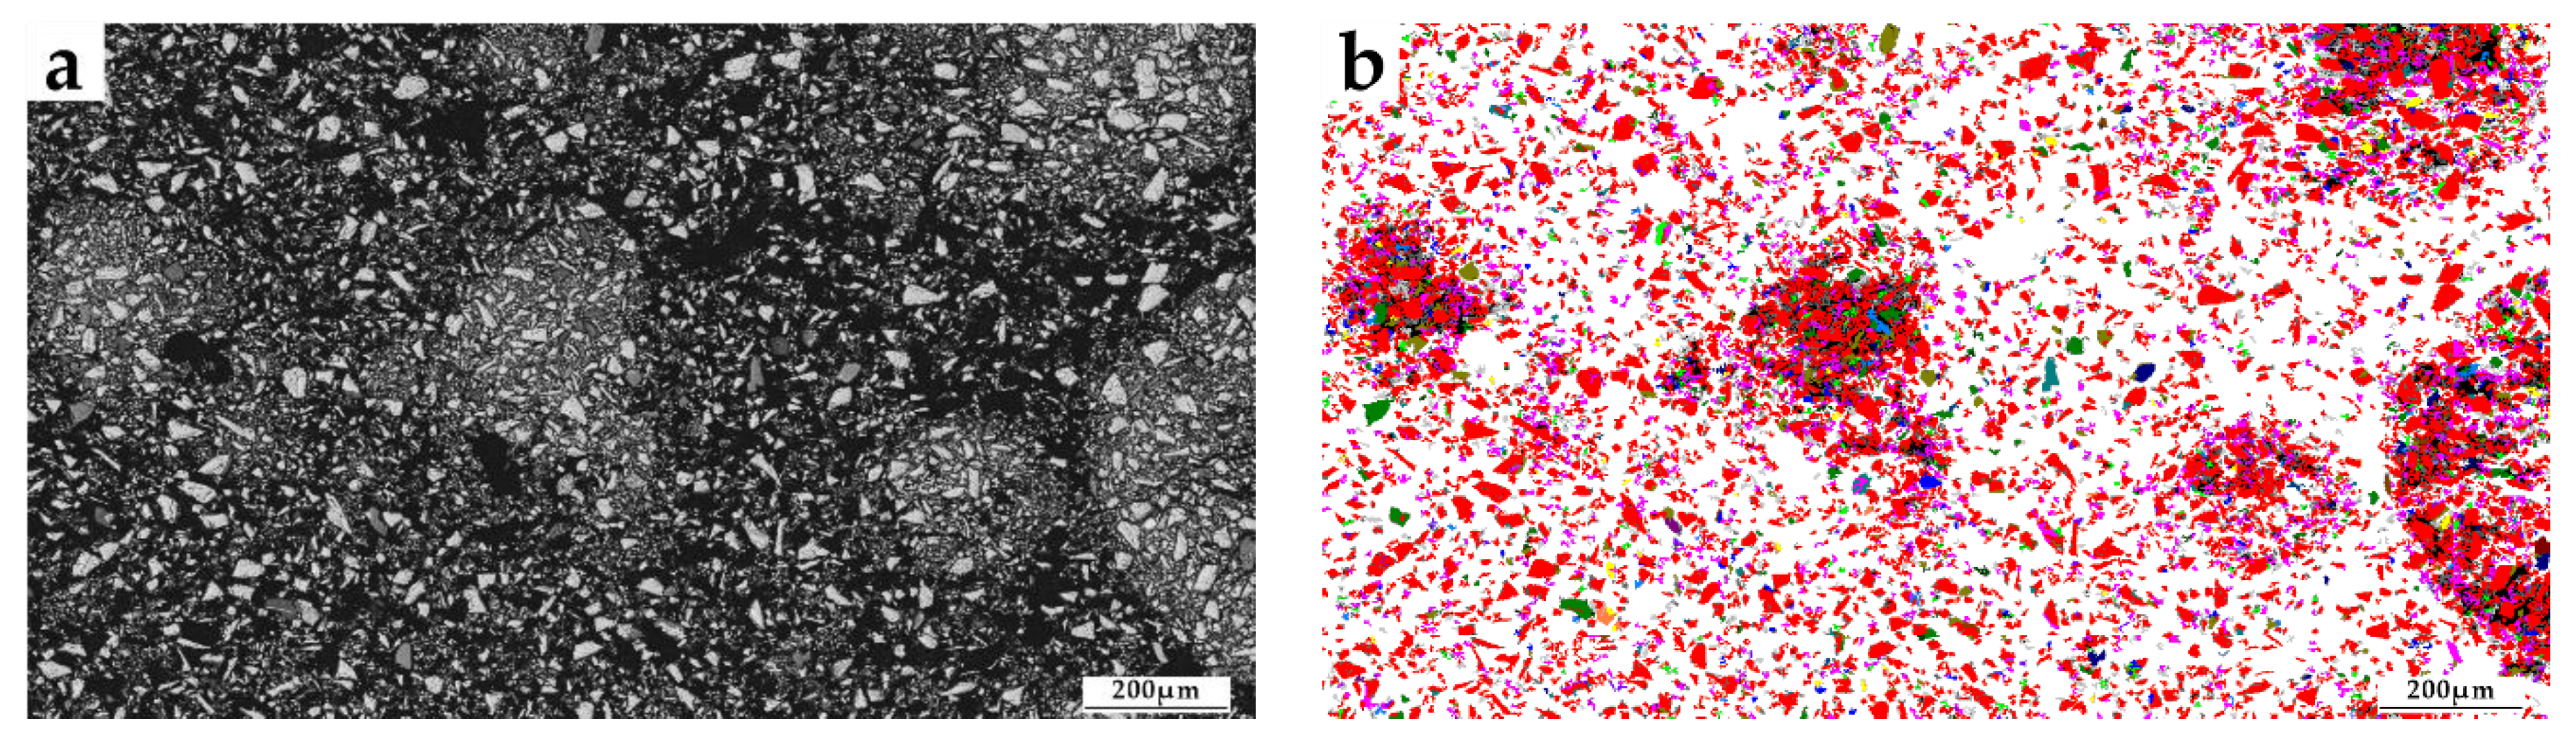
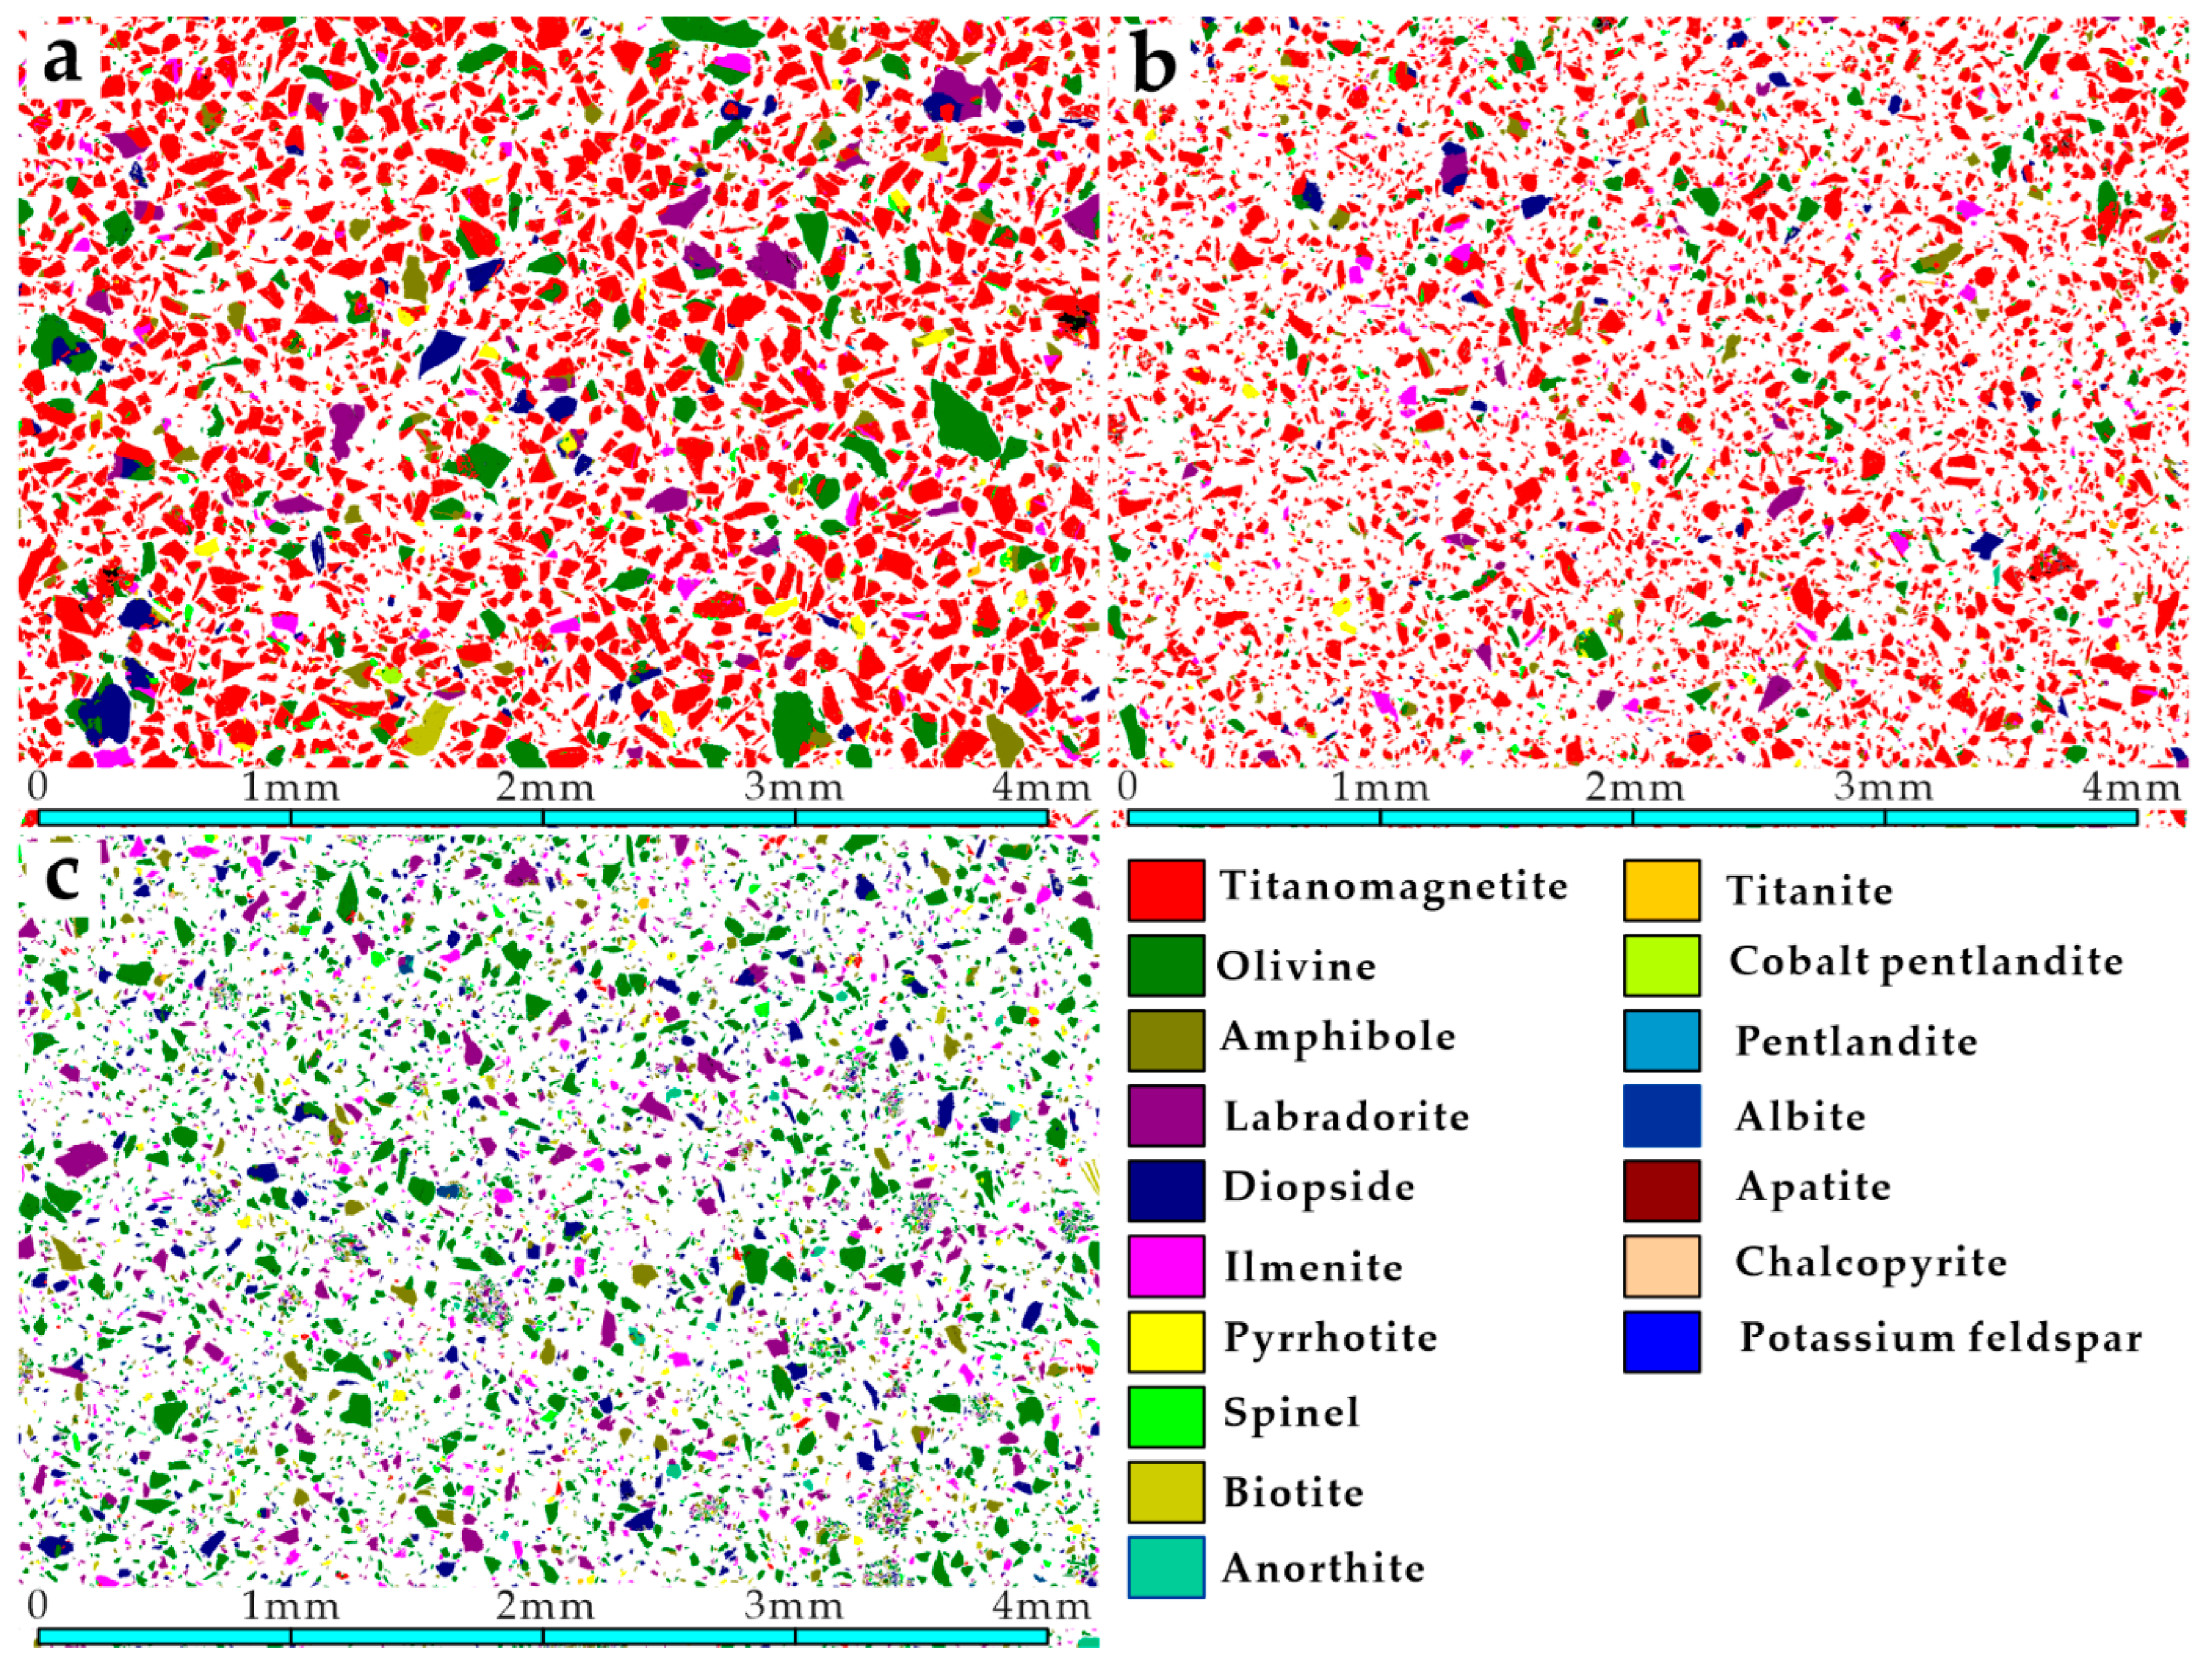
3.2. Mineral Composition

The mineral composition of the samples was analyzed using the advanced mineral identification and characterization system (AMICS). The main mineral composition of the upgraded raw ore, upgraded iron concentrate, and upgraded tailings is shown in Table 2 and Figure 3. The titanomagnetite content in the upgraded raw ore increased by 4.69 percentage points, from 77.41 wt% before upgrading to 82.10 wt% in the upgraded iron concentrate after the separation process. Although upgraded, the titanomagnetite content in the concentrate remains moderately low at 82.10%. Further magnetic separation stages could potentially continue to increase the titanomagnetite recovery into the upgraded concentrate.
In the upgraded raw ore, olivine is the predominant gangue mineral at 8.02 wt%, followed by amphibole (3.37 wt%), labradorite (3.22 wt%), and diopside (3.08 wt%). After magnetic separation, the contents of olivine, labradorite, and diopside decreased in the gangue portion of the upgraded concentrate, declining to 5.86 wt%, 2.04 wt%, and 1.85 wt%, respectively. In contrast, the amphibole content remained relatively unchanged at 3.06 wt%. This suggests amphibole grains are more intergrown with the value titanomagnetite phase and are thus more readily co-recovered into the magnetic concentrate.
The very low 1.36 wt% titanomagnetite content in the upgraded tailings indicates that the magnetic separation process efficiently recovered titanomagnetite into the upgraded iron concentrate, while the non-magnetic minerals reported primarily to the tailings. The low titanomagnetite reporting to the tailings indicates an efficient magnetic recovery process. Olivine is the most abundant phase at 44.51 wt% in the tailings, with other main gangue minerals being labradorite (18.57 wt%), amphibole (10.41 wt%), and diopside (13.63 wt%). The 6.12 wt% ilmenite present also makes the tailings suitable as potential feed for titanium recovery.

3.3. Iron and Titanium Element Distribution

3.3.1. Iron Element Distribution

Iron is the most crucial element for the recovery and utilization of titanomagnetite ore. The iron elemental distribution in the samples was analyzed using the AMICS, with results shown in Table 3. In both the upgraded raw ore and concentrate, iron exhibits a very high degree of concentration in titanomagnetite, at 91.05% and 93.14%, respectively. This demonstrates an effective enrichment of iron into the value titanomagnetite phase during upgrading. In contrast, only 5.52% of the iron partitions into titanomagnetite in the tailings, with the majority reporting to the gangue minerals. Olivine hosts the greatest proportion of iron in the tailings at 52.18%, followed by ilmenite (13.94%), amphibole (10.5 9%), and diopside (8.13%), with other silicate gangue minerals accounting for the remainder. The preferential recovery of iron-bearing titanomagnetite over these phases during magnetic separation is evident. This elemental characterization helps validate separation performance and can guide strategies to further improve the iron recovery.

3.3.2. Titanium Element Distribution

Titanium is another crucial element for the recovery and utilization of titanomagnetite ore. The titanium distribution in the samples was also analyzed using the AMICS, with the results shown in Table 4. There are only four phases containing titanium, namely titanomagnetite, ilmenite, sphene, and diopside. Similar to iron, titanium exhibits a strong tendency to partition into titanomagnetite, at 88.85% and 87.86% for the upgraded raw ore and concentrate, respectively. This confirms the preferential accumulation of titanium in titanomagnetite during the upgrading process. In contrast, only 3.95% of the titanium occurs in titanomagnetite in the upgraded tailings. The titanium predominantly reports to the ilmenite phase at 87.56%, with minor amounts hosted in diopside (6.58%) and other gangue minerals. Because the titanium in the tailings is concentrated in ilmenite, the tailings can be used as raw materials for titanium selection in the next step.

3.4. Titanomagnetite Mineral-Processing Properties

3.4.1. Chemical Composition of Titanomagnetite

Chemical composition of titanomagnetite was analyzed using the electron probe microanalyzer (EPMA). Because the magnetic separation process does not change the chemical composition of titanomagnetite [22], titanomagnetite from the upgraded raw ore was selected for analysis. Fifty titanomagnetite particles from the upgraded raw ore were chosen using the EPMA. Two data points were collected on each particle, with individual particles with complete surfaces being selected when possible. The chemical compositions of 100 titanomagnetite spots were determined, and their average chemical composition was calculated, as shown in Table 5. The results show that titanomagnetite is composed primarily of 30.50 wt% FeO and 61.50 wt% Fe2O3, with a TiO2 content of 5.30 wt%. Minor element oxides are also present, including MgO, Al2O3, V2O5, and MnO at 0.42 wt%, 1.82 wt%, 0.15 wt%, and 0.19 wt%, respectively. The total analyzed composition sums to 99.88 wt%. According to the EPMA data for titanomagnetite, the theoretical iron grade in titanomagnetite was calculated to be 65.08%.

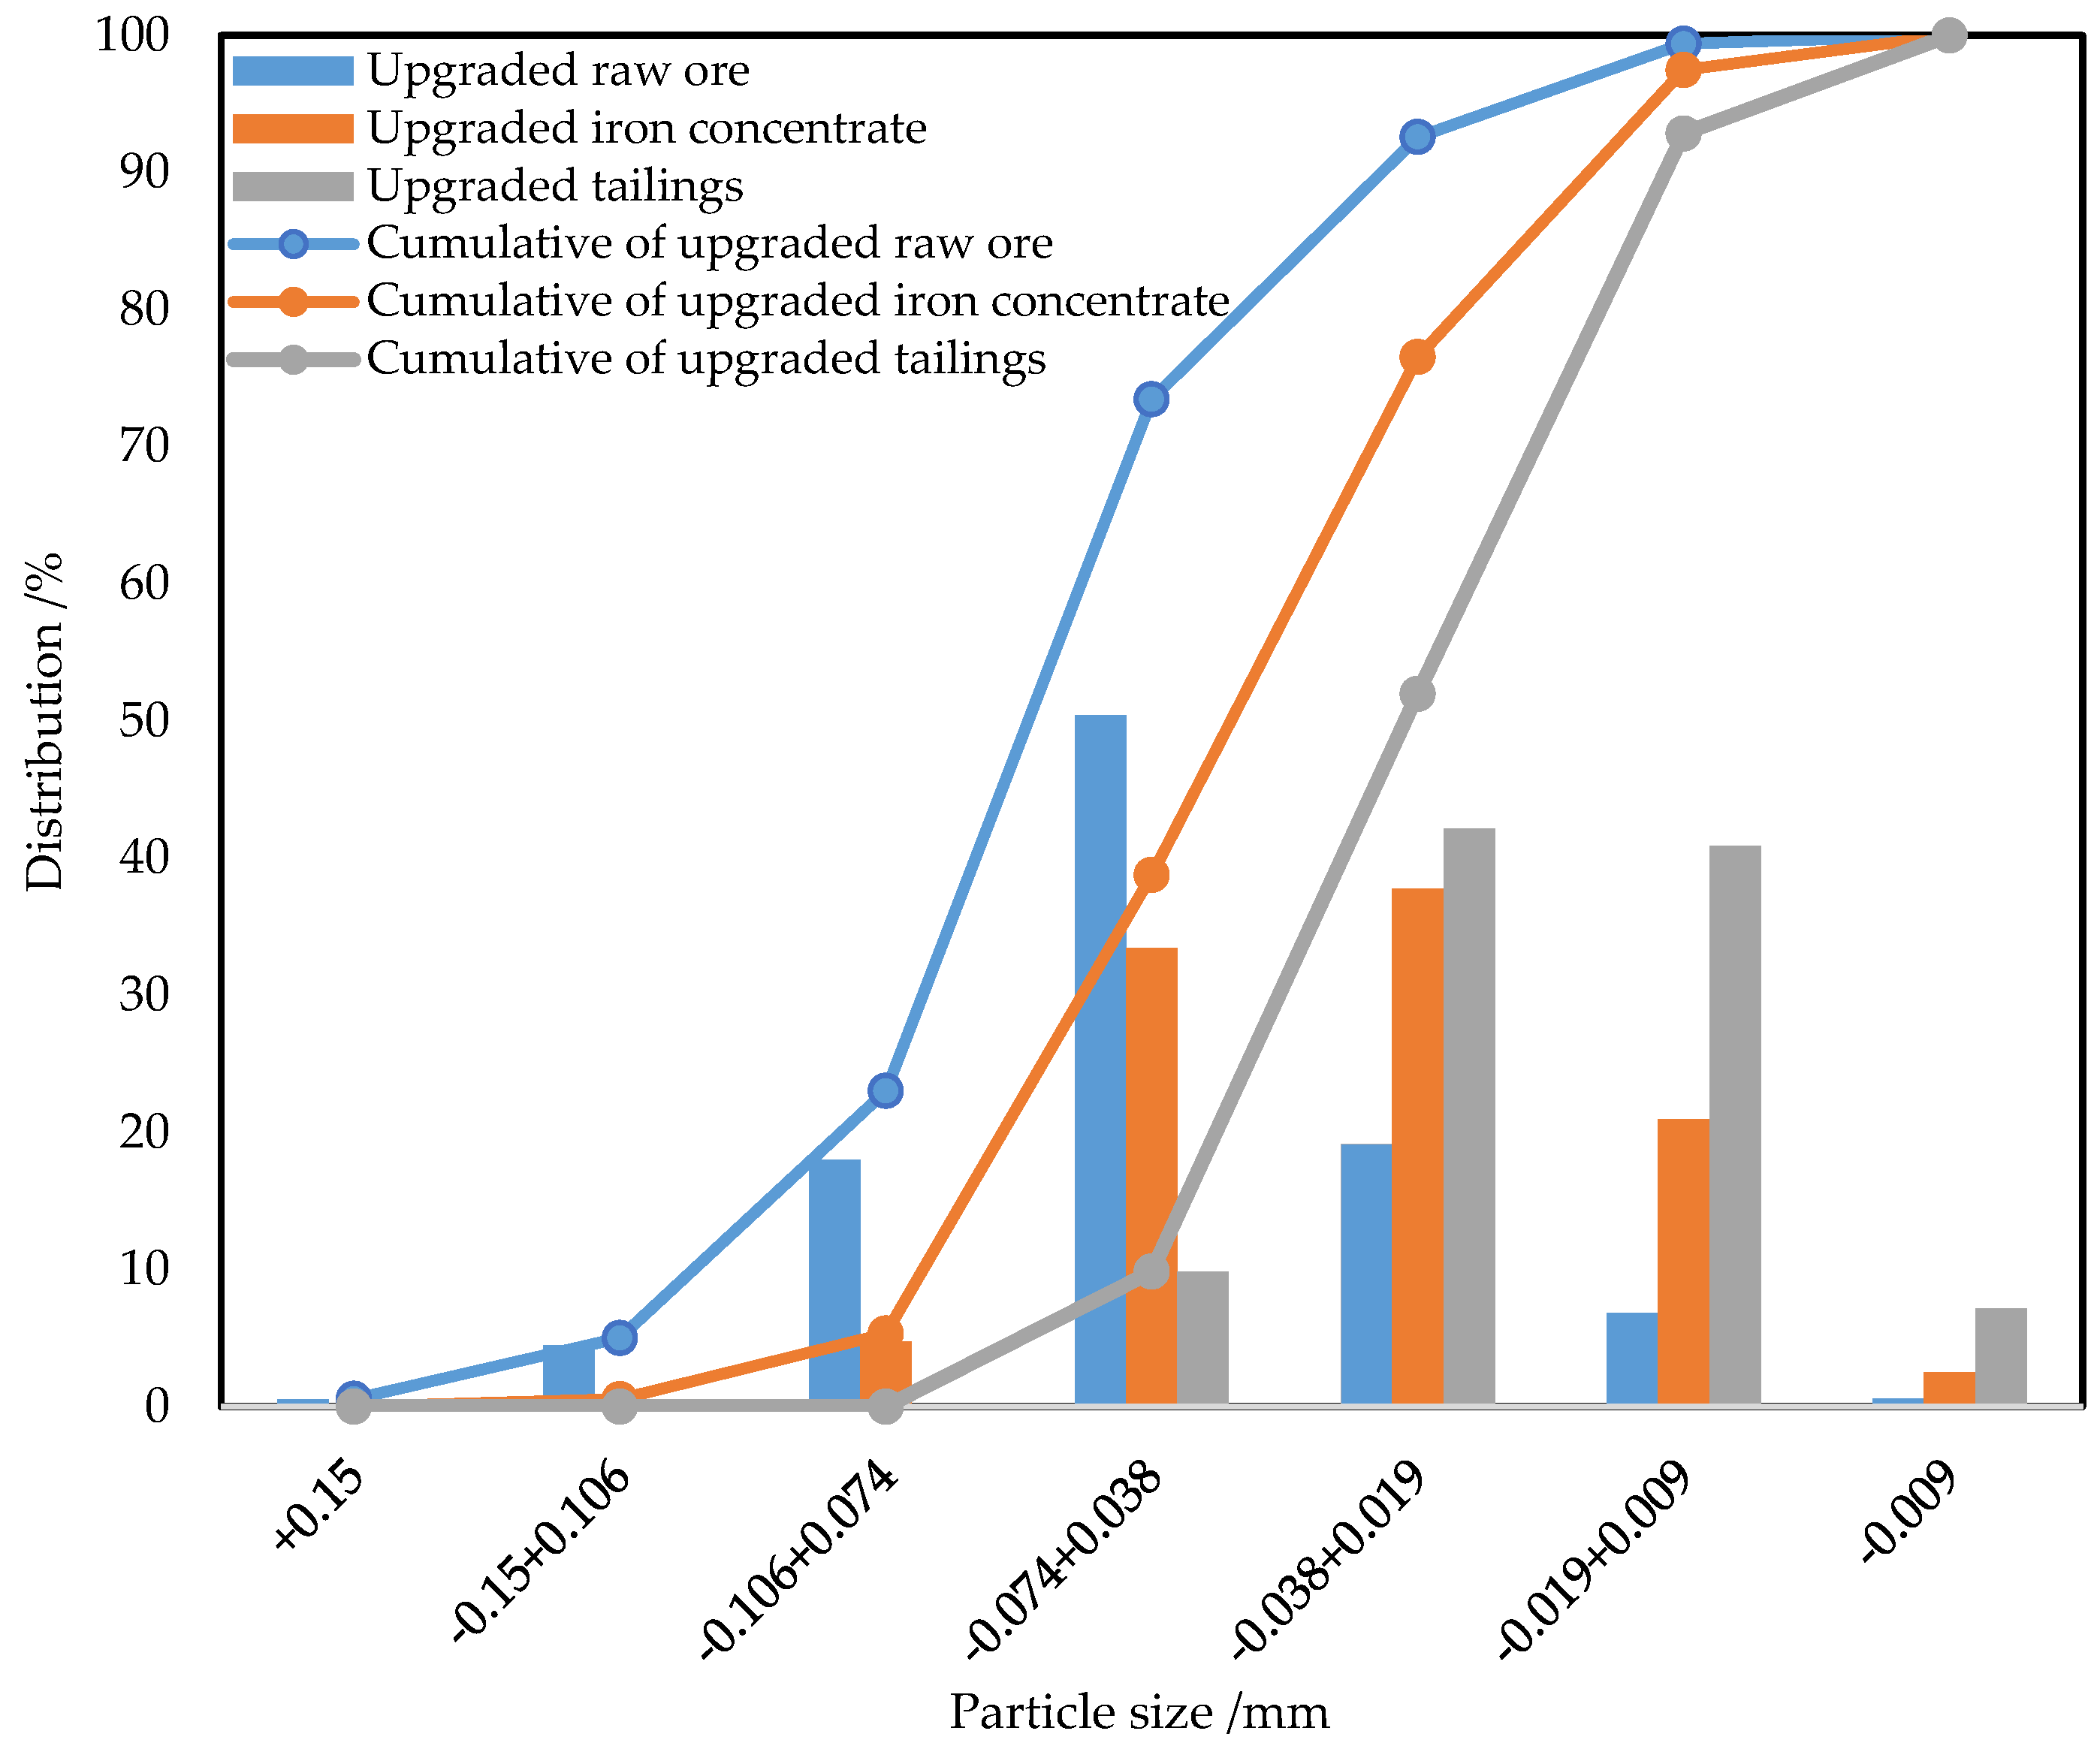
3.4.2. Particle Size of Titanomagnetite

The particle sizes of titanomagnetite samples were analyzed through the advanced mineral identification and characterization system (AMICS), and the analysis results are shown in Figure 4. Through the upgrading process, the coarse titanomagnetite particles in the upgraded raw ore are removed, and the particle size of titanomagnetite in the iron-upgraded concentrate and upgraded tailings is significantly refined. The particle size of titanomagnetite in the upgraded raw ore shows a normal distribution, concentrated between −0.074 + 0.038 mm, accounting for as high as 50.44%. After the upgrading process, this particle size is reduced to 33.45% in the upgraded iron concentrate, while it is basically absent in the upgraded tailings. At the same time, the mass percentage of a particle with a size of −0.038 + 0.019 mm or smaller and an ultra-fine particle with a size below 0.009 mm has significantly increased in both the upgraded iron concentrate and upgraded tailings. The particle size of titanomagnetite in the upgraded tailings is finer than that in the upgraded concentrate, indicating that a fine particle of titanomagnetite is more likely to enter the tailings.

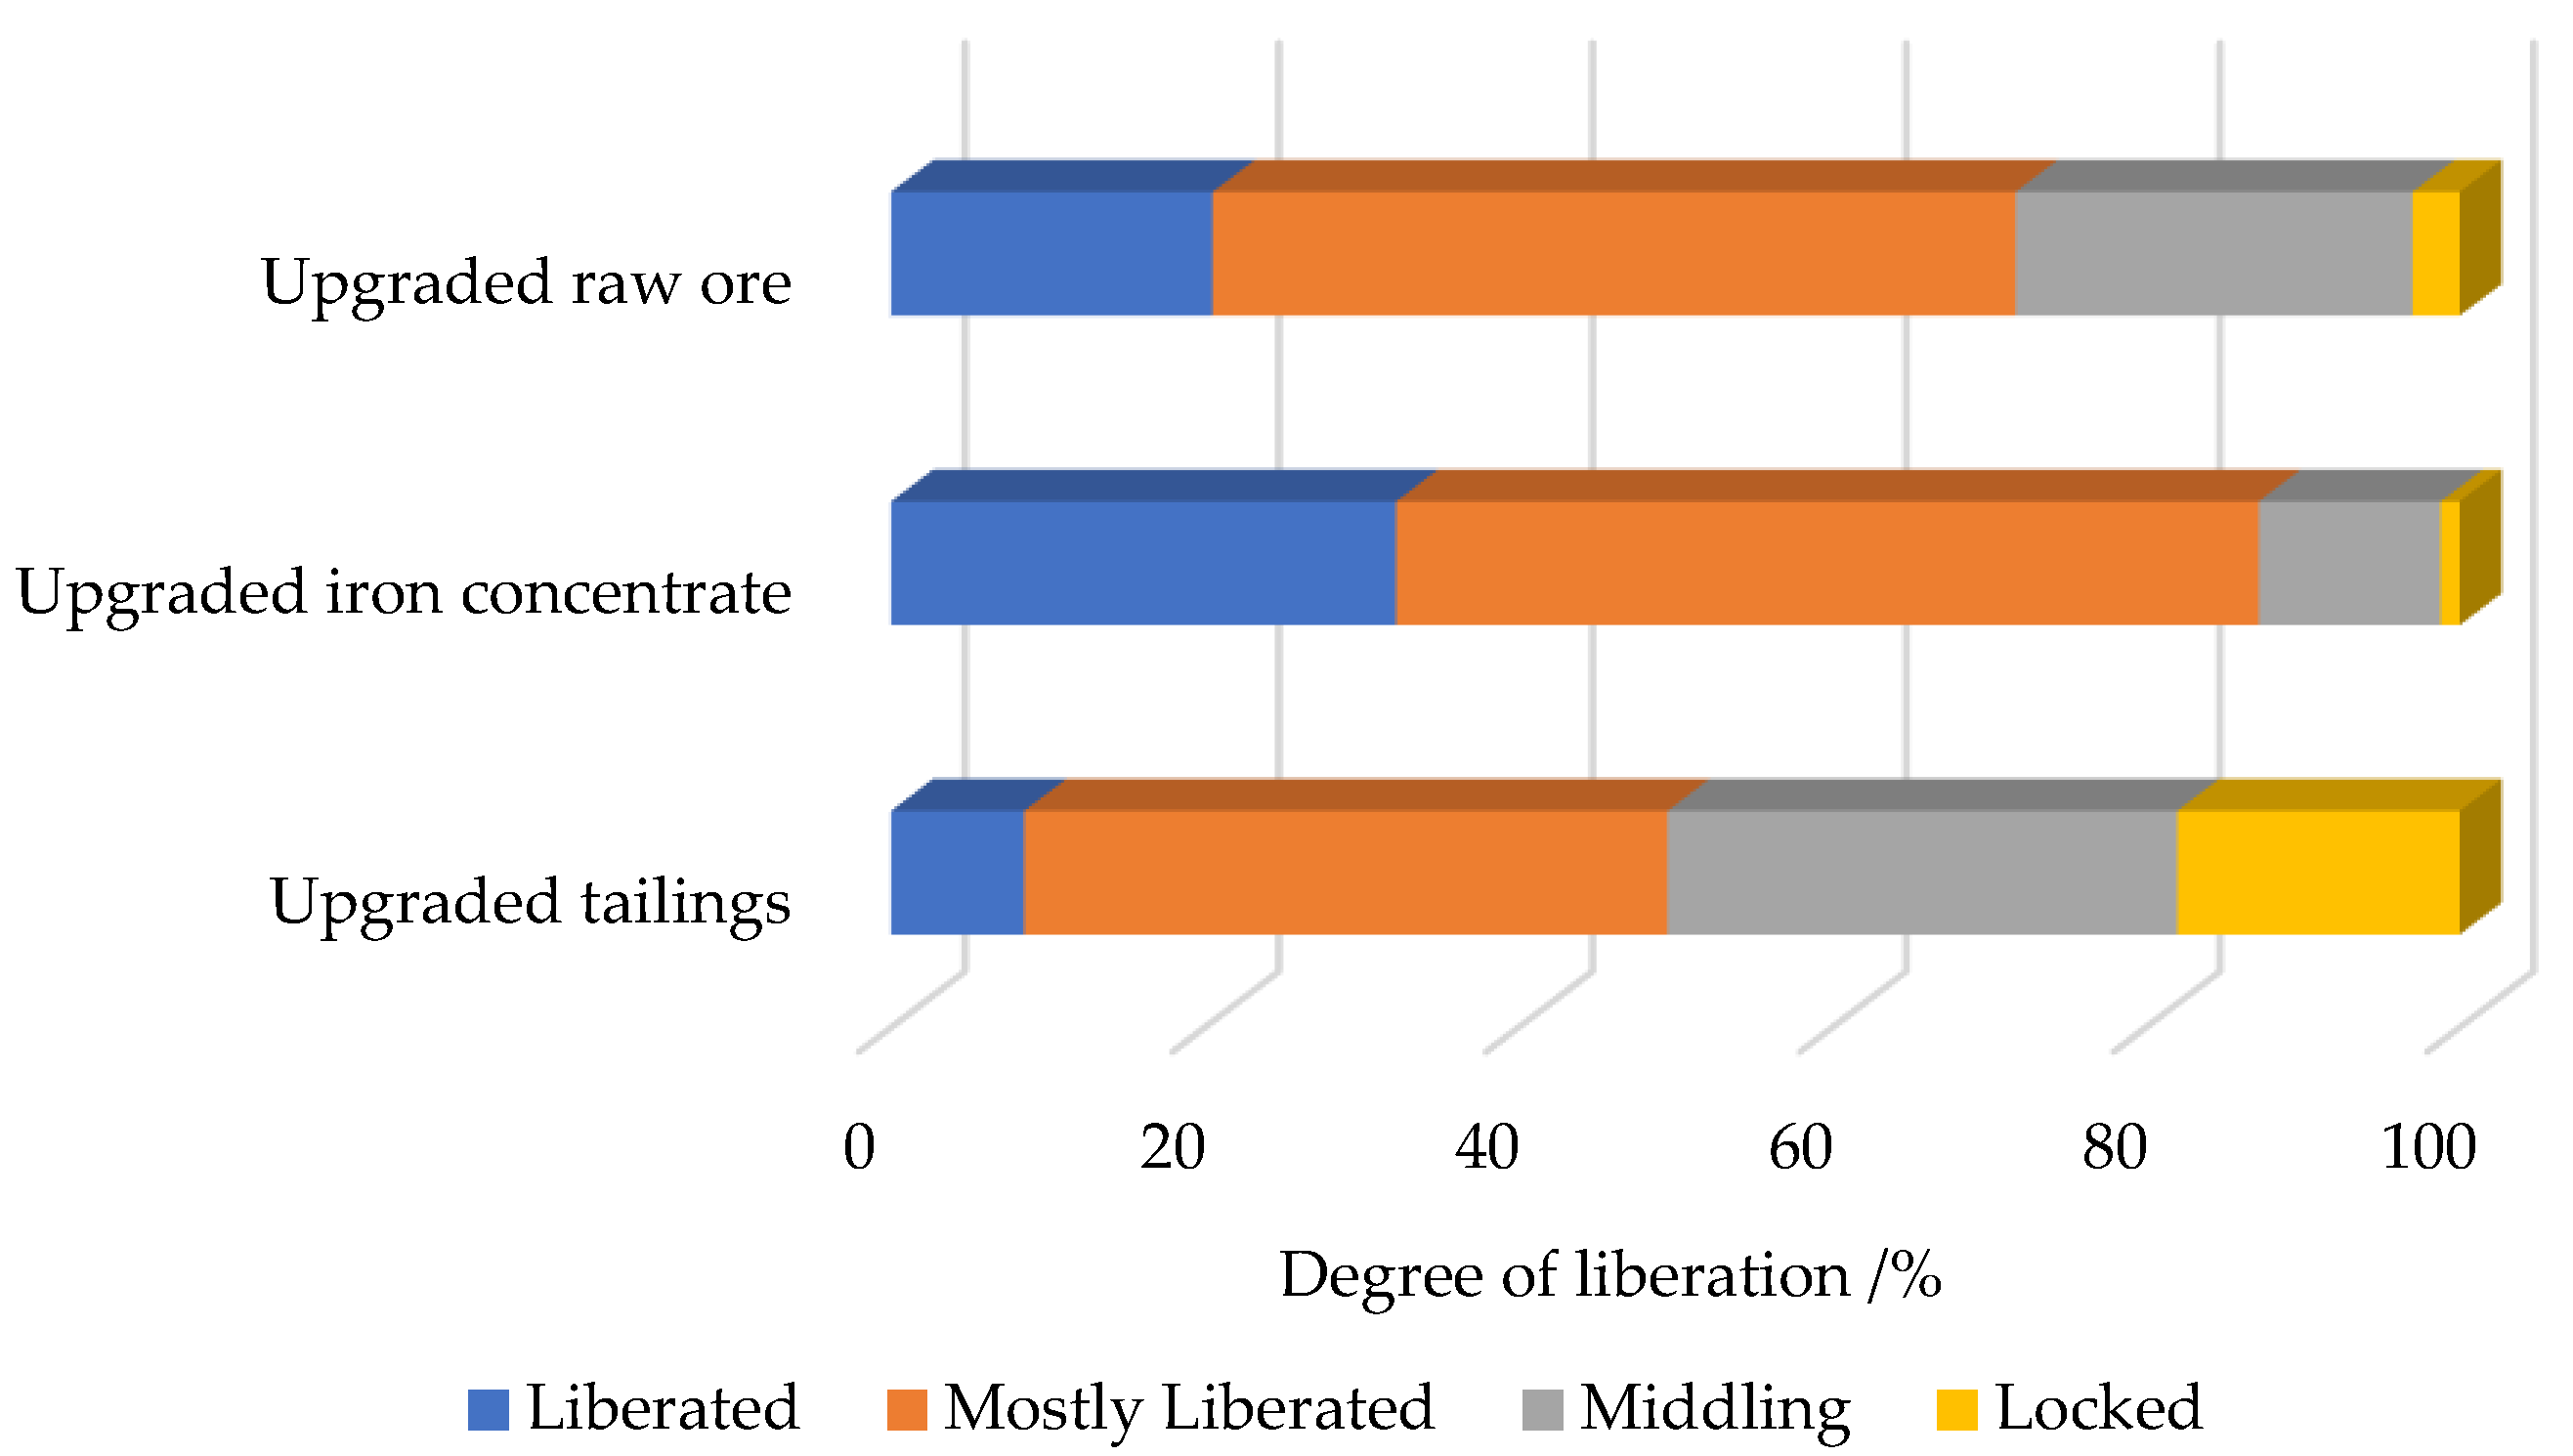
3.4.3. Liberation Degree of Titanomagnetite

The liberation degree of titanomagnetite samples was analyzed through the advanced mineral identification and characterization system (AMICS), and the analysis results are shown in Figure 5. Mineral liberation describes the degree to which a mineral of interest is liberated from other minerals. In this study, liberation was classified based on the surface area of titanomagnetite. “Liberated” indicates a complete separation with a liberation degree of 100%; “Mostly Liberated” signifies that the majority of mineral particles are separated (liberation degree typically ranging from 75% to 100%); “Middling” indicates a moderate level of liberation, with liberation degrees falling between 25% and 75%; and “Locked” suggests very little liberation, with liberation degrees below 25%. Typical pictures of titanomagnetite with different liberation levels are shown in Figure 5. Titanomagnetite with liberation degrees of “liberated” and “mostly liberated” can be easily separated by magnetic separation. The proportions of liberation degrees of “liberated”, “mostly liberated”, “middling” and “locked” in the upgraded raw ore are 20.5%, 51.2%, 25.31%, and 2.99%, respectively, and the proportions of the upgraded Iron concentrate are 32.2%, 55%, 11.6%, and 1.2%. The content of “liberated” titanomagnetite in the upgraded raw ore and upgraded iron concentrate is a bit low. This is because many titanomagnetite particles are symbiotic with a small amount of gangue minerals (Figure 6b). To further improve the iron grade, the amount of “liberated” titanomagnetite in the upgraded concentrate must be increased. Consider modifying the grinding process or extending the grinding time as appropriate to enhance the liberation degree of titanomagnetite.

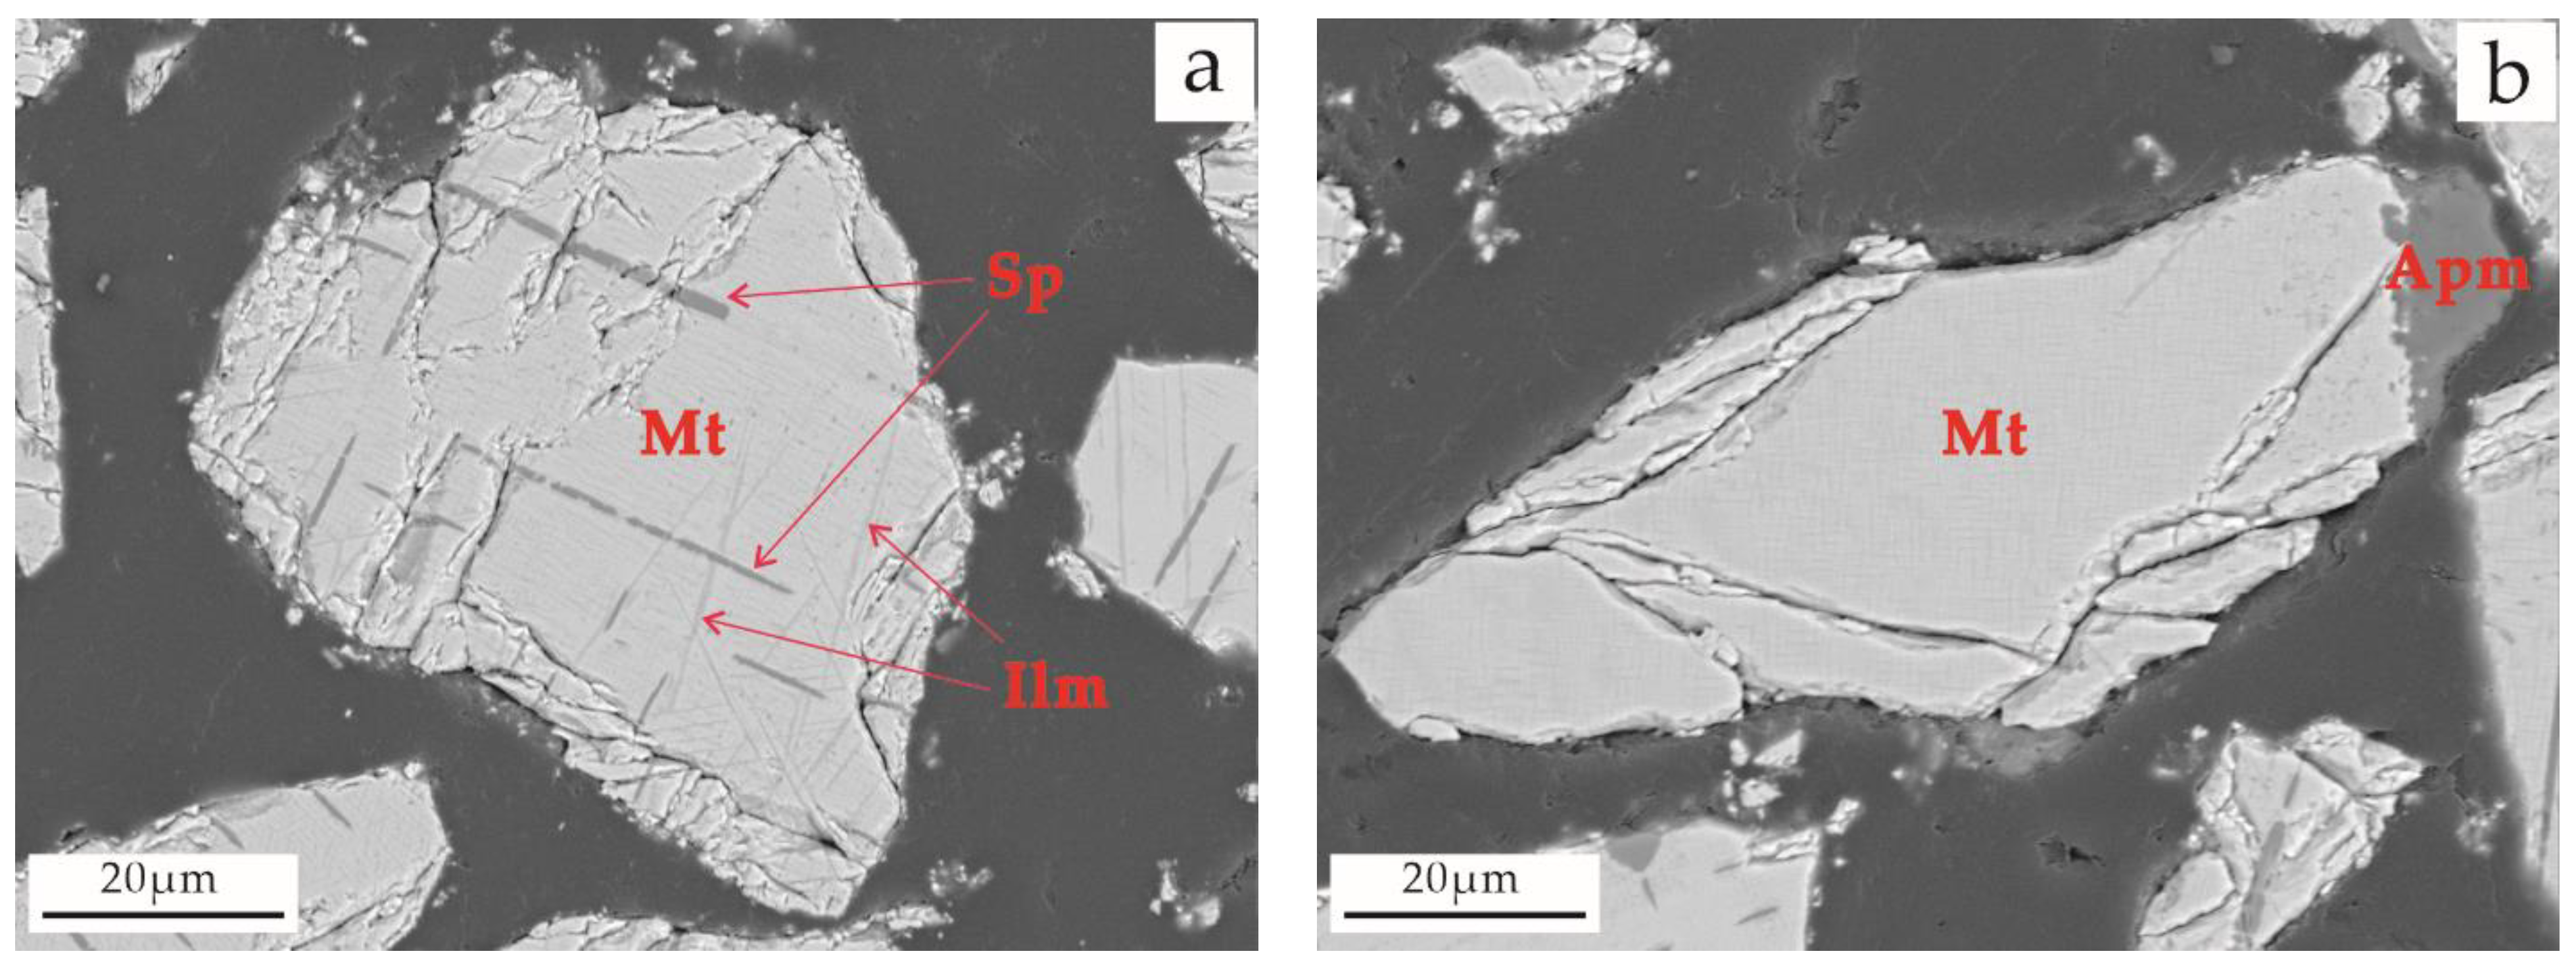
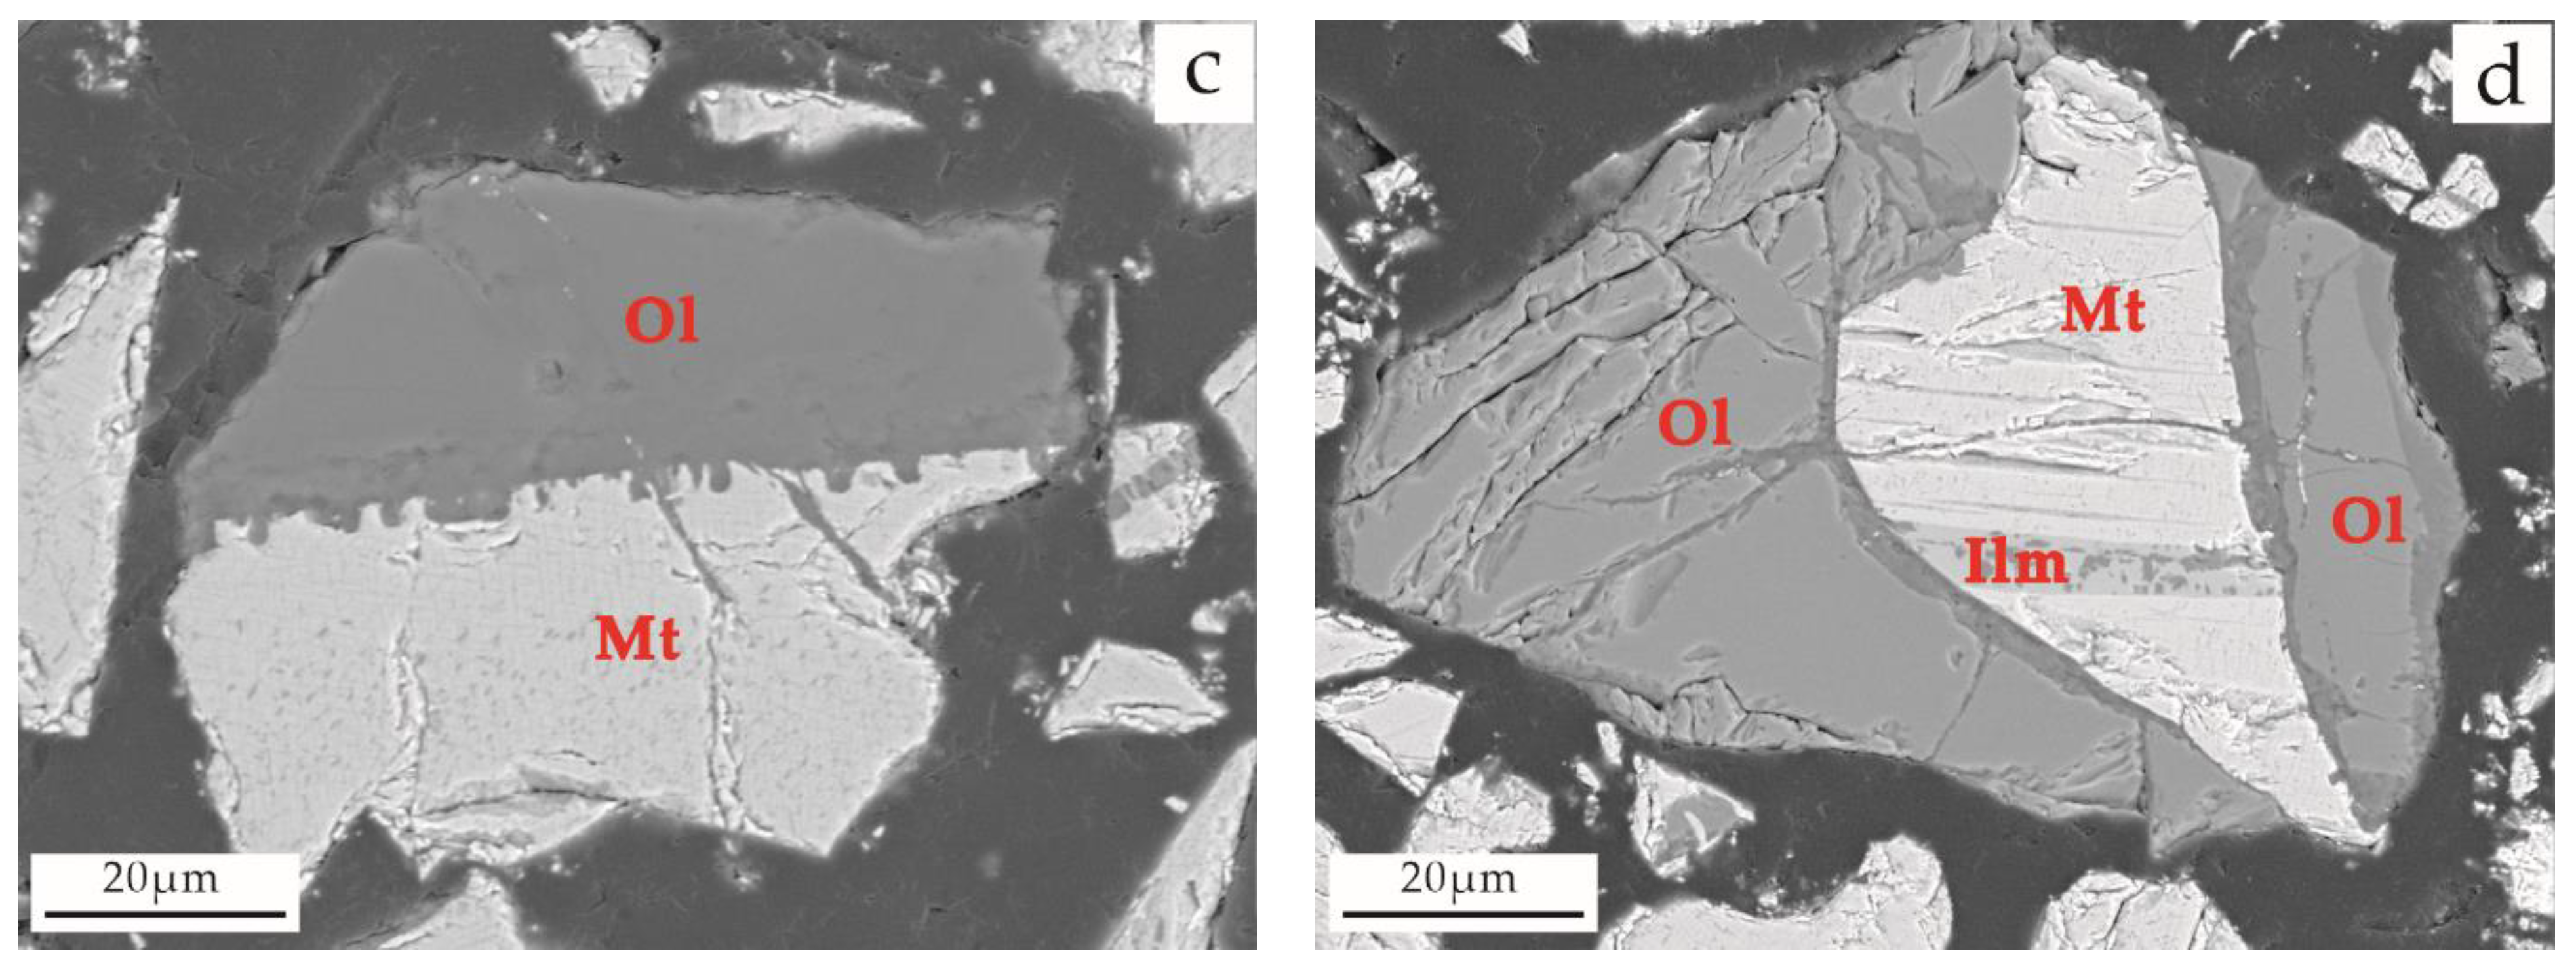
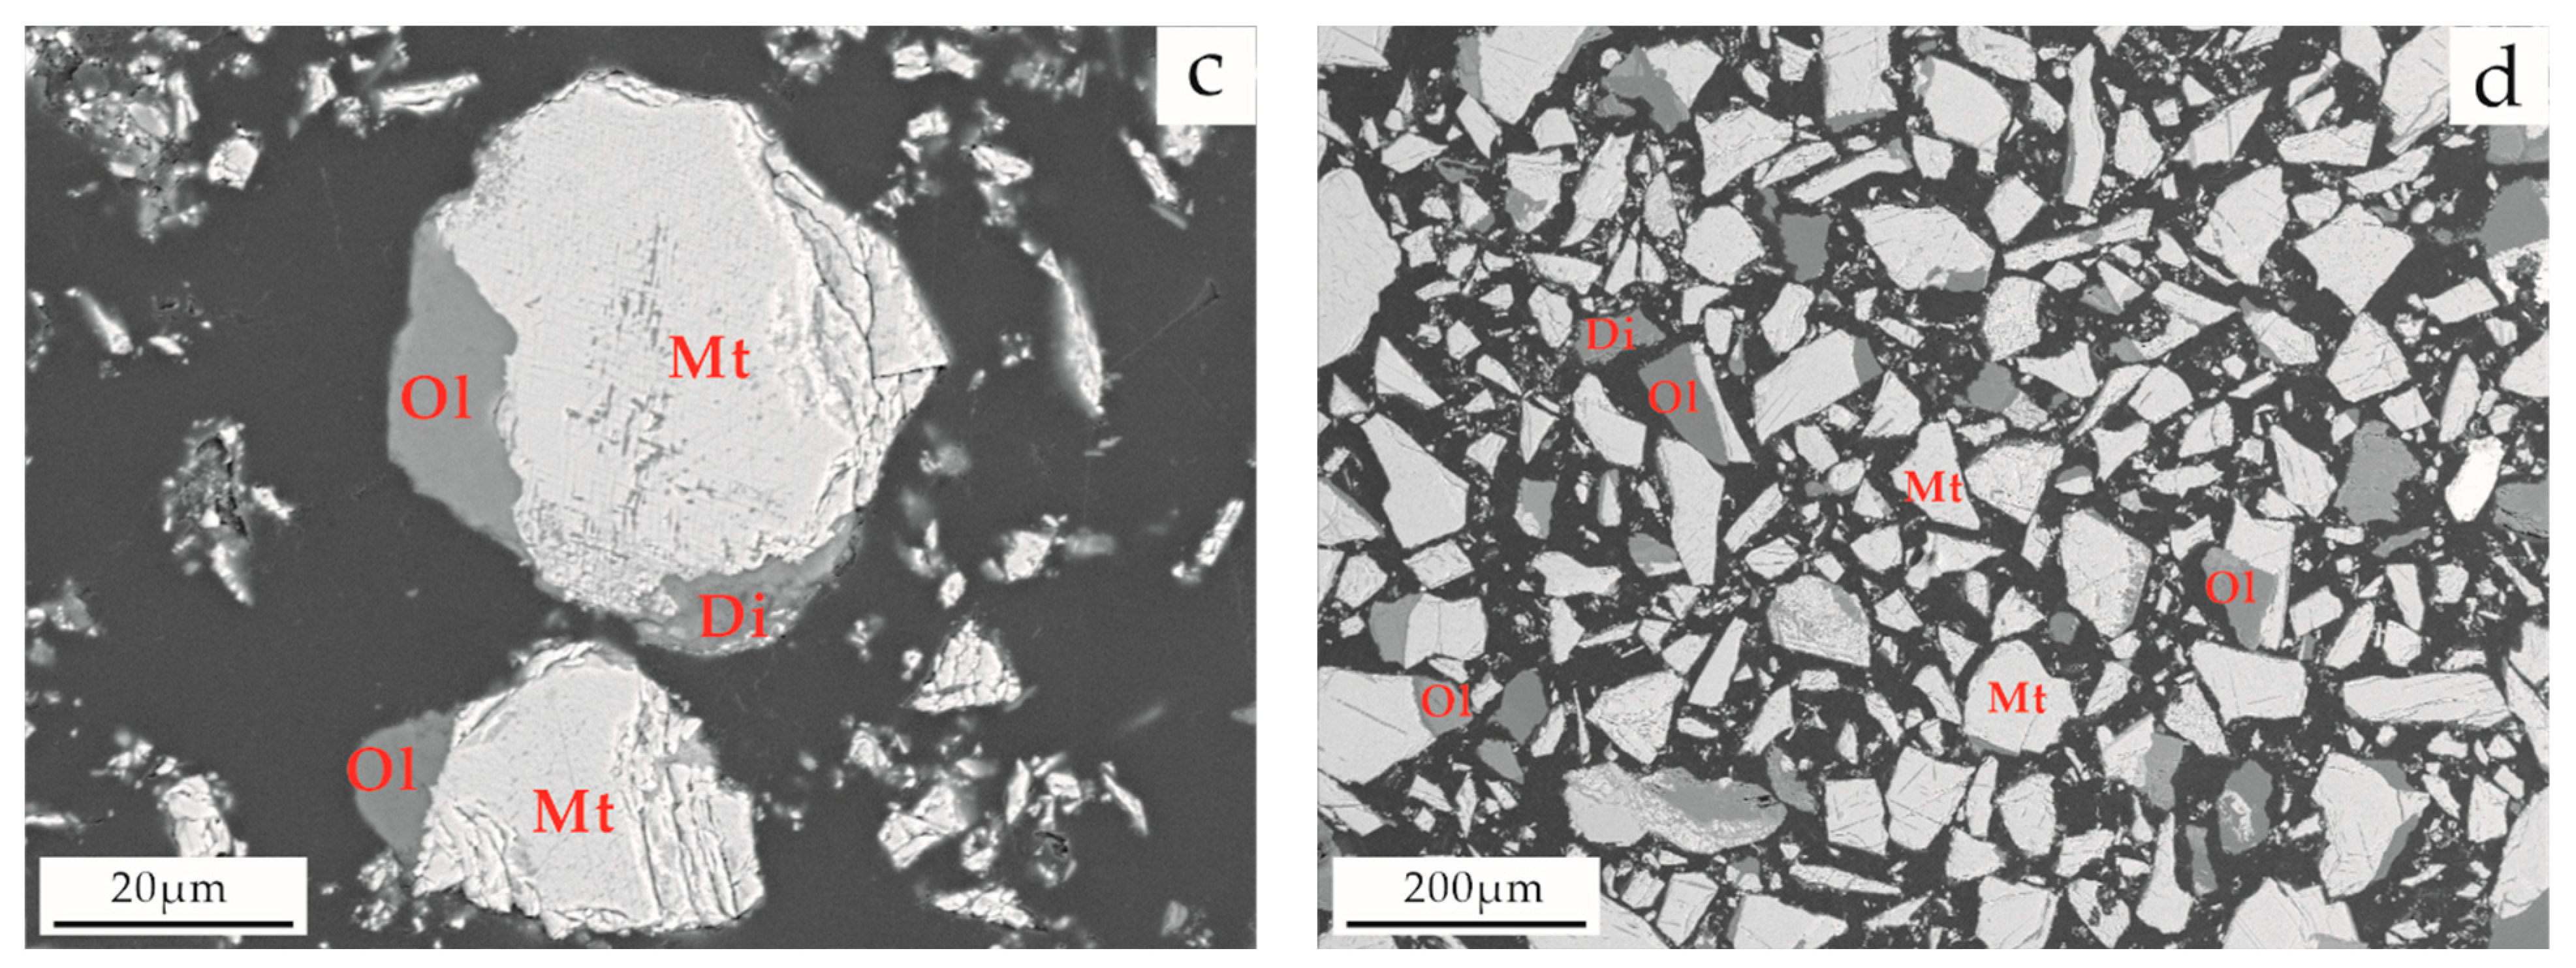
3.4.4. Intergrowth Characteristics of Titanium Magnetite and Other Minerals

The liberation characteristics of titanomagnetite show that although the proportion of liberated particles in the upgraded iron concentrate has increased, it is still only 32.2%. There are also 67.8% of titanium magnetite particles symbiotic with other minerals. Titanomagnetite is mainly associated with olivine, amphibole, and diopside (Figure 7). After conducting research with a scanning electron microscope (SEM), it was discovered that most of the titanomagnetite in the upgraded iron concentrate shows a symbiotic relationship with vein-shaped amphibole (Figure 7b,c), forming a reaction edge structure [23]. It can be inferred that the binding force of this reaction edge structure is quite robust, making it challenging to liberate via conventional ball milling. Spinel and titanium magnetite have a solid solution structure, wherein spinel fills the crystal gaps between titanium magnetite through fine veins [24,25], as shown in Figure 6a and Figure 7a. This solid solution structure is nearly impossible to fully liberate, leading to a decreased theoretical iron grade in titanomagnetite and a substantial concentration of magnesium and aluminum. Titanomagnetite not only forms a solid solution with spinel, but it also forms a solid solution structure with ilmenite (Figure 6a), which is also an important reason for the low grade of iron.

4. Discussion

The results of this study provide important insights into the mineralogical characteristics of vanadium titanomagnetite ore during the upgrading process at the Baima plant. As noted in the results, the Fe grade increased from 55.68% in the upgraded raw ore to 57.89% in the upgraded concentrate, demonstrating an effective enrichment through magnetic separation. However, the final Fe grade remains below industry standards for high-quality iron concentrates, which are typically >62% [26,27]. There are several mineralogical factors constraining Fe recovery during upgrading.
Firstly, titanomagnetite contains high levels of impurity elements like Ti, Mg, Al, Cr, and Mn substituting into the crystal structure, as revealed via the EPMA analysis. This leads to a reduced theoretical Fe content in the titanomagnetite of just 65.08%. Strategies to remove these impurities and purify titanomagnetite could boost the Fe grade. For instance, reverse flotation using reagents that target the surface properties of gangue minerals has been applied for titanomagnetite beneficiation [28].
Secondly, the proportion of liberated titanomagnetite particles was only 32.2% in the upgraded concentrate, with the majority occurring as mostly liberated or in locked composite particles associated with gangue phases. In particular, amphibole and diopside were found to be closely intergrown with titanomagnetite along vein structures, making liberation difficult. More aggressive grinding to expose grain boundaries may be required to increase mineral liberation [29]. Extending grinding to further liberate titanomagnetite is an option, but its impact may be limited. While an additional size reduction could decrease the composite particles, it may also undesirably slime the liberated fraction. Ultrafine grinding into the nanoscale range could also be considered to weaken or destroy the crystal structure and facilitate separation [30].
Thirdly, spinel and ilmenite exhibit complete solid solution intergrowths with titanomagnetite. These composite particles will dilute and contaminate the final concentrate. Alternative separation methods not relying on liberation, like ore sorting or selective flocculation, could potentially reject composite particles and improve the concentrate quality [31,32].
Overall, this study successfully applied advanced characterization techniques like the AMICS and EPMA to reveal the relationship between mineralogy and separation efficiency during vanadium titanomagnetite upgrading. The results identify targets like impurity substitution, composite intergrowths, and poor liberation limiting iron recovery. Follow-up work should explore new processing routes to address these constraints and continue to improve the concentrate grade and quality. Implementing the recommendations could help the Baima plant optimize utilization of this valuable ore deposit.

5. Conclusions

(1)
This study indicates that adding an appropriate amount of acetone before preparing resin-embedded fine-grained powder samples can effectively disperse the powder and prevent agglomeration, leading to improved data analysis precision using the AMICS.
(2)
After the upgrading process, the iron grade increased from 55.68% to 57.89%, and the titanomagnetite content increased from 77.41% to 82.10%. The improvement effect is evident.
(3)
Titanomagnetite contains titanium, magnesium, aluminum, chromium, manganese, and other impurity elements, which seriously affects the grade of iron in the iron concentrate. The grade of iron in titanomagnetite is calculated to be 65.08% based on the EPMA data analysis.
(4)
The main minerals that affect the grade of the iron concentrate are olivine, amphibole, diopside, and labradorite. Most of these gangue minerals are symbiotic with titanomagnetite, indicating that there is room for continued improvement.

6. Patents

We have already applied for an invention patent for “Petrographic light film preparation method of ultra-fine-grained powder samples”.

Author Contributions

Conceptualization, X.Z., H.H. and S.L.; methodology, X.Z., S.L. and J.G.; investigation, J.G.; Formal analysis, J.G. and Z.S., resources, Z.S. and X.Z; data curation, F.Z.; writing—original draft preparation, X.Z.; writing—review and editing, H.H.; visualization, H.H.; supervision, F.Z.; funding acquisition, X.Z. and F.Z. All authors have read and agreed to the published version of the manuscript.

Funding

This work was supported by the National Basic Research and Development Program of China (2013CB632600).

Data Availability Statement

The data presented in this study are available on request from the corresponding author. The data are not publicly available due to privacy restrictions.

Acknowledgments

This work was supported by the National Basic Research and Development Program of China (2013CB632600).

Conflicts of Interest

All authors was employed by the company Pangang Group Research Institute Co., Ltd. The authors declare that the research was conducted in the absence of any commercial or financial relationships that could be construed as a potential conflict of interest.

References

  1. Chen, S.; Fu, X.; Chu, M.; Liu, Z.; Tang, J. Life Cycle Assessment of the Comprehensive Utilisation of Vanadium Titano-Magnetite. J. Clean. Prod. 2015, 101, 122–128. [Google Scholar] [CrossRef]
  2. Luo, J.H.; Qiu, K.H.; Qiu, Y.C.; Zhang, P.C. Studies of Mineralogical Characteristics on Vanadium Titanium Magnetite in Hongge Area, Panzhihua, Sichuan, China. Adv. Mater. Res. 2013, 813, 292–297. [Google Scholar] [CrossRef]
  3. Liu, L.; Du, T.; Tan, W.; Zhang, X.; Yang, F. A Novel Process for Comprehensive Utilization of Vanadium Slag. Int. J. Miner. Metall. Mater. 2016, 23, 156–160. [Google Scholar] [CrossRef]
  4. Zhu, F.; Ma, Z.; Gao, G.; Qiu, K.; Peng, W. Process Mineralogy of Vanadium Titanomagnetite Ore in Panzhihua, China. Separations 2023, 10, 147. [Google Scholar] [CrossRef]
  5. Guo, X.; Dai, S.; Wang, Q. Influence of Different Comminution Flowsheets on the Separation of Vanadium Titano-Magnetite. Miner. Eng. 2020, 149, 106268. [Google Scholar] [CrossRef]
  6. Gilligan, R.; Nikoloski, A.N. The Extraction of Vanadium from Titanomagnetites and Other Sources. Miner. Eng. 2020, 146, 106106. [Google Scholar] [CrossRef]
  7. Pang, K.-N.; Zhou, M.-F.; Qi, L.; Shellnutt, G.; Wang, C.Y.; Zhao, D. Flood Basalt-Related Fe–Ti Oxide Deposits in the Emeishan Large Igneous Province, SW China. Lithos 2010, 119, 123–136. [Google Scholar] [CrossRef]
  8. Liu, P.-P.; Zhou, M.-F.; Ren, Z.; Wang, C.Y.; Wang, K. Immiscible Fe- and Si-Rich Silicate Melts in Plagioclase from the Baima Mafic Intrusion (SW China): Implications for the Origin of Bi-Modal Igneous Suites in Large Igneous Provinces. J. Asian Earth Sci. 2016, 127, 211–230. [Google Scholar] [CrossRef]
  9. Chen, C.; Zhang, Y.-H.; Zhang, S.-X.; Zhou, M.-K. Research on the process of improving iron and reducing impurities by magnetic separation of Panzhihua iron concentrate. Multipurp. Util. Miner. Resour. 2018, 2, 69–73. (In Chinese) [Google Scholar] [CrossRef]
  10. Li, Y. Mineralogical Characteristics and Genetic Significance of Vanadium-Titanium Magnetite in Panxi Area. Master’s Thesis, Chengdu University of Technology, Chengdu, China, 2017. (In Chinese). [Google Scholar]
  11. Zhong, X.; Shi, Z.; Gao, J. Discussion on the process mineralogy of Baima vanadium titanium magnetite in Panxi area. Metall. Anal. 2021, 41, 29–35. (In Chinese) [Google Scholar] [CrossRef]
  12. Zheng, Q.; Wu, W.; Bian, X. Investigations on Mineralogical Characteristics of Rare Earth Minerals in Bayan Obo Tailings during the Roasting Process. J. Rare Earths 2017, 35, 300–308. [Google Scholar] [CrossRef]
  13. Li, Y.; Han, Y.; Sun, Y.; Gao, P.; Li, Y.; Gong, G. Growth Behavior and Size Characterization of Metallic Iron Particles in Coal-Based Reduction of Oolitic Hematite–Coal Composite Briquettes. Minerals 2018, 8, 177. [Google Scholar] [CrossRef]
  14. Leißner, T.; Bachmann, K.; Gutzmer, J.; Peuker, U.A. MLA-Based Partition Curves for Magnetic Separation. Miner. Eng. 2016, 94, 94–103. [Google Scholar] [CrossRef]
  15. Pszonka, J.; Schulz, B.; Sala, D. Application of Mineral Liberation Analysis (MLA) for Investigations of Grain Size Distribution in Submarine Density Flow Deposits. Mar. Pet. Geol. 2021, 129, 105109. [Google Scholar] [CrossRef]
  16. Schulz, B.; Merker, G.; Gutzmer, J. Automated SEM Mineral Liberation Analysis (MLA) with Generically Labelled EDX Spectra in the Mineral Processing of Rare Earth Element Ores. Minerals 2019, 9, 527. [Google Scholar] [CrossRef]
  17. Sripal, E.; Grant, D.; James, L. Application of SEM Imaging and MLA Mapping Method as a Tool for Wettability Restoration in Reservoir Core Samples for SCAL Experiments. Minerals 2021, 11, 285. [Google Scholar] [CrossRef]
  18. Jiao, Y.; Qiu, K.-H.; Zhang, P.-C.; Li, J.-F.; Zhang, W.-T.; Chen, X.-F. Process Mineralogy of Dalucao Rare Earth Ore and Design of Beneficiation Process Based on AMICS. Rare Met. 2020, 39, 959–966. [Google Scholar] [CrossRef]
  19. She, H.-D.; Fan, H.-R.; Yang, K.-F.; Li, X.-C.; Yang, Z.-F.; Wang, Q.-W.; Zhang, L.-F.; Wang, Z.-J. Complex, Multi-Stage Mineralization Processes in the Giant Bayan Obo REE-Nb-Fe Deposit, China. Ore Geol. Rev. 2021, 139, 104461. [Google Scholar] [CrossRef]
  20. Xu, W.; Shi, B.; Tian, Y.; Chen, Y.; Li, S.; Cheng, Q.; Mei, G. Process Mineralogy Characteristics and Flotation Application of a Refractory Collophanite from Guizhou, China. Minerals 2021, 11, 1249. [Google Scholar] [CrossRef]
  21. ISO/TS 2597-4:2019; Iron Ores Determination of Total Iron Content Part 4: Potentiometric Titration Method. Available online: https://www.iso.org/standard/50478.html (accessed on 11 October 2023).
  22. Zelenova, I.M. Iron-Ore Concentrates in Iron-Powder Production. Steel Transl. 2009, 39, 827–830. [Google Scholar] [CrossRef]
  23. Bonadiman, C.; Nazzareni, S.; Coltorti, M.; Comodi, P.; Giuli, G.; Faccini, B. Crystal Chemistry of Amphiboles: Implications for Oxygen Fugacity and Water Activity in Lithospheric Mantle beneath Victoria Land, Antarctica. Contrib. Mineral. Petrol. 2014, 167, 984. [Google Scholar] [CrossRef]
  24. Harrison, R.J.; Putnis, A. Magnetic Properties of the Magnetite-Spinel Solid Solution: Curie Temperatures, Magnetic Susceptibilities, and Cation Ordering. Am. Mineral. 1996, 81, 375–384. [Google Scholar] [CrossRef]
  25. Harrison, R.J.; Putnis, A. The Magnetic Properties and Crystal Chemistry of Oxide Spinel Solid Solutions. Surv. Geophys. 1998, 19, 461–520. [Google Scholar] [CrossRef]
  26. Pownceby, M.I.; Clout, J.M.F. Importance of Fine Ore Chemical Composition and High Temperature Phase Relations: Applications to Iron Ore Sintering and Pelletising. Miner. Process. Extr. Metall. 2003, 112, 44–51. [Google Scholar] [CrossRef]
  27. Dhana Raju, R. Placer Magnetite-Sand and By-Product Iron, Generated during the Beneficiation of Mineral Sand Ilmenite to High-Titanium Products, as Potential Alternatives to the High-Grade Fe-Ore for Steel Making. J. Geol. Soc. India 2022, 98, 165–168. [Google Scholar] [CrossRef]
  28. Xiao, J.; Chen, C.; Ding, W.; Peng, Y.; Chen, T.; Zou, K. Extraction of Phosphorous from a Phosphorous-Containing Vanadium Titano-Magnetite Tailings by Direct Flotation. Processes 2020, 8, 874. [Google Scholar] [CrossRef]
  29. Kumar, A.; Sahu, R.; Tripathy, S.K. Energy-Efficient Advanced Ultrafine Grinding of Particles Using Stirred Mills—A Review. Energies 2023, 16, 5277. [Google Scholar] [CrossRef]
  30. He, H.; Cao, J.; Duan, N. Novel Bead-Milling Mechanically Pulverized Bulk Mineral Particles to Ultrafine Scale: Energy Storage and Cleaner Promotion of Mineral Extraction. J. Clean. Prod. 2018, 198, 46–53. [Google Scholar] [CrossRef]
  31. Wills, B.A.; Finch, J. Wills’ Mineral Processing Technology: An Introduction to the Practical Aspects of Ore Treatment and Mineral Recovery; Butterworth-Heinemann: Boston, MA, USA, 2015; ISBN 978-0-08-097054-7. [Google Scholar]
  32. Bamber, A.S. Integrated Mining, Pre-Concentration and Waste Disposal Systems for the Increased Sustainability of Hard Rock Metal Mining. Ph.D. Thesis, University of British Columbia, Vancouver, BC, Canada, 2008. [Google Scholar]
Figure 1. Process flow diagram for iron concentrate upgrading at a processing plant in Baima.
Separations 10 00574 g001
Figure 2. Agglomeration phenomenon of powder samples. (a) Backscatter picture; (b) AMICS coloring picture.
Separations 10 00574 g002
Figure 3. Particle phase diagram of different samples identified using AMICS. (a) The upgraded raw ore; (b) upgraded iron concentrate; (c) upgraded tailings.
Separations 10 00574 g003
Figure 4. Particle size distribution of titanomagnetite.
Separations 10 00574 g004
Figure 5. Titanomagnetite-locking and -liberation characteristics. The liberation degrees for the four categories are as follows: “liberated” is 100%, “mostly liberated” is <100% and ≥75%, “middling” is <75% and ≥25%, and “locked” is <25%.
Separations 10 00574 g005
Figure 6. SEM backscattered electron image of titanomagnetite with different liberation degree. (a) Liberated, (b) mostly liberated, (c) middling, and (d) locked. Mineral symbols: Mt = titanomagnetite, Ilm = ilmenite, Ol = olivine, Sp = Spinel, Apm = Amphibole.
Separations 10 00574 g006aSeparations 10 00574 g006b
Figure 7. SEM backscattered electron image of titanomagnetite. (a) The solid solution structure between titanomagnetite and spinel, (b) the symbiotic relationship between titanomagnetite and acicular amphibole, (c) the symbiotic relationship between titanomagnetite and olivine, (d) the symbiotic relationship between titanomagnetite and other minerals. Mineral symbols: Mt = titanomagnetite, Ilm = ilmenite, Ol = olivine, Sp = Spinel, Apm = Amphibole, Di = Diopside.
Separations 10 00574 g007aSeparations 10 00574 g007b
Table 1. The main chemical composition of upgraded raw ore, upgraded iron concentrate, and upgraded tailings.
Sample TypeMain Chemical Composition (wt. %)
TFeTiO2V2O5SiO2CaOMgOAl2O3
Upgraded raw ore55.6810.110.704.000.353.953.66
Upgraded iron concentrate57.8910.300.742.850.223.173.34
Upgraded tailings15.626.59<0.132.063.9819.939.46
Table 2. The mineral composition of upgraded raw ore, upgraded iron concentrate, and upgraded tailings.
Mineral NameMineral Composition (wt. %)
Upgraded Raw OreUpgraded Iron ConcentrateUpgraded Tailings
Titanomagnetite77.4182.101.36
Olivine8.025.8644.51
Amphibole3.373.0610.41
Labradorite3.222.0418.57
Diopside3.081.8513.63
Ilmenite2.092.536.12
Pyrrhotite1.070.921.72
Spinel0.940.971.33
Biotite0.310.150.79
Anorthite0.170.080.80
Titanite0.160.300.16
Cobalt pentlandite0.040.020.04
Pentlandite0.030.020.04
Albite0.030.060.30
Apatite0.020.010.11
Chalcopyrite0.020.020.03
Potassium feldspar0.020.010.08
Table 3. The iron element distribution of upgraded raw ore, upgraded iron concentrate, and upgraded tailings.
Mineral NameIron Element Distribution (%)
Upgraded Raw OreUpgraded Iron ConcentrateUpgraded Tailings
Titanomagnetite91.0593.145.52
Olivine4.162.5152.18
Ilmenite1.381.4513.94
Pyrrhotite1.291.086.99
Amphibole1.031.0210.59
Diopside0.570.328.13
Spinel0.380.391.83
Biotite0.060.030.61
Pentlandite0.040.030.09
Cobalt pentlandite0.020.010.06
Chalcopyrite0.020.020.06
Table 4. The titanium element distribution of upgraded raw ore, upgraded iron concentrate, and upgraded tailings.
Mineral NameTitanium Element Distribution (%)
Upgraded Raw OreUpgraded Iron ConcentrateUpgraded Tailings
Titanomagnetite88.8587.863.95
Ilmenite10.2110.9587.56
Diopside0.690.256.58
Titanite0.250.941.91
Table 5. The average chemical composition of titanomagnetite.
Chemical CompositionsFeOFe2O3TiO2MgOAl2O3V2O5MnOTotal
100 spots average30.5061.505.300.421.820.150.1999.88
Disclaimer/Publisher’s Note: The statements, opinions and data contained in all publications are solely those of the individual author(s) and contributor(s) and not of MDPI and/or the editor(s). MDPI and/or the editor(s) disclaim responsibility for any injury to people or property resulting from any ideas, methods, instructions or products referred to in the content.

