Article

Examination of Volatile Signatures of Fusarium Bulb Rot in Garlic Using Proton-Transfer-Reaction Time-of-Flight Mass Spectrometry and Solid-Phase Microextraction Gas Chromatography/Mass Spectrometry

1
Research Centre for Plant Protection and Certification of Rome, 00184 Rome, Italy
2
Department of Agriculture, Food, Environment and Forestry (DAGRI), University of Florence, 50144 Florence, Italy
3
Fondazione per il Futuro delle Città (FFC), 50127 Florence, Italy
4
Research Centre for Engineering and Agro-Food Processing, 00189 Rome, Italy
5
Department of Drug Chemistry and Technology, Sapienza University, 00185 Rome, Italy
*
Author to whom correspondence should be addressed.
Separations 2023, 10(11), 556; https://doi.org/10.3390/separations10110556
Submission received: 1 October 2023 / Revised: 25 October 2023 / Accepted: 30 October 2023 / Published: 31 October 2023
(This article belongs to the Special Issue Application of Chromatography in Analytical Chemistry)

Abstract

:
Fusarium bulb rot, caused by Fusarium proliferatum, is a worldwide disease of garlic, both in the open field and during storage. Early diagnosis of the disease during storage is difficult due to the morphology of the bulbs and cloves. Volatile organic compounds (VOCs) are secondary metabolites produced by several microorganisms, including phytopathogenic fungi and bacteria. In recent years, the development of several techniques for the detection and characterization of VOCs has prompted their use, among others, as a diagnostic tool for the early and non-destructive analysis of many diseases of species of agricultural interest. In this paper, proton-transfer-reaction time-of-flight mass spectrometry (PTR-ToF-MS) and solid-phase microextraction gas chromatography/mass spectrometry (SPME-GC/MS) were successfully utilized to characterize the volatolome of commercial garlic cloves, artificially and naturally infected with F. proliferatum, for the early discrimination between diseased and healthy ones. A partial least squares discriminant analysis (PLSDA) and a principal component analysis (PCA) allowed for the separation of infected and healthy cloves and the identification of specific VOCs produced by the fungus during the infection. The results obtained in this work could be utilized for the development of simpler, more economical, and more portable devices for the early detection of infected garlic bulbs during storage.

1. Introduction

Garlic (Allium sativum L.) is an important monocotyledon crop used worldwide for its organoleptic, nutritional, and therapeutic properties [1,2]. During the last few years, Fusarium proliferatum has been identified as the main causal agent of clove rot during garlic storage and of stem and bulb rot in the field [3,4,5,6,7,8,9,10,11]. The botanic structure of garlic bulbs (the presence of outer tunics, i.e., the dry sheaths of older foliage leaves) covering the edible cloves, in turn presenting dry, protective leaves of different colors, favors the development of the fungus and hampers the early diagnosis of the disease. The first evidence of the infection process showed that the fungus penetrates garlic cloves at the outline/contour of their basal plates when the roots emerge [12]. Fungi produce a vast number (>300) of organic carbon compounds, named volatile organic compounds (VOCs), that have high enough vapor pressures that, under normal conditions, vaporize and enter the atmosphere significantly [13]. They represent the basis of the good smell of many human edible products (wine, truffles, cheese) or the bad smell of rotten vegetables, water-damaged indoors, waste, etc. The study of their composition and functions constitutes a new “omics”, the volatome (or sometimes the volatilome), that spans several research fields, from human diseases to agriculture and ecology, among many others [14]. VOCs are also involved in the crosstalk of many fungi with plants or other microorganisms [13,15].
The analysis of VOC profiles can be influenced by several factors, among which the choice of the analytical method used is essential for their accurate and reliable characterization. Proton-transfer-reaction time-of-flight mass spectrometry (PTR-ToF-MS) and solid-phase microextraction gas chromatography/mass spectrometry (SPME-GC/MS) are two analytical techniques particularly suited for the study of VOCs from different origins and matrices. PTR-ToF-MS was proposed as a fast technique able to provide a comprehensive mass spectrum with high-time resolution for VOC detection and quantification. It is a powerful tool that enables the detection of trace compounds (down to a few pptv) and low-molecular-weight compounds (such as hydrocarbons, aldehydes, and alcohols) that may escape detection by GC-MS; however, isomeric compounds are ambiguously identified. On the other side, SPME is a sample technique to extract volatile analytes from various types of matrices in the food, environmental, biological, and pharmaceutical sectors. An advantage of SPME is that small amounts of sample are sufficient, as this technique ensures both sampling and concentration of analytes simultaneously. Furthermore, no solvent is required, and no pre-treatment of the sample under examination is necessary, thus avoiding any type of alteration and without inducing artifacts. As reported in previous works, this sampling technique was more than suitable for the analysis of the volatile fraction of fresh garlic samples [16,17].
In this work, we combined these two instrumental approaches thanks to the complementarity of their analytical potential, i.e., efficient separation and identification of analytes (SPME/GC-MS) and quantitative and rapid analysis (PTR-ToF-MS). The correlation between the obtained data allowed for a complete fingerprint of the volatolomic profiles of healthy garlic cloves and garlic cloves that were artificially and naturally infected with F. proliferatum to develop a fast and reliable diagnostic tool for the diseases. Pure cultures of F. proliferatum grown on potato dextrose agar medium were also analyzed to characterize the possible presence of specific VOCs produced by the fungus in vitro.

2. Materials and Methods

2.1. Plant and Fungal Materials

Commercial garlic bulbs (provenience: Spain) were purchased at the supermarket. Prior to use, garlic cloves were manually and carefully peeled to avoid injuries to the surface and to remove naturally infected ones. A virulent isolate of Fusarium proliferatum (CREA-DC_ER 2169; “Voghiera 1”) was used for the in vitro VOC production study and for the artificial inoculations. The isolate was obtained from naturally infected cloves and identified based on morphology (presence and shape of microconidia, macroconidia, and polyphialides). The identification was further confirmed molecularly by extracting DNA and sequencing the translation elongation factor-1α (TEF-1α) [18].

2.2. Inoculation Technique

The artificial inoculation technique for detached peeled cloves, previously developed in [19,20], was used with some modifications as follows: peeled, healthy cloves were surface-disinfected by soaking in 2% NaOCl for 5 min, washed three times with sterile water, and dried on sterile paper. A wound of 3 mm in depth was produced by a sterile needle on the dorsal side of each clove. A small plug (5 mm in diameter) of the fungus, obtained with the aid of a sterile corkborer from a one-week culture grown on potato dextrose agar (PDA), was placed upside down over each wounded clove. PDA plugs were used as a control. Inoculated, control, and naturally infected cloves were placed in humid chambers in sealed plastic boxes and incubated in the dark at 25 ± 2 °C for three weeks. Koch’s postulates were fulfilled by reisolating F. proliferatum on PDA. A selected number of naturally infected cloves were incubated under the same conditions to confirm the presence of the fungus. After incubation, three artificially infected cloves and three uninoculated ones were put in each jar for subsequent analyses. Three replications per treatment were used.
For the analyses of VOCs produced by the fungus in vitro, a small plug of F. proliferatum grown on PDA was placed upside down in the center of 6 cm PDA glass Petri dishes sealed with Parafilm or inside sterilized glass jars containing PDA that were tightly closed with a perforated cap in which a silicon membrane (4 mm thick) allowed for the insertion of the fiber for headspace sampling and incubated under the same conditions as the cloves. Glass Petri dishes and jars containing only PDA were used as controls.

2.3. PTR-ToF-MS Data Acquisition

The headspace measurements were performed with a PTR-ToF-MS 8000, provided by Ionicon Analytik GmbH (Innsbruck, Austria), in its standard configuration and using H3O+ as an ion donor. This instrument operated under controlled constant conditions, such as drift tube pressures of 2.20 mbar, an extraction voltage at the end of the tube of 35 V, and drift tube and inlet temperatures of 60 °C. The drift potential was set to 600 V, amounting to an E/N value of 130 Td (1 Td = 10–17 V cm−1). VOC data were collected over a range of mass-to-charge ratios (m/z) between 20 and 250 using an acquisition time of one spectrum every 1 s and 120 average spectra to evaluate the VOCs. In particular, for all samples, an average signal intensity recorded in the last 120 sec of a 5 min run was used, allowing for the acquisition of 120 average spectra. Therefore, we recorded each sample for 300 s but used the average of the last 120 s. In this way, most of the signals detected had reached a plateau.
The analysis setup adopted here was chosen following the procedure used by Taiti et al. [21]. The analyses were conducted on pure cultures of F. proliferatum and on artificially and naturally infected garlic bulbs. One glass Petri dish containing F. proliferatum on PDA or one fresh garlic bulb were weighed and subsequently placed into a 1/2 L Bormioli glass jar for the analysis. Before the analysis, each sample was flushed with cleaned air (zero air, peak scientific) and then incubated for two minutes at 25° with the aim of equilibrating the headspace of each sample. For every five samples, a blank (empty ¾ L Bormioli jar) was analyzed, and the values obtained were subtracted from each sample. Three replicates for each sample were analyzed. Raw data were acquired with the TofDaq™ software (Tofwerk AG, Thun, Switzerland). To reach good mass accuracy, data processing of PTR-ToF-MS spectra included dead-time correction, internal calibration of mass spectral data, and peak extraction [22]. The internal calibration was performed off-line and was based on m/z = 21.022 (H3O+), m/z = 29.997 (NO+), and m/z = 59.049 (C3H7O+). Data were expressed as ppbv. Subsequently, the data were filtered using a threshold of 1 ppbv to eliminate all signals related to ions present in trace amounts and, therefore, hard to quantify precisely. Moreover, peaks imputable to water chemistry (hydronium ions, water clusters) or other interfering ions (e.g., oxygen, nitrogen monoxide) were eliminated.

2.4. SPME of Garlic Cloves

Sampling using the SPME-GC/MS technique was performed as follows: three cloves of each infected and uninfected treatment were placed into the glass jar. For the extraction of volatiles, an SPME device from Supelco (Bellefonte, PA, USA) with a 1 cm fiber coated with 50/30μm DVB/CAR/PDMS (divinylbenzene/carboxen/polydimethylsiloxane) was used. Before use, the fiber was conditioned at 270 °C for 30 min. Each sample was equilibrated for 20 min at 40 °C before sampling. Later, the fiber was exposed to the headspace of the samples for 30 min at 40 °C to collect and concentrate the volatile compounds. Lastly, the SPME fiber was inserted in the GC injector maintained at 250 °C in spitless mode for desorption of the captured components. The chromatographic analyses of the headspace from the garlic cloves were carried out on a Clarus 500 model Perkin Elmer (Waltham, MA, USA) gas chromatograph coupled with a mass spectrometer equipped with an FID (flame detector ionization) and a Varian Factor Four VF-1 capillary column. The temperature oven program was performed according to De Santis et al. [20], with some modifications as follows: initially at 40 °C, then increased to 220 °C at 6°/min, and finally held for 10 min. Helium was used as the carrier gas at a constant flow rate of 1 mL/min. The mass spectrometer was operated at 70 eV (EI) in the scan mode in the range 35–350 m/z. The temperature of the ion source and the connection parts was 220 °C. A blank (empty ¾ L Bormioli jar) was analyzed before each sample, and the values obtained were subtracted from each sample. The identification of volatile compounds was performed by matching their mass spectra with those stored in the Wiley 2.2 and NIST 02 mass spectral library databases and by calculating the linear retention indices (LRIs) using a series of n-alkane standards (C8–C30) analyzed under the same conditions as those of the samples [20]. The LRIs were then compared with available retention data reported in the literature. The peak areas of the FID signal were used to calculate the relative concentrations of the components expressed as a percentage without the use of an internal standard or any factor correction. All analyses were carried out in triplicate.

2.5. Statistical Analysis

A preliminary principal component analysis (PCA) was conducted on different datasets (F. proliferatum grown in vitro, healthy/artificially inoculated/naturally infected commercial cloves) to explore the distribution of the data. PCA elaborates new hypothetical variables (components) accounting for as much as possible of the variance in the multivariate data [23,24]. These new variables are linear combinations of the original variables, and PCA uses the eigenvalues and eigenvectors from the correlation matrix of the original variables. The PCA was represented graphically using biplots, where the percentage of the explained variance (eigenvalues) for each axis, the plotted coordinates in the PC space (scores), and the vectors representing the importance of the variables (loading) were reported. A partial least squares discriminant analysis (PLSDA) approach was used to characterize healthy, artificially infected, and naturally infected commercial garlic cloves according to the VOCs identified with the PTR-ToF-MS technique. The PLSDA consists of a classical PLS regression analysis in which the response variable is categorical (Y-block; replaced by a set of dummy variables describing the healthy, artificially infected, and naturally infected commercial garlic cloves), expressing the class membership of the statistical units [25,26,27]. The entire dataset was subdivided into 3 different sub-datasets. The first one was composed of only healthy and artificially infected garlic cloves (32 samples), and the second one was composed of healthy, artificially infected, and naturally infected garlic clove groups (52 samples), considered to be 3 different groups. The third one is the same as the second one but considers two groups: healthy and infected (bringing together artificially and naturally infected samples). Each dataset was partitioned into 80% of the samples used for training and cross-validation, and the remaining 20% were used as an internal test. This partitioning was chosen based on the Euclidean distances calculated using the algorithm of Kennard and Stone [28] by selecting parameters without a priori knowledge of a regression model. The LV models with the highest mean performance value were the most robust, according to Swierenga et al. [29].
Moreover, the variable importance in projection (VIP) scores were calculated [30] and used to estimate the importance of each variable in predicting the correct identity according to the PLSDA model. The VOCs with VIP scores significantly higher than 1.2 were of major importance and potential candidates for discriminating between healthy and artificially infected commercial garlic cloves. The models used were developed using a procedure written in the MATLAB 7.1 R14 software.

3. Results

3.1. Artificial Inoculations

After two weeks of incubation, symptoms of infection, like those observed in naturally infected cloves, were present on inoculated cloves (Figure 1a). Fusarium proliferatum was always reisolated from symptomatic cloves artificially inoculated with the fungus (Figure 1b). On naturally infected cloves, after incubation in humid chambers, along with F. proliferatum, other saprophytic fungi belonging to Aspergillus and Penicillium species were sporadically observed.

3.2. VOC Analyses

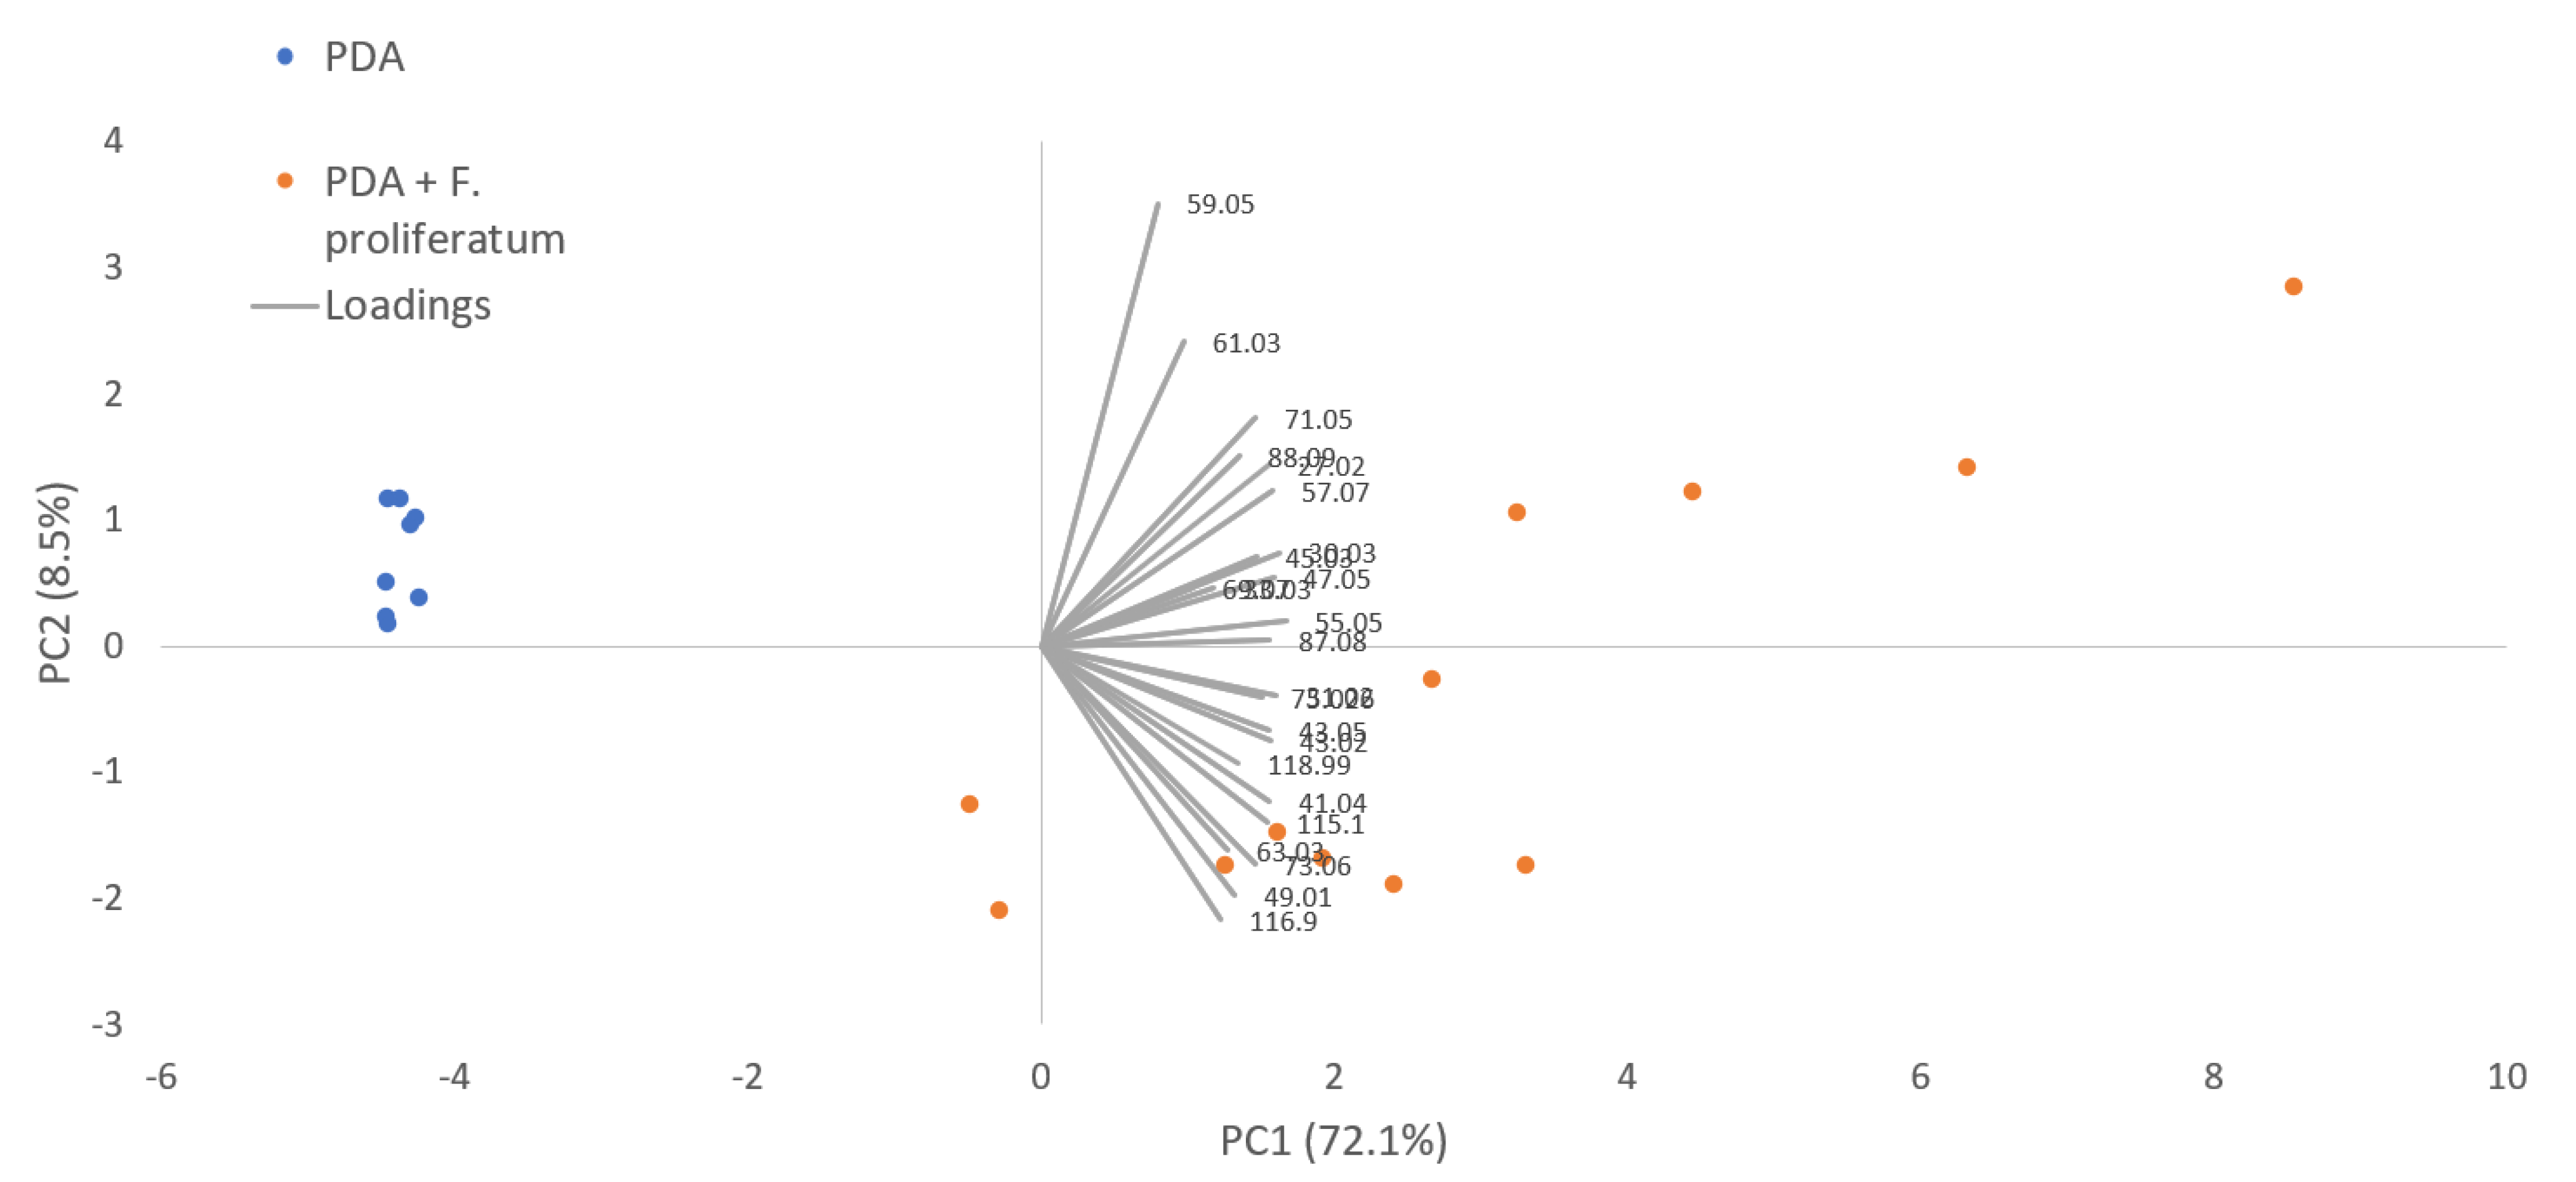
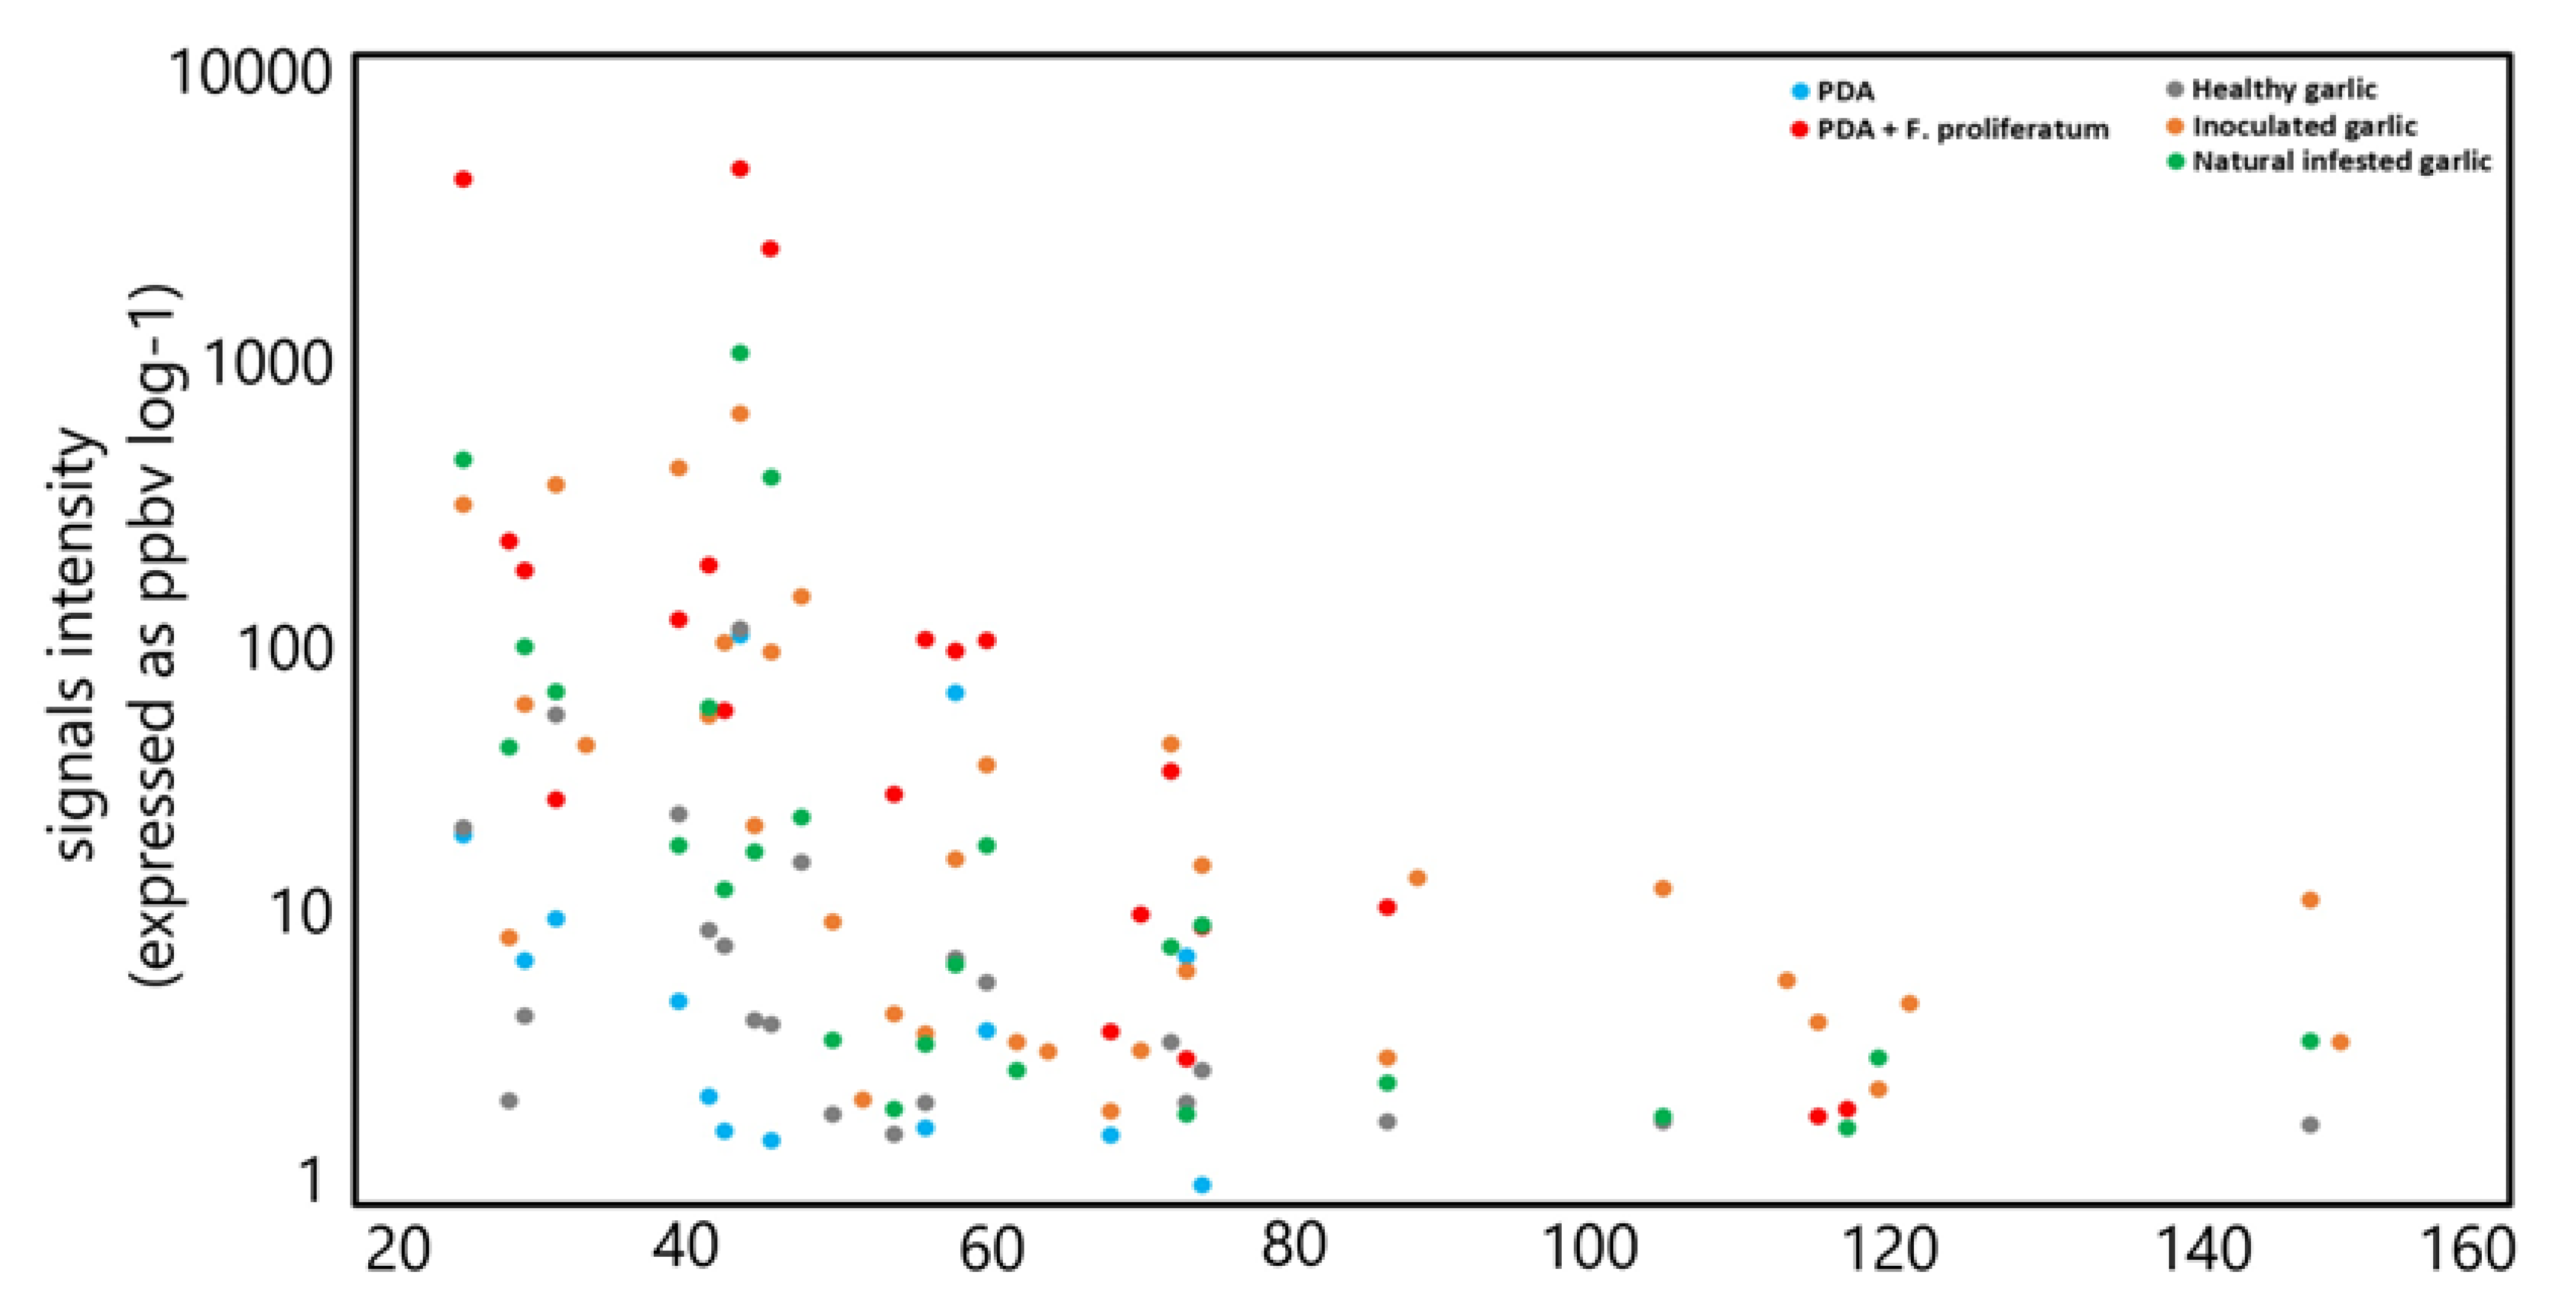
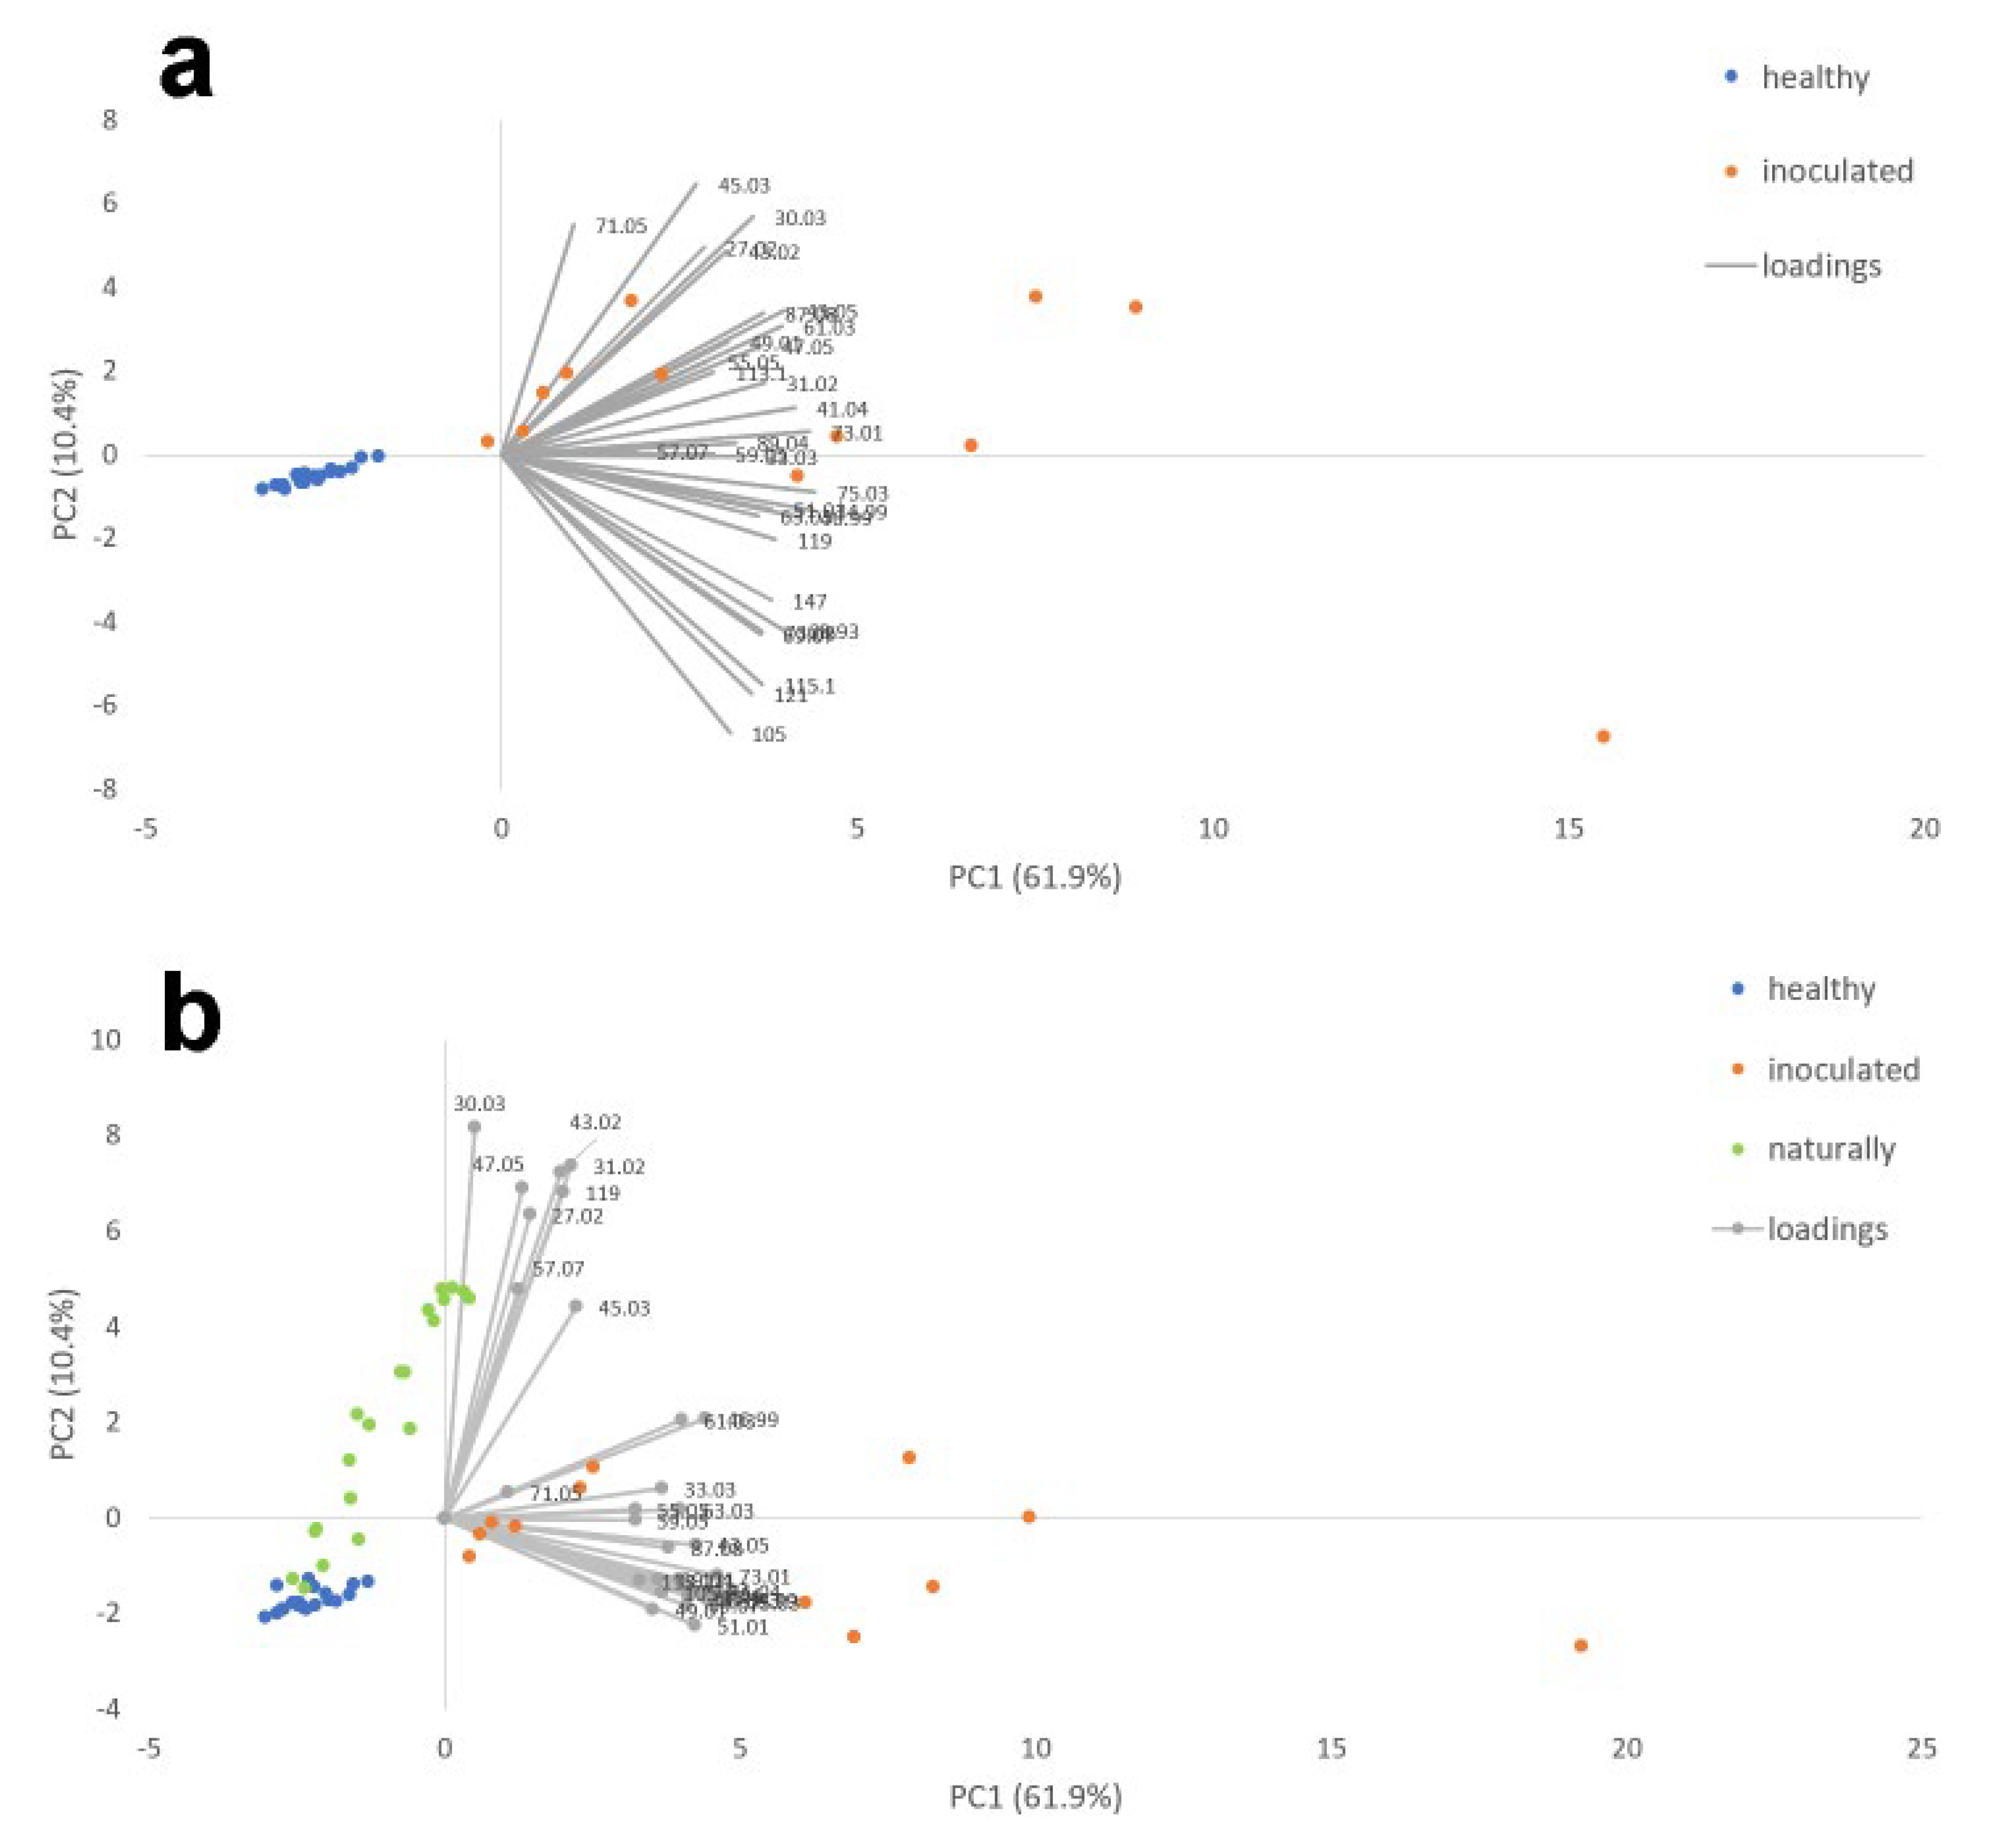
3.2.1. PTR-ToF-MS in Pure Cultures and Infected Garlic Bulbs

From the PTR analysis, applied both to pure cultures and commercial bulbs, a total of 36 tentatively identified compounds in the range of measured masses (20 < m/z < 149), derived from the protonation of various VOCs, were registered (Table 1). The average total emission test varied from a minimum of 212.19 ppbv by PDA to a maximum of 13,615.47 ppbv by F. proliferatum grown on potato dextrose agar, which showed the highest total VOC emission among all the samples studied. Among all sample types, the signal detected at m/z 45.033 (TI as acetaldehyde) (m/z 45.033) was always the most abundant VOC emission type (Table 1). In particular, acetaldehyde showed an average value of 94.10 and 5211.79 ppbv, respectively, in PDA without and with the fungus, while in the garlic in vivo test, the values ranged between 100.32 ppbv (healthy samples), 563.74 ppbv (inoculated samples), and 918.04 ppbv (naturally infected samples).
In the in vitro experiments, a total of 14 and 21 VOCs were detected, respectively, for PDA and PDA + F. proliferatum. Seven compounds, exclusively produced by the fungus, were detected at m/z 30.030 [TI as ethylene (isotope), m/z 71.049 (TI as 2,3-dihydrofuran)] and other sulfur compounds (detected at m/z 49.011, 55.057, 87.044, 115.060, and 116.982 as reported in Table 1). In Figure 2, the PCAs derived from the VOCs produced by F. proliferatum grown on PDA are reported.
From the PTR analysis applied to the in vivo test, a total of 21, 26, and 34 signals were registered, respectively, for healthy, naturally infected, and artificially inoculated samples. Eight signals (m/z 34.994, 53.021, 63.998, 69.074, 71.049, 89.040, 115.060, 121.014, and 149.041) were exclusively produced by the artificially inoculated garlic, while three (m/z 63.027, 71.049, and 118.994) were produced only by naturally and artificially infected ones. The garlic samples artificially inoculated with the fungus showed the highest number of signals emitted and the highest average emission of sulfur compounds, while the total VOC emission did not differ compared to the naturally infested garlic bulbs (Table 1). Moreover, the emission of S compounds was the highest in the infected samples (both natural and inoculated garlic) compared to the healthy samples.
The signals that showed (for each infected garlic sample) the highest emission intensity (with an average value of >100 ppbv) were low-molecular-weight compounds that have been detected in naturally and artificially infected garlic samples at m/z 27.022 (TI as acetylene), m/z 33.033 (TI as methanol), m/z 41.038 (TI as fragment), m/z 45.033 (TI as acetaldehyde), m/z 47.049 (TI as ethanol), and m/z 49.011 (TI as methanethiol). A similar trend, albeit with lower intensities, was observed in the control samples, except for the compound detected at m/z 47.049, which is emitted in small amounts. In Figure 3, the average emission intensity from different samples is reported.
In Figure 4a,b, the PCAs performed are reported considering two different datasets: the healthy and artificially inoculated cloves and the healthy, artificially, and naturally infected ones.
In Table 2, the results of PLSDA on three datasets (healthy vs. artificially infected garlic cloves; healthy vs. naturally infected garlic cloves; healthy vs. artificially infected vs. naturally infected garlic cloves) are reported. In particular, it is possible to observe for all three models high performances in classification (for both model/validation and independent test sets), very high specificities and sensitivities, and very low mean classification errors (always lower than 0.04%) and RMSEC.
After the PLSDA class-modeling approach, nine VOC scoring values greater than 1.2 (i.e., VOCs with a higher contribution in classification) were reported in Table 3.

3.2.2. SPME-GC/MS Analysis

For the in vitro analysis, no emissions were registered for PDA, while the presence of 1-butanol 3-methyl, 1-butanol 2-methyl, and pentane 2,2,4-trimethyl produced by the fungus was registered. As for the garlic clove experiments, diallyl disulfide was the only relevant VOC, followed by some minor compounds detected in traces (<0.1%) produced by the healthy commercial garlic cloves. On the other side, a total of 12 different VOCs were registered for the artificially infected ones and are listed in Table 4. All detected and identified compounds were sulfur compounds, with the exception of ethyl acetate. Among them, diallyl disulfide was found in all inoculates, and it was the major compound, ranging from 61.70% to 91.39%. The second most abundant component was thiirane, methyl- (6.70 to 19.60%). Allyl mercaptan and diacetyl sulfide were detected only in inoculates 5 and 6, respectively. Additionally, 1-propene-1-thiol was found in inoculant 1; on the contrary, all the other compounds were distributed quite homogeneously across almost all the investigated samples.
Therefore, in agreement with the PTR-ToF-MS data, an increase in sulfur compounds was recorded in the artificially infected samples. Furthermore, ethyl acetate was detected, which, unlike the sulfur compounds that, although with qualitative and quantitative variations, characterize garlic [31], would appear to be associated with the fungus. In this regard, in a previous study, it was reported that this volatile metabolite was a potential indicator of Fusarium growth on onions [32].

4. Discussion

VOCs are assuming an increasing interest in many research fields [33], spanning between plant–beneficial microbe interactions [34], plant pathogens–beneficial microbe interactions [35], diagnosis of fungi [9,36,37], diagnosis of pests [38], fungal lifestyle [39], soil ecology [40], and food technology [41]. In recent years, the analysis of volatile organic compounds, the so-called “separation science”, has made significant progress thanks to the development of a new generation of analytical technology, considerably enabling their fast and real-time detection and characterization [42]. In the present work, the volatome of garlic cloves (healthy, artificially inoculated, and naturally infected by F. proliferatum), along with that of the fungus grown in nutrient media, has been studied by applying two complementary techniques, PTR-ToF-MS and SPME-GC/MS, to set up a rapid and efficient diagnostic tool for Fusarium dry rot in garlic. Their combined application allowed overcoming some intrinsic limitations of the two techniques, i.e., the ambiguous identification of some compounds of the former and the displacement effect of analytes with a lower affinity toward the type of fiber used for SPME sampling.
PCA analysis performed on the in vitro test showed the ability of F. proliferatum to produce a characteristic bouquet of VOCs mainly composed of low-molecular-weight substances (alcohols, aldehydes, and esters). Nine VOCs with a VIP score of >1.2 were identified that could be potentially useful for discriminating between healthy and infected garlic cloves. Many of them were alcohols or responsible for the flavor and odor that develop through the metabolism of different fungi in many foods [42,43]. Acetaldehyde is a ubiquitous, very volatile carbonyl compound occurring in the metabolism of plant and animal organisms, which has recently caused concern as an indoor environment pollutant as a carcinogenic and suspected mutagenic compound [44]. It is commonly produced in many foods during the alcoholic fermentation of glucose by various microorganisms. The role of specific metabolic pathways of alcohol degradation and their role in fungal plant pathogens are not yet well understood [45].
As shown in Figure 4a,b, PCA performed after an in vitro analysis clearly discriminated between healthy and infected (both artificially inoculated and naturally) commercial garlic cloves through different patterns of VOC emission. In addition, a PLSDA analysis performed on the same dataset allowed for statistically discriminating between healthy and artificially and naturally infected garlic cloves. The three sub-databases showed very high classification performances and low errors. Indeed, VIP scores are used to estimate the importance of each variable in the PLS-based models. The VOCs that emerged with higher VIP values tend to be more important than others, even if it does not mean that a variable with a low VIP is not relevant for the model. Using SPME-GC/MS on artificially inoculated commercial garlic, diallyl disulfide was the most represented VOC (average percentage of 77.6 ± 10.1), followed by thiirane, methyl- (15.5 ± 5.04), and ethyl acetate (6.41 ± 3.17), already known as a probable indicator metabolite of the presence of Fusarium [32]. According to Guo et al. [39] and also in our work, a higher number of compounds, in particular short-chain carbonyl compounds, were detected by PTR-ToF-MS than by SPME-GC/MS. Sulfur compounds were among the most represented VOCs in our samples; these compounds are the second largest VOC category in food after esters and play an important role in the development of the aroma of food, including some mushrooms [46]. In Allium spp., they contribute to the typical taste and aroma of garlic after the transformation of allicin into volatile sulfuric compounds following physical tissue destruction [47]. In garlic, a VOC analysis by SPME was used to highlight possible cold damage during storage [48], the beneficial effect of ozone treatment in controlling garlic rot decay from Fusarium [20], and the changes in the aromatic profile due to processing [16] or depending on the geographical origin [49].
PTR-ToF-MS has been successfully used for the identification of different Fusarium spp. [18] and truffles [50] and for the detection of durum wheat samples exceeding the legal limits of deoxynivalenol (DON) [9]. Rapid diagnosis of Fusarium rot in garlic is hampered by the presence of teguments that mask the presence of early symptoms of the disease. The VOC analyses carried out in this work could thus represent an interesting tool for the early detection of the disease, reducing the risk of disease development during storage. Recently, electronic nose (e-nose) devices, through the application of an array of non-specific sensors and a suitable pattern recognition system, have gained acknowledgement for practical applications of VOCs in agriculture, i.e., plant disease diagnosis [51,52]. They have also been used for the botanical classification of Allium spp. [53] and lyophilized [54] and fresh garlic cultivars [55] and for the early detection of garlic artificially inoculated with several fungal pathogenic isolates [56]. The combinations of the analytical approaches used in the present work with e-nose devices, along with the availability of ever more performing algorithms, including classical gas recognition and neural network-based algorithms [57,58], will improve the practical and useful utilization of VOCs as a high-throughput detection tool for the early diagnosis of human diseases and of pest and plant diseases in the field and during storage thanks to the rapid discrimination of individual chemical species within the issued aromatic mixtures.

5. Conclusions

The aim of the present work was the development of a tool for the rapid and efficient diagnosis of the clove rot disease of garlic through the analysis of the different VOC profiles between healthy and diseased tissues. The diagnosis of this disease is hampered by the presence of different layers of tissues around the cloves, which do not allow for the visual observation of the symptoms. To this end, we analyzed VOC profiles produced by pure cultures of the pathogen grown in vitro, by artificially inoculated garlic, and by naturally infected samples.
With the use of two complementary analytical techniques, SPME-GC/MS and PTR-ToF-GC/MS, combined with an exhaustive statistical analysis of the results, we were able to discriminate between healthy and diseased garlic and gain useful information about the most important VOCs involved in the disease expression. The obtained data are useful to expand knowledge on the role of VOCs in host–pathogen interactions. Furthermore, it could be important for practical applications in the food industry in order to reduce the risk of disease development during storage.
In conclusion, the obtained results demonstrate that the analytical techniques used are suitable for screening the volatoloma emitted by the investigated garlic samples in order to identify an alteration due to the presence of the fungus or, more generally, to the presence of parasites or diseases that can affect the plant.

Author Contributions

Conceptualization, A.I.; methodology, A.I., C.T., C.C. and S.G.; validation, A.I., C.T., C.C. and S.G.; formal analysis, C.T., A.G. and S.G.; investigation, C.T., C.C. and S.G.; data curation, A.I., C.T., C.C. and S.G.; writing—original draft preparation, A.I., C.T. and S.G.; writing—review and editing, A.I., C.T. and S.G.; supervision, S.M.; funding acquisition, A.I., S.M. and S.G. All authors have read and agreed to the published version of the manuscript.

Funding

This research received no external funding.

Data Availability Statement

All generated data are included in this article.

Conflicts of Interest

The authors declare no conflict of interest.

References

  1. Toledano Medina, M.A.; Merinas-Amo, T.; Fernández-Bedmar, Z.; Font, R.; del Río-Celestino, M.; Pérez-Aparicio, J.; Moreno-Ortega, A.; Alonso-Moraga, A.; Moreno-Rojas, R. Physicochemical characterization and biological activities of black and white garlic: In vivo and in vitro assays. Foods 2019, 8, 220. [Google Scholar] [CrossRef] [PubMed]
  2. Parreño, R.; Rodríguez-Alcocer, E.; Martínez-Guardiola, C.; Carrasco, L.; Castillo, P.; Arbona, V.; Jover-Gil, S.; Candela, H. Turning garlic into a modern crop: State of the art and perspectives. Plants 2023, 12, 1212. [Google Scholar] [CrossRef] [PubMed]
  3. Dugan, F.M.; Hellier, B.C.; Lupien, S.L. First report of Fusarium proliferatum causing rot of garlic bulbs in North America. Plant Pathol. 2023, 52, 426. [Google Scholar] [CrossRef]
  4. Stankovic, S.; Levic, J.; Petrovic, T.; Logrieco, A.; Moretti, A. Pathogenicity and mycotoxin production by Fusarium proliferatum isolated from onion and garlic in Serbia. Eur. J. Plant Pathol. 2017, 118, 165–172. [Google Scholar] [CrossRef]
  5. Palmero, D.; De Cara, M.; Nosir, W.; Gàlvez, L.; Cruz, A.; Woodward, S.; Gonzàlez-Jaèn, M.T.; Tello, J.C. Fusarium proliferatum isolated from garlic in Spain: Identification, toxigenic potential and pathogenicity on related Allium species. Phytopathol. Mediterr. 2012, 51, 207–218. [Google Scholar]
  6. Tonti, S.; Dal Prà, M.; Nipoti, P.; Prodi, A.; Alberti, I. First report of Fusarium proliferatum causing rot of stored garlic bulbs (Allium sativum L.) in Italy. J. Phytopathol. 2012, 160, 761–763. [Google Scholar] [CrossRef]
  7. Moharam, M.M.A.; Farrag, E.S.H.; Mazhar, D.A.M. Pathogenic fungi in garlic seed cloves and first report of Fusarium proliferatum causing cloves rot of stored bulbs in upper Egypt. Arch. Phytopathol. 2013, 46, 2096–2103. [Google Scholar] [CrossRef]
  8. Salvalaggio, A.E.; Ridao, A.d.C. First report of Fusarium proliferatum causing rot on garlic and onion in Argentina. Plant Dis. 2013, 97, 556. [Google Scholar] [CrossRef]
  9. Infantino, A.; Aureli, G.; Costa, C.; Taiti, C.; Antonucci, F.; Menesatti, P.; Pallottino, F.; De Felice, S.; D’Egidio, M.G.; Mancuso, S. Potential application of PTR-TOFMS for the detection of deoxynivalenol (DON) in durum wheat. Food Control 2015, 57, 96–104. [Google Scholar] [CrossRef]
  10. Mondani, L.; Chiusa, G.; Battilani, P. Fungi associated with garlic during the cropping season, with focus on Fusarium proliferatum and F. oxysporum. Plant Health Prog. 2021, 22, 137–146. [Google Scholar] [CrossRef]
  11. Gálvez, L.; Palmero, D. Fusarium Dry Rot of garlic bulbs caused by Fusarium proliferatum: A review. Horticulturae 2022, 8, 628. [Google Scholar] [CrossRef]
  12. Chrétien, P.L.S.; Laurent, I.; Bornard, C.; Troulet, M.; El Maâtaoui, C.L. Unraveling the infection process of garlic by Fusarium proliferatum, the causal agent of root rot. Phytopathol. Mediterr. 2020, 59, 285–293. [Google Scholar]
  13. Kanchiswamy, C.N.; Malnoy, M.; Maffei, M.E. Chemical diversity of microbial volatiles and their potential for plant growth and productivity. Front. Plant Sci. 2015, 6, 151. [Google Scholar] [CrossRef]
  14. Inamdar, A.A.; Morath, S.; Bennett, J.W. Fungal volatile organic compounds: More than just a funky smell? Annu. Rev. Microbiol. 2020, 74, 101–116. [Google Scholar] [CrossRef] [PubMed]
  15. Kramer, R.; Abraham, W.-R. Volatile sesquiterpenes from fungi: What are they good for? Phytochem. Rev. 2012, 11, 15–37. [Google Scholar] [CrossRef]
  16. Kim, N.Y.; Park, M.H.; Jang, E.Y.; Lee, J.H. Volatile distribution in garlic (Allium sativum L.) by solid phase microextraction (SPME) with different processing conditions. Food Sci. Biotechnol. 2011, 20, 775–782. [Google Scholar] [CrossRef]
  17. Lanzotti, V. The analysis of onion and garlic. J. Chromatogr. A 2006, 1112, 3–22. [Google Scholar] [CrossRef]
  18. Infantino, A.; Costa, C.; Aragona, M.; Reverberi, M.; Taiti, C.; Mancuso, S. Identification of different Fusarium spp through mVOCs profiling by means of Proton-Transfer-Reaction Time-of-Flight (PTR-ToF-MS) analysis. Plant Pathol. J. 2017, 99, 663–669. [Google Scholar]
  19. Elshahawy, I.E.; Saied, N.M.; Morsy, A.A. Fusarium proliferatum, the main cause of clove rot during storage, reduces clove germination and causes wilt of established garlic plants. Plant Pathol. J. 2017, 99, 85–93. [Google Scholar]
  20. De Santis, D.; Garzoli, S.; Vettraino, A.M. Effect of gaseous ozone treatment on the aroma and clove rot by Fusarium proliferatum during garlic postharvest storage. Heliyon 2021, 7, e06634. [Google Scholar] [CrossRef]
  21. Taiti, C.; Costa, C.; Guidi Nissim, W.; Bibbiani, S.; Azzarello, E.; Masi, E.; Pandolfi, C.; Pallottino, F.; Menesatti, P.; Mancuso, S. Assessing VOC emission by different wood cores using the PTR-ToF-MS technology. Wood Sci. Technol. 2017, 51, 273–295. [Google Scholar] [CrossRef]
  22. Cappellin, L.; Biasioli, F.; Granitto, P.M.; Schuhfried, E.; Soukoulis, C.; Costa, F.; Mark, T.D.; Gasperi, F. On data analysis in PTR-TOF-MS: From raw spectra to data mining. Sens. Actuators B Chem. 2011, 155, 183–190. [Google Scholar] [CrossRef]
  23. Davis, J.C. Statistics and Data Analysis in Geology; John Wiley & Sons: Hoboken, NJ, USA, 1986. [Google Scholar]
  24. Harper, D.A.T. (Ed.) Numerical Palaeobiology; John Wiley & Sons: Hoboken, NJ, USA, 1999. [Google Scholar]
  25. Sjöström, M.; Wold, S.; Söderström, B. PLS discrimination plots. In Pattern Recognition in Practice II; Gelsema, E.S., Kanals, L.N., Eds.; Elsevier: Amsterdam, The Netherlands, 1986; pp. 461–470. [Google Scholar]
  26. Sabatier, R.; Vivien, M.; Amenta, P. Two approaches for discriminant partial least squares. In Between Data Science and Applied Data Analysis; Schader, M., Gaul, W., Vichi, M., Eds.; Springer: Berlin/Heidelberg, Germany, 2003; pp. 100–108. [Google Scholar]
  27. Giagnoni, L.; Taiti, C.; León, P.; Costa, C.; Menesatti, P.; Espejo, R.; Gómez-Paccard, C.; Hontoria, C.; Vázquez, E.; Benito, M.; et al. Volatile organic compound emissions and biochemical properties of degraded Ultisols ameliorated by no tillage and liming. Pedosphere 2020, 30, 597–606. [Google Scholar] [CrossRef]
  28. Kennard, R.W.; Stone, L.A. Computer Aided Design of Experiments. Technometrics 1969, 11, 137–148. [Google Scholar] [CrossRef]
  29. Swierenga, H.; de Groot, P.J.; de Weijer, A.P.; Derksen, M.W.J.; Buydens, L.M.C. Improvement of PLS model transferability by robust wavelength selection. Chemometr. Intell. Lab. Syst. 1998, 41, 237–248. [Google Scholar] [CrossRef]
  30. Chong, I.G.; Jun, C.H. Performance of some variable selection methods when multicollinearity is present. Chemometr. Intell. Lab. Syst. 2005, 78, 103–112. [Google Scholar] [CrossRef]
  31. Abe, K.; Hori, Y.; Myoda, T. Volatile compounds of fresh and processed garlic (Review). Exp. Ther. Med. 2020, 19, 1585–1593. [Google Scholar] [CrossRef]
  32. Wang, A.; Haapalainen, M.; Latvala, S.; Edelenbos, M.; Johansen, A. Discriminant analysis of volatile organic compounds of Fusarium oxysporum f. sp. cepae and Fusarium proliferatum isolates from onions as indicators of fungal growth. Fungal Biol. 2018, 22, 1013–1022. [Google Scholar] [CrossRef]
  33. Martinez, A.; Bennett, J.W. Fungal Volatile Organic Compounds. In Encyclopedia of Mycology; Zaragoza, O., Ed.; Elsevier: Oxford, UK, 2021; Volume 1, pp. 239–245. [Google Scholar] [CrossRef]
  34. Russo, A.; Pollastri, S.; Ruocco, M.; Monti, M.M.; Loreto, F. Volatile organic compounds in the interaction between plants and beneficial microorganisms. J. Plant Interact. 2022, 17, 840–852. [Google Scholar] [CrossRef]
  35. Sridharan, A.P.; Sugitha, T.; Karthikeyan, G.; Sivakumar, U. Comprehensive profiling of the VOCs of Trichoderma longibrachiatum EF5 while interacting with Sclerotium rolfsii and Macrophomina phaseolina. Microb. Res. 2020, 236, 126436. [Google Scholar] [CrossRef]
  36. Girotti, J.; Malbrán, I.; Lori, G.; Juárez, M. Use of solid phase microextraction coupled to capillary gas chromatography-mass spectrometry for screening Fusarium spp. based on their volatile sesquiterpenes. World Mycotoxin J. 2010, 3, 121–128. [Google Scholar] [CrossRef]
  37. Guo, Y.; Jud, W.; Ghirardo, A.; Antritter, F.; Benz, J.P.; Schnitzler, J.-P.; Rosenkranz, M. Sniffing fungi—Phenotyping of volatile chemical diversity in Trichoderma species. New Phytol. 2020, 227, 244–259. [Google Scholar] [CrossRef]
  38. Akhoundi, M.; Chebbah, D.; Elissa, N.; Brun, S.; Jan, J.; Lacaze, I.; Izri, A. Volatile Organic Compounds: A promising tool for bed bugdetection. Int. J. Environ. Res. Public Health 2023, 20, 5214. [Google Scholar] [CrossRef] [PubMed]
  39. Guo, Y.; Jud, W.; Weikl, F.; Ghirardo, A.; Junker, R.R.; Polle, A.; Benz, J.P.; Pritsch, K.; Schnitzler, J.P.; Rosenkranz, M. Volatile organic compound patterns predict fungal trophic mode and lifestyle. Commun. Biol. 2021, 4, 673. [Google Scholar] [CrossRef]
  40. Honeker, L.K.; Graves, K.R.; Tfaily, M.M.; Krechmer, J.E.; Meredith, L.K. The Volatilome: A vital piece of the complete soil metabolome. Front. Environ. Sci. 2021, 9, 649905. [Google Scholar] [CrossRef]
  41. Martínez-García, R.; Moreno, J.; Bellincontro, A.; Centioni, L.; Puig-Pujol, A.; Peinado, R.A.; Mauricio, J.C.; García-Martínez, T. Using an electronic nose and volatilome analysis to differentiate sparkling wines obtained under different conditions of temperature, ageing time and yeast formats. Food Chem. 2021, 334, 127574. [Google Scholar] [CrossRef]
  42. Morath, S.U.; Hung, R.; Bennett, J.W. Fungal volatile organic compounds: A review with emphasis on their biotechnological potential. Fungal Biol. Rev. 2012, 26, 73–83. [Google Scholar] [CrossRef]
  43. Fang, G.-Y.; Mu, X.-J.; Huang, B.-W.; Wu, G.-Z.; Jiang, Y.-J. Fungal biodiversity and interaction complexity were the important drivers of multifunctionality for flavor production in a spontaneously fermented vinegar. Innov. Food Sci. Emerg. Technol. 2023, 83, 103259. [Google Scholar] [CrossRef]
  44. Salthammer, T. Acetaldehyde in the indoor environment. Environ. Sci. Atmos. 2023, 3, 474. [Google Scholar] [CrossRef]
  45. Gutiérrez-Corona, J.F.; González-Hernández, G.A.; Padillla-Guerreo, I.E.; Olmedo-Monfil, V.; Martìnez-Tocha, A.L.; Patiño-Medina, J.A.; Meza-Carmen, V.; Torres-Guzmàn, J.C. Fungal alcohol dehydrogenases: Physiological function, molecular properties, regulation of their production, and biotechnological potential. Cells 2023, 12, 2239. [Google Scholar] [CrossRef]
  46. Marcinkowska, M.A.; Jelen, H.H. Role of Sulfur Compounds in Vegetable and Mushroom Aroma. Molecules 2022, 27, 6116. [Google Scholar] [CrossRef] [PubMed]
  47. Kilic-Buyukkurt, O.; Kelebek, H.; Bordiga, M.; Keskin, M.; Selli, S. Changes in the aroma and key odorants from white garlic to black garlic using approaches of molecular sensory science: A review. Heliyon 2023, 9, e19056. [Google Scholar] [CrossRef] [PubMed]
  48. Ludlow, R.A.; Evans, G.; Graz, M.; Marti, G.M.; Puri, C.; Rogers, H.J.; Müller, C.T. From laboratory to industrial storage—Translating volatile organic compounds into markers for assessing garlic storage quality. Postharvest Biol. Technol. 2022, 191, 111976. [Google Scholar] [CrossRef] [PubMed]
  49. Biancolillo, A.; Aloia, R.; Rossi, L.; D’Archivio, A.A. Organosulfur volatile profiles in Italian red garlic (Allium sativum L.) varieties investigated by HS-SPME/GC-MS and chemometrics. Food Control 2022, 131, 108477. [Google Scholar] [CrossRef]
  50. Vita, F.; Giuntoli, B.; Bertolini, E.; Taiti, C.; Marone, E.; D’Ambrosio, C.; Trovato, E.; Sciarrone, D.; Zoccali, M.; Balestrini, R.; et al. Tuberomics: A molecular profiling for the adaption of edible fungi (Tuber magnatum Pico) to different natural environments. BMC Genom. 2020, 21, 90. [Google Scholar] [CrossRef]
  51. Cellini, A.; Blasioli, S.; Biondi, E.; Bertaccini, A.; Braschi, I.; Spinelli, F. Potential applications and limitations of electronic nose devices for plant disease diagnosis. Sensors 2017, 17, 2596. [Google Scholar] [CrossRef]
  52. Ali, A.; Mansol, A.S.; Khan, A.A.; Muthoosamy, K.; Siddiqui, Y. Electronic nose as a tool for early detection of diseases and quality monitoring in fresh postharvest produce: A comprehensive review. Compr. Rev. Food Sci. Food Saf. 2023, 22, 2408–2432. [Google Scholar] [CrossRef]
  53. Abbey, L.; Aked, J.; Joyce, D.C. Discrimination amongst Alliums using an electronic nose. Ann. Appl. Biol. 2001, 139, 337–342. [Google Scholar] [CrossRef]
  54. Baby, R.E.; Sance, M.M.; Bauzá, M.; Messina, V.M.; Gómez, A.R.; Burba, J.L.; Walsöe de Reca, N.E. Electronic nose study of powdered garlic. Sens. Transducers 2009, 107, 26–34. [Google Scholar]
  55. Trirongjitmoah, S.; Juengmunkong, Z.; Srikulnath, K.; Somboon, P. Classification of garlic cultivars using an electronic nose. Comput. Electron. Agric. 2015, 113, 148–153. [Google Scholar] [CrossRef]
  56. Makarichian, A.; Chayjan, R.A.; Ahmadi, E.; Zafari, D. Early detection and classification of fungal infection in garlic (A. sativum) using electronic nose. Comput. Electron. Agric. 2022, 192, 106575. [Google Scholar] [CrossRef]
  57. Arora, M.; Zambrzycki, S.C.; Levy, J.M.; Esper, A.; Frediani, J.K.; Quave, C.L.; Fernández, F.M.; Kamaleswaran, R. Machine Learning Approaches to Identify Discriminative Signatures of Volatile Organic Compounds (VOCs) from Bacteria and Fungi Using SPME-DART-MS. Metabolites 2022, 12, 232. [Google Scholar] [CrossRef] [PubMed]
  58. Wang, X.; Zhou, Y.; Zhao, Z.; Feng, X.; Wang, Z.; Jiao, M. Advanced algorithms for low dimensional metal oxides-based electronic nose application: A review. Crystals 2023, 13, 615. [Google Scholar] [CrossRef]
Figure 1. Garlic cloves naturally infected with F. proliferatum (a); garlic cloves artificially inoculated with F. proliferatum (b).
Separations 10 00556 g001
Figure 2. PCA performed on VOC emission of potato dextrose agar (PDA) and of F. proliferatum grown on PDA.
Separations 10 00556 g002
Figure 3. Average emission intensity from different sample types: control PDA (blue); F. proliferatum on PDA (red); healthy cloves (gray); inoculated cloves (orange); naturally infected (green).
Separations 10 00556 g003
Figure 4. PCA performed on VOC emission of healthy and artificially inoculated garlic cloves (a) and healthy, artificially inoculated, and naturally infected garlic cloves (b).
Separations 10 00556 g004
Table 1. List of compounds identified through PTR-ToF-MS analysis with an average intensity emission of >1 ppbv. At the bottom, the total number of signals detected, the total S compound emission, and the total VOC emission are reported.
m/zChemical
Formula
Tentative
Identification
PDA
(n = 8)
PDA + F. proliferatum
(n = 12)
Healthy Garlic
(n = 20)
Inoculated Garlic (n = 12)Naturally Infected Garlic (n = 20)
Protonated Ion (H+)AverageS.D.AverageS.D.AverageS.D.AverageS.D.AverageS.D.
27.022C2H3+Acetylene and other fragments18.138.274770.972740.7518.398.30272.24146.98387.79279.89
30.030C2H5+Ethylene (isotope)0.000.00203.0599.282.290.828.442.9838.7823.88
31.018CH3O+Formaldehyde6.022.81160.5650.804.522.5754.7037.7186.4843.79
33.033CH5O+Methanol9.864.4025.4712.1650.1635.12318.23156.5460.3439.58
34.994H3S+S compounds0.000.000.000.000.000.0039.3317.680.000.00
41.038C2H5+Fragment
(alcohol, ester)
4.052.49107.6835.2822.6814.56364.88282.3017.6010.68
43.018C2H3O+Fragment (ester)1.370.62166.8866.988.935.3249.9617.7753.4030.46
43.054C3H7+Fragment
(alcohol, ester, acetate)
1.790.2452.2919.027.914.6589.7452.5612.396.43
45.033C2H5O+Acetaldehyde94.1139.865211.792738.41100.3275.71563.74338.81918.04472.29
46.990CH3S+S compounds
(thioformaldehyde)
0.000.000.000.004.352.4920.745.1216.786.68
47.049C2H7O+Ethanol1.661.082551.011034.384.222.3183.2158.72337.71206.18
49.011CH5S+S compounds
(metanethiol)
0.000.000.000.0015.4210.43130.3186.8822.065.78
51.006CH5S+ (isotope)S compounds
(metanethiol-isotope)
0.000.000.000.002.060.479.546.113.730.21
53.021CH9S+S compounds
(metanethiol)
0.000.000.000.000.000.002.300.640.000.00
55.057C4H11S+S compounds
(butanethiol)
0.000.0026.6910.241.750.424.561.202.140.49
57.070C4H9+Alcohol Fragment1.841.0192.2831.872.240.813.921.413.601.80
59.050C3H7O+Acetone/propanal60.1623.1284.1951.797.172.9415.835.926.783.82
61.027C2H5O2Acetic acid4.022.9391.1166.545.882.2333.7413.8417.716.36
63.027C2H7S+S compounds
(dimethylsulfide)
0.000.000.000.000.000.003.651.472.921.03
63.998CH4OS+S compounds
(sulphenic acid)
0.000.000.000.000.000.003.381.370.000.00
69.074C2H13S+S compounds1.730.592.971.460.000.002.110.510.000.00
71.049C5H11+2,3-Dihydrofuran0.000.0010.186.330.000.003.411.562.220.76
73.010C3H5S+S compounds
(thioacrolein)
0.000.0032.039.872.651.4139.8217.977.801.41
73.060C4H9O+Butanal7.272.422.200.762.250.696.483.762.060.55
75.026C3H7S+S compounds
(1-Propene-1-thiol/allyl mercaptan)
1.170.409.193.422.921.1515.084.859.310.81
87.044C4H7S+S compounds
(2,3-Dihydrothiophene)
0.000.0010.773.481.930.213.221.491.640.25
89.040C4H9S+S compounds
(allyl methyl sulfide)
0.000.000.000.000.000.0013.648.020.000.00
104.982C3H5S2+S compounds
(1,2-dithiole)
0.000.000.000.001.930.5012.477.493.010.63
113.045C3H13S2+S compounds0.000.000.000.000.000.005.973.790.000.00
115.060C6H11S+S compounds
(cyclohexanethiolate)
0.000.002.020.280.000.004.272.430.000.00
116.982C4H5S2+S compounds0.000.002.140.590.000.000.000.002.830.46
118.994C7H3S+S compounds (heptahexaene-1-thione)0.000.000.000.000.000.002.520.953.211.16
121.014C4H9S2+S compounds
(disulfide, methyl 2-propenyl)
0.000.000.000.000.000.005.004.060.000.00
147.037C6H11S2+S compounds
(diallyl sulfide)
0.000.000.000.001.880.2311.455.863.680.54
149.041C6H13S2+S compounds
(disulfide, 1-methylethyl 2-propen-1-yl)
0.000.000.000.000.000.003.651.250.000.00
Total number of signals detected1421223427
Total VOC emission (average, ppbv)213.1913,615.47271.822201.532024.02
Total S compound emission (average, ppbv)2.9085.8128.87333.0179.13
Protonated measured m/z (mass/charge ratios); compound’s chemical formula (H+ added by protonation); tentative identifications; average of VOC headspace intensity (ppbv) for sample types ± SD. “Total number of signals detected”: the total number of compounds detected for each sample type; “Total VOCs emission” and “Total S compound emissions” are expressed as an average of each sample type.
Table 2. Results of the PLSDA models based on VOCs used to classify healthy and artificially infected commercial garlic cloves.
Healthy vs. Artificially Infected Garlic ClovesHealthy vs. Naturally Infected Garlic ClovesHealthy vs. Artificially Infected vs. Naturally Infected Garlic Cloves
N325252
n° units (X-block)323232
n° units (Y-block)223
PreprocessingMean centerAutoscaleMedian center
n° LV11315
% Cumulated variance X-block68.0996.5499.98
% Cumulated variance Y-block37.4643.0586.39
Mean specificity10.980.96
Mean sensitivity10.980.96
Random probability (%)505033.3
Mean class. err. (%)00.020.04
Mean RMSEC0.5500.4100.274
% Corr. class. model10097.697.6
% Corr. class. independent test100100100
N is the number of samples; n units (Y-block) is the number of VOCs; n units (Y-block) is the number of treatments to be discriminated by the PLSDA; n LV is the number of latent vectors for each model; random probability (%) is the probability of random assignment of an individual compound into a unit; RMSEC is the root mean square error of calibration.
Table 3. List of variable importance in projection (VIP) VOCs with scores > 1.2.
m/zTentative IdentificationChemical FormulaHealthyArtificially InfectedNaturally Infected
27.022AcetyleneC2H3+0.9303072.1584852.181981
30.030Ethylene (isotope)C2H5+1.8041590.8148890.857015
33.033MethanolCH5O+0.6164351.3140731.329796
41.038Fragment Alchohol, EsterC2H5+1.1076412.5300642.590729
43.054Fragment Alchohol, ester, acetateC3H7+1.7055020.6459540.564028
45.033AcethaldehydeC2H5O+1.1885072.7286732.046816
47.049EthanolC2H7O+1.3511192.1695542.971928
61.027Acetic acidC2H5O2+3.1171570.7457490.95885
71.0502,3-DihydrofuranC5H11+1.3776620.9343110.525653
Table 4. Chemical composition (percentage mean value ± standard deviation) of ten artificially inoculated garlic samples.
Component 1LRI 2LRI 312345678910
1-propene-1-thiol5905950.34 ± 0.020.23 ± 0.01--------
ethyl acetate596599-7.89 ± 0.0210.69 ± 0.022.80 ± 0.022.57 ± 0.02-7.85 ± 0.026.67 ± 0.02--
thiirane, methyl-653650-17.04 ± 0.0319.60 ± 0.036.70 ± 0.03--16.78 ± 0.0417.44 ± 0.04--
allyl methyl sulfide685678-1.96 ± 0.020.76 ± 0.01-1.82 ± 0.023.55 ± 0.025.86 ± 0.02---
diallyl sulfide876871-1.51 ± 0.03-2.39 ± 0.023.10 ± 0.022.82 ± 0.011.76 ± 0.022.00 ± 0.02-6.67 ± 0.02
allyl mercaptan896891----6.35 ± 0.03-----
diacetyl sulfide900*-----0.88 ± 0.01----
disulfide, methyl 2-propenyl9279225.90 ± 0.031.13 ± 0.03-1.94 ± 0.025.26 ± 0.024.93 ± 0.023.78 ± 0.021.92 ± 0.02--
diallyl disulfide1089108591.39 ± 0.0768.43 ± 0.1166.92 ± 0.1584.45 ± 0.1179.78 ± 0.1486.35 ± 0.1861.70 ± 0.1470.92 ± 0.1787.93 ± 0.1277.68 ± 0.15
disulfide, 1-methylethyl
2-propen-1-yl
109510991.26 ± 0.030.64 ± 0.02-0.55 ± 0.020.25 ± 0.021.08 ± 0.022.03 ± 0.02-8.03 ± 0.0315.65 ± 0.02
allyl thiocyanate1210*0.67 ± 0.020.88 ± 0.02----0.24 ± 0.021.05 ± 0.024.04 ± 0.02-
tetrasulfide,
di-2-propenyl
15161510--2.03 ± 0.021.17 ± 0.020.85 ± 0.010.39 ± 0.02----
SUM 99.5699.71100.0100.099.98100.0100.0100.0100.0100.0
1 the components are reported according to their elution order on an apolar column; 2 linear retention indices measured on an apolar column; 3 linear retention indices from the literature (NIST); * LRI not available; from 1 to 10: percentage mean values of inoculated sample components;—not detected.
Disclaimer/Publisher’s Note: The statements, opinions and data contained in all publications are solely those of the individual author(s) and contributor(s) and not of MDPI and/or the editor(s). MDPI and/or the editor(s) disclaim responsibility for any injury to people or property resulting from any ideas, methods, instructions or products referred to in the content.

