Analysis of Compliance with the Hypotheses Raised
Hypothesis 1. The personal characteristics and emotional competences of teachers interfere in the management of students, finding differences depending on sociodemographic and professional variables (sex, age, professional experience, type of center in which they work, whether they have children and teaching vocation).
- (a)
Ability to interpret emotions
If the ability of teachers to interpret emotions according to sex is analyzed, it is observed how teachers obtain better results (Wilcoxon,
p-value = 0.00001717 < 0.05). They can observe and understand the emotions and feelings of their students better than their fellow teachers (
Figure 1 and
Figure 2).
It should be noted that the proportion of teachers who score high (4 or 5) is CI95% = (93.9, 98.0), that is, the vast majority believes they are able to interpret and observe the emotions and feelings of students. These high scores do not depend on sex (Fisher, p-value = 0.3309), the type of center (Fisher, p-value = 0.5726), experience (Fisher, p-value = 0.1368) or age (Fisher, p-value = 0.3380).
If differences in terms of having children are analyzed, it is observed that for teachers, there are no significant differences (Wilcoxon,
p-value = 0.2073 > α = 0.05) (
Figure 3), nor for teachers (Wilcoxon,
p-value = 0.4671 > α = 0.05) (
Figure 4). This shows that there is no greater sensitivity among teachers with children compared to those without children.
- (b)
Respect for students
On the other hand, the emotional competencies of teachers also have a lot to do with the way in which teachers interact with students, how they treat them and how they see them. In that sense, it is necessary to analyze the relationship of personal, educational and cultural respects.
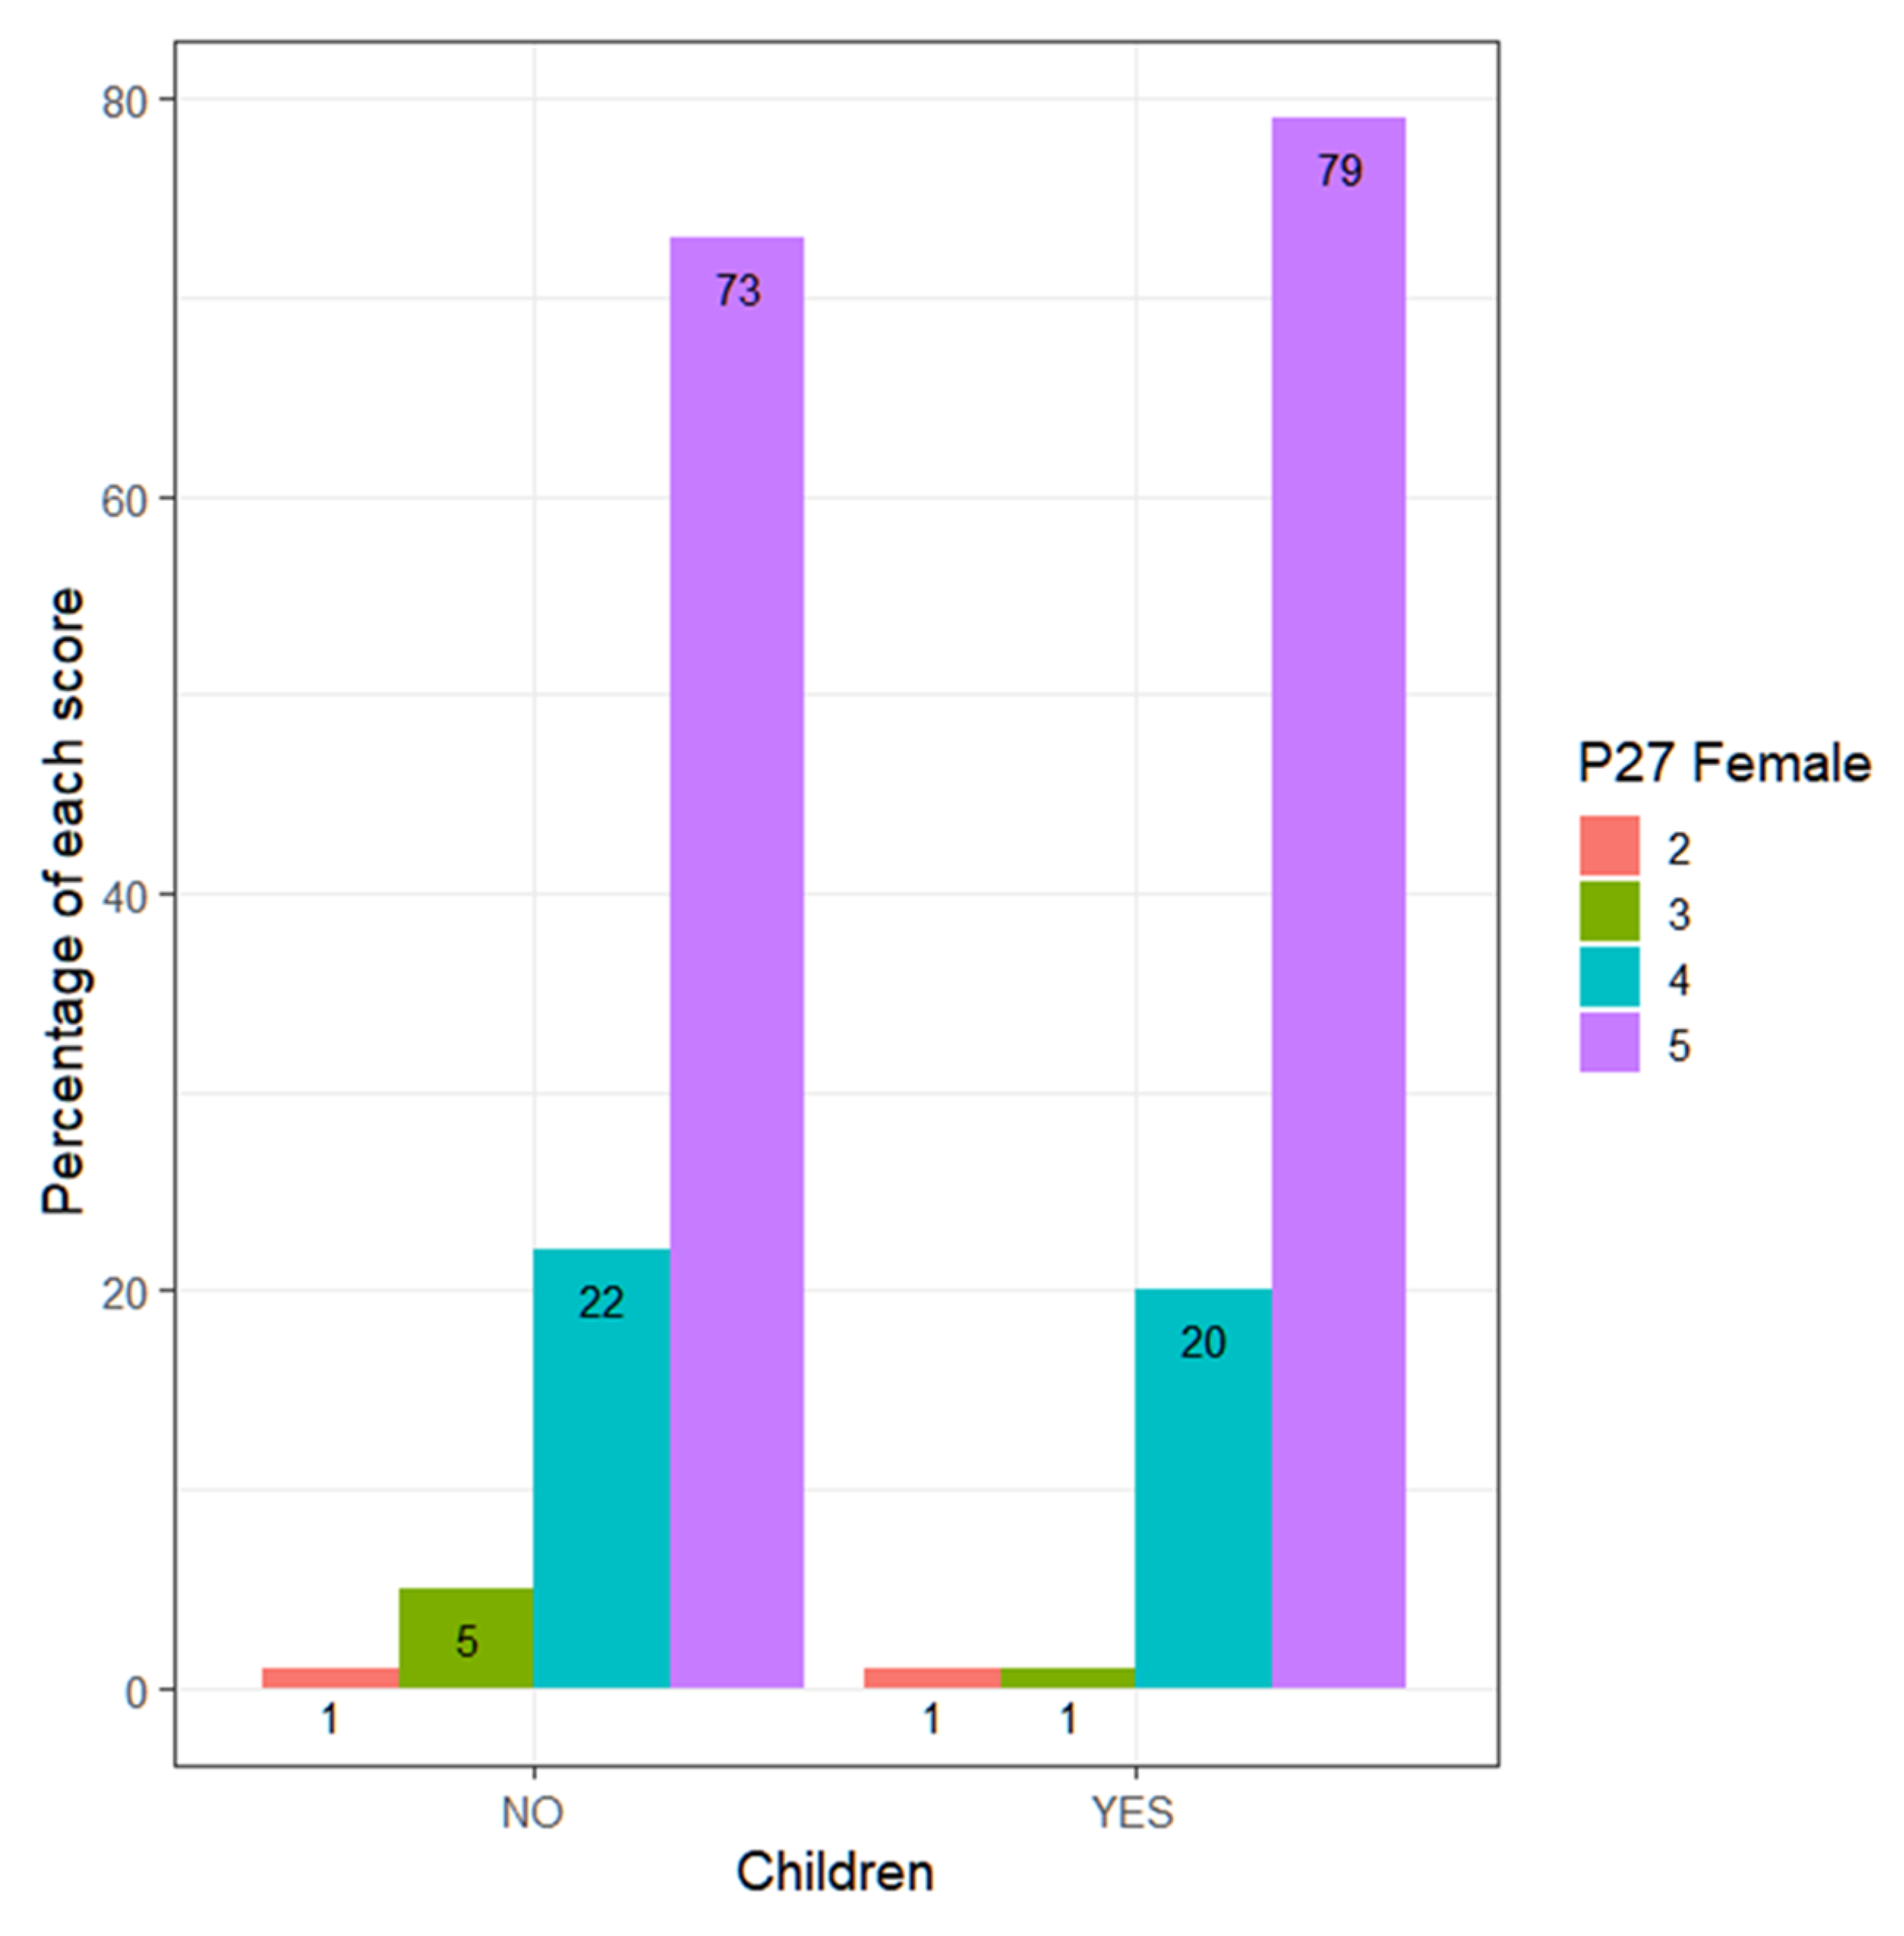
As for whether teachers respect their students, it is observed that the answers do not depend on sex, age, teaching experience, the type of center or whether they have children (
Figure 5).
All teachers believe they have an attitude of respect towards students. This positive view is confirmed in the number of teachers who score 4 or 5 (
Table 3).
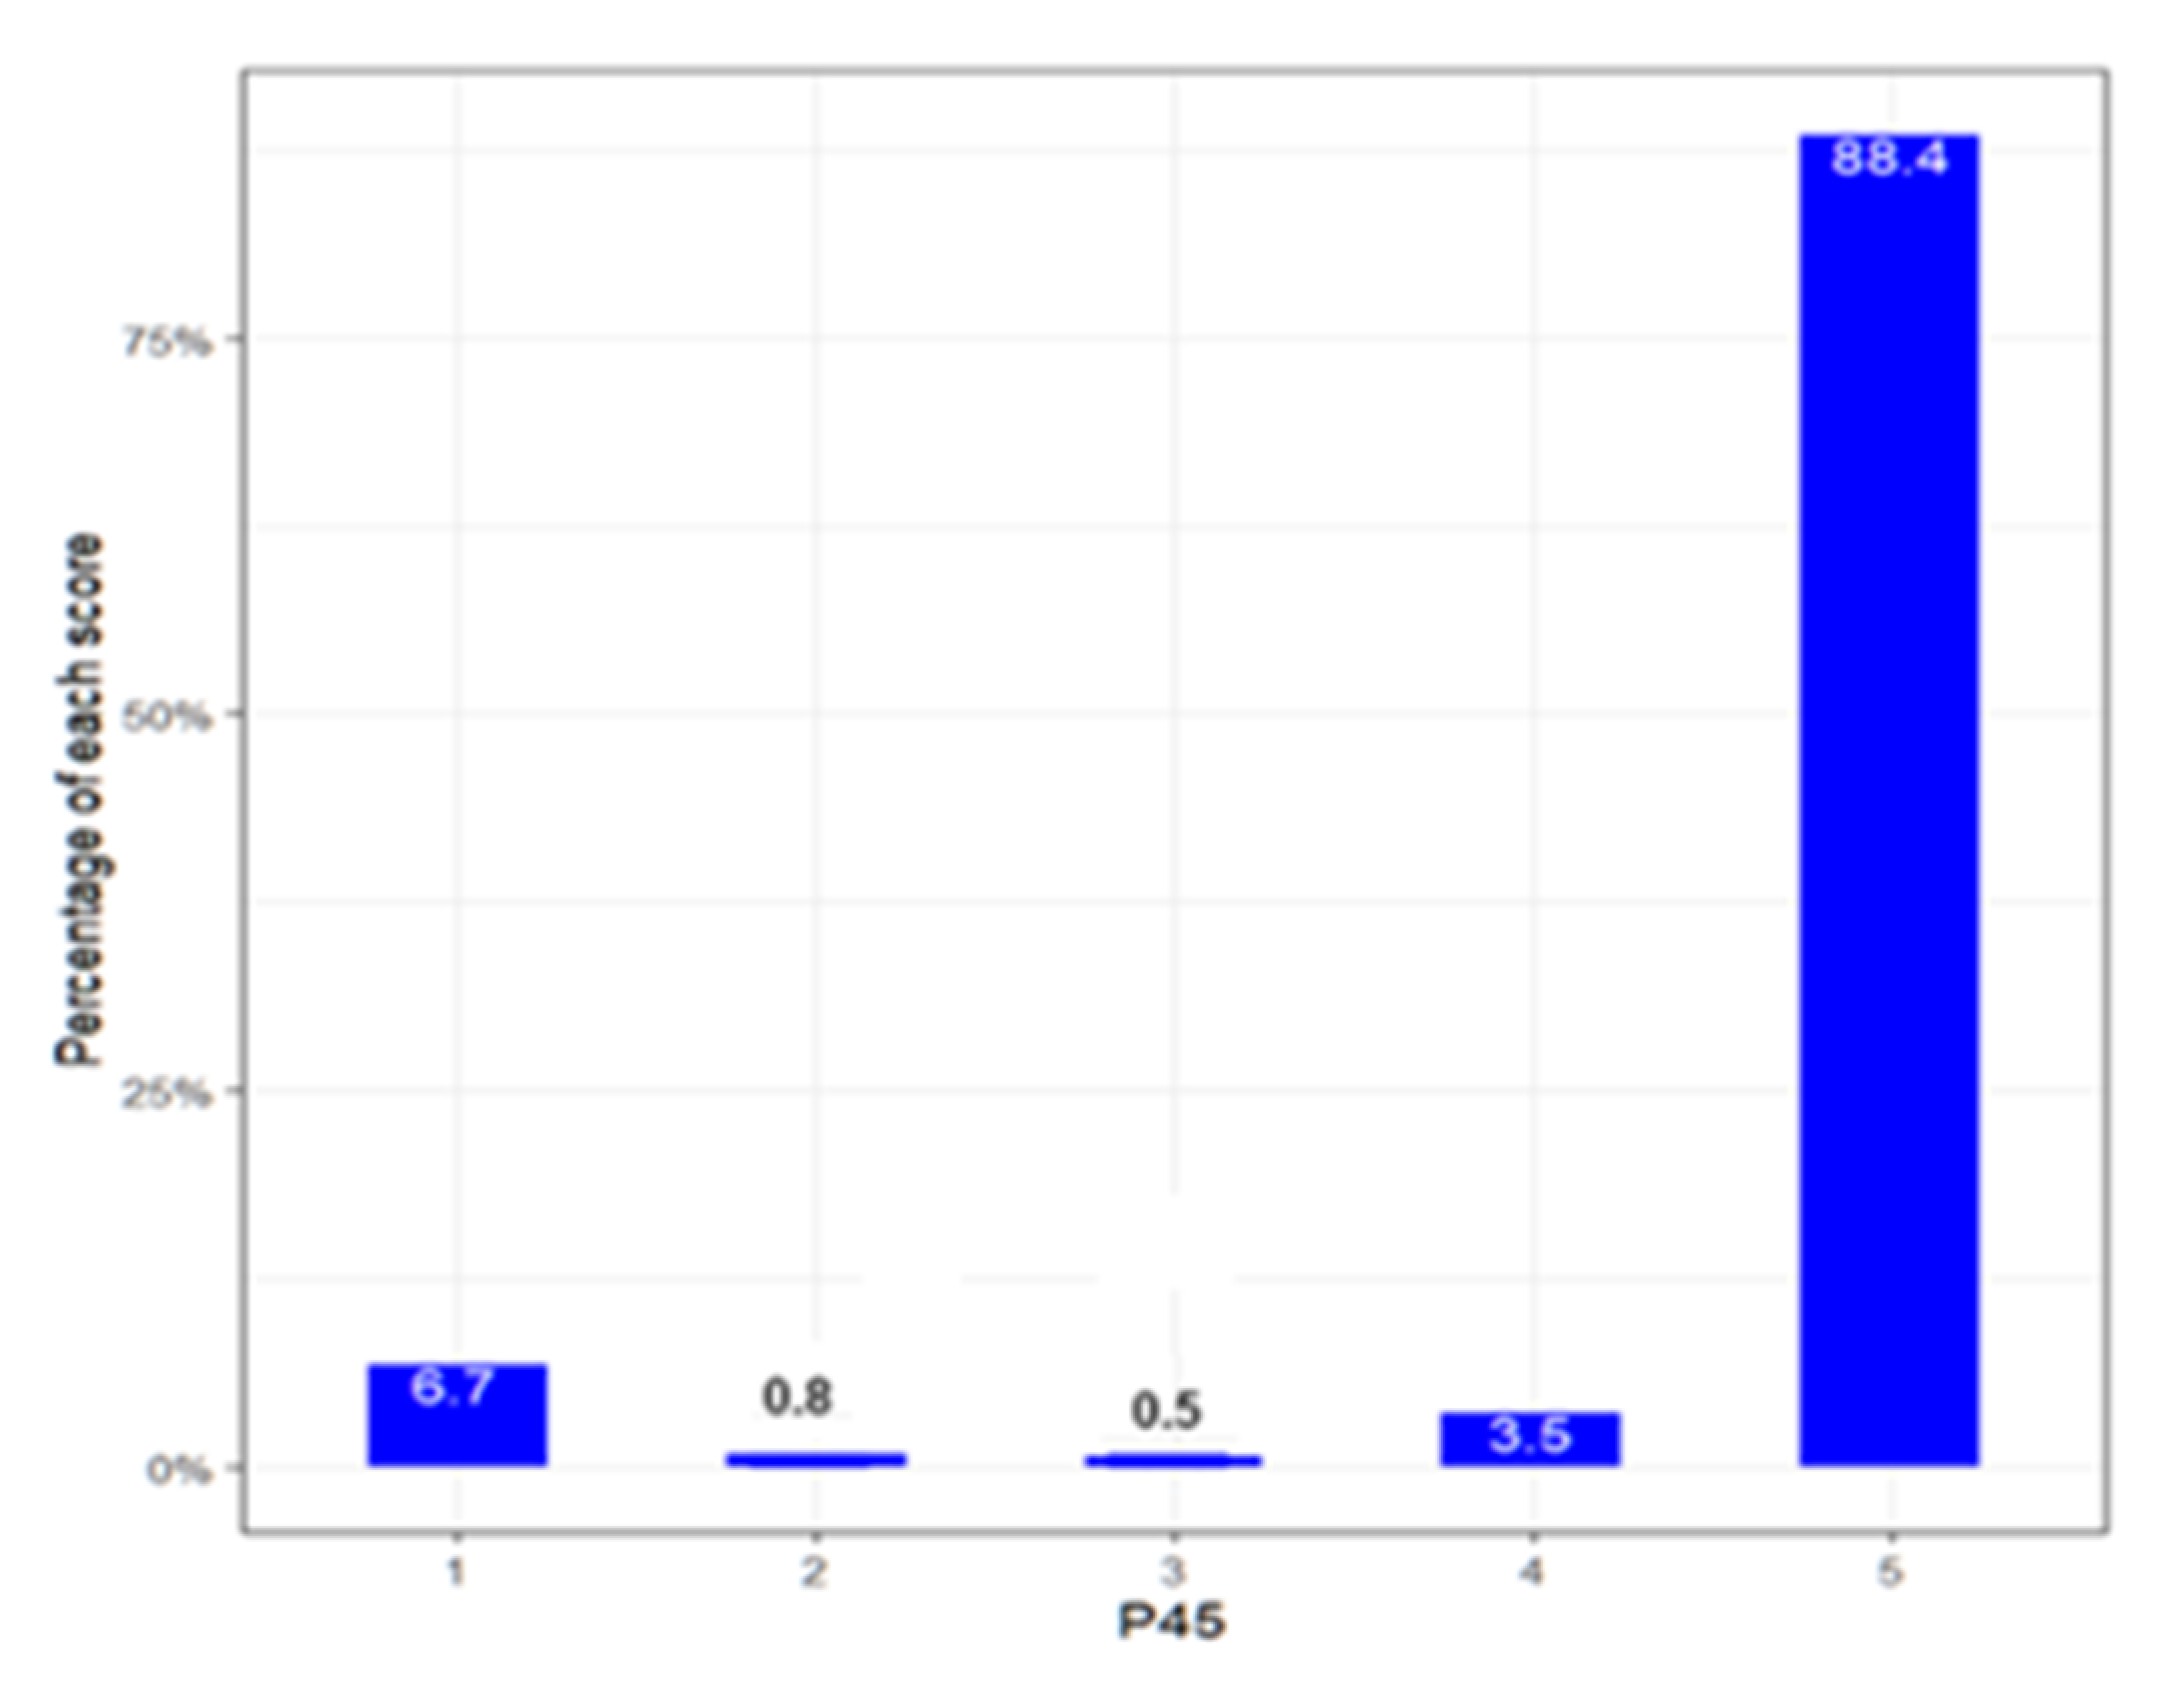
In the same way, teachers present a very positive inclusive vision towards their students. In a very high percentage, they reject prejudice, racism and discrimination, although, unfortunately, there is a percentage of teachers (7.5%) who confess a disrespectful attitude (
Figure 6).
If analyzed in terms of sociodemographic variables, no differences are observed in terms of age (Kruskal–Wallis,
p-value = 0.1439 > 0.05), experience (Kruskal–Wallis,
p-value = 0.6898 > 0.05), the type of center (Wilcoxon,
p-value = 0.7334 > 0.05) or whether they have children (Wilcoxon,
p-value = 0.08935 > 0.05, inconclusive). However, there are differences observed regarding sex (
Figure 7).
Men score higher than women (Wilcoxon, p-value = 0.01283 < 0.05), that is, they reject prejudice, racism and discrimination more. Of the teachers who answer 1, that is, who disagree with the statement of rejecting prejudice, racism and discrimination, 88% are women and 12% men. This reality has a difficult explanation.
The contingency tables of those who score 4 or 5, compared to the variables sex, type of center, children and teaching experience, are as follows (
Table 4):
The proportion of men who score high (4 or 5) is higher, with a p-value = 0.02053 < 0.05, although, with such a tight p-value, the result is inconclusive.
The contrast of proportions gives a p-value = 0.7532 > 0.05. Consequently, the proportion of teachers who score high (4 or 5) is the same in subsidized and public schools.
The contrast of proportions of those who score 4 or 5 to contrast if the proportion among those who have children is higher gives a p-value = 0.03624 < 0.05. Therefore, it is higher among those who have children, although with an inconclusive result (very tight p-value).
The p-value = 0.3390 for the independence contrast (Fisher) indicates that the proportion of those who score 4 or 5 is similar according to teaching experience.
The independence contrast (Fisher) for the variables age and high scores (4 or 5) gives us a p-value = 0.02939. So, there is dependence between both variables. It seems that teachers over the age of 40 tend to give higher scores.
If the dependency relationship between the variables age and rejection of prejudices is analyzed, it is observed how the contrast of independence (Fisher) gives a
p-value = 0.03183 < 0.05. Therefore, both variables are dependent. The contingency table is as follows (
Table 5):
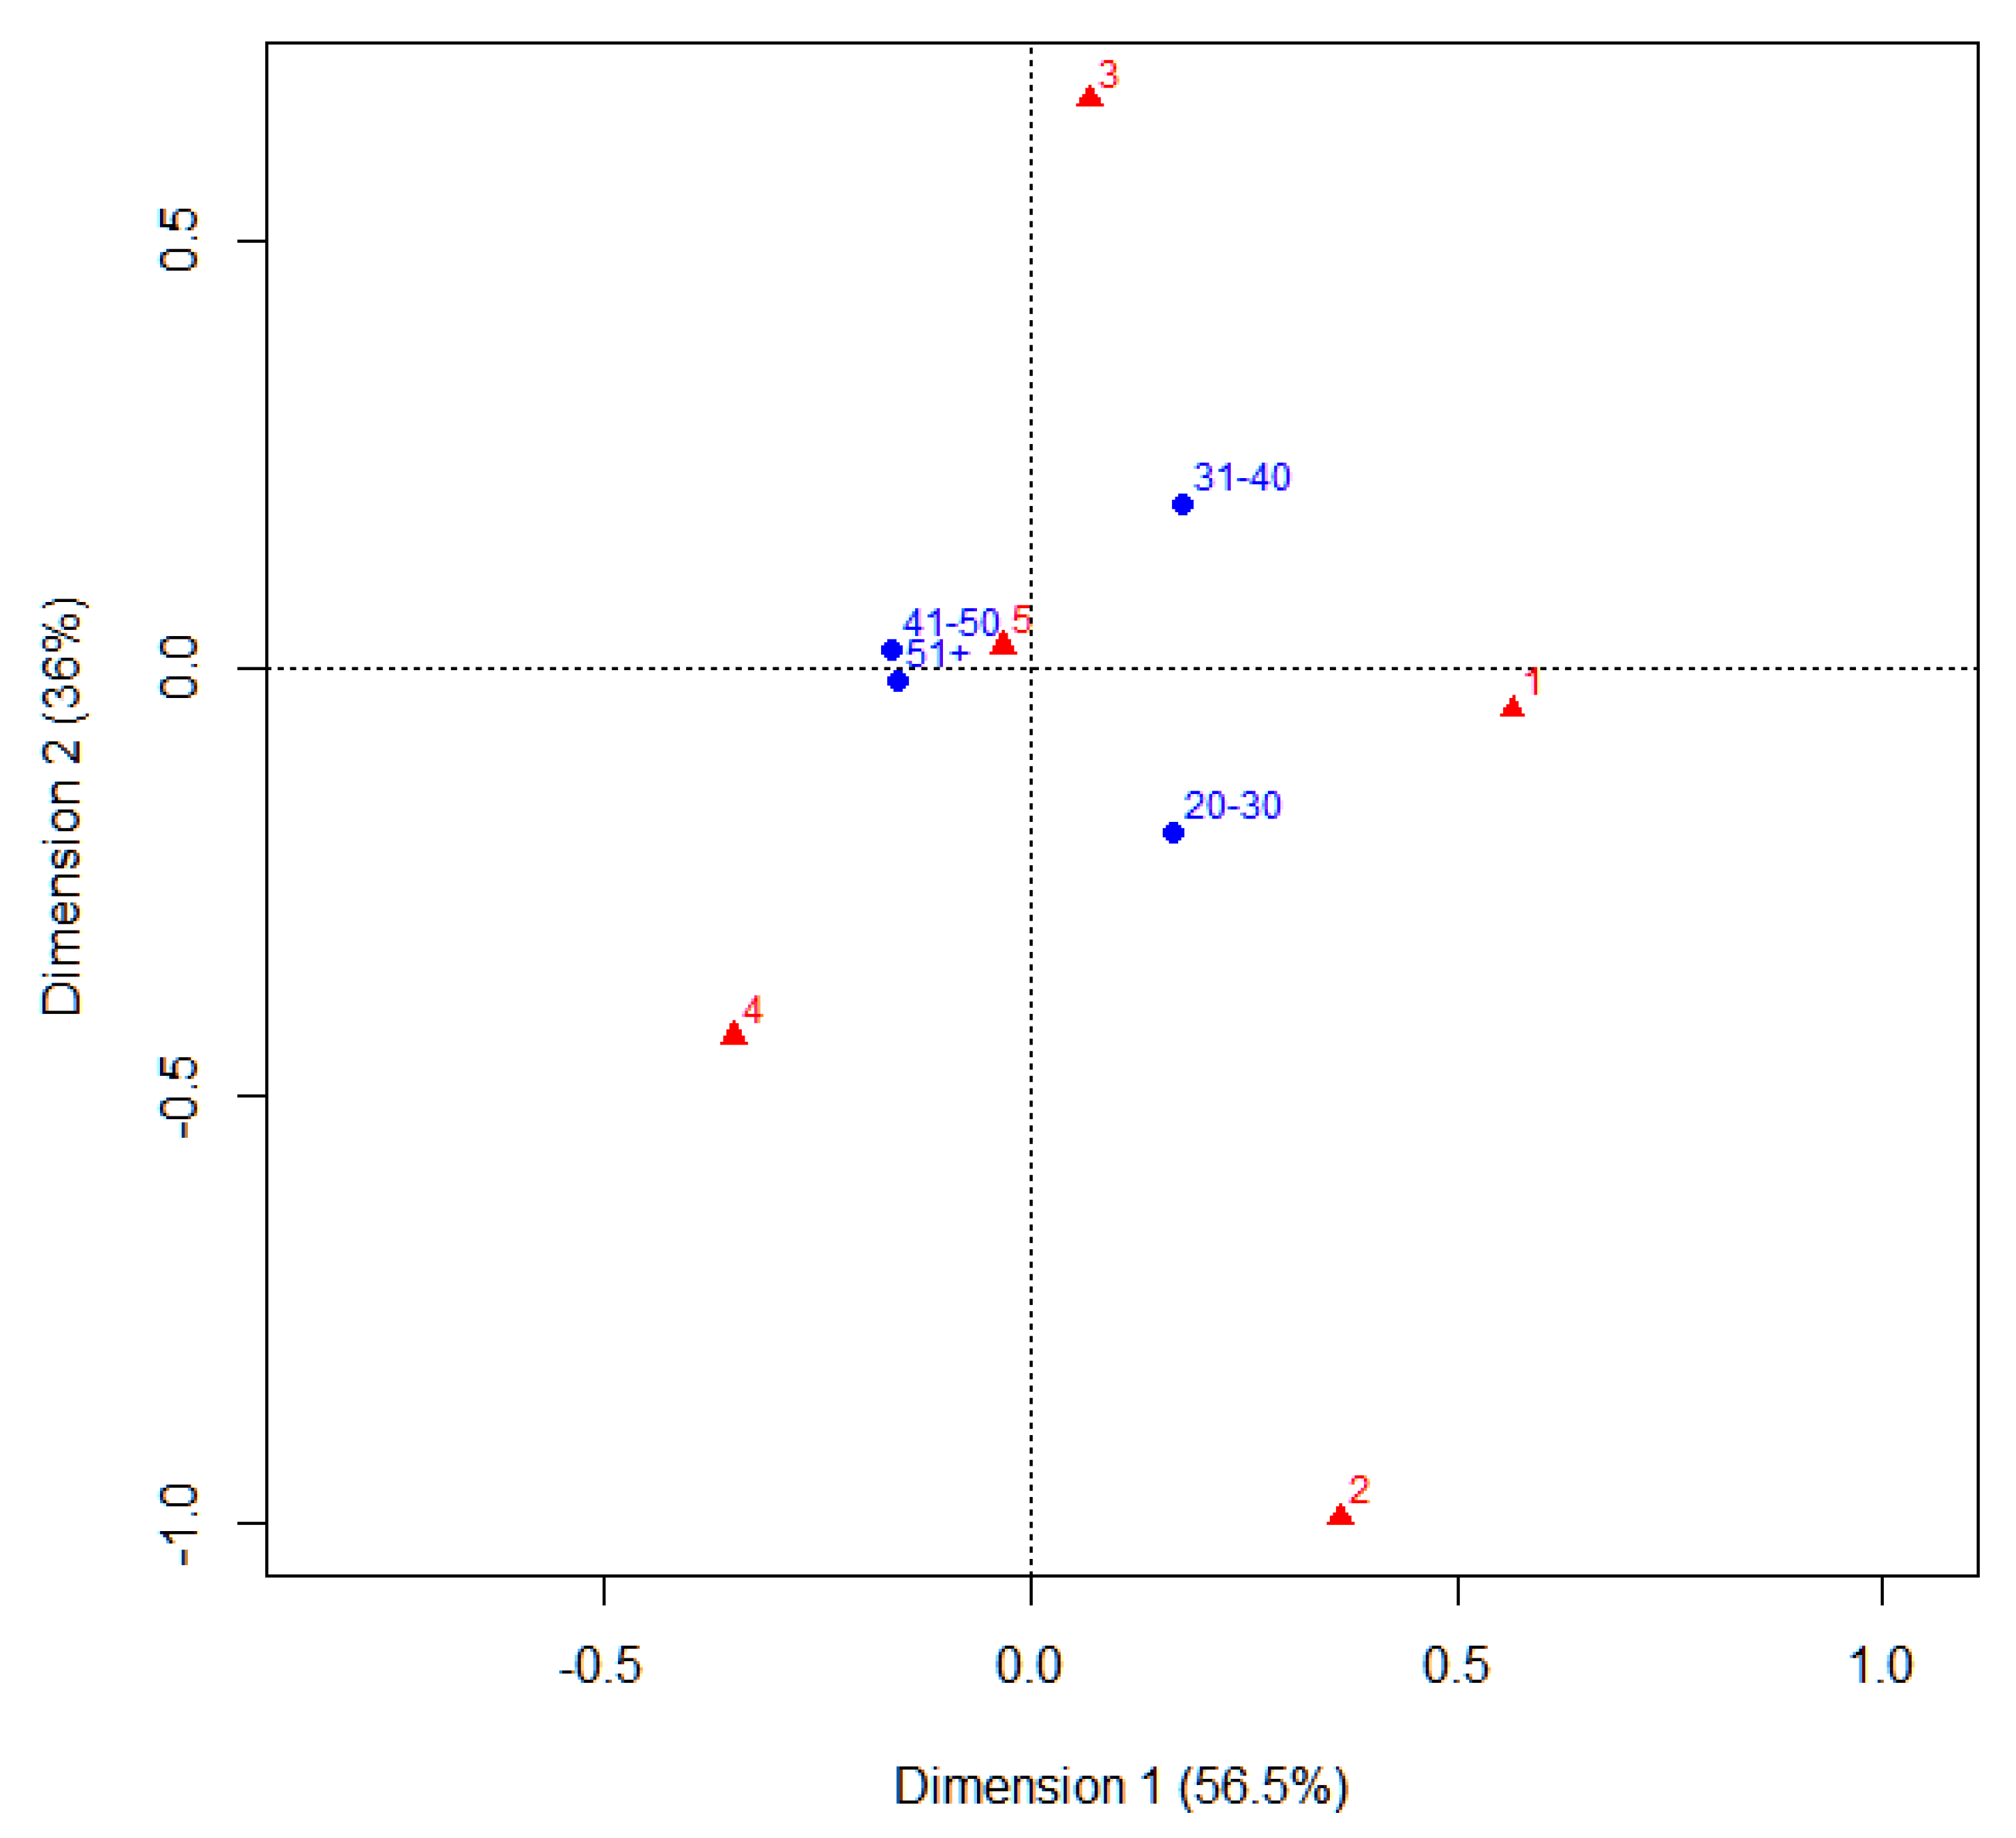
Once the dependency relationship between the two variables has been established, it is interesting to know what this relationship is like. The answer to that question lies in correspondence analysis, which is used to represent possible associations between variables (factors) and to determine if it is possible to observe patterns. The distances between the different categories indicate the greater or lesser relationship between them; the relationships between the elements are displayed as distances in a graph (
Figure 8).
Correspondence analysis shows that a score of 5 is associated with the highest age (over 41 years).
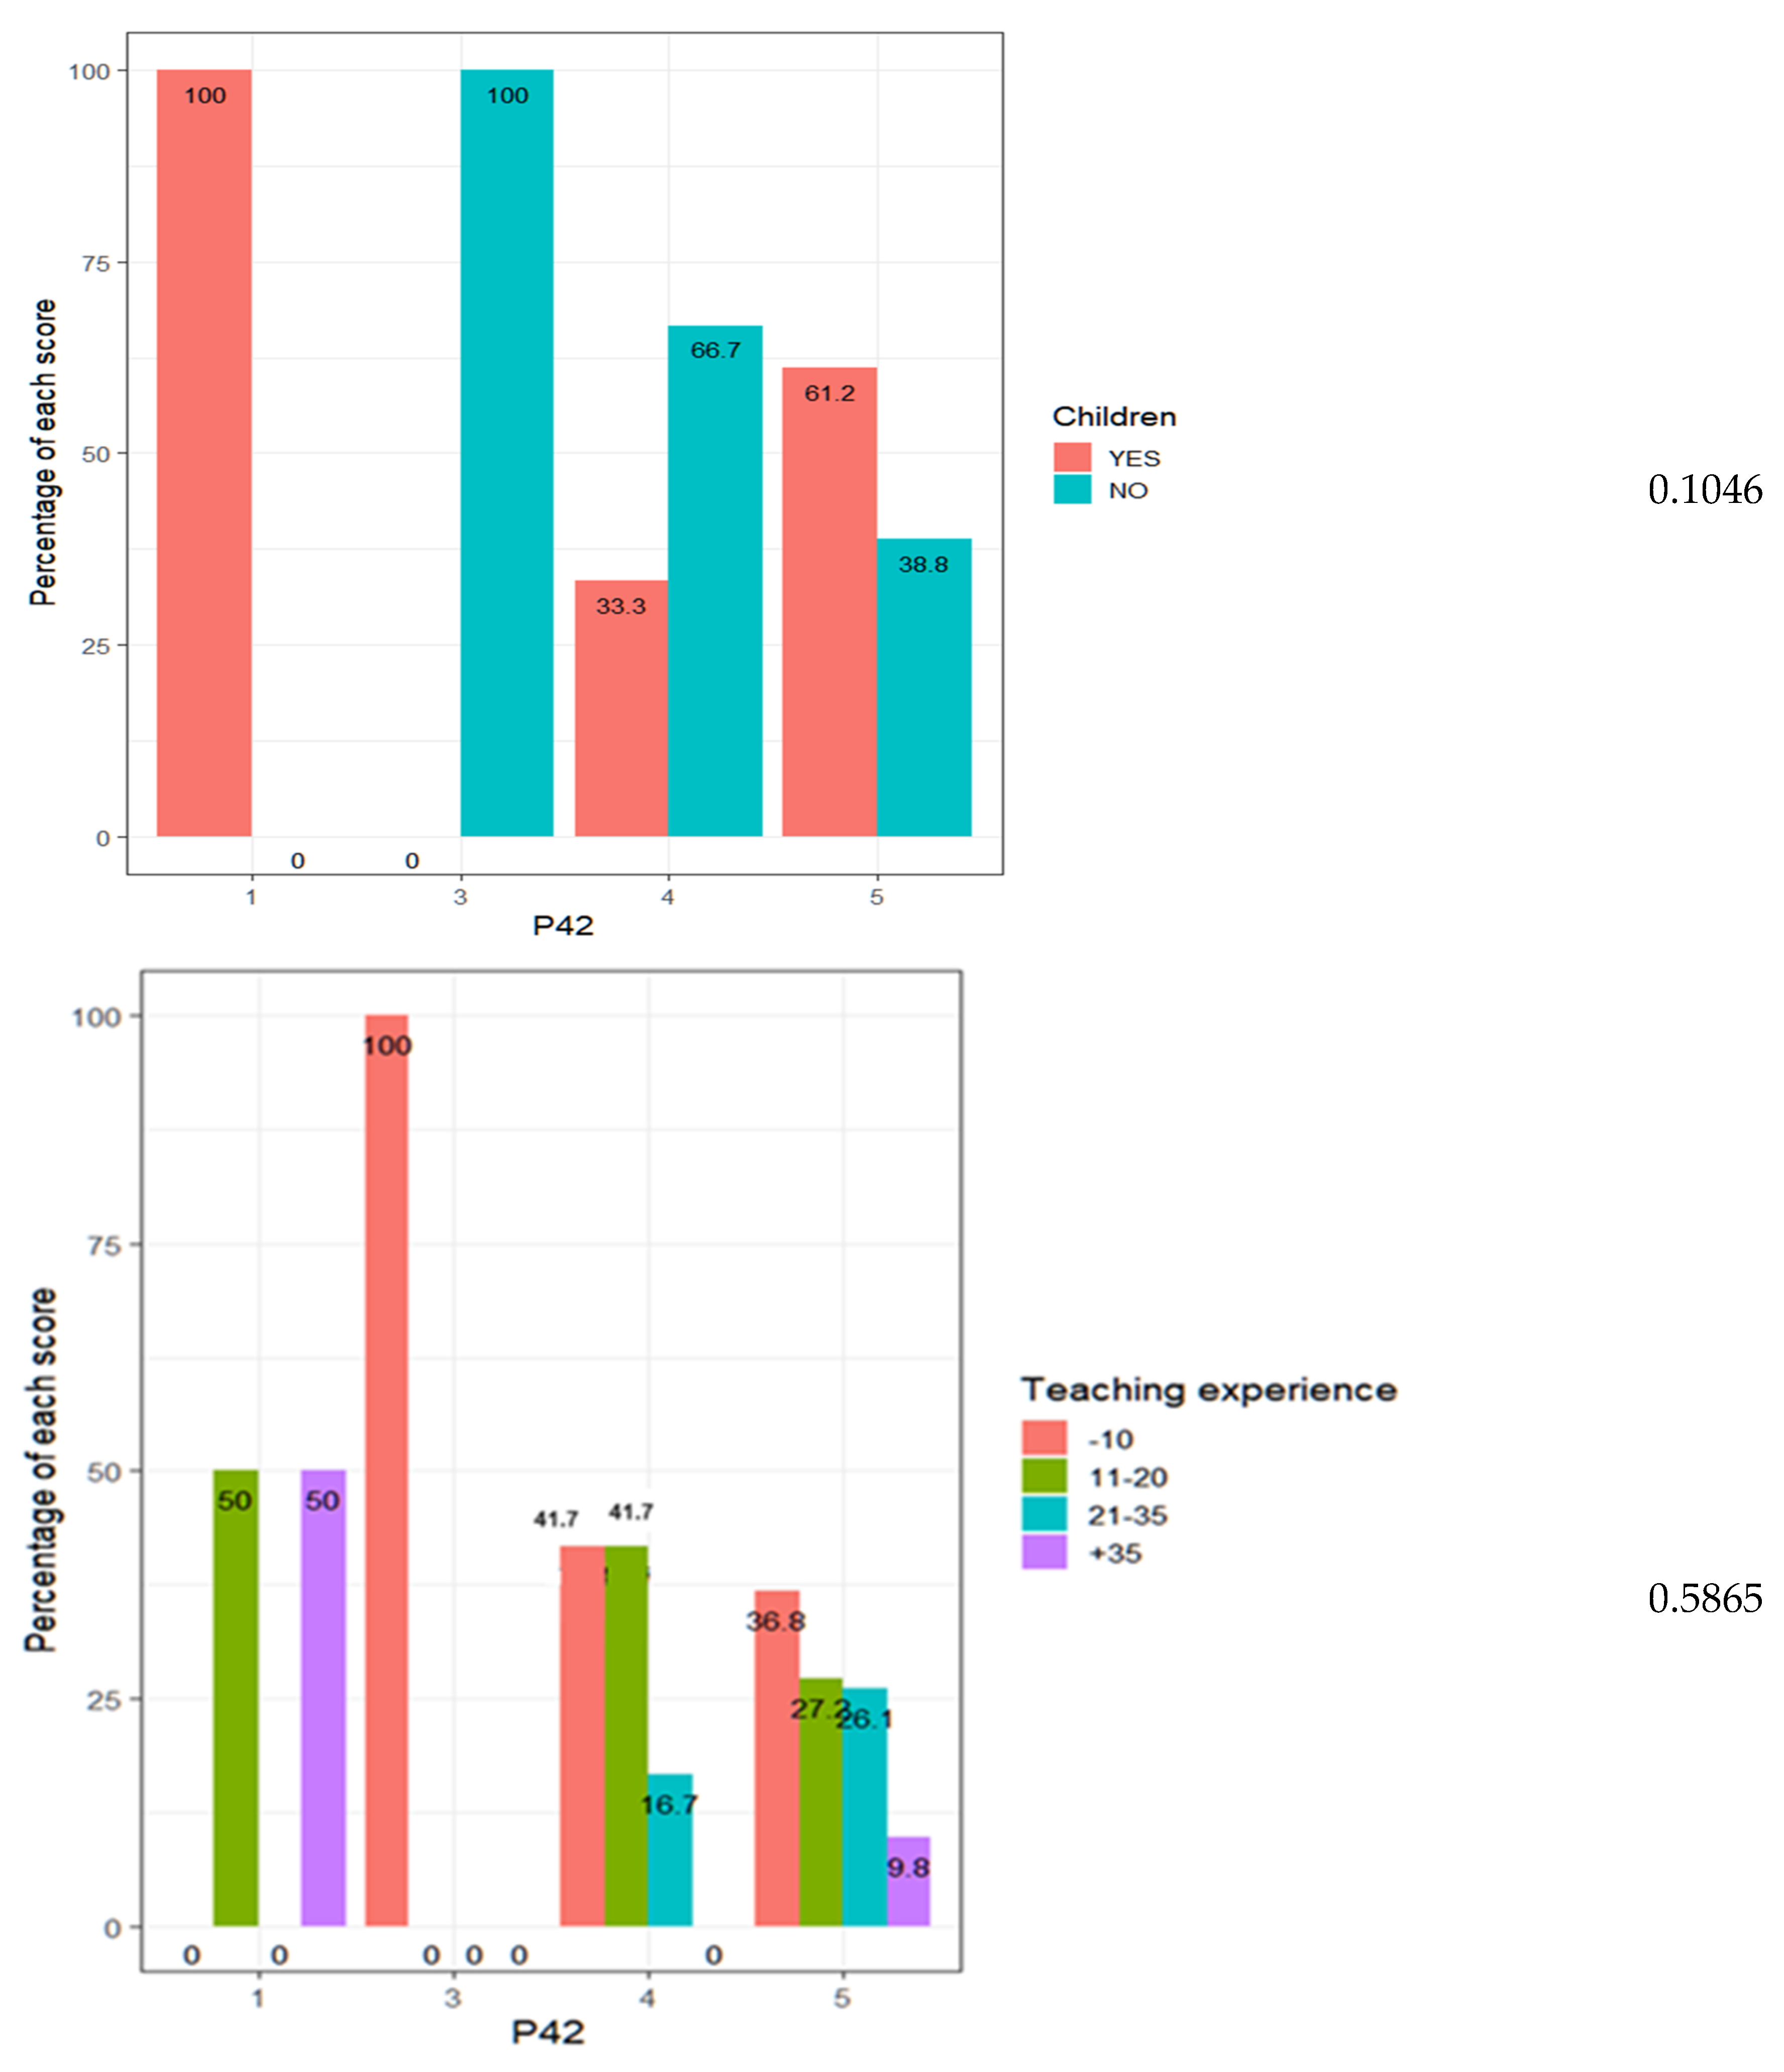
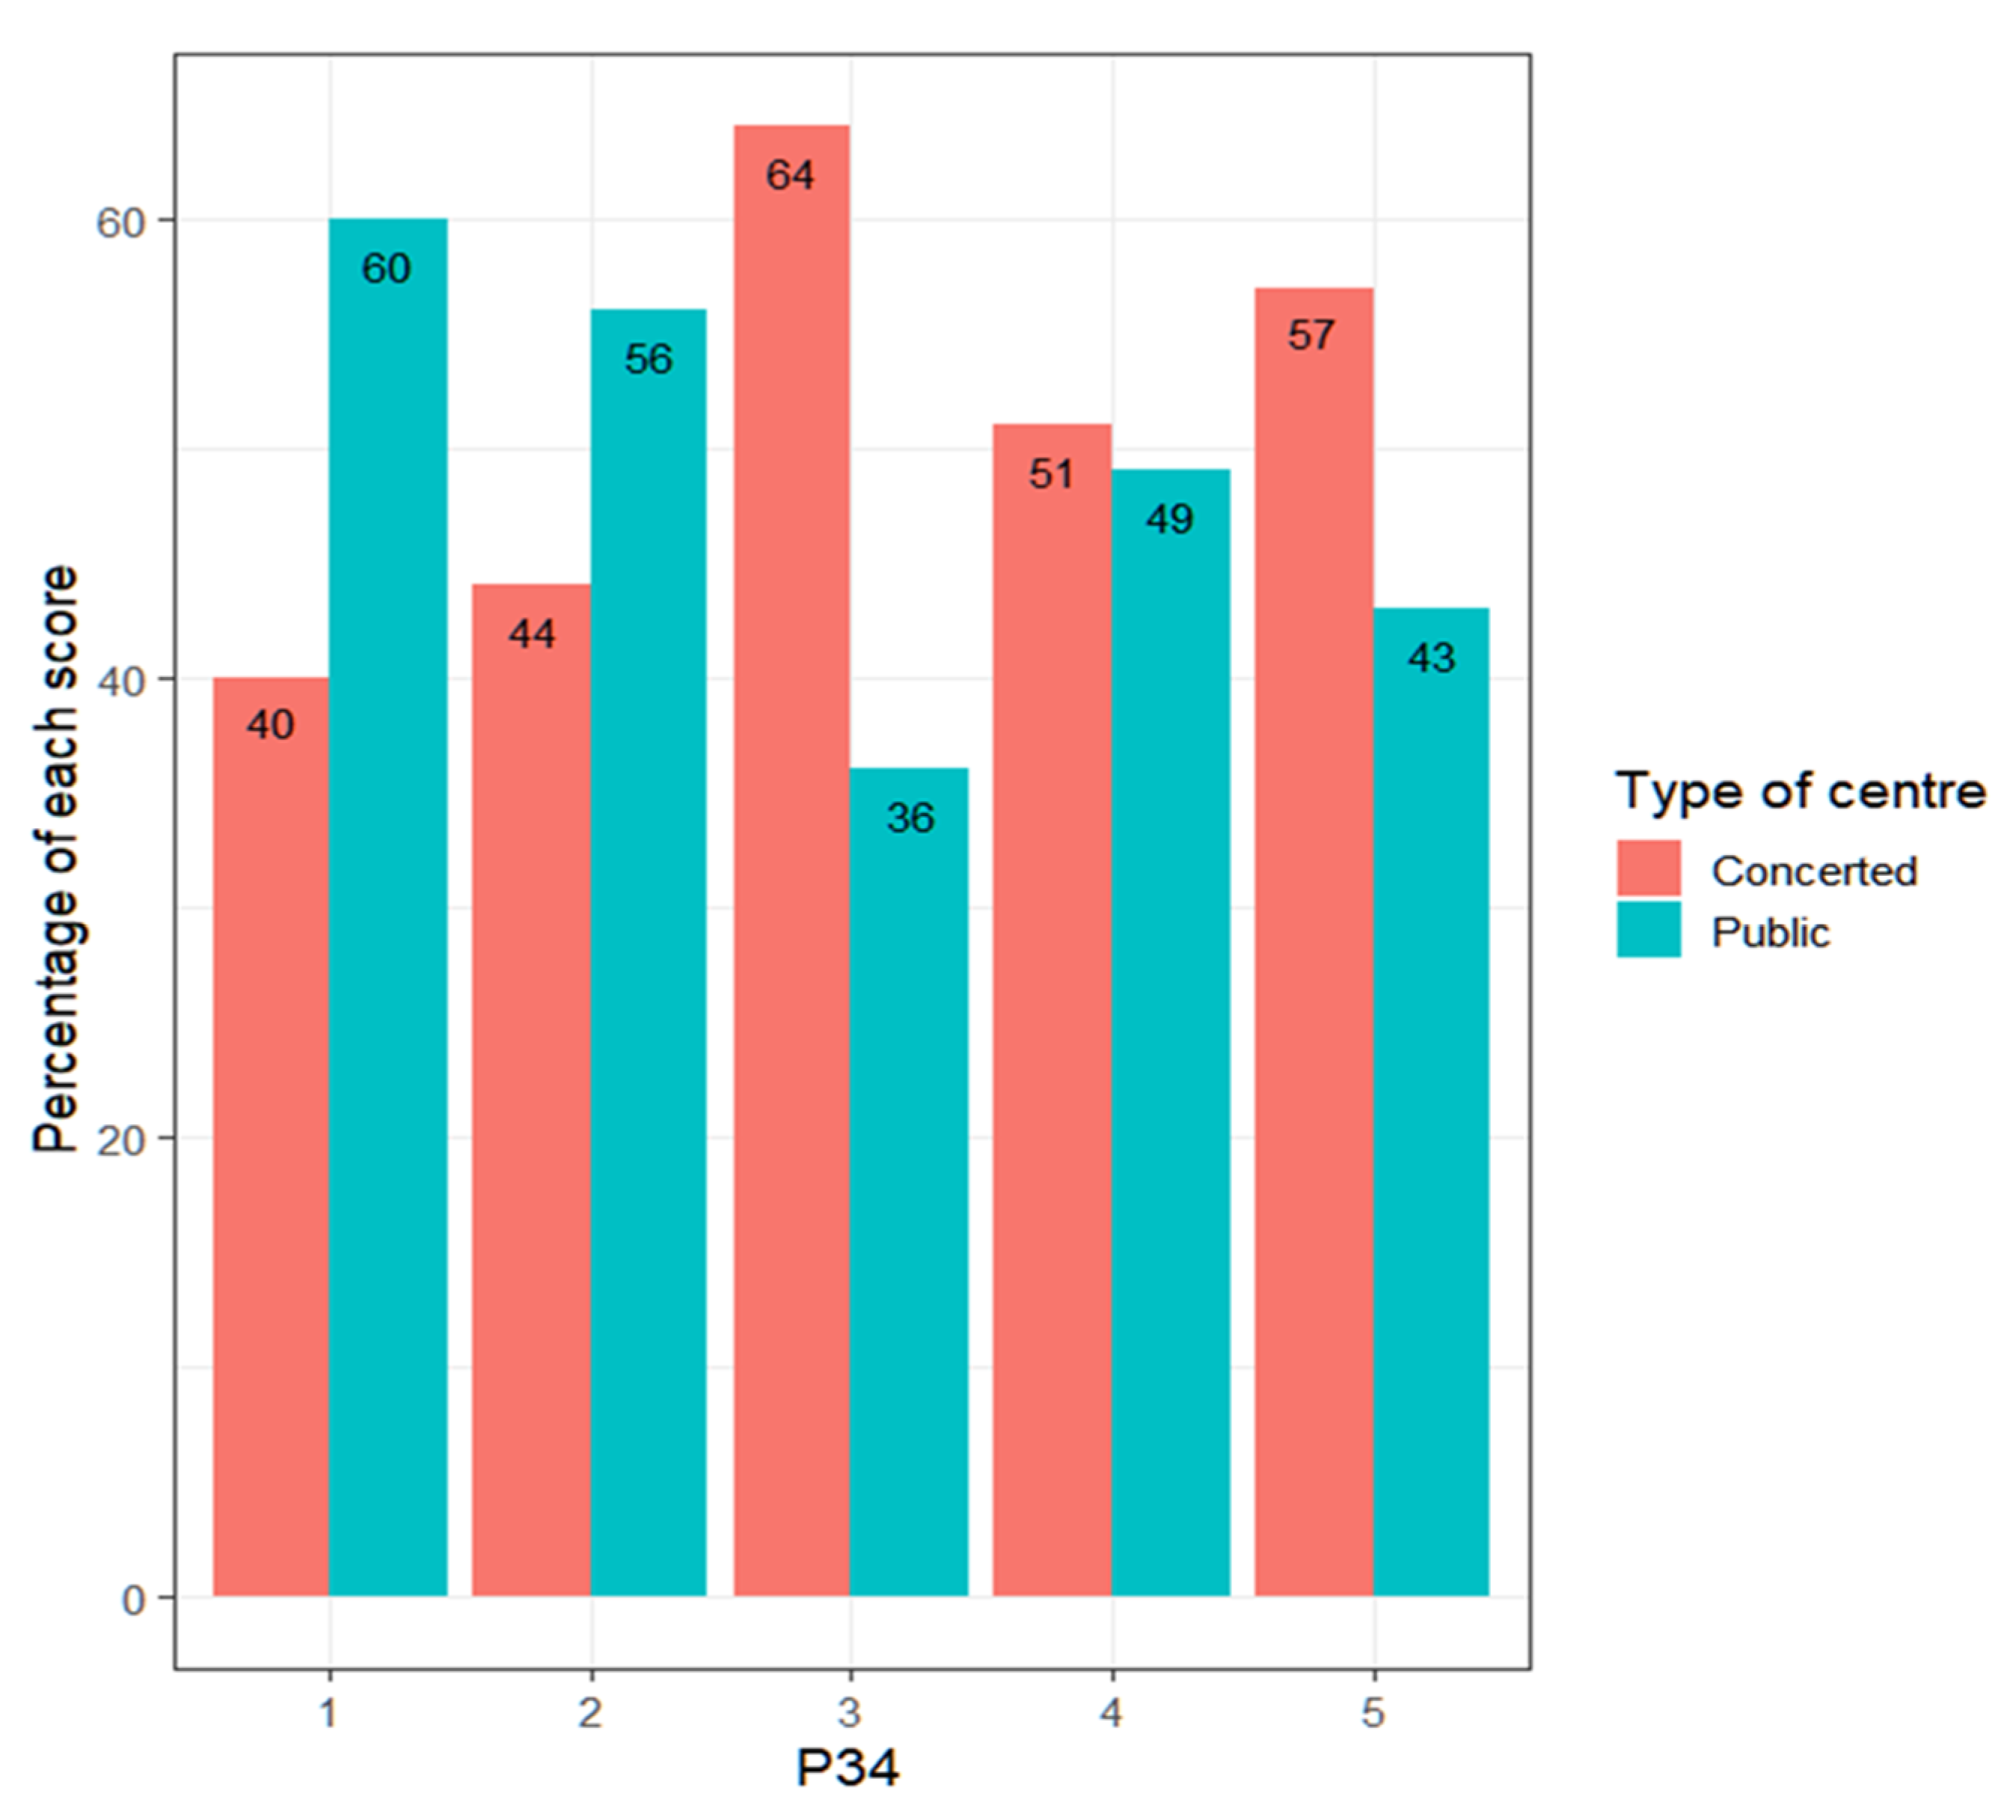
Regarding the commitment of teachers to the personal and cultural management of students—which, again, is an indicator of respect for the students—it is observed how there are no major discrepancies depending on the type of center (
Figure 9).
The Wilcoxon test gives a
p-value = 0.3149, confirming the visual impression. The distributions of the scores are similar. All teachers have a high commitment to the construction of the personal and cultural identity of their students, despite the difficulties that may arise. In addition, the number of teachers who score 4 or 5 depending on the type of center (contrast of proportions
p-value = 0.6715) reinforces this idea (
Table 6).
- (c)
Teaching vocation–self-esteem
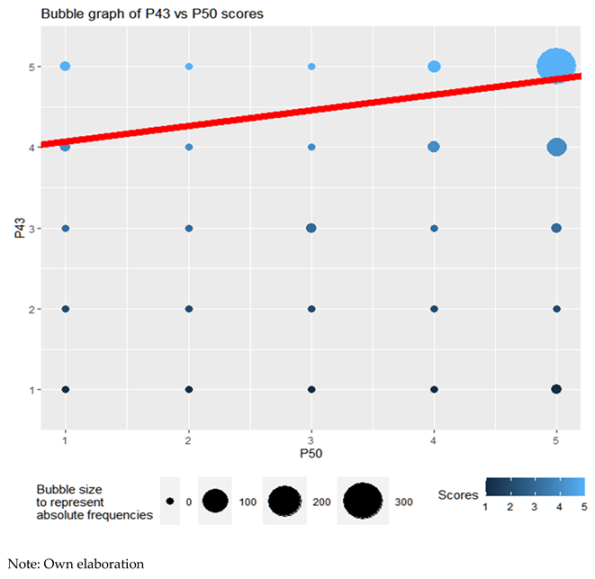
In this section, it is observed how teachers who like their work tend to promote the self-esteem of their students. This denotes a concern for the emotional development of their students. Although the existence of this linear relationship is observed (ANOVA for linear regression, p-value = 0.006 < 0.05), this is not very intense: R2 = 0.018. For nonparametric correlations, the results are similar. The Kendall rank correlation coefficient (Kendall’s coefficient τ) of value τ = 0.175 is significant with a p-value = 0.001 < 0.05. Spearman’s rank correlation coefficient (Spearman’s ρ) of value ρ = 0.177 is significant (p-value = 0.001 < 0.05). The bubble graph of the scores, as well as the line adjusted to the point cloud using least squares, attest to this.
![Ejihpe 13 00141 i001]()
Hypothesis 2. Classroom management presents significant differences with respect to the emotional competences of teachers depending on professional and sociodemographic variables (sex, age, professional experience, type of center in which they work, whether they have children and teaching vocation).
- (a)
Conflict management
The way of managing conflicts by teachers has a high emotional charge within the educational process. Analyzing the preparation of teachers to resolve such conflicts in an appropriate way—taking into account the emotional aspects—falls within their professional competence.
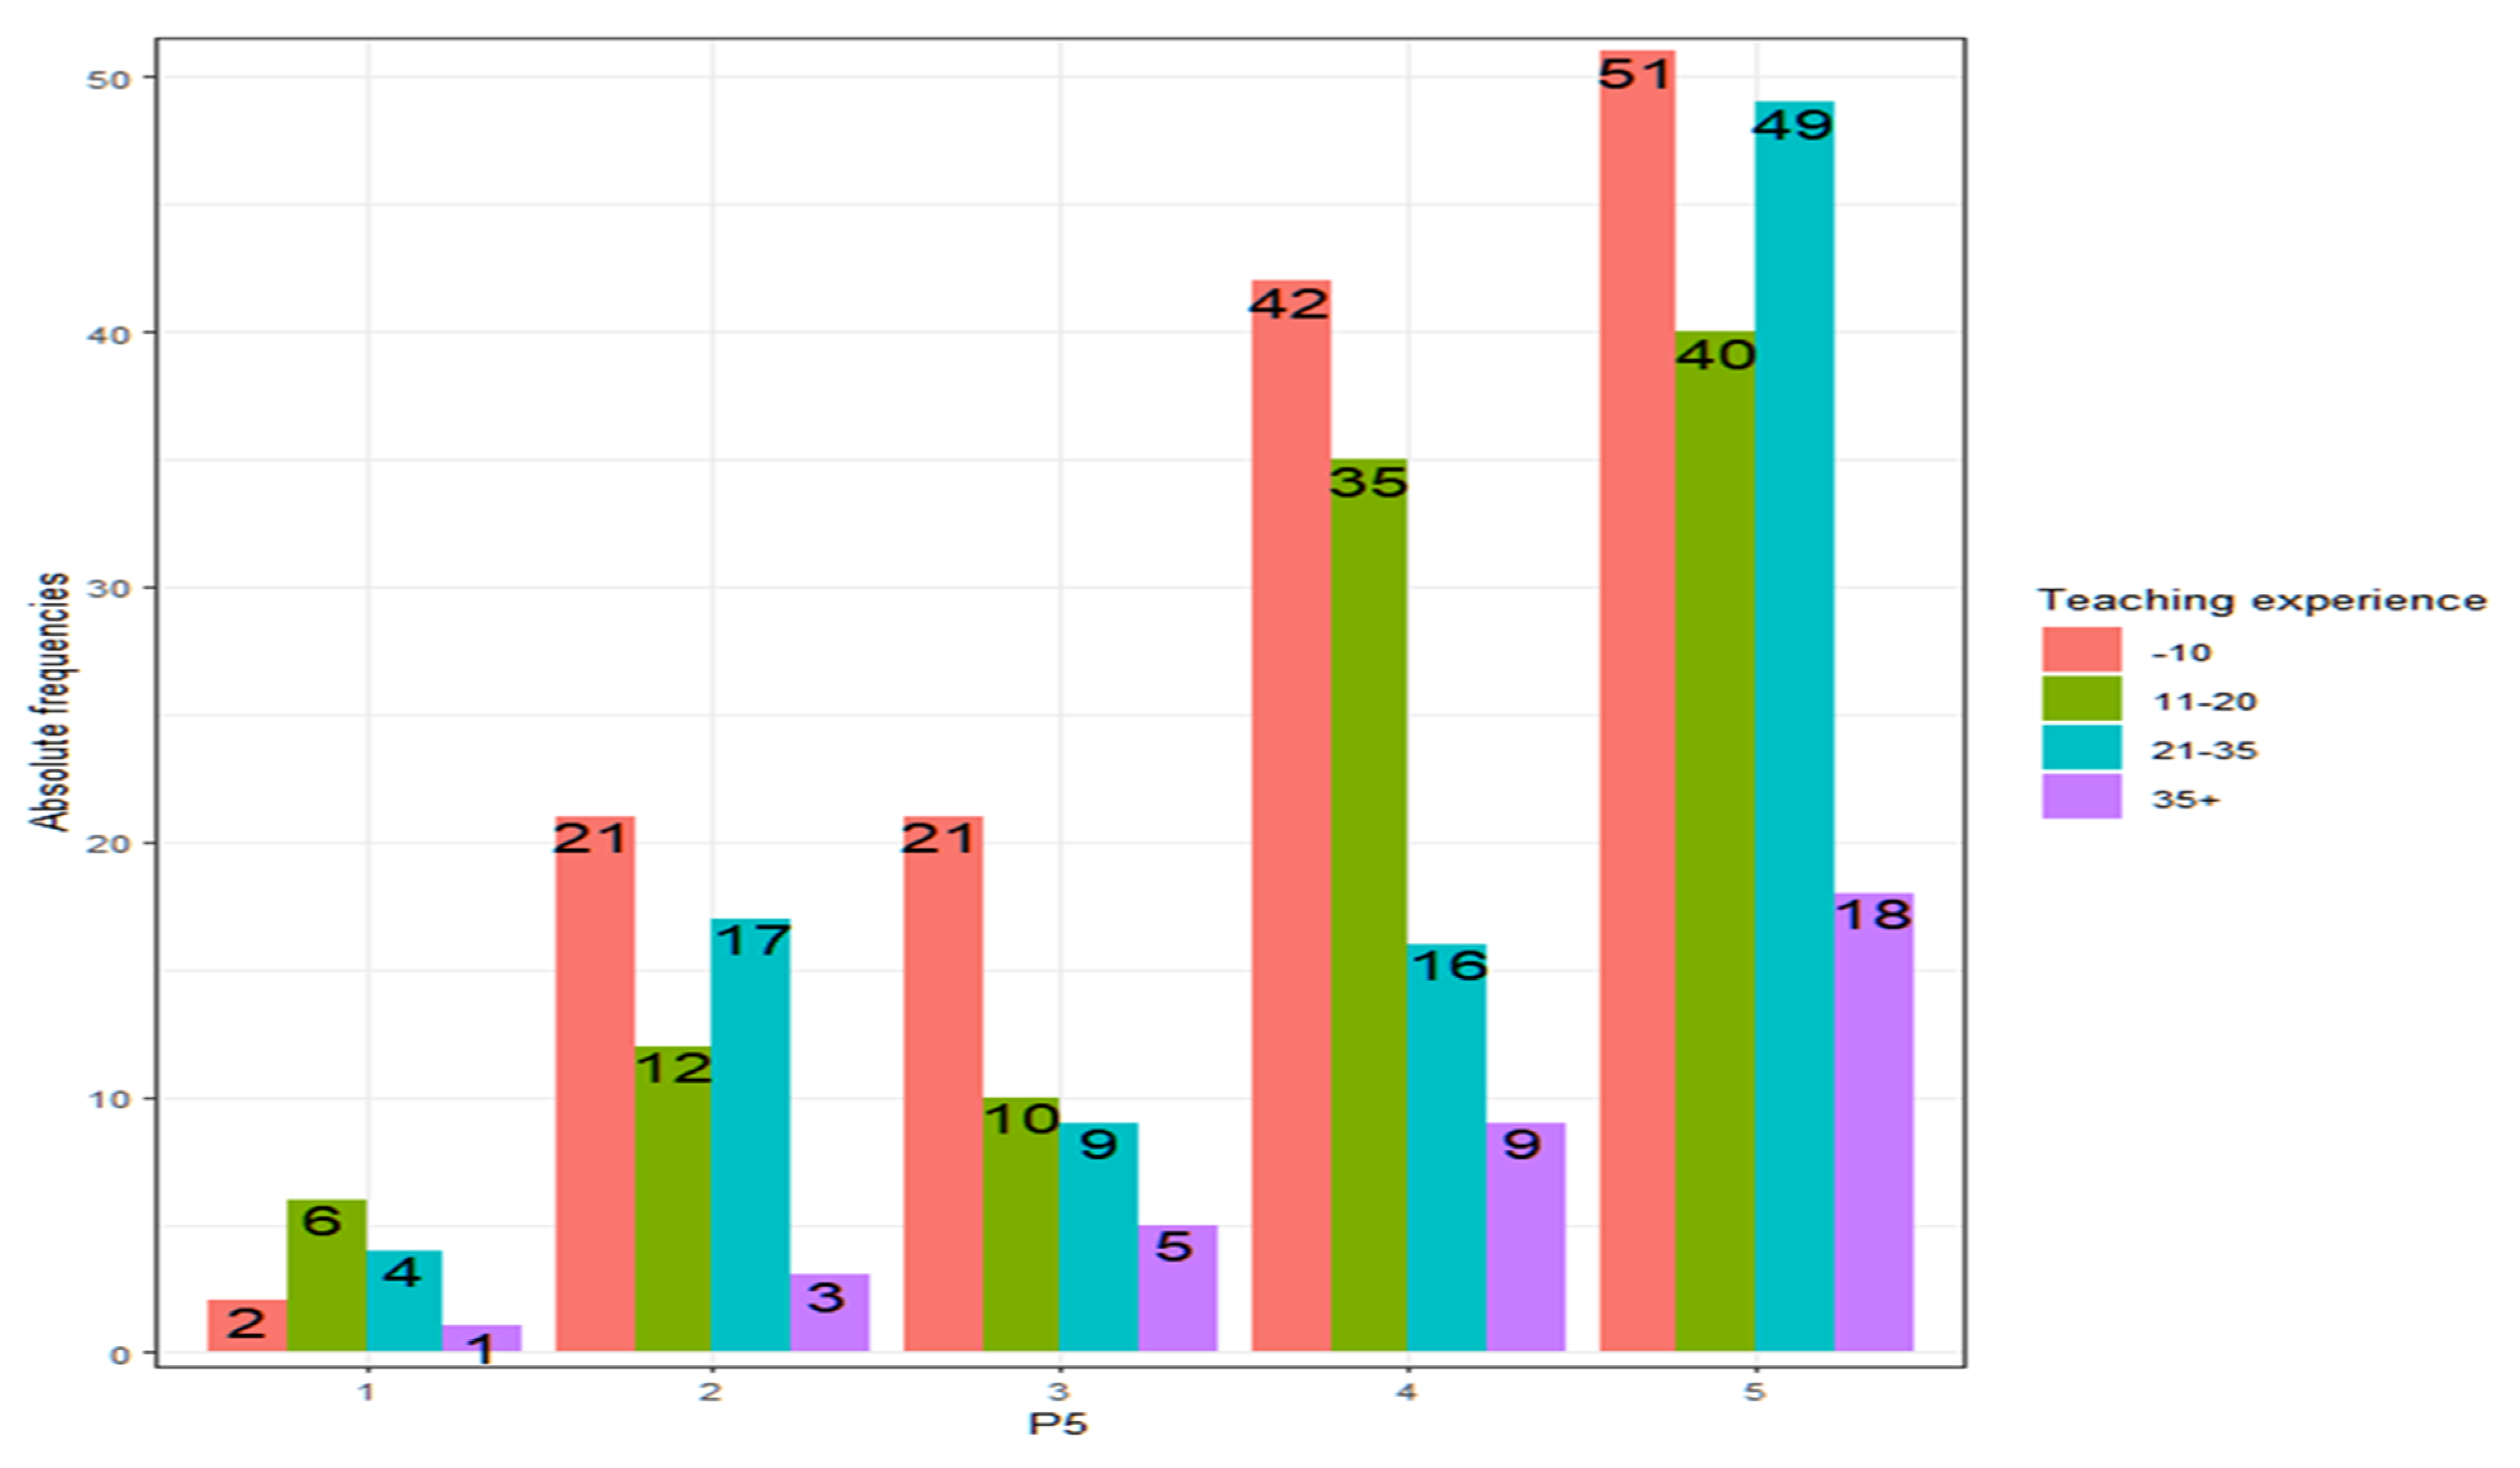
As shown in
Figure 10, all teachers score similarly in terms of their ability to deal with conflicts, regardless of their teaching experience (Kruskal–Wallis,
p-value = 0.4863 > α = 0.05).
It should be noted that the number of teachers who believe they are not prepared to manage conflicts in the classroom is remarkable (
Table 7).
These percentages of teachers who feel unprepared do not depend on sex (contrast of proportions, p-value = 0.9753), nor on whether they have children (contrast of proportions, p-value = 0.5505), on the type of center (contrast of proportions, p-value = 0.7839), on experience (contrast of proportions, p-value = 0.4920) or age (contrast of proportions, p-value = 0.9227).
- (b)
Methodological aspects
Creating learning environments for listening to students improves academic performance and the quality of interpersonal relationships. Both pedagogical initiatives have a high emotional depth and generate motivation and a desire to learn.
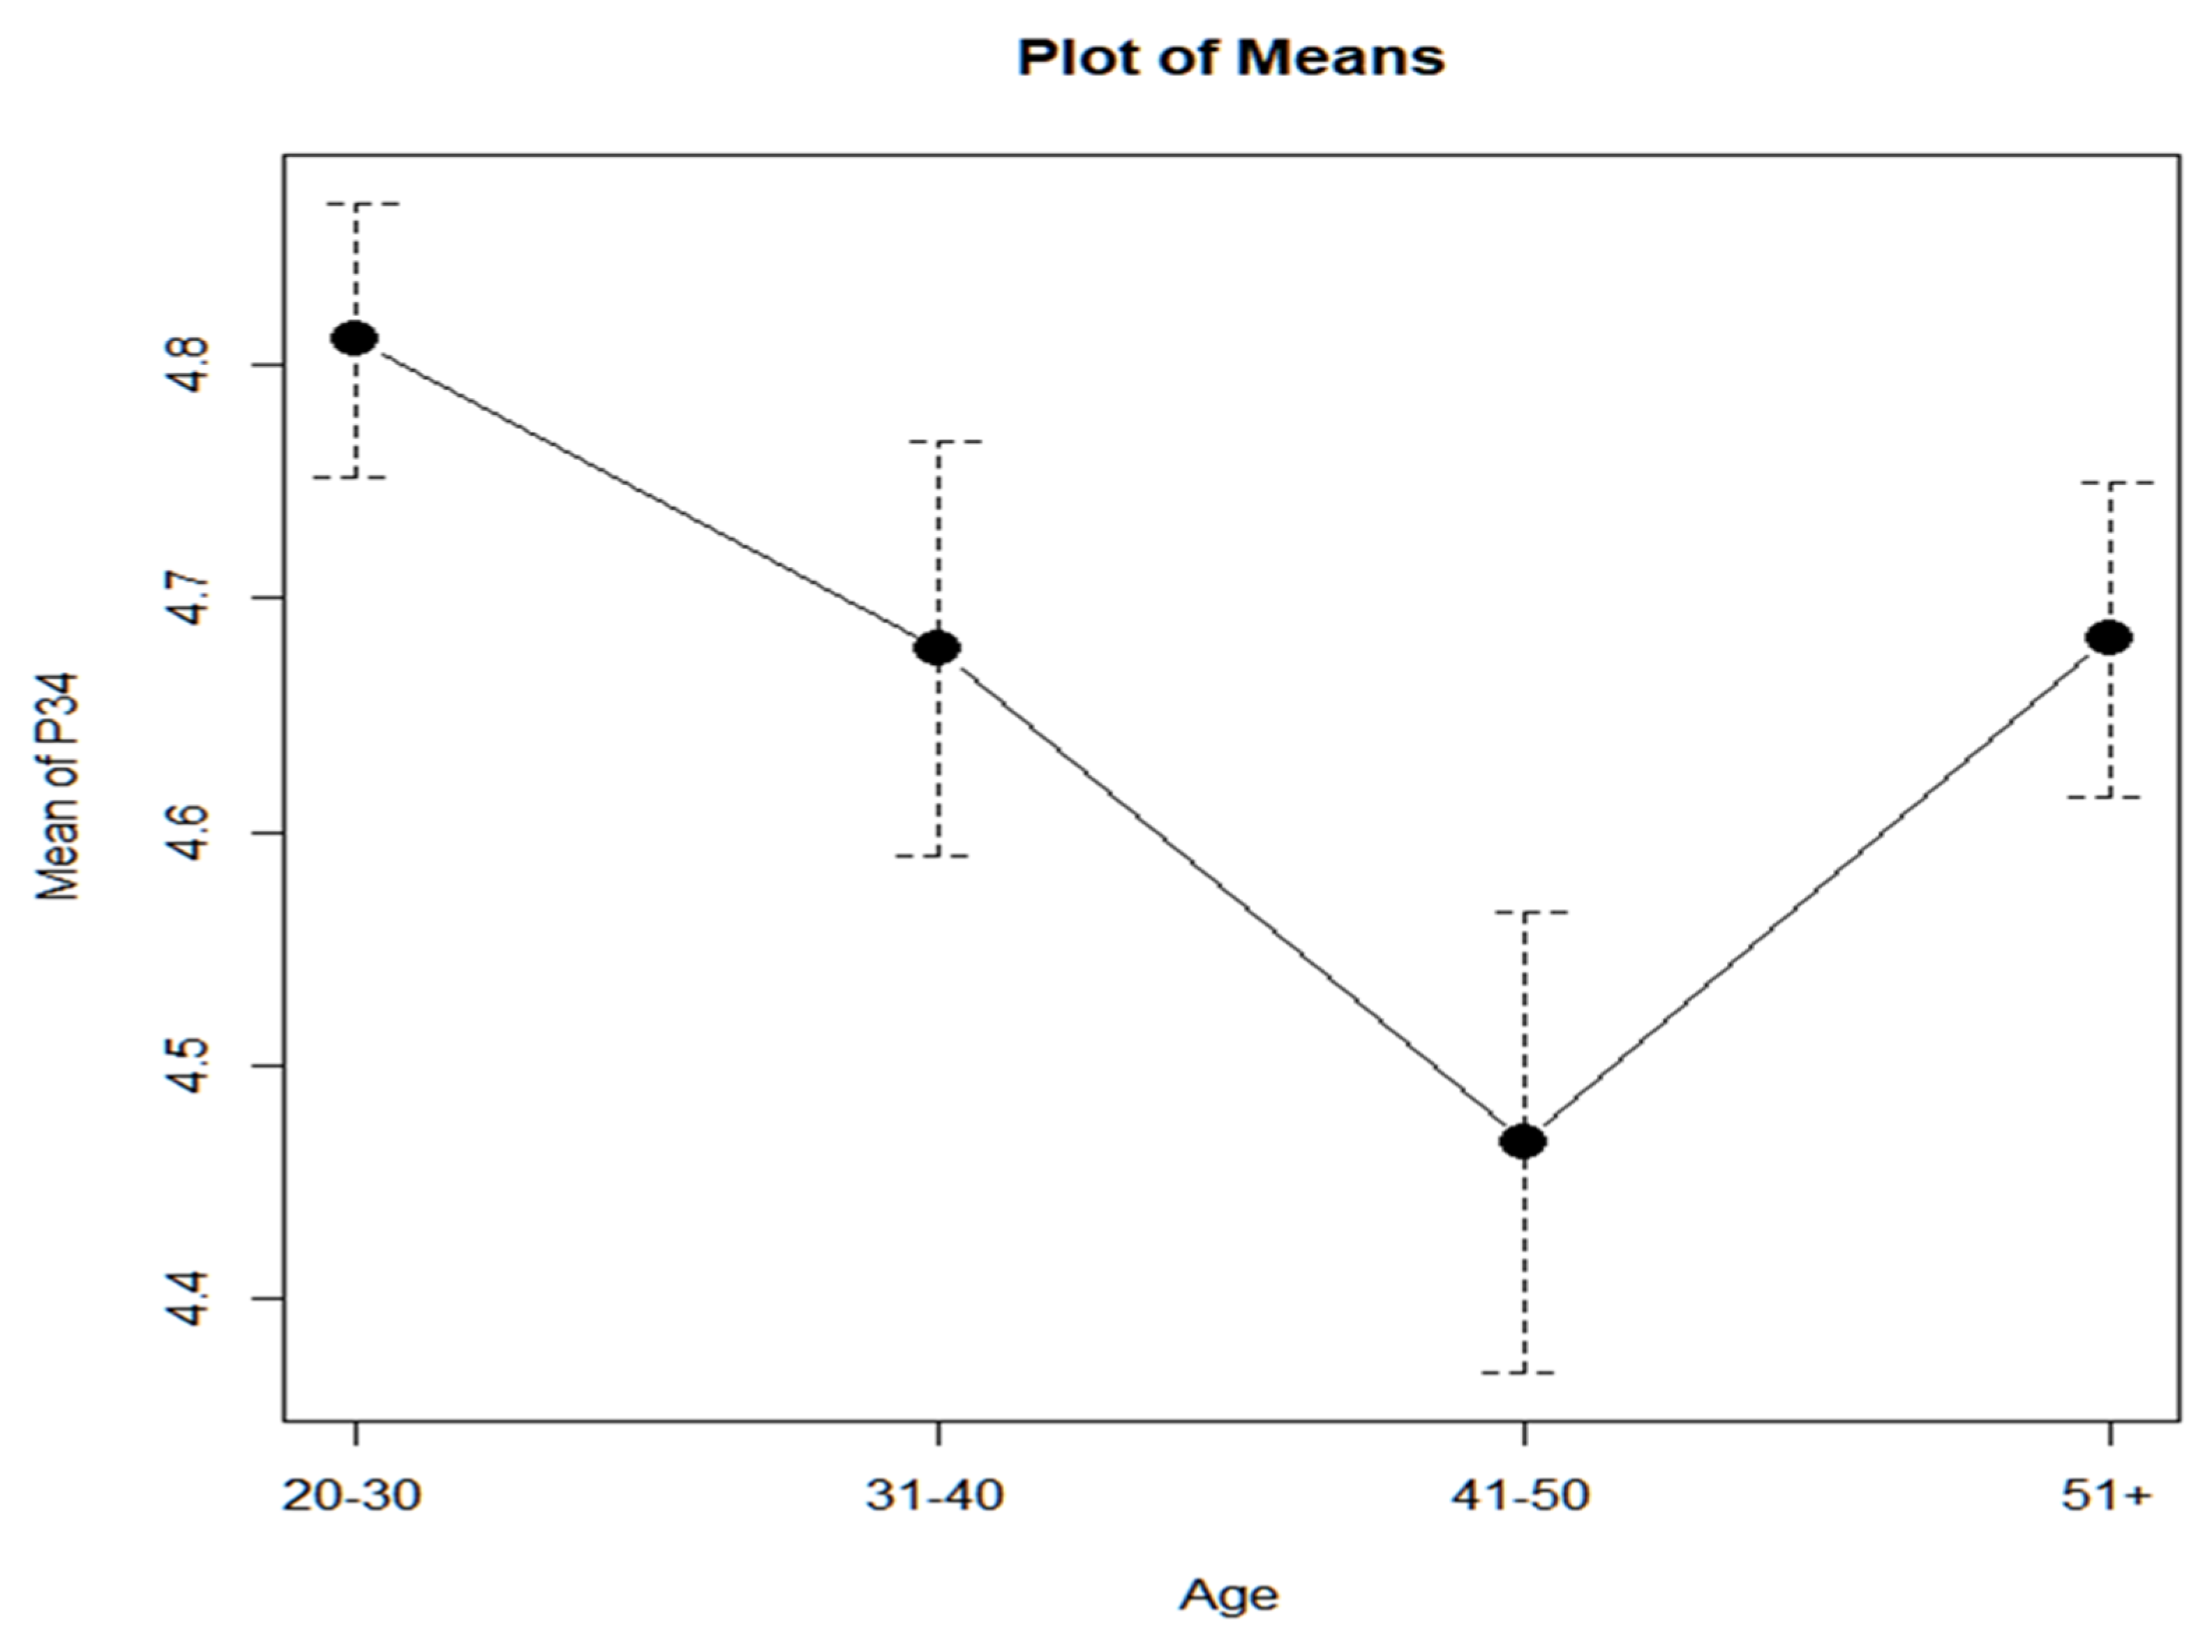
Analyzing the results, it is observed that younger teachers (20–30 years old) are the ones who are most concerned with creating learning environments that stimulate work in the classroom and attention to diversity, mainly with respect to the group of teachers between 41–50 years old (
Figure 11). As there is a case in which the variance of the groups with a center in the median, according to age, is not homogeneous (Levene with center in the median,
p-value = 0.02509 < 0.05), we opt for a one-factor ANOVA for the assumption that the variances are not equal (Welch test).
- (a)
For this case, the one-way ANOVA p-value (age), not assuming equal variances (Welch test), gives us a p-value = 0.0251 < 0.05. Therefore, there are significant differences between the groups.
- (b)
Post hoc contrasts indicate that the highest average score is obtained by the 20–30 age group and that the 41–50 age group obtains the minimum average score, with the difference between the two groups being significant.
- (c)
The differences between the rest of the age groups are not significant.
Although the Kruskal–Wallis test is not recommended, it is convenient in this case to see if this test (with the corresponding post hoc contrasts) confirms the above results (
Table 8):
- (a)
The Kruskal–Wallis test with a p-value = 0.002005 < 0.05 rejects the null hypothesis that the populations from which the samples have been extracted are equidistributed.
- (b)
Post hoc contrasts using Wilcoxon to compare each pair of age groups and adjusting the p-value using the Holm method give a similar result.
From the table, it can be deduced that the only significant difference occurs between age groups 20–30 vs. 41–50.
If the high responses (4 or 5) of teachers under 30 years of age compared to those over 30 years of age are analyzed, it is observed that the
p-value for the contrast of proportions is as follows:
p-value = 0.02477 < 0.05. It is accepted, therefore, that younger people score higher than older people, but with such a tight
p-value, the decision is not conclusive (
Table 9). The proportion of teachers who score high (4 or 5) is 95% CI = (90.24, 95.40), which shows that most feel committed to attention to diversity.
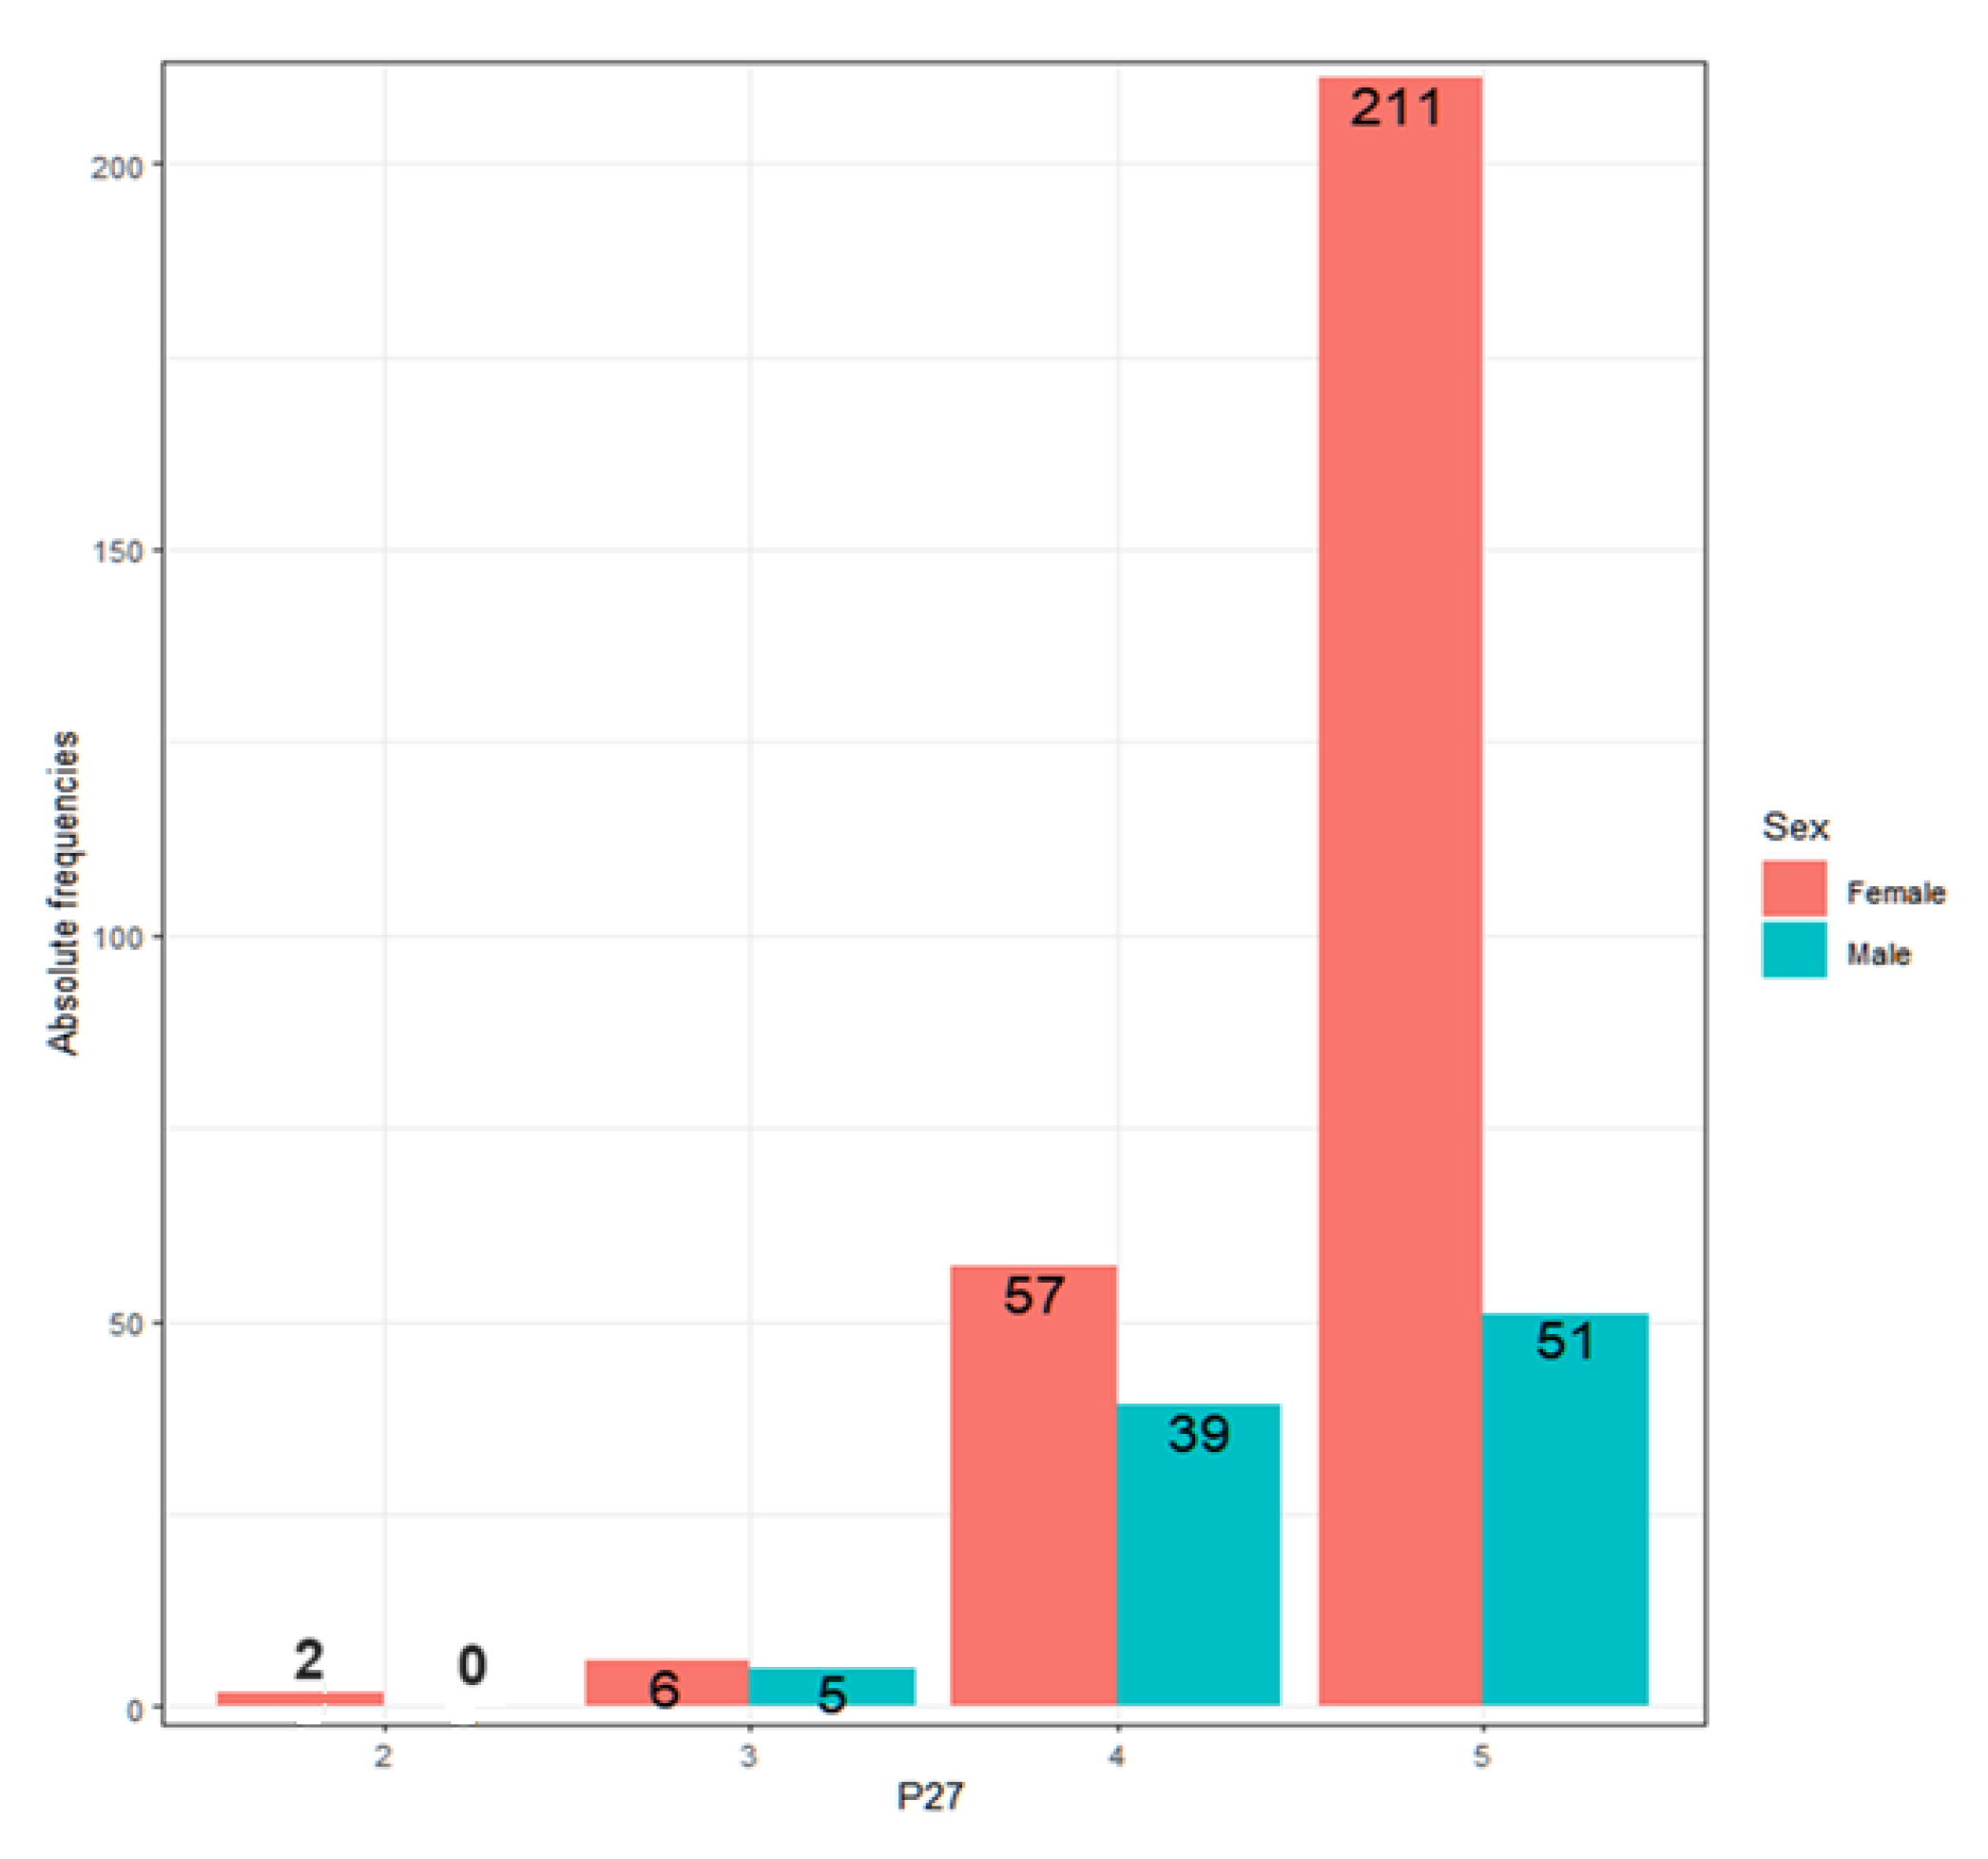
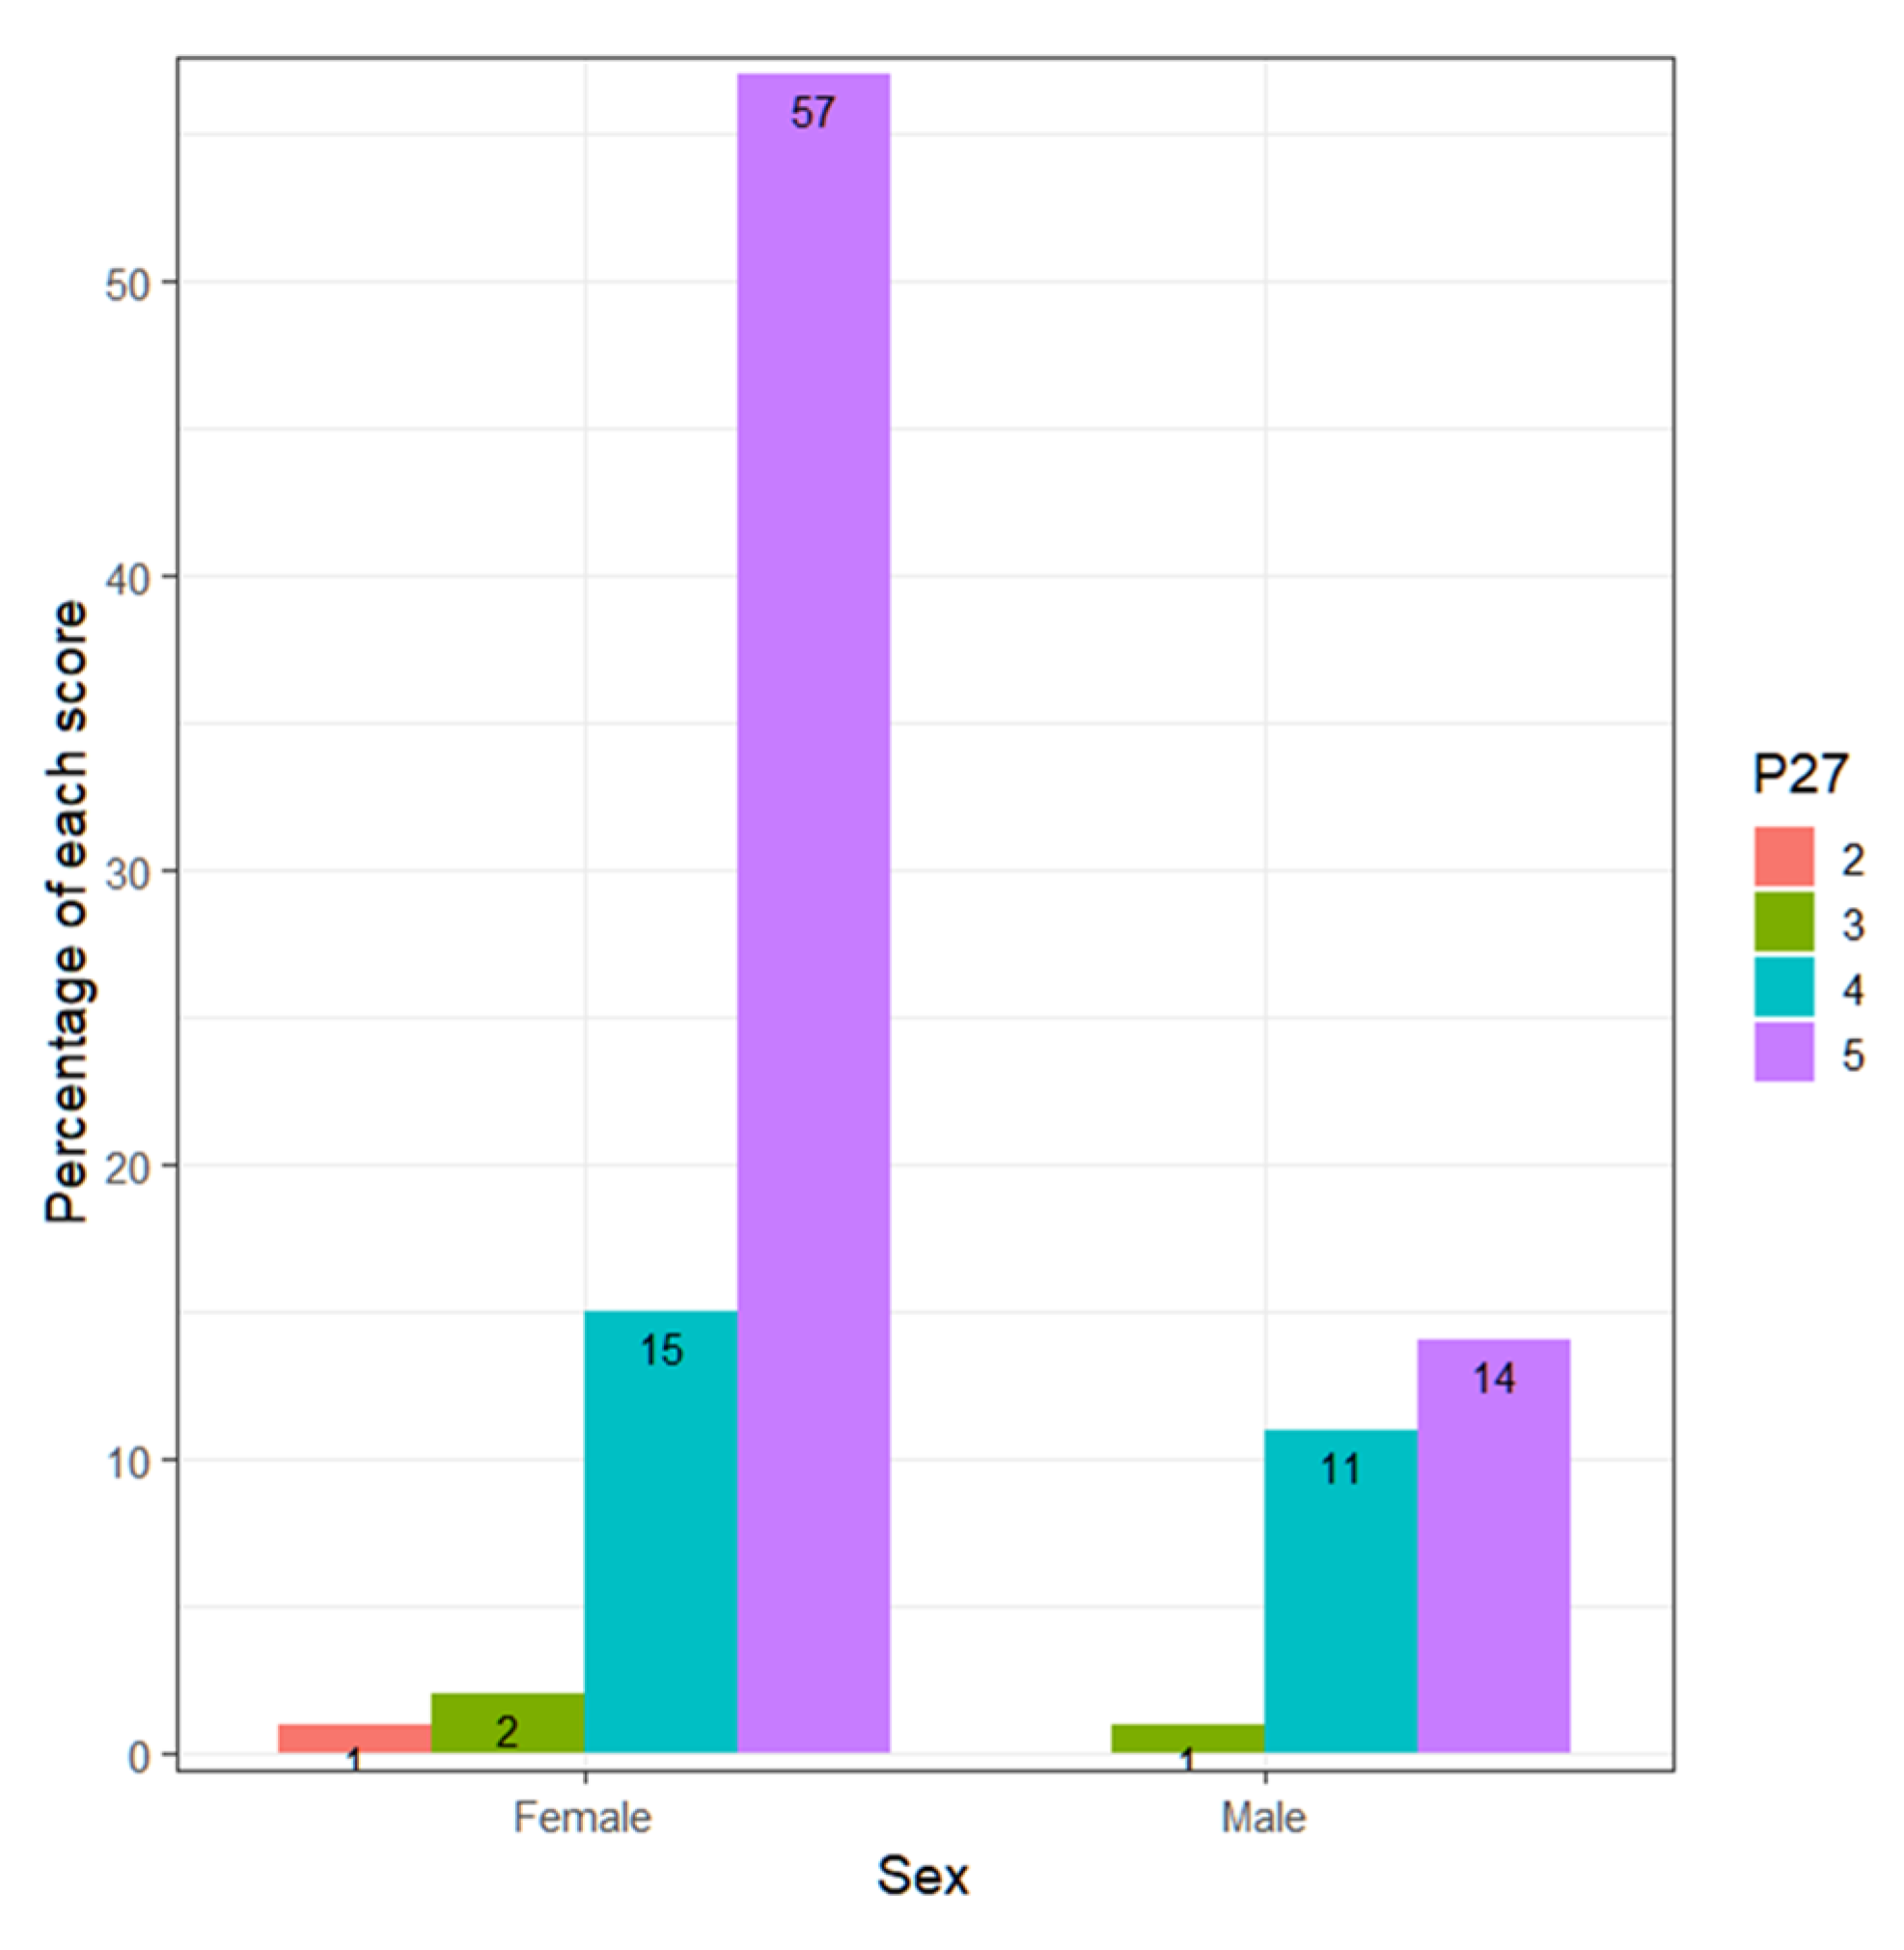
On the other hand, regarding the predisposition to listen to students and let them express their ideas and opinions, it is observed how teachers are the ones who listen to them the most (Wilcoxon,
p-value = 0.1717) (
Table 10).
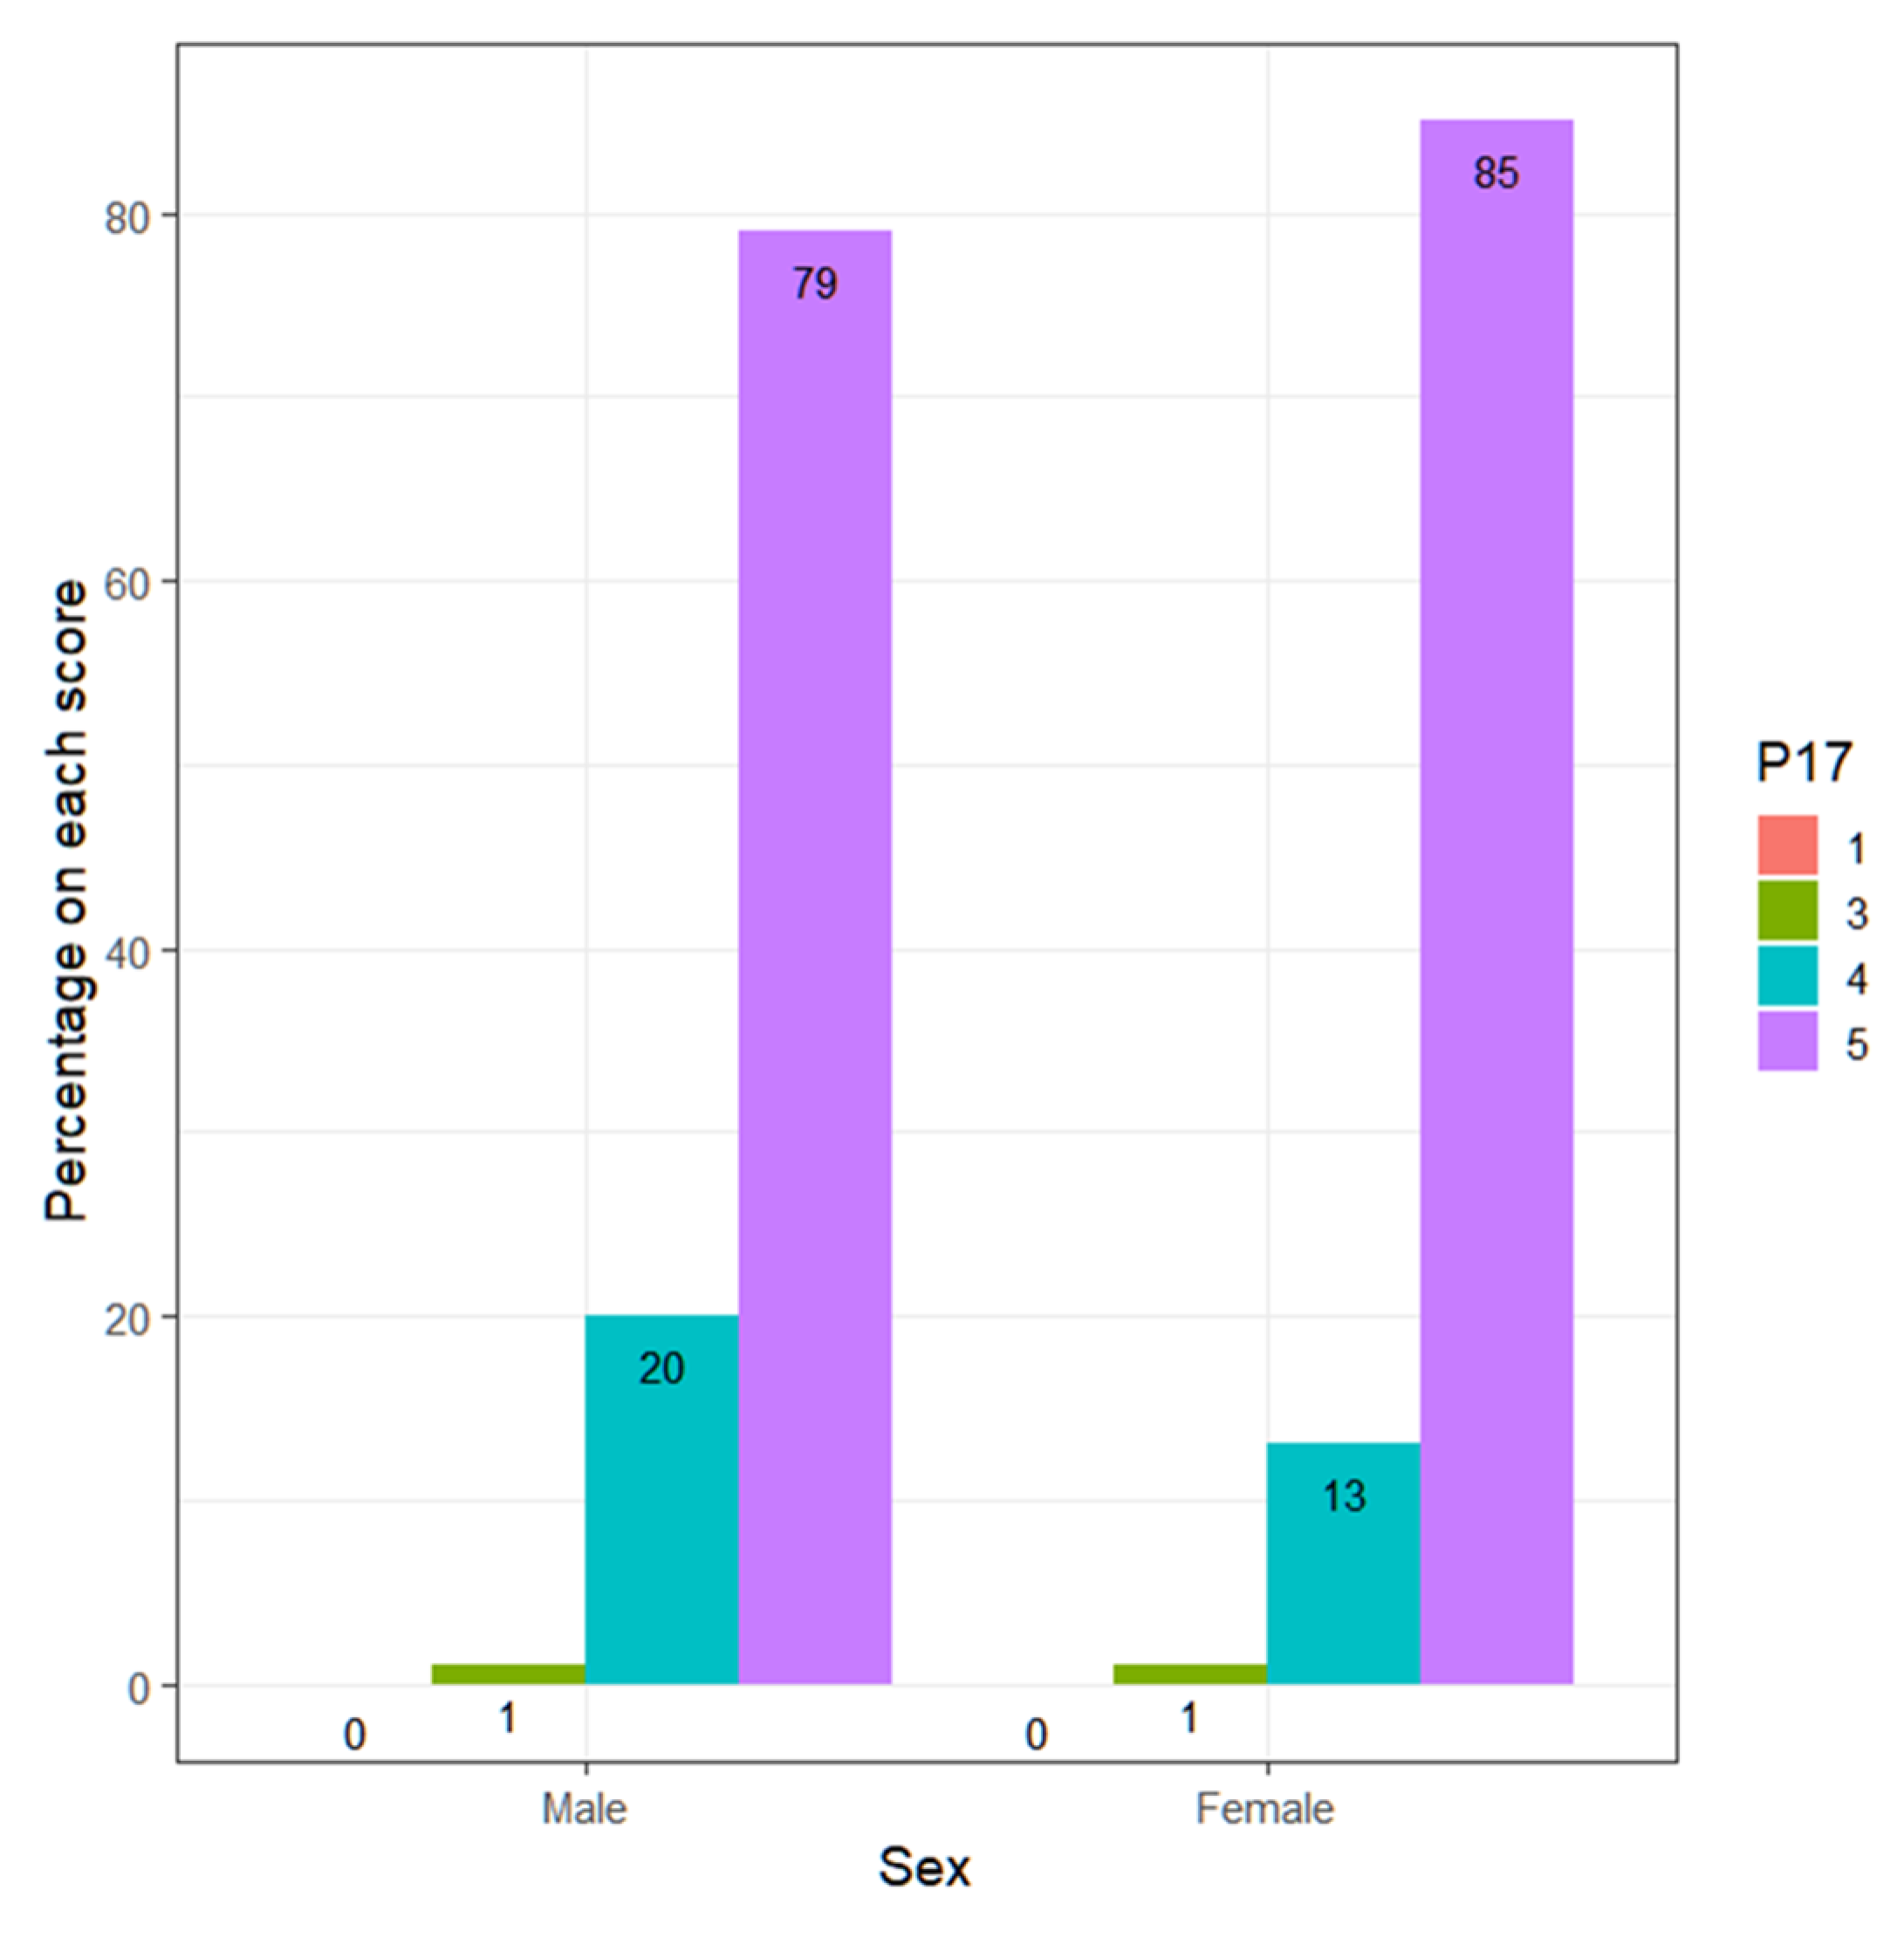
It is observed that 78.9% of men score 5, while 85.1% of women score 5. Meanwhile, 20.0% of men score 4, while women score 13.4% (
Figure 12).
The teachers who score high (4 or 5), according to sex, are (
Table 11):
The Fisher test to contrast the equality of proportions between both groups gives a p-value = 0.9999 > 0.05. Therefore, it cannot be denied that the proportion of teachers who score high (4 or 5) is the same between both sexes. The confidence interval for those who score high, regardless of sex, is as follows: CI95%= (96.9, 99.4).
- (c)
Vocation–conflict management
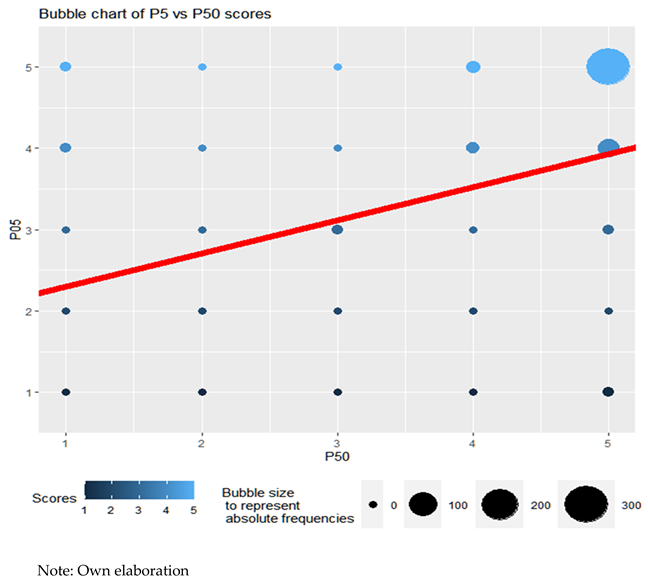
The results show how teachers who like their work tend, slightly, to prepare more to manage conflicts well, although this relationship is not very marked, since the correlation coefficients τ of Kendall (τ = 0.018) and ρ of Spearman (ρ = 0.112) are only slightly positive. Moreover, with such tight p-values, the decision on their significance is inconclusive. The bubble graph of the scores, as well as the line adjusted to the point cloud using least squares, prove it.
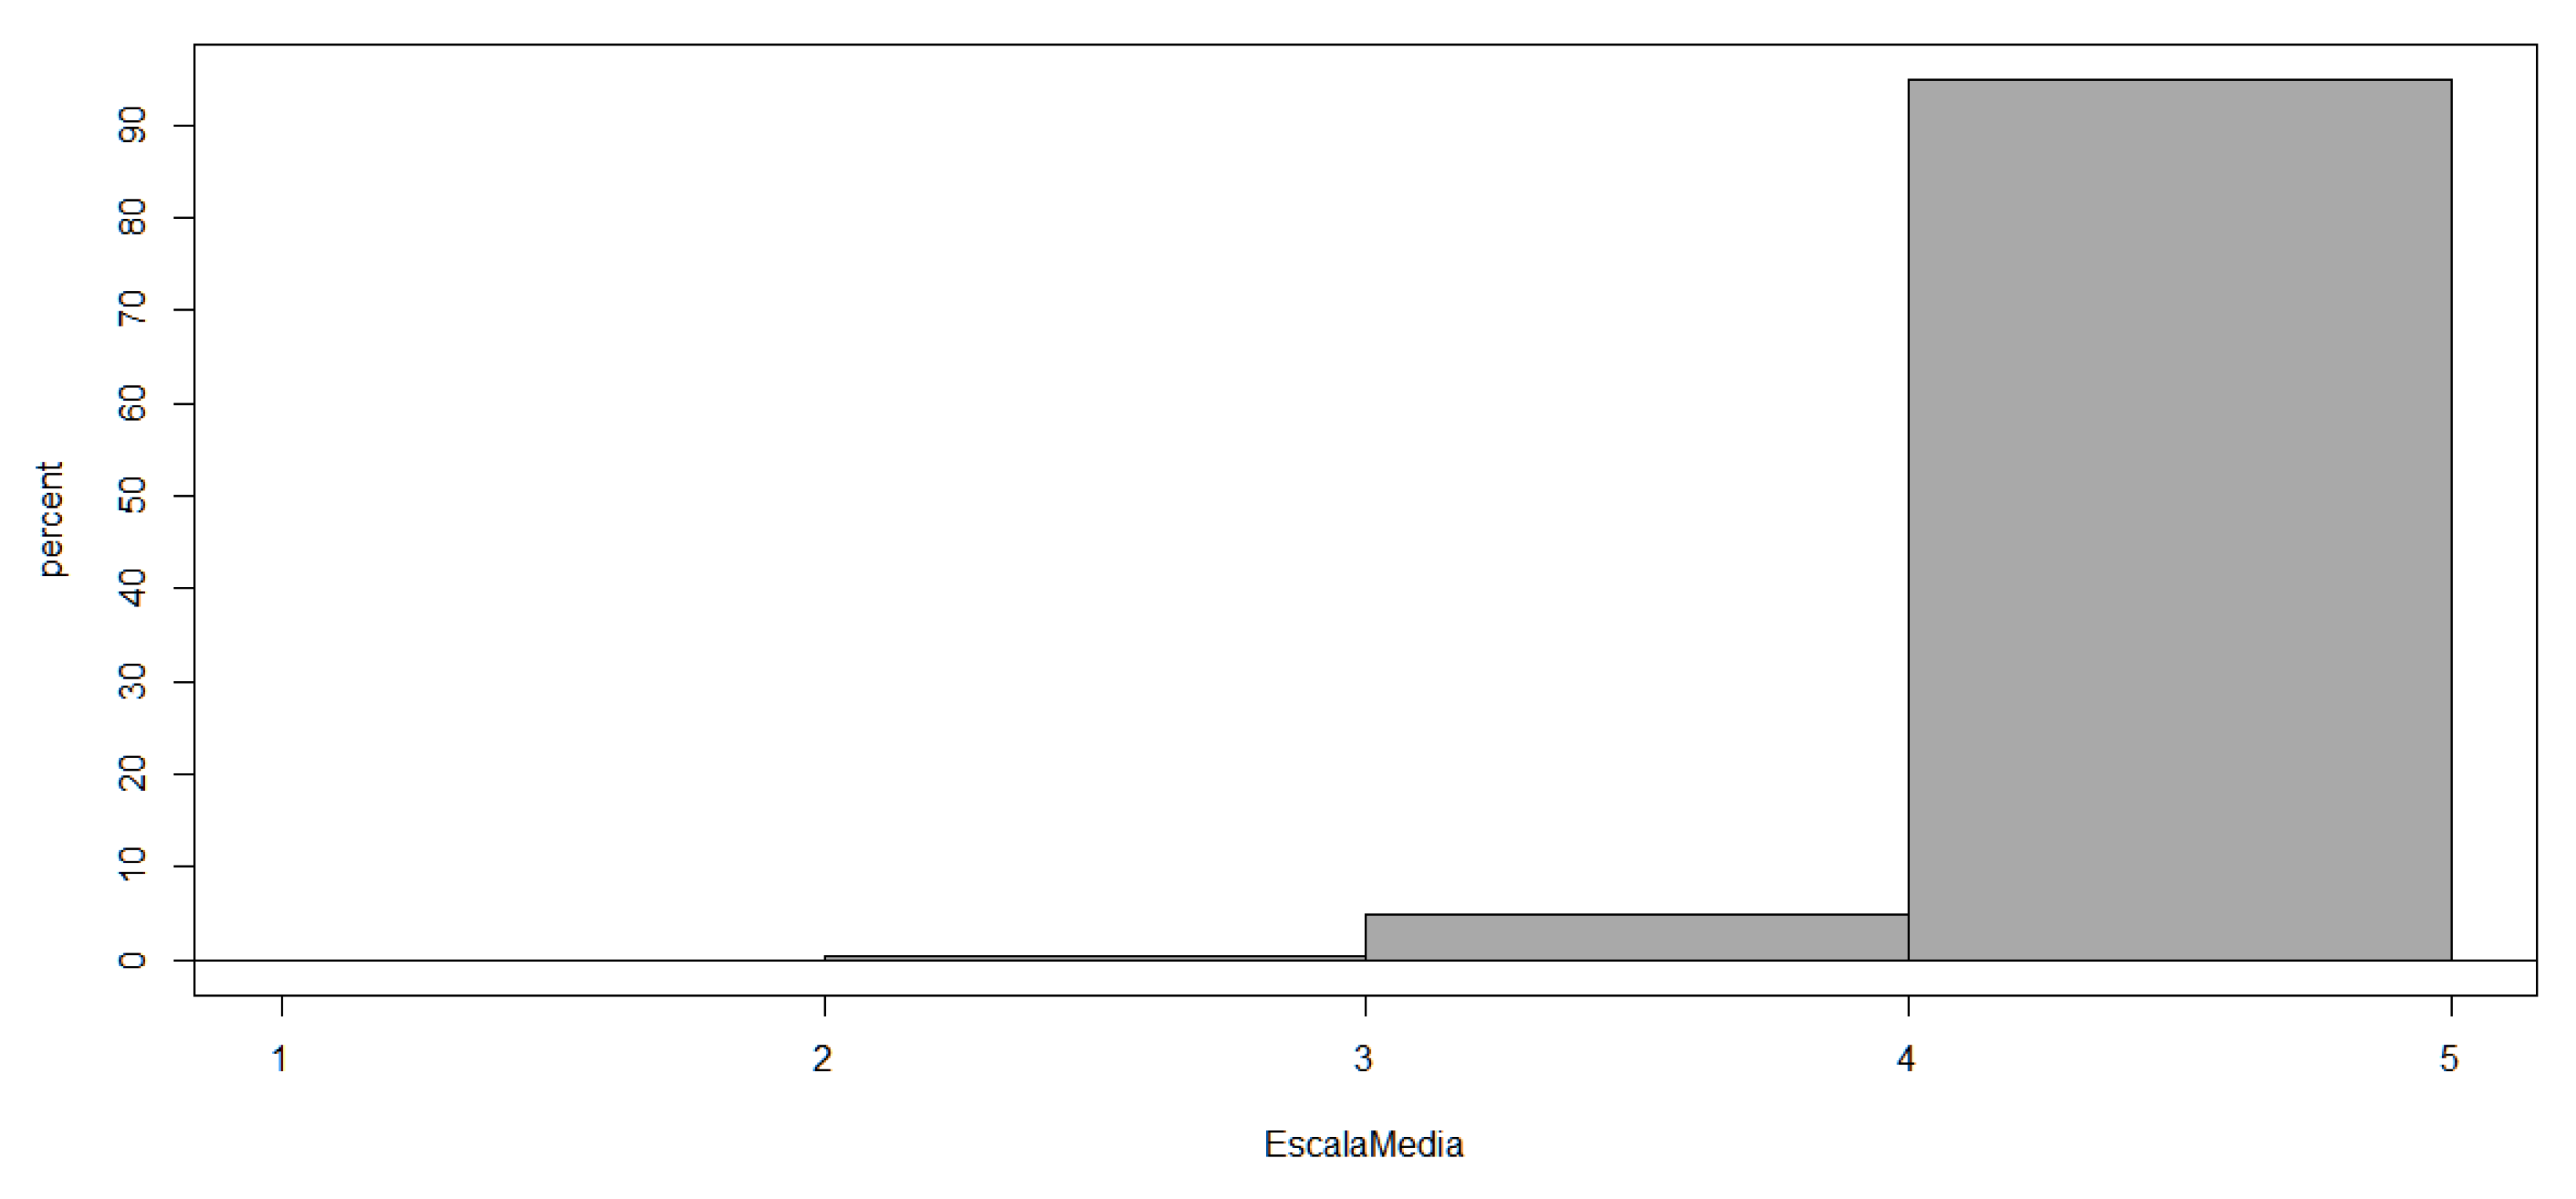
To conclude the Results section, we wanted to answer the question posed at the beginning of this article: Do primary school teachers in the city of Valencia feel that they have adequate emotional competencies to deal with the emotional problems caused by COVID-19 among students? The following figure (
Figure 13) clearly shows how teachers perceive themselves in terms of their emotional competence (4.6 out of 5):
