Article

Analysis of the Effects of Process Parameters on Start-Up Operation in Continuous Wet Granulation

1
Department of Chemical System Engineering, The University of Tokyo, Tokyo 113-8656, Japan
2
Laboratory of Pharmaceutical Process Analytical Technology, Ghent University, B-9000 Ghent, Belgium
3
BIOMATH, Department of Data Analysis and Mathematical Modelling, Ghent University, B-9000 Ghent, Belgium
*
Author to whom correspondence should be addressed.
Processes 2021, 9(9), 1502; https://doi.org/10.3390/pr9091502
Submission received: 13 July 2021 / Revised: 13 August 2021 / Accepted: 20 August 2021 / Published: 25 August 2021
(This article belongs to the Section Pharmaceutical Processes)

Abstract

:
Toward further implementation of continuous tablet manufacturing, one key issue is the time needed for start-up operation because it could lead to lower product yield and reduced economic performance. The behavior of the start-up operation is not well understood; moreover, the definition of the start-up time is still unclear. This work investigates the effects of process parameters on the start-up operation in continuous wet granulation, which is a critical unit operation in solid drug manufacturing. The profiles of torque and granule size distribution were monitored and measured for the first hour of operation, including the start-up phase. We analyzed the impact of process parameters based on design of experiments and performed an economic assessment to see the effects of the start-up operation. The torque profiles indicated that liquid-to-solid ratio and screw speed would affect the start-up operation, whereas different start-up behavior resulted in different granule size. Depending on the indicator used to define the start-up operation, the economic optimal point was significantly different. The results of this study stress that the start-up time differs according to the process parameters and used definition, e.g., indicators and criteria. This aspect should be considered for the further study and regulation of continuous manufacturing.

1. Introduction

Continuous manufacturing has been introduced as an alternative to conventional batch in tablet manufacturing processes [1]. In batch-wise manufacturing, each unit operation is performed separately with a certain lot size, e.g., 100 kg. Continuous manufacturing, where all unit operations are interconnected, offers flexibility in manufacturing scale by tuning running time, and enables production with smaller equipment. Researchers have discussed the benefits of continuous manufacturing from various perspectives, e.g., flexibility to demand change, less need for scale-up, and compatibility with process control [2,3].
For further application of continuous manufacturing, various technical and regulatory challenges still exist. Examples of technical challenges are a lack of the understanding of material attributes and process parameters, and high requirements for process analytical technologies (PAT) [4,5]. Among unit operations in continuous manufacturing, wet granulation is one of the critical unit operations, which aims to improve the uniformity and flowability of premixed materials [6,7]. Numerous studies have performed design of experiments (DoE) to characterize key parameters in continuous wet granulation in terms of torque [8,9,10,11], residence time distribution [10,12,13,14], granule properties [8,9,10,11,13,14,15,16,17,18,19,20,21,22,23], and tablet quality [10,16,17,18,19,21,23]. From a regulatory perspective, process parameters need to be well defined, which could be more difficult in continuous manufacturing. For example, due to the nature of operation, the definition of lot size is different from that in batch manufacturing and has yet to be fully fixed [24]. Lot size definition is critical because it affects other challenges, e.g., material traceability and control strategy [24].
One important technical and regulatory challenge is the start-up operation [24]. Materials processed during the start-up operation are to be excluded and disposed of, which will reduce the product yield. The impact of the start-up operation has been reported in previous papers. Vercruysse et al. [25] showed stabilization periods of the process in terms of process responses, e.g., torque. Pauli et al. [26] focused on the start-up in terms of loss-on-drying in the drying unit to develop a process control strategy. Matsunami et al. [27] performed a large-scale experimental comparison, where continuous manufacturing showed a lower yield than batch manufacturing due to the losses during the start-up operation. In previous case studies, losses during start-up operations sometimes negatively impacted the economic competitiveness of continuous processes relative to their batch counterparts [28,29]. However, it is still required to get a better understanding of the start-up operation for the sake of standardization and minimizing the start-up time. The start-up operation issue can be divided into two problems: (i) lack of knowledge about the impact of process parameters on the start-up and (ii) no clear definition of the start-up operation. The definition of start-up, which has been a convention, needs to be discussed scientifically due to its high impact on the economic performance. While model-based analyses of process parameter impacts have been published, e.g., [30], most of them have focused only on the steady state. Discussions of the critical indicators defining the start-up and investigations of process and product stabilization are still missing.
This work examines the effect of process parameters on the start-up operation in continuous twin-screw wet granulation. A full factorial design was performed, including three critical process parameters, in twin-screw wet granulation. For the sake of the investigation, a twin-screw wet granulator was run for one hour for each experimental condition. Two indicators were measured during the experiments: the torque of the granulator as a process response, and granule size distribution as a product quality response. The torque profiles were analyzed and interpreted via fitting of a first-order system as well as regression analysis. Granule size distribution was transferred to the lower dimensional spaces by fraction calculation and multivariate analysis. After finding the relationships between process parameters and the start-up operation, a cost analysis was performed to evaluate the impact of the start-up operation.

2. Materials and Methods

2.1. Materials

The composition of the formulation used in the experiments is presented in Table 1. Theophylline (supplied by BASF, Ludwigshafen, Germany), which is frequently used in previous studies (e.g., [31]), was used as the active pharmaceutical ingredient (API). α-lactose monohydrate (Pharmatose 200M, by DEF Pharma, Goch, Germany) and microcrystalline cellulose (Avicel PH 101, by DowDuPont, Midland, MI, USA) were used as the fillers. Hydroxypropylmethylcellulose (HPMC) (Methocel E15 LV, Colorcon, Dartford, UK) was used as the binder.

2.2. Manufacturing Methods

This experiment focused only on twin-screw wet granulation, which is thought to be critically affected by the start-up operation. All raw materials mentioned in Table 1 were preblended in a tumbling blender (Inversina Bioengineering, Wald, Switzerland) for 15 min at 25 rpm. Preblended materials were further processed in the granulation unit using the granulation module of the ConsiGma™—25 unit (GEA Pharma Systems, Collette, Wommelgem, Belgium). The granulation module consists of two corotating screws, where the diameter and a length-to-diameter (L/D) ratio were 25 mm and 20:1, respectively. The preblended materials were gravimetrically fed to the granulation module by a twin-screw loss-in-weight feeder (KT20, Coperion K-Tron, Niederlenz, Switzerland). The barrel temperature in the granulation module was controlled at 25 °C. Distilled water, as the granulation liquid, was added before the first kneading zone using a twin-peristaltic pump at 40 rpm. The twin-peristaltic pump was positioned out-of-phase and connected to a silicon tubing with an internal and external diameter of 0.8 and 2.4 mm, 1.6 and 3.2 mm, 2.4 and 5.0 mm, or 3.2 and 5.8 mm, respectively. The silicon tubings were further connected to nozzles with an orifice of 0.8, 1.6, 2.4, or 3.2 mm. Tubings and nozzles were selected and changed based on the liquid flow rate. After the wetting of preblended materials, the materials were subsequently sheared and compressed in a first kneading zone consisting of six kneading parts (L = D/4 for each part) with a forward stagger angle of 60°. Granules were passed in a small conveying zone (L = 1.5D) and consequently in another kneading zone identical to the first kneading zone. At the end of the screws, two small kneading discs (L = D/6 for each kneading part) were located to reduce the fraction of oversized granules. All collected granules were oven dried (24 h, 40 °C, 25% RH) before further granule characterization.
A two-level full-factorial DoE was performed to analyze the impact of three process parameters (factors) on the start-up time. These factors were chosen based on the ease of changing them during operation and their impact on process performance and product quality. The factors chosen in the experiments were mass feed rate v (5.0 and 20 kg h−1), screw speed r (500 and 900 rpm), and liquid-to-solid (L/S) ratio α (0.12 and 0.16), based on previous studies [32]. L/S ratio is defined as the ratio of liquid feed rate to solid feed rate, which is easily changeable during the operation. In previous studies on continuous wet granulation, L/S ratio has been specified as a critical process parameter for granule size and final product quality [8,33,34]. The values of factors used in the ten runs are summarized in Table 2, where two repeat center point runs were performed (N9 and N10). Running time per each experimental run was one hour, and the inside of the granule barrel was cleaned after every run. The start of a run was defined as the time when liquid addition had started by connecting tubings with nozzles.

2.3. Characterization Methods

The torque profiles and granule size distribution were measured during and after the experiments to observe the impact of the start-up conditions on the time needed to stabilize the process as well as subsequent process behavior and product quality. The torque on the screws was recorded every second by a built-in torque gauge in the equipment. Other process conditions, e.g., barrel wall temperature and the actual mass feed rate, were also monitored every second. These monitoring results were only used for ensuring that process behavior was not out of bounds. Barrel wall temperature was always between 23–31 °C, and the error of the mass feed rate was always less than 3%.
Both inline and offline granule size measurements were performed in the experiments. The Parsum® IPP 70-S probe (Parsum GmbH, Chemnitz, Germany) was used as an inline measurement with the Inline Particle Probe Software v8.01. The measurement theory of the Parsum is based on the modified spatial filtering velocimetry, where a particle size distribution is calculated from a chord length distribution [35,36]. In the experiments, volume-based granule size distribution was recorded every 2 s. The Parsum IPP 70-S measured powders right after wet granulation and had difficulty measuring large and much-agglomerated granules. The probe size was much smaller than the outlet size of the granulator.
In addition to the Parsum IPP 70-S, an offline measurement QICPIC particle size analyzer was used to measure the size distribution of the dry granules. QICPIC (Sympatec, Etten-Leur, The Netherlands) enables dynamic image analysis to evaluate the size distribution of dried granules. Granules were collected at different timepoints: the samples were taken every 10 s between 0–3 min, every 30 s between 3–6 min, and every 3 min between 6–60 min. At each sampling point, sampling duration was five seconds. The entire sample of granules was fed by a vibratory feeder towards a gravimetric feed tube, where the granules were dispersed in front of the measurement window. Volume-based size distributions were calculated by the WINDOX 5 software (Sympatec, GmbH, Clausthal-Zellerfeld, Germany).

2.4. Assessment Methods

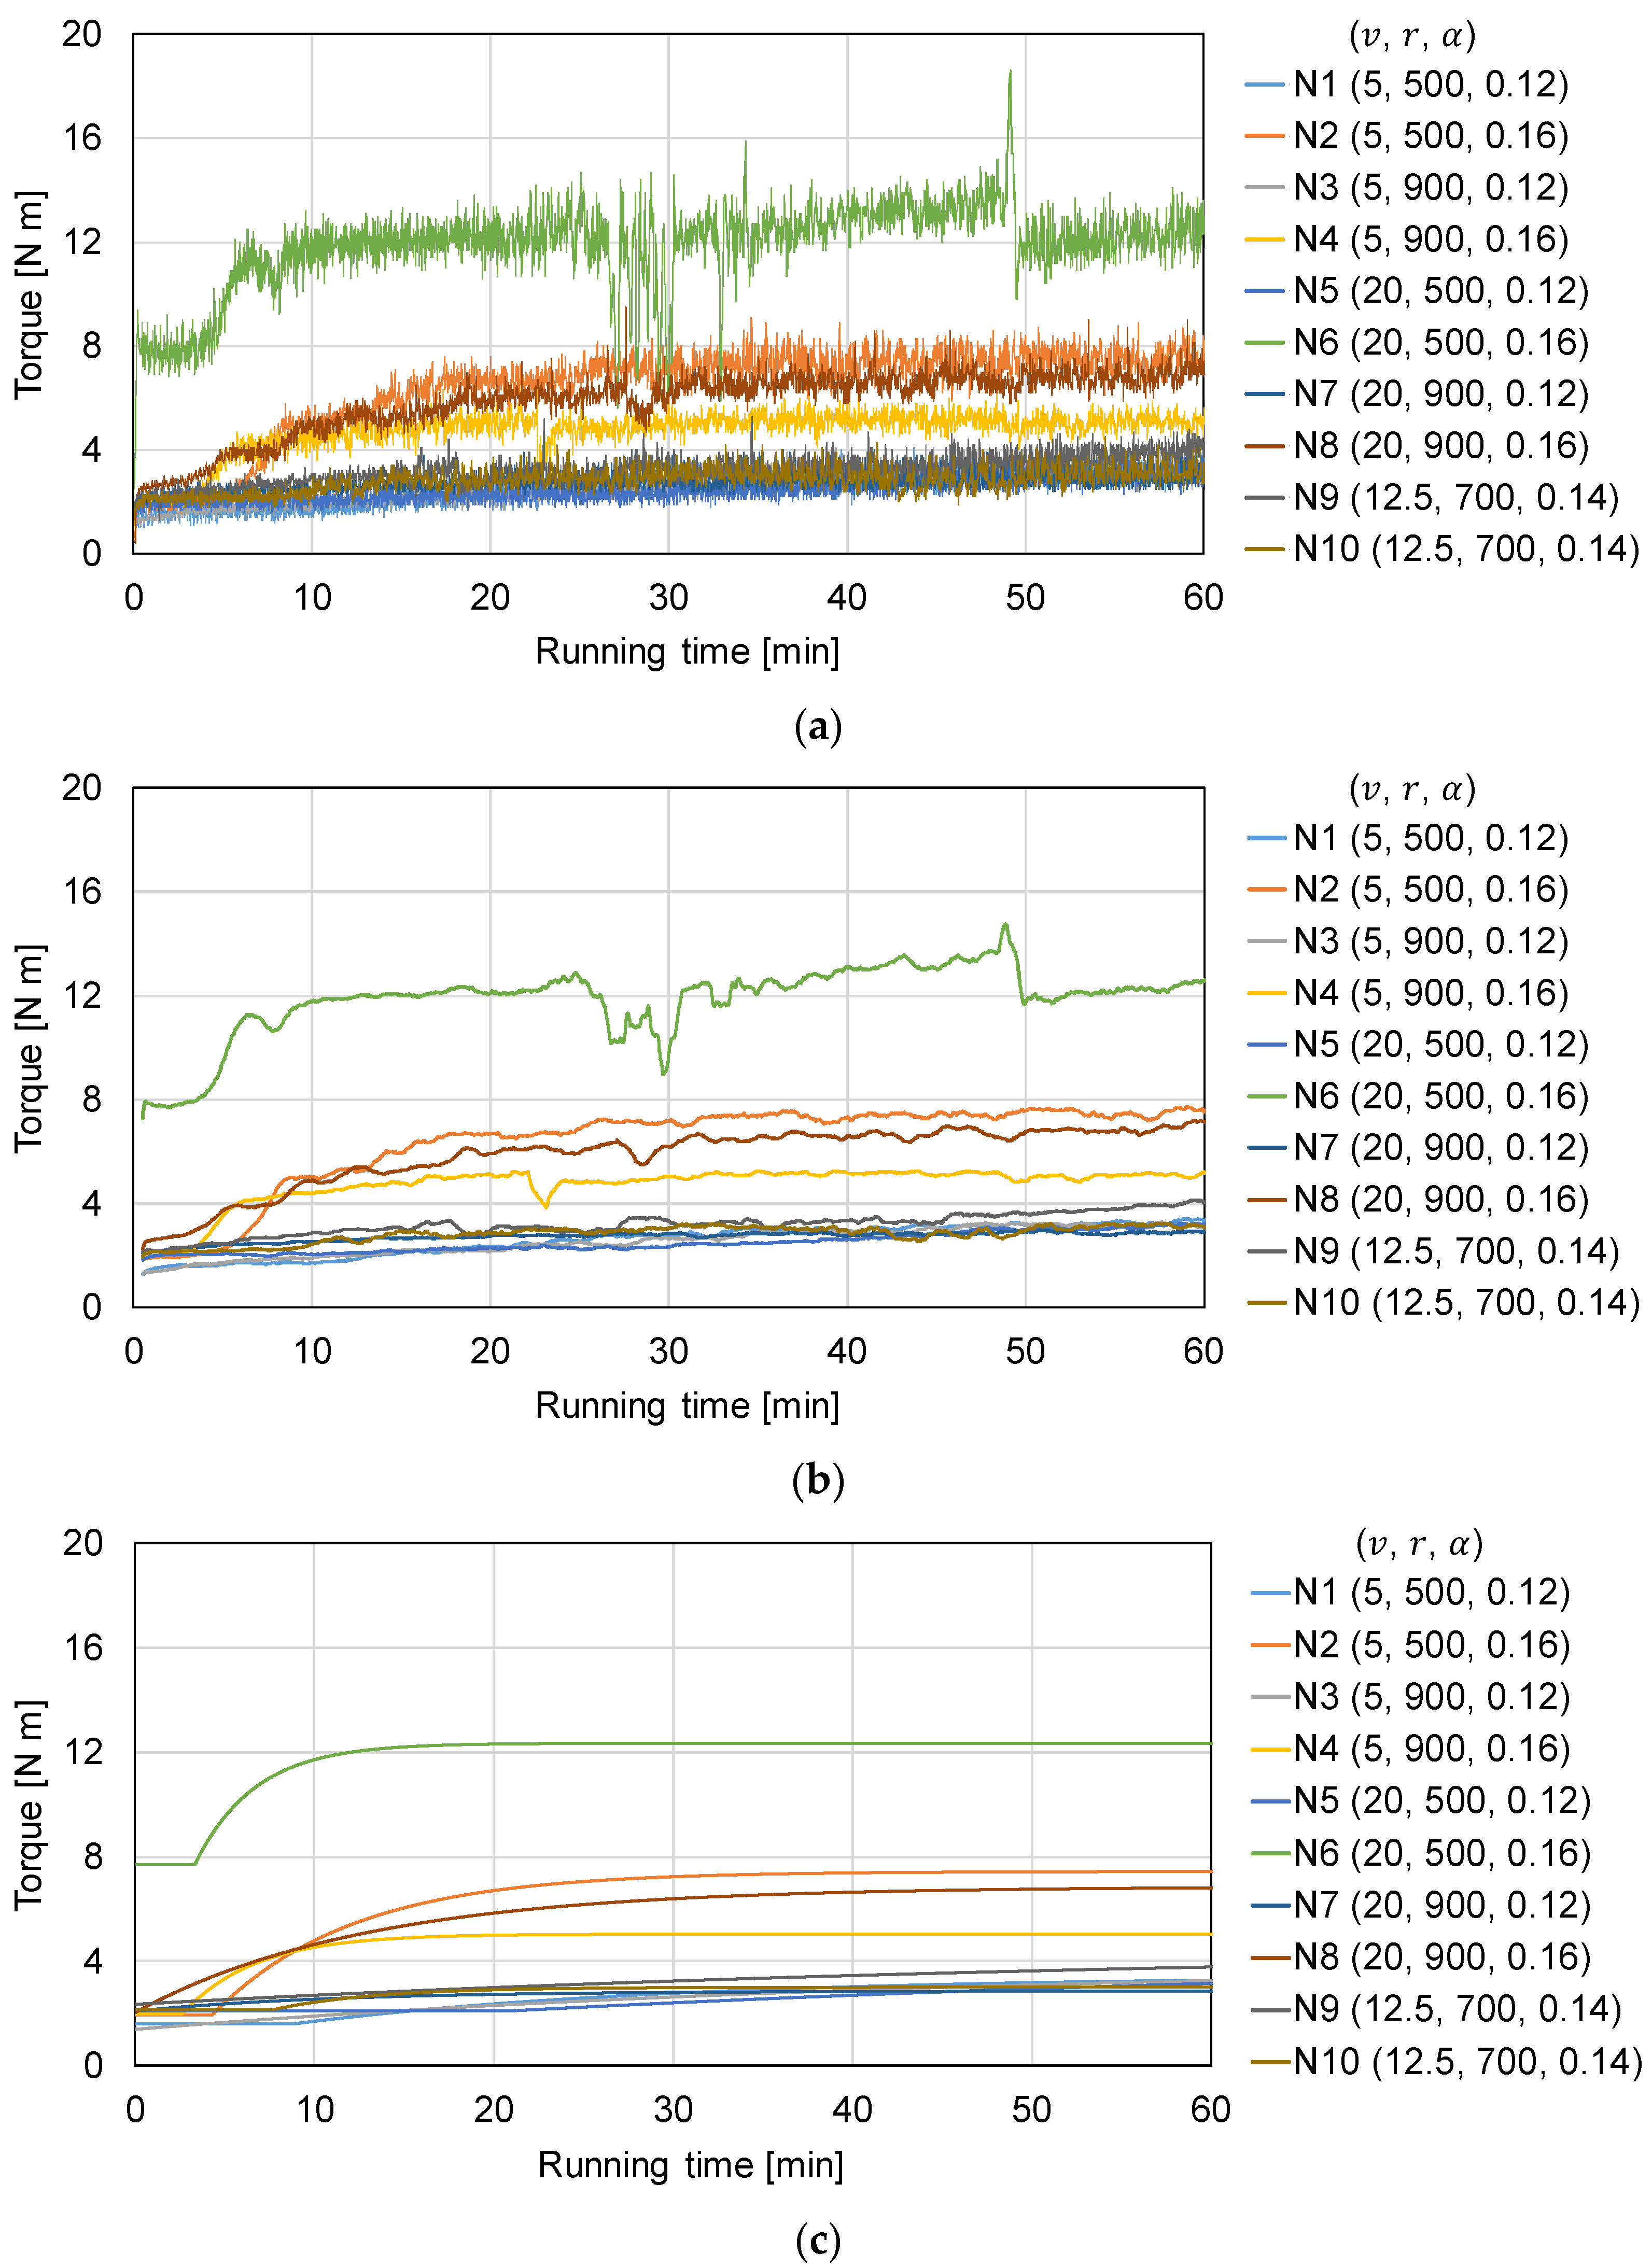
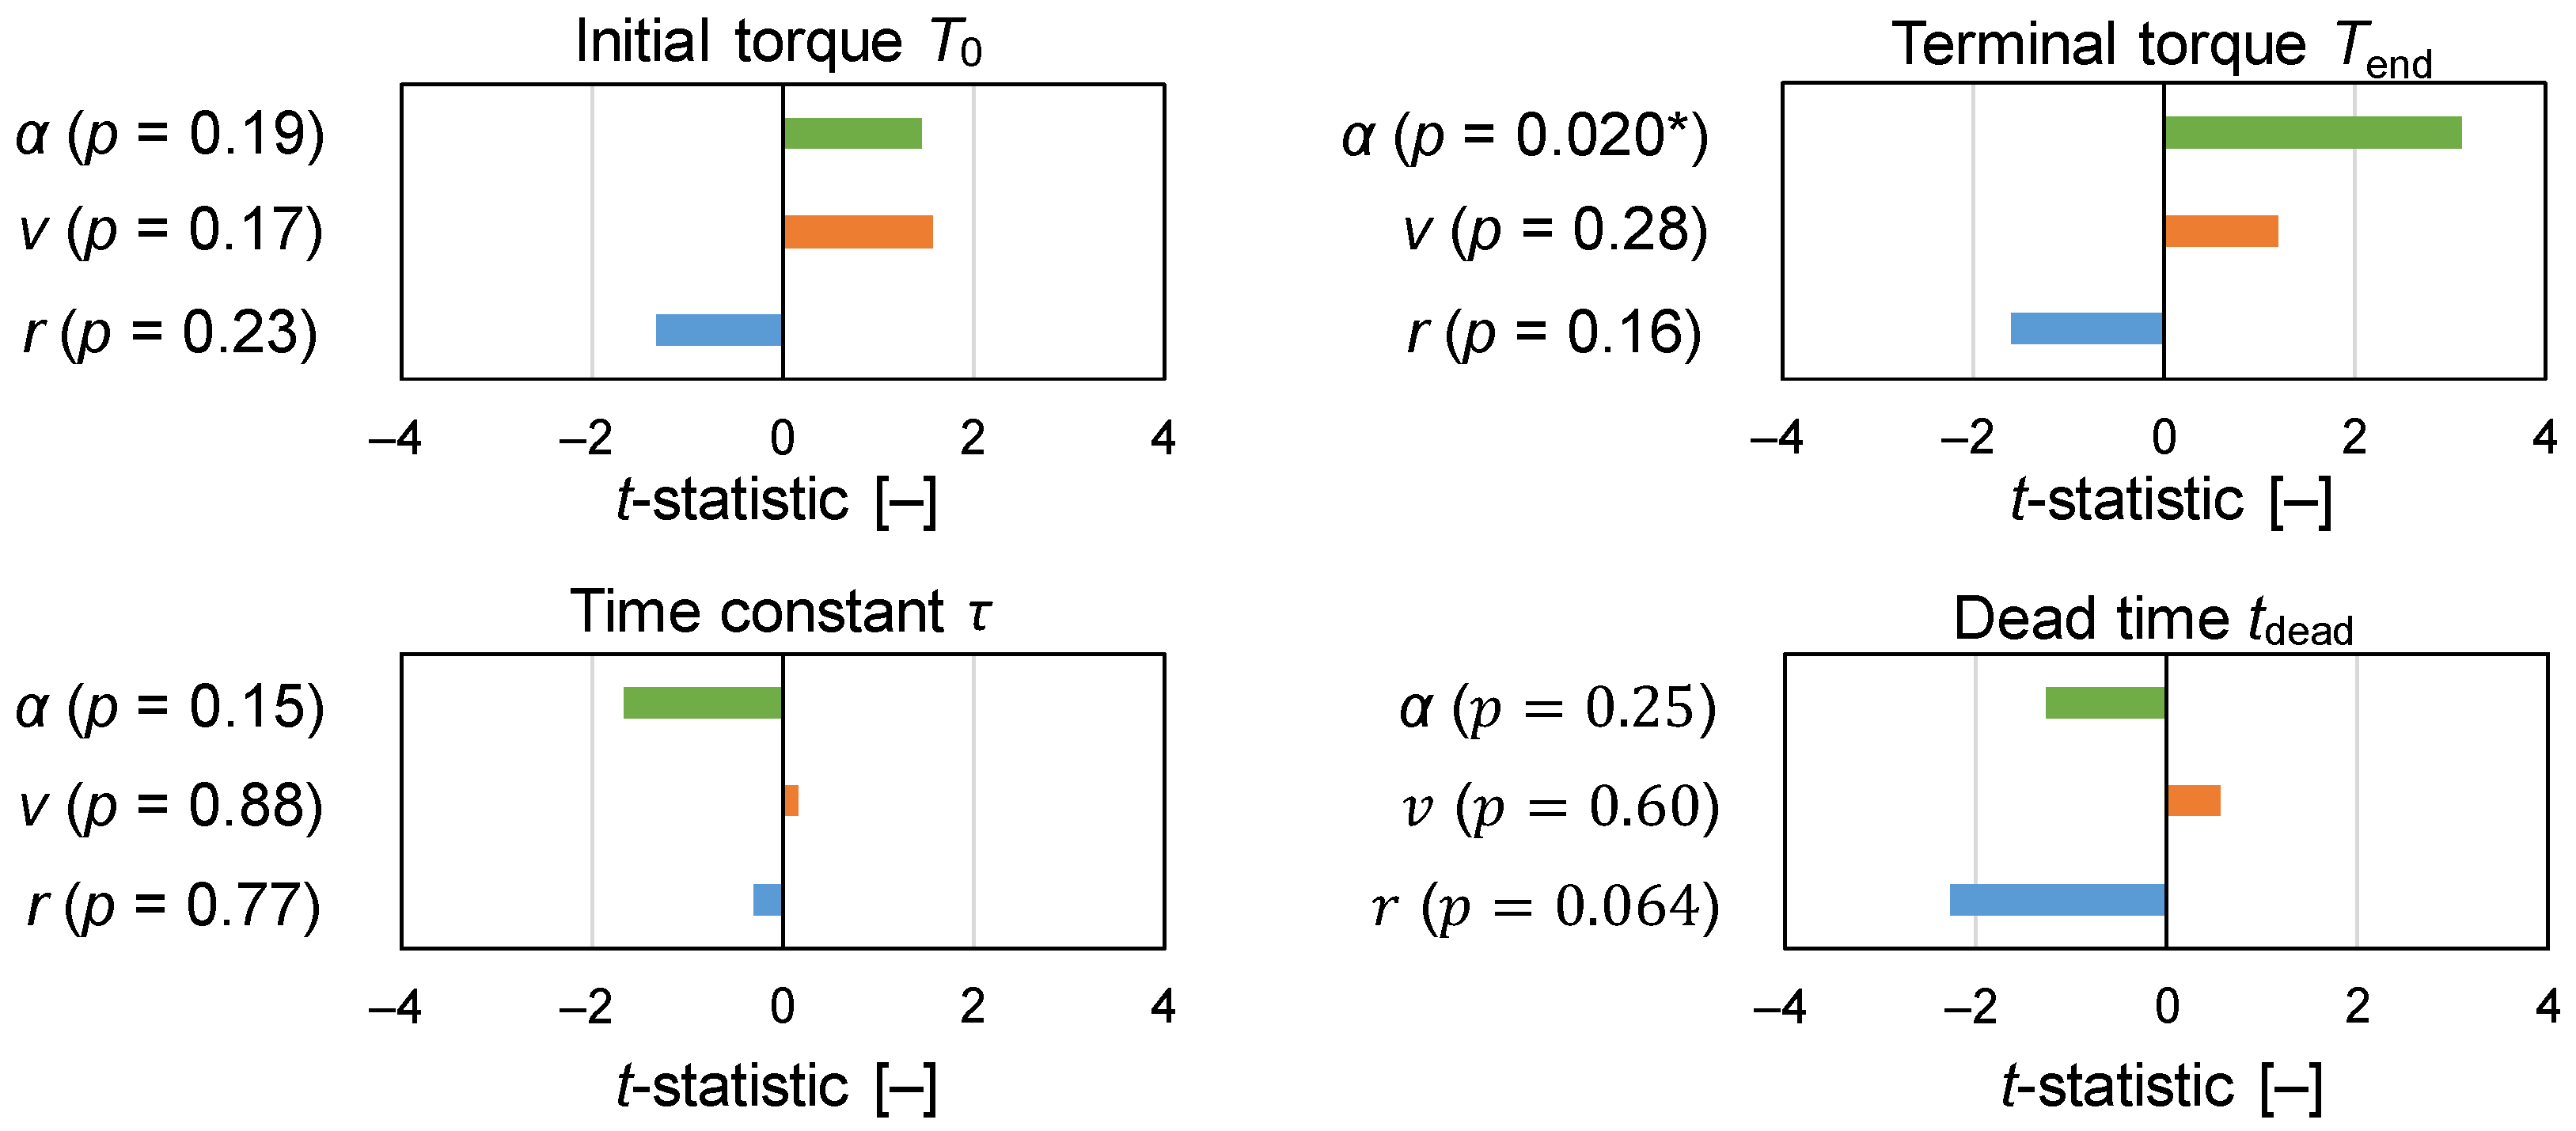
2.4.1. Torque Profile

The response of torque was assessed to determine the start-up time by fitting the torque profiles. The torque profiles T(t) [N m] were fitted by the first-order system, which is a standard and simple form to explain the response in the start-up phase between starting conditions and the achieved steady-state levels, as shown in Equation (1):
T ( t ) = { T 0 | t < t dead T end ( T end T 0 ) exp ( t t dead τ ) | t t dead ,
where T0 [N m], Tend [N m], τ [min], and tdead [min] represent the initial torque, the terminal torque, the time constant, and dead time, respectively. The physical meanings of T0 and Tend are the torque values at the beginning and the steady state, respectively. The dead time tdead is the lag time before a response in the monitored values can be observed, whereas the time constant τ represents the speed of the response in a variable after a step change in the input parameters. Torque profiles were smoothed by the moving average method of 60 data points (1 min of measurement) to eliminate the noise before the fitting. The least-squares method was applied to estimate the values of the parameters from the experimental results; the validity was confirmed using root mean square error (RMSE). According to Equation (1), Tend will be theoretically achieved as time approaches infinity. For practical applications, start-up will be considered complete as TT0 equals 80% of TendT0.
To assess the effects of process parameters on the torque profiles, the significance of regression coefficients was tested using the t-statistic tstat [–], as shown in Equation (2):
t stat = c est S E ,
where cest and SE correspond to an estimated coefficient for each parameter and the standard error of the coefficient cest, respectively. The null hypothesis was that “a coefficient of a parameter is equal to zero”.

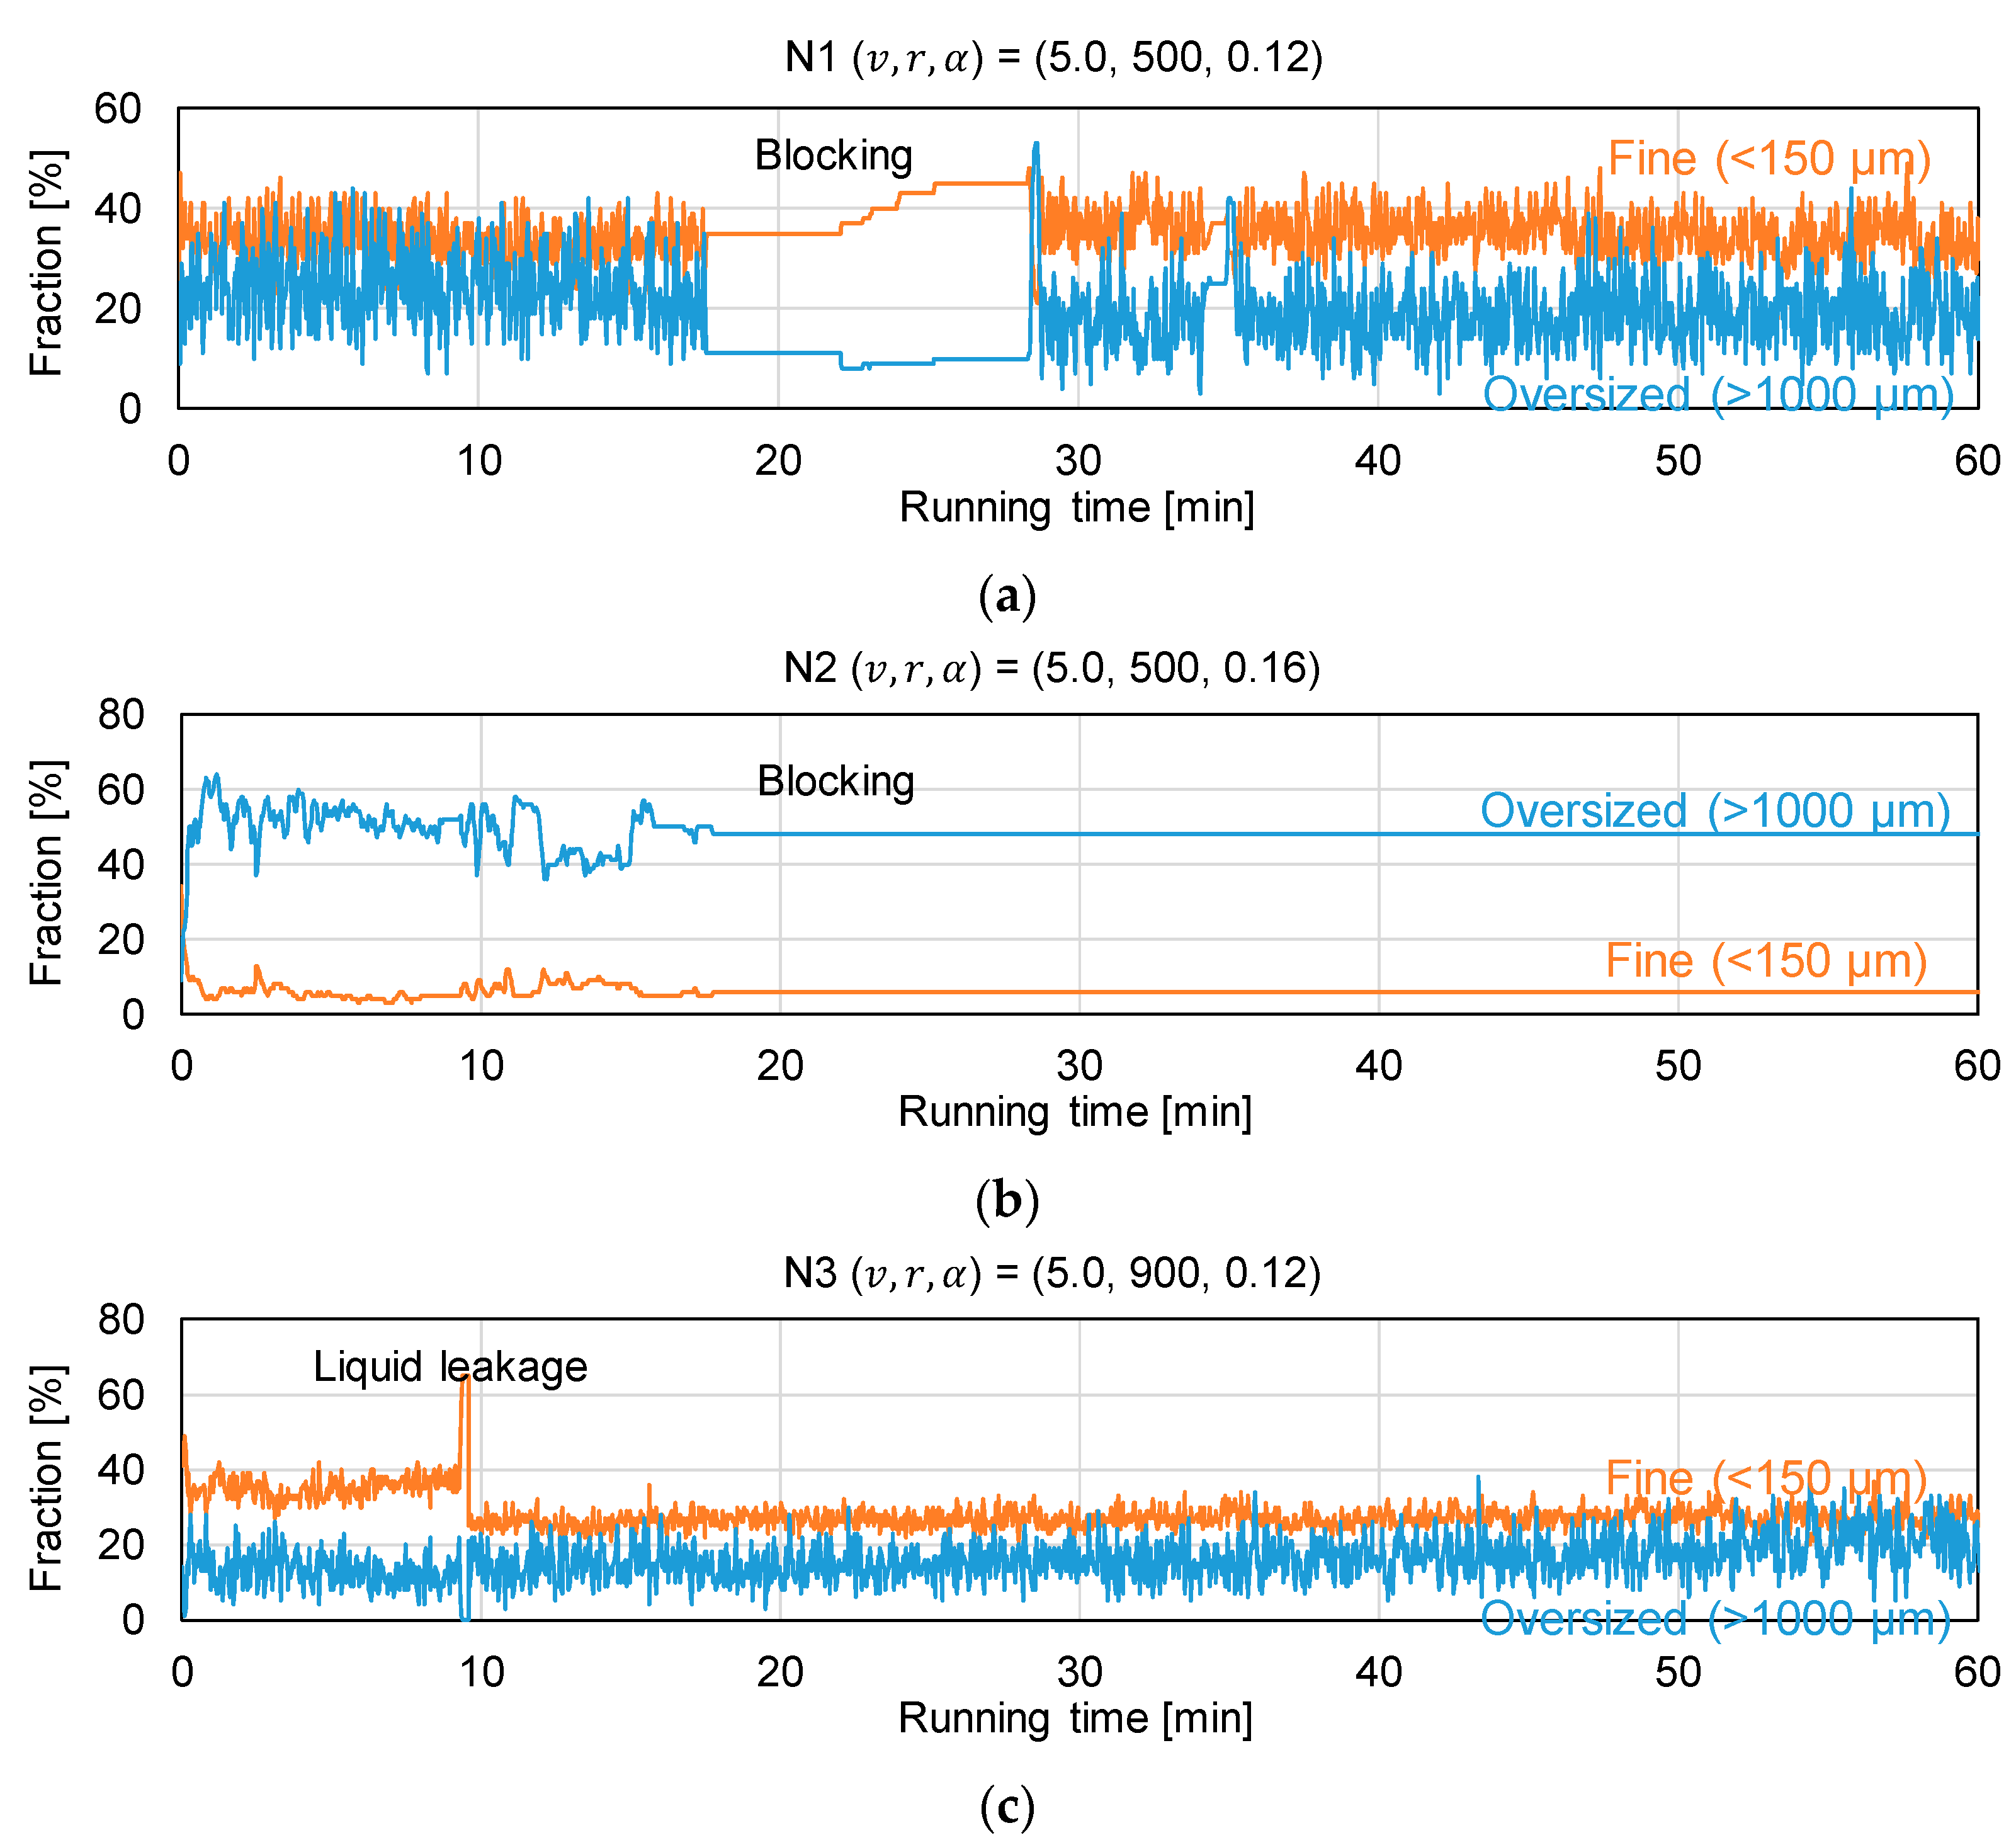
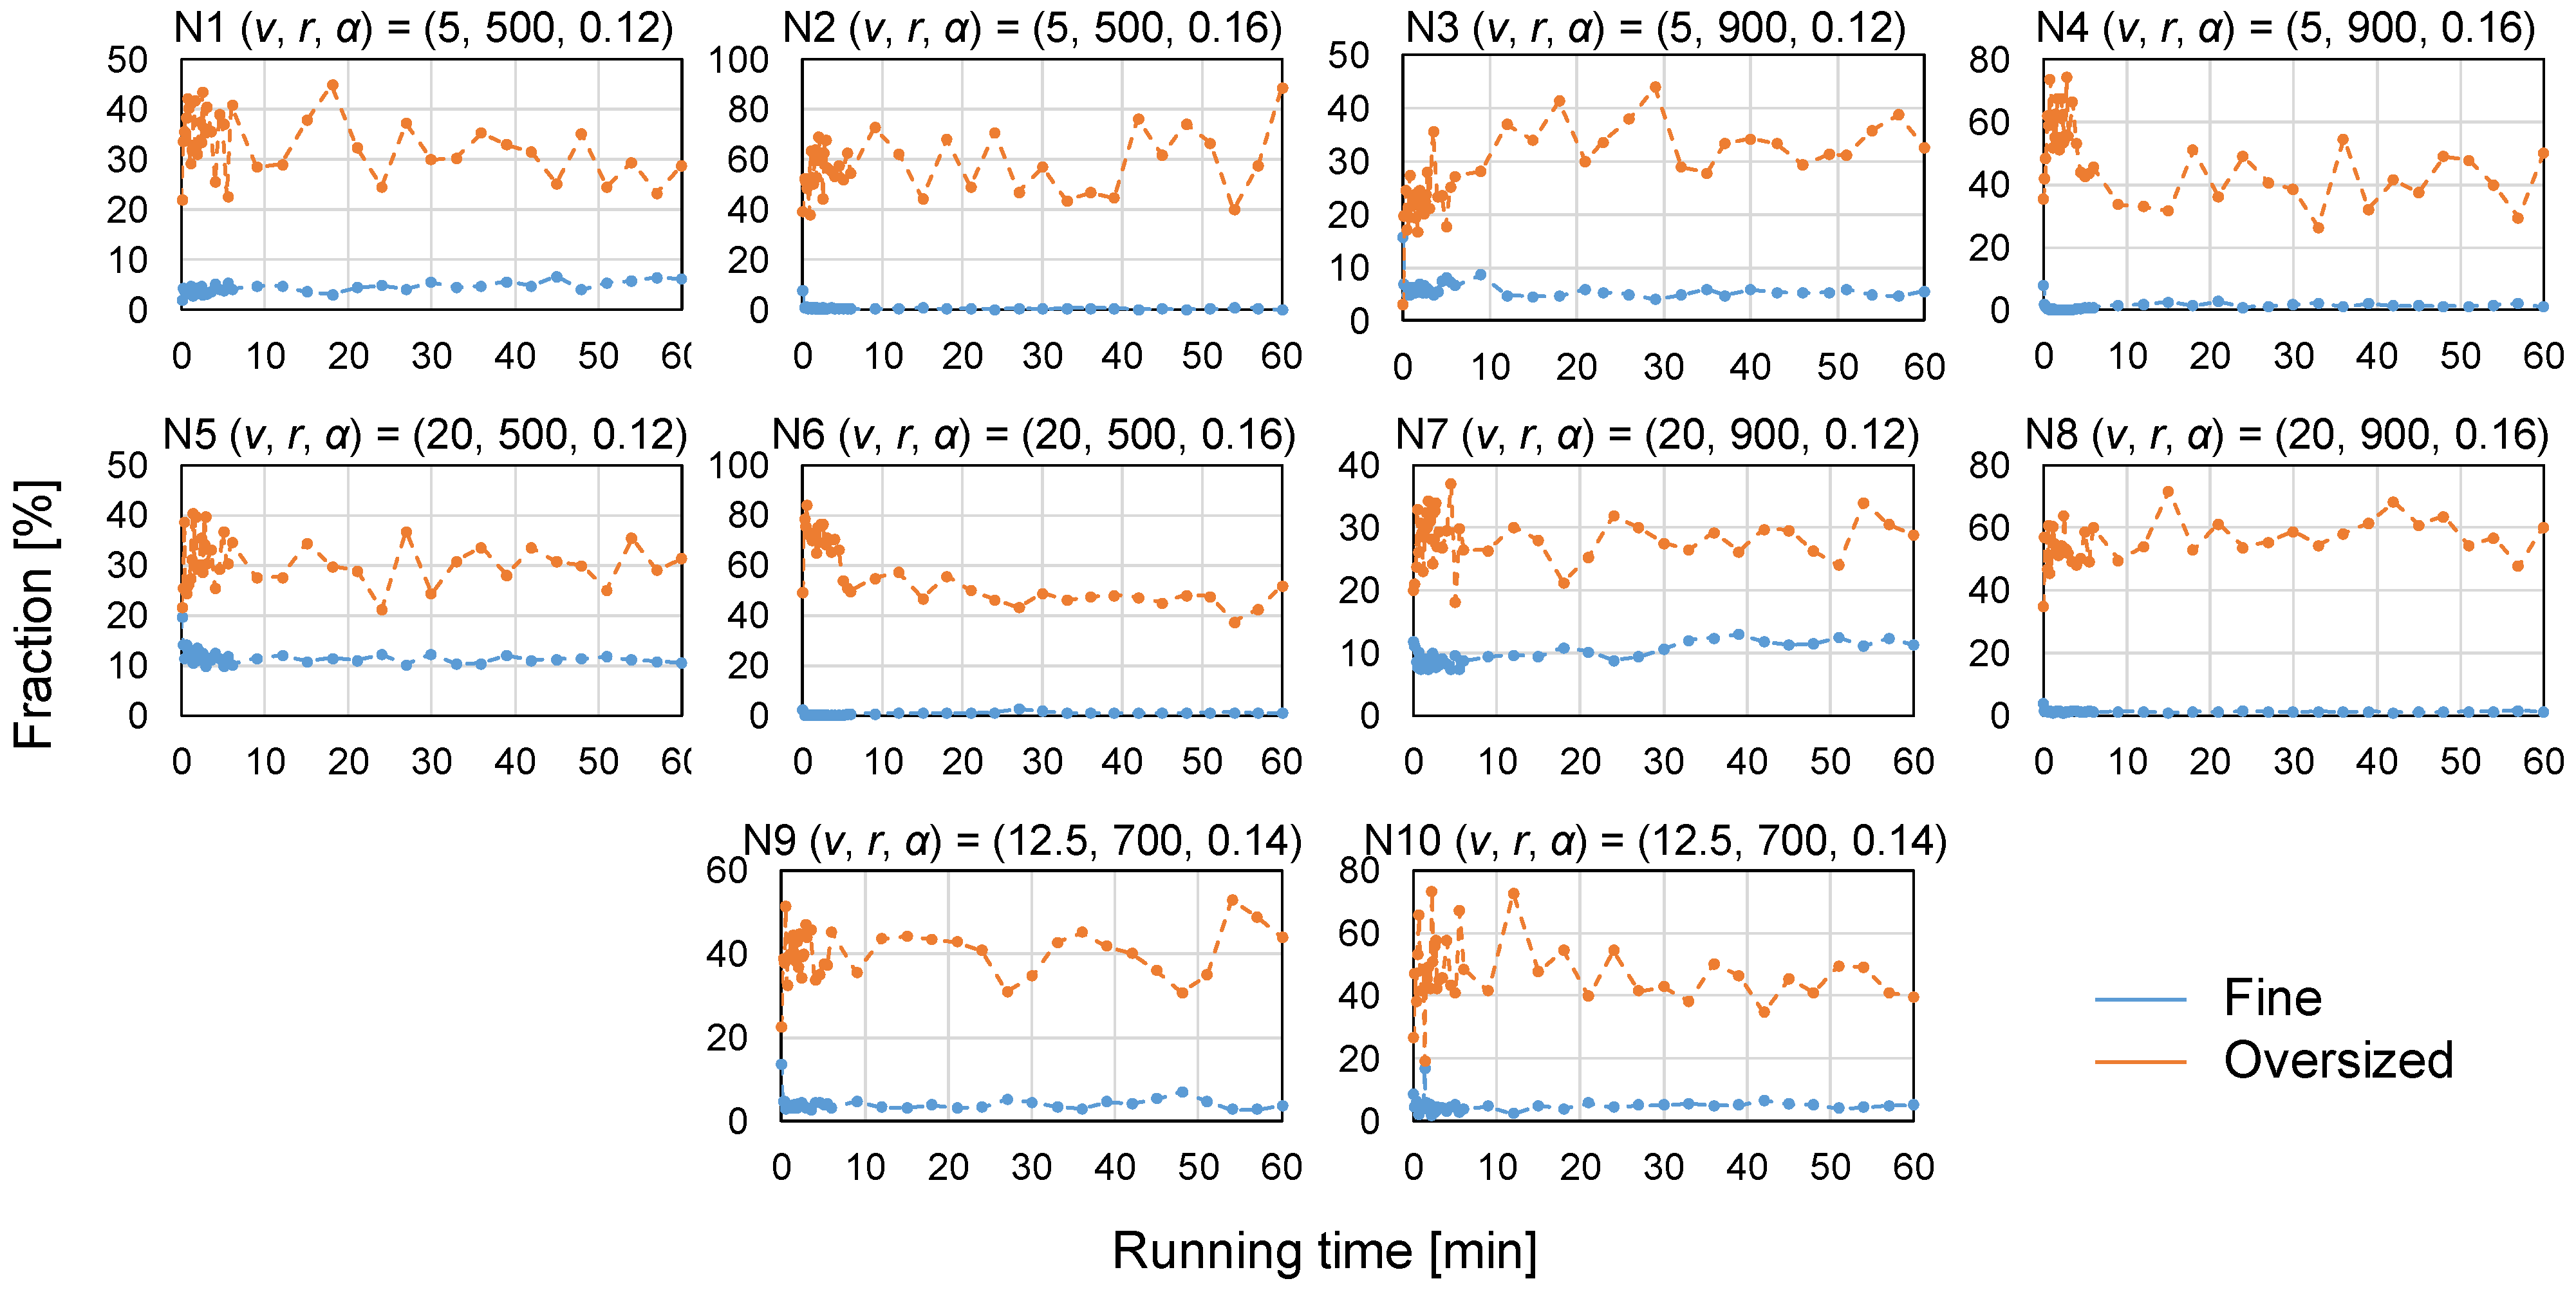
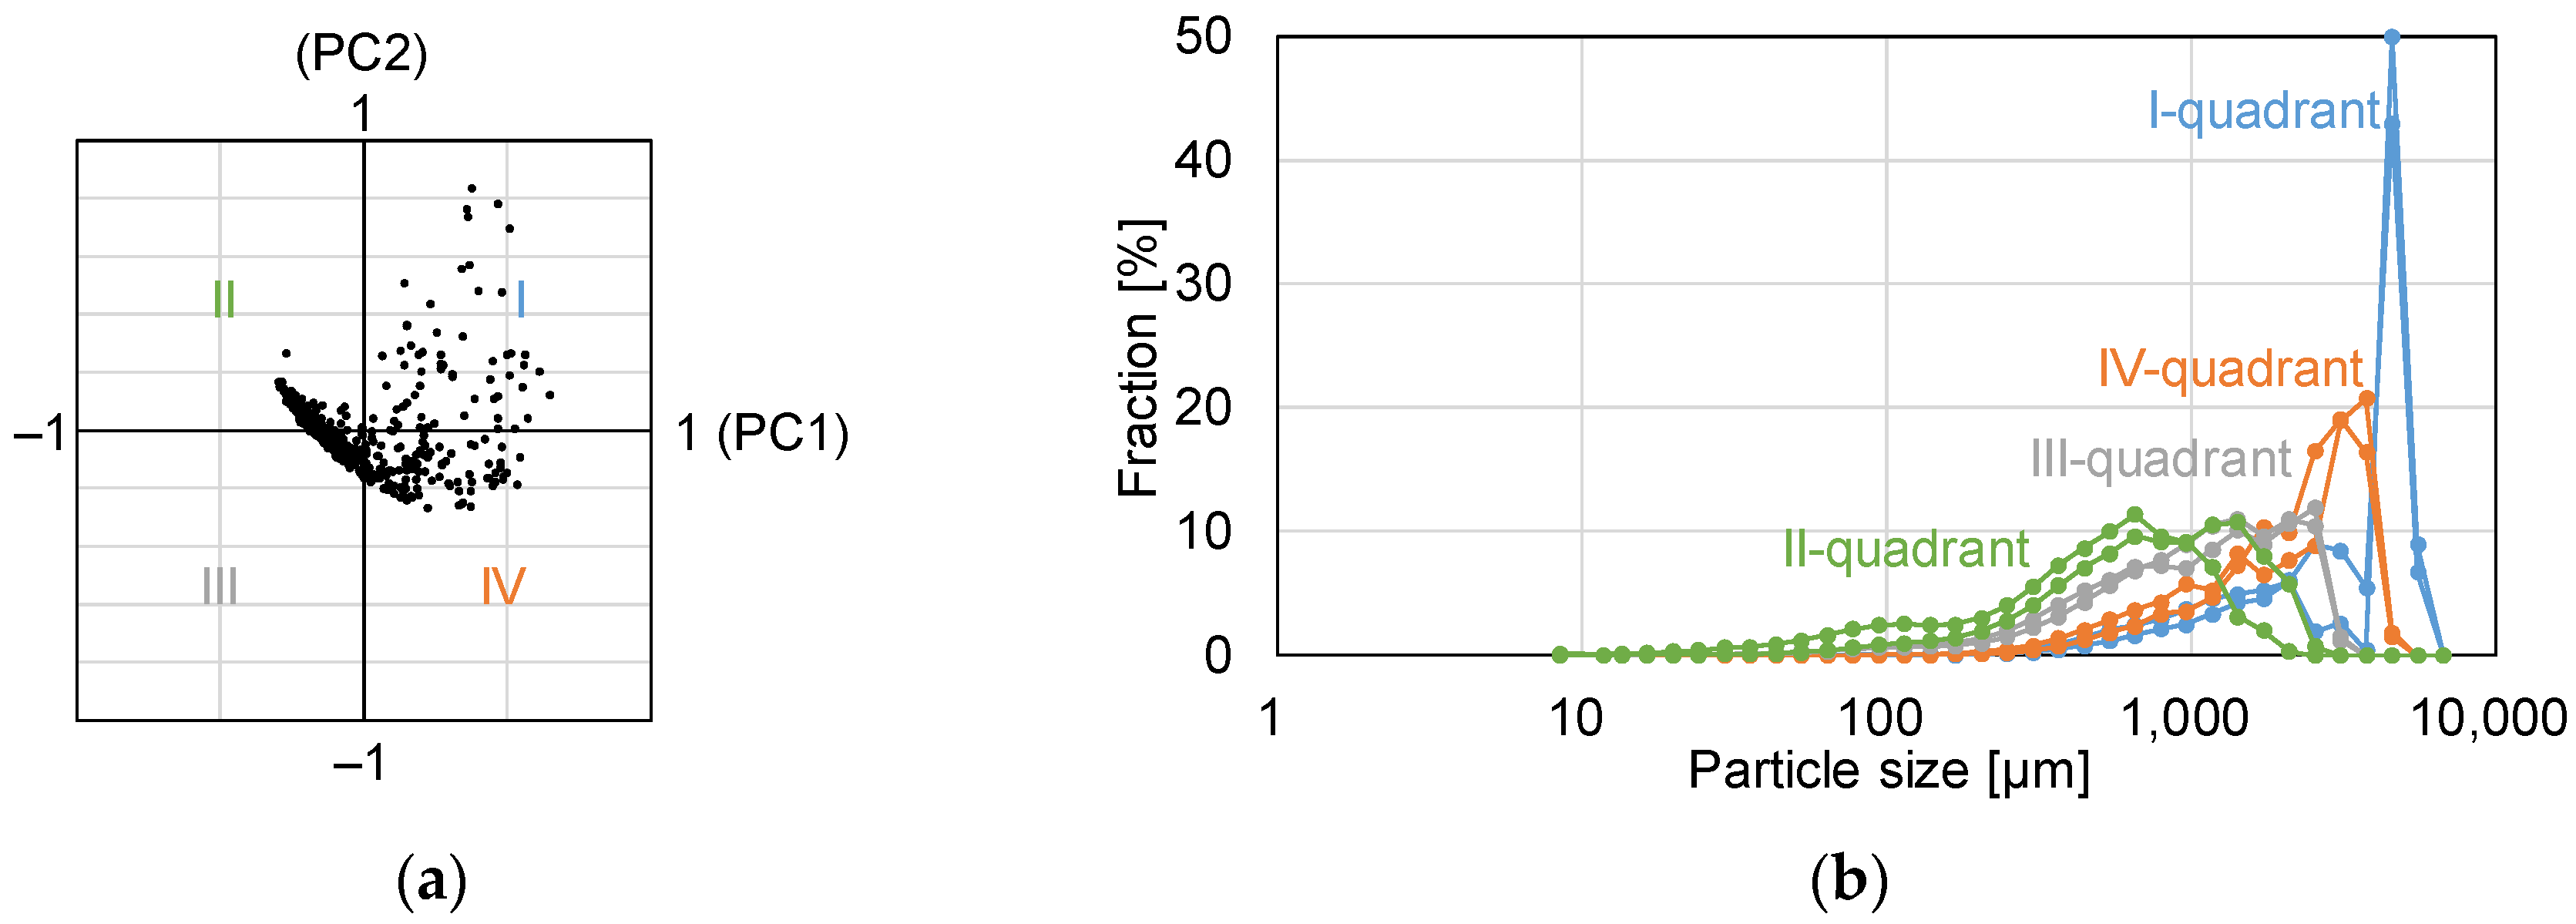
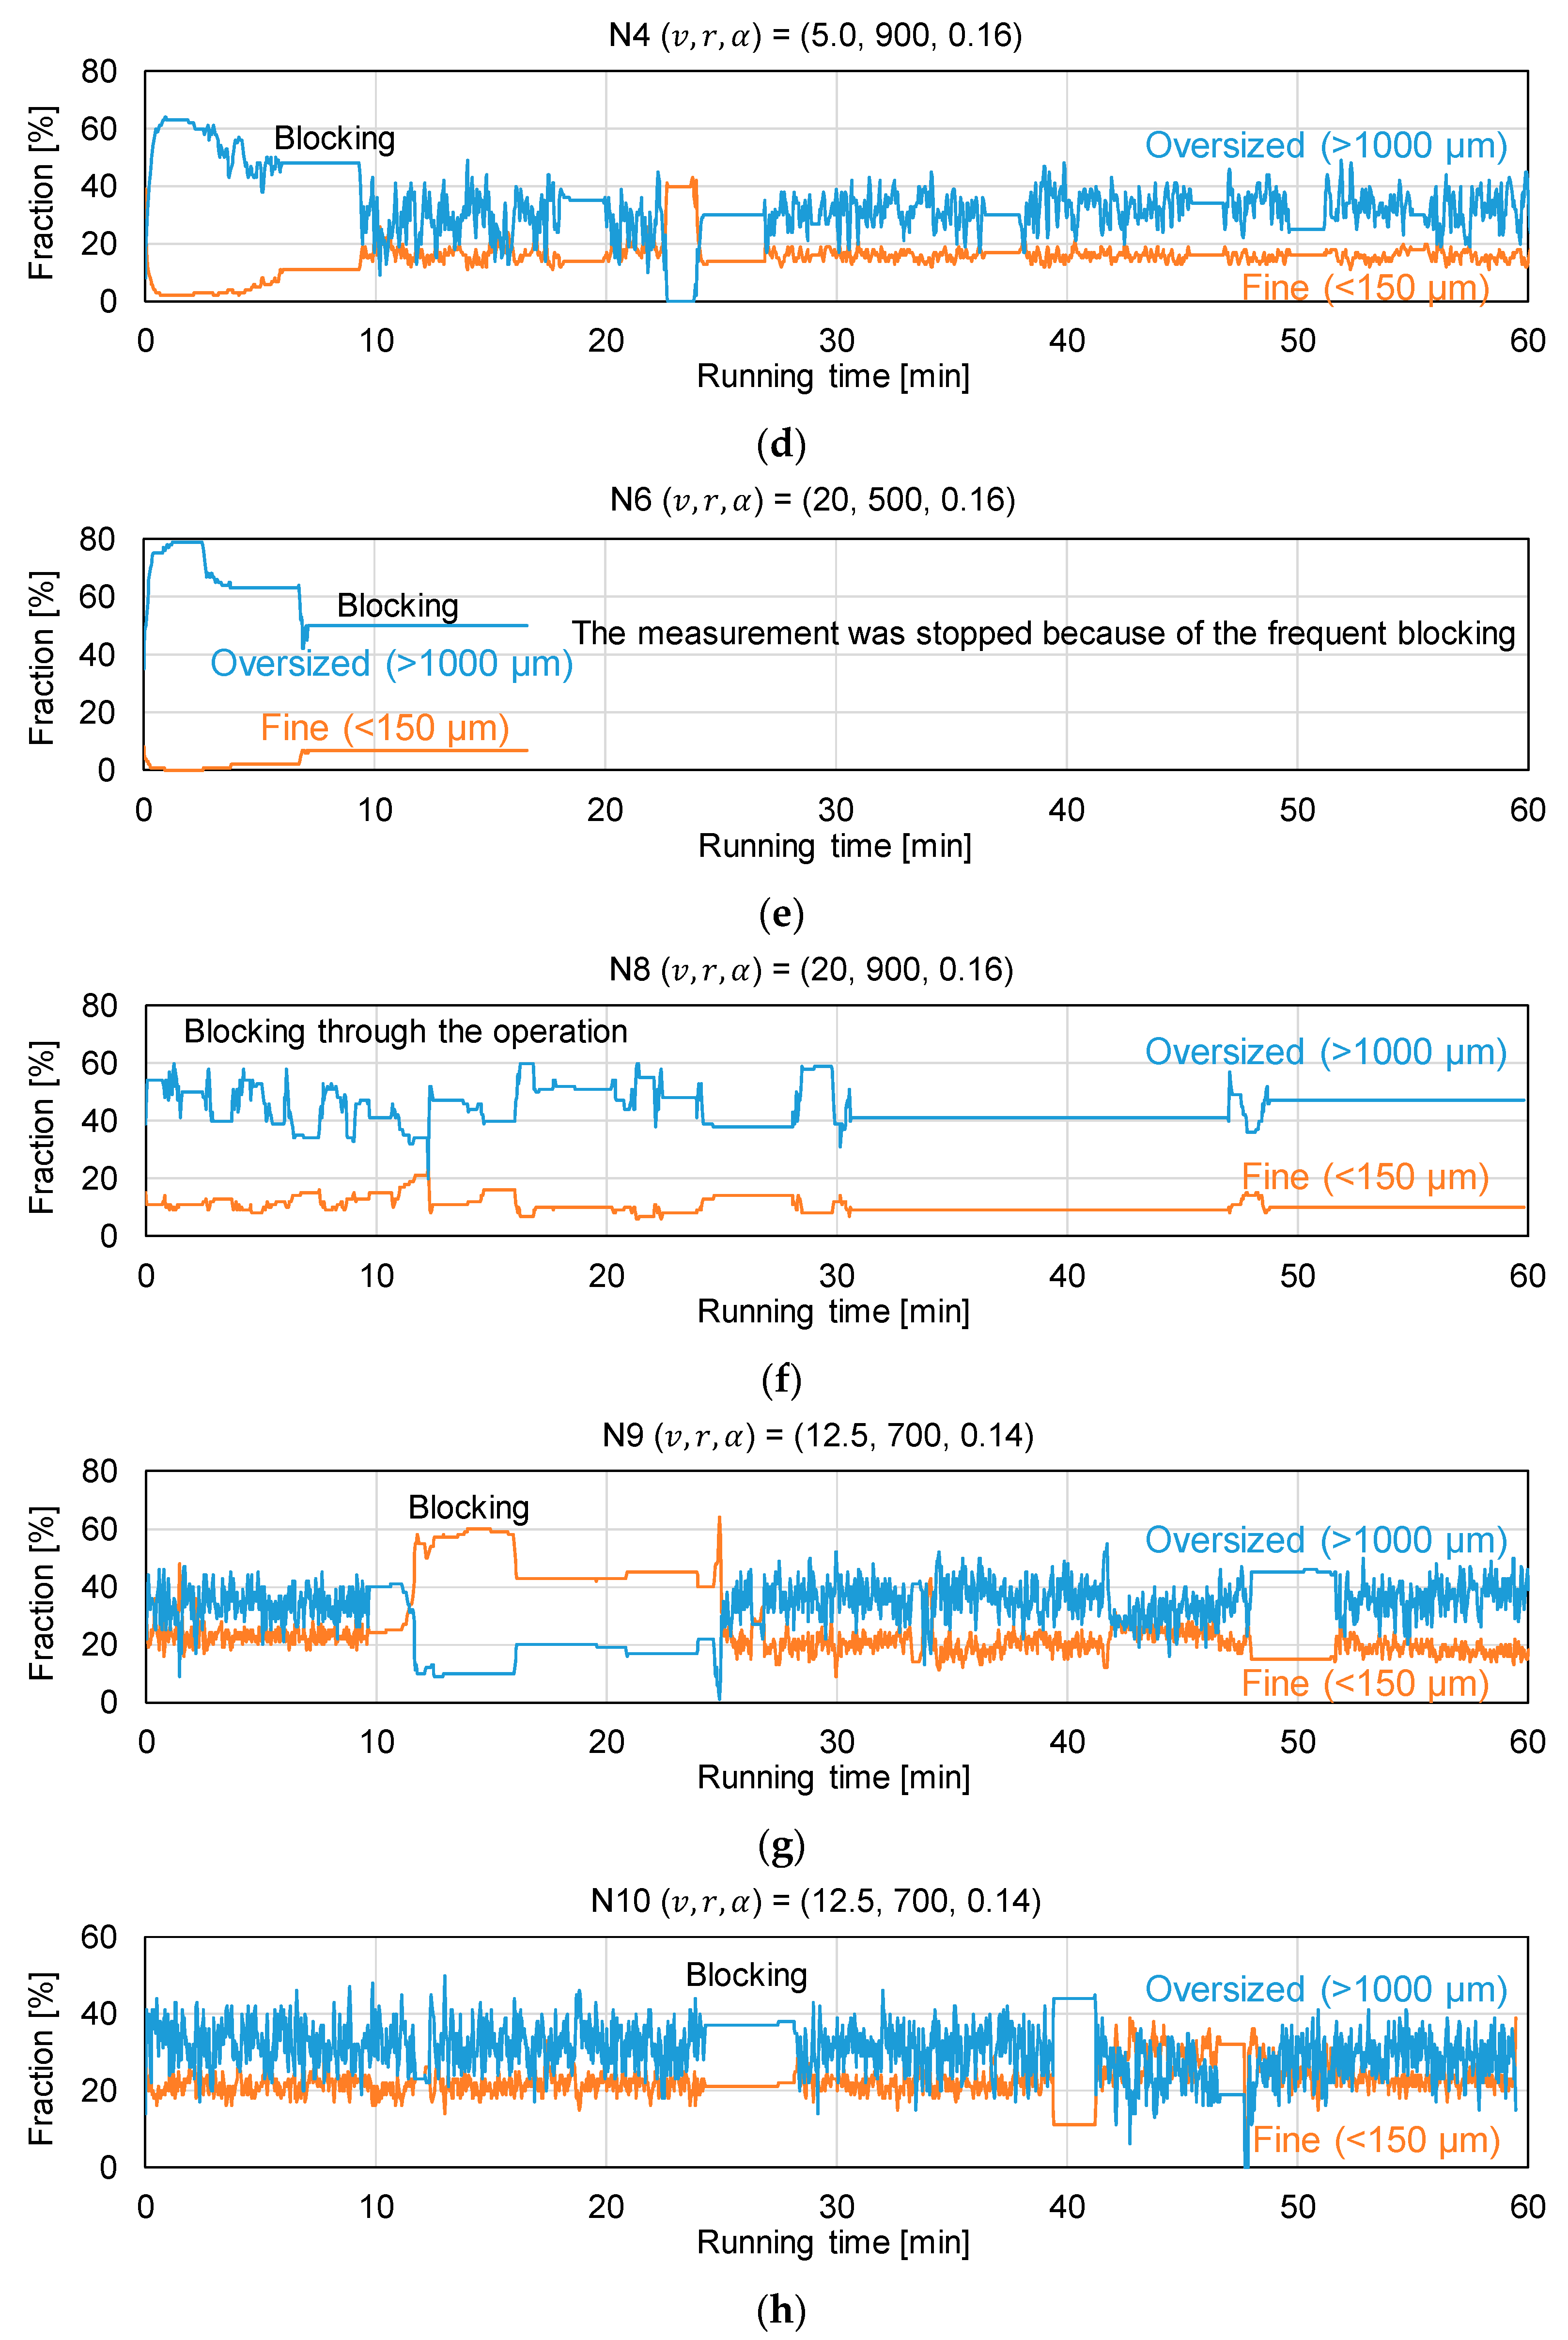
2.4.2. Granule Size Distribution

Granule size distribution obtained from both Parsum and QICPIC contains high-dimensional information, which needs to be reduced for understanding the trends. Potential dimensional reduction methods are as follows:
  • Visual comparison.
  • Tenth-percentile, median, and ninth-percentile diameter.
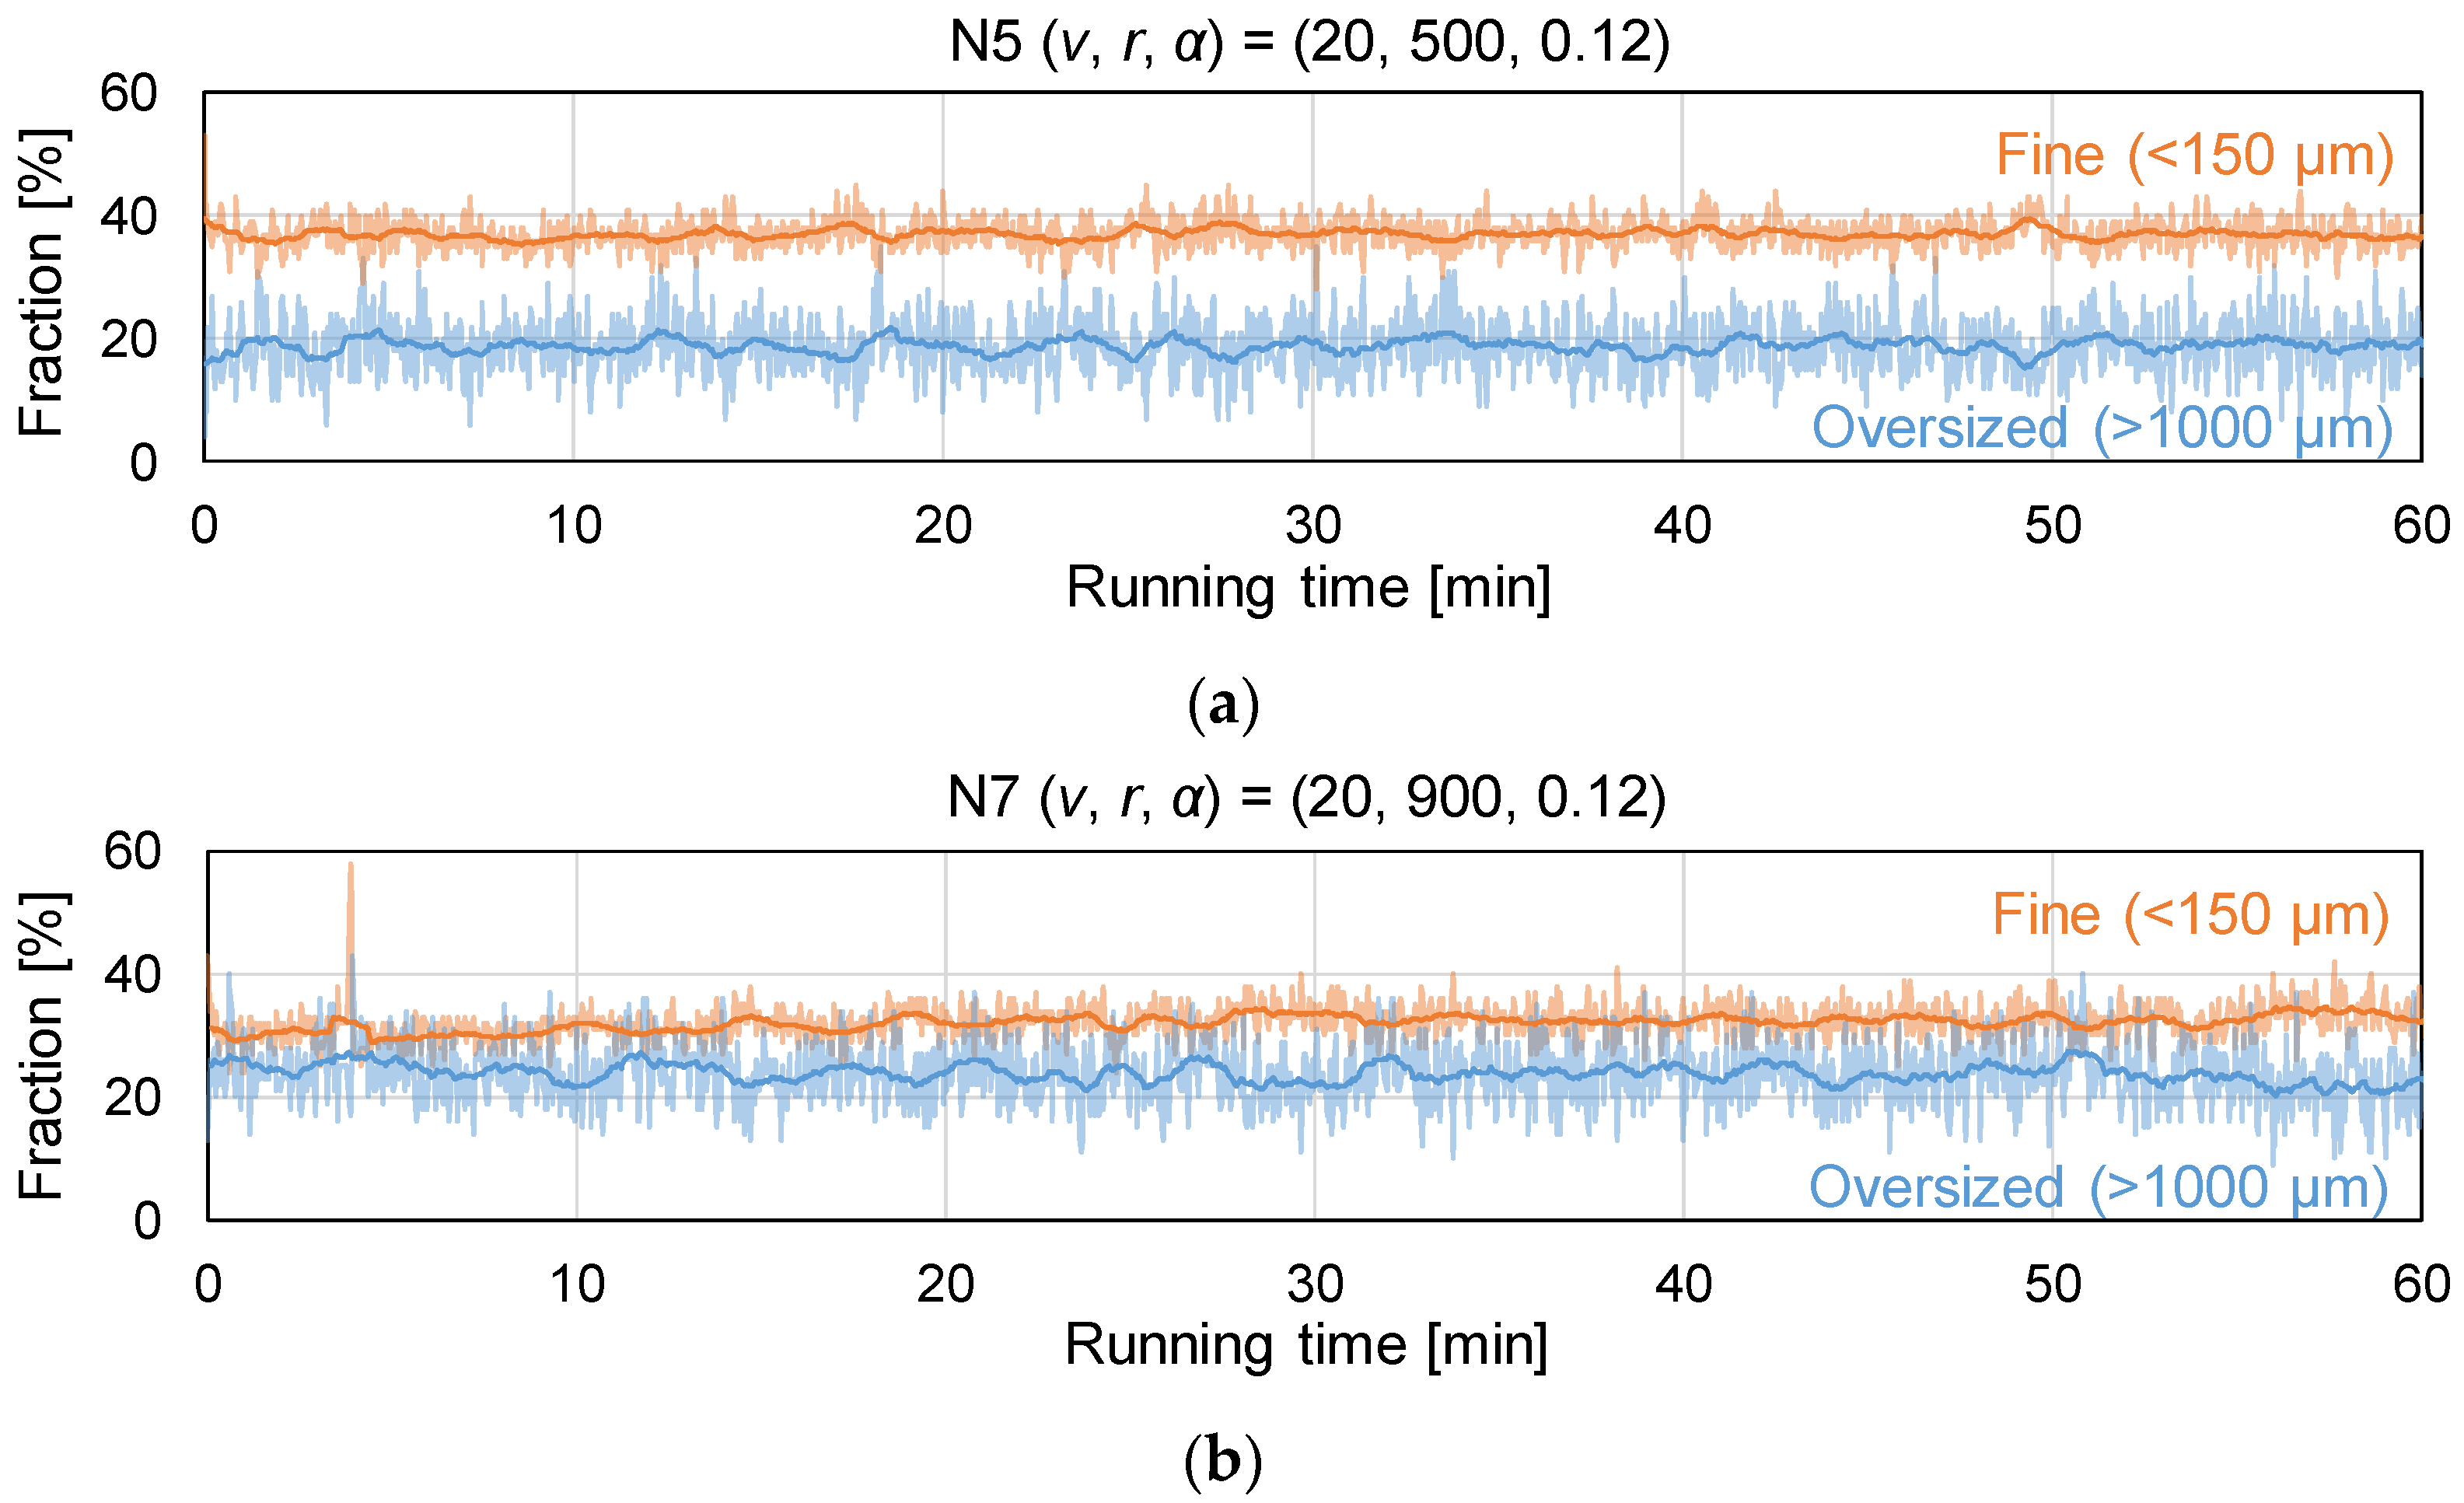
  • Fractions of fines and oversized granules, or granulation yield.
  • Fitting by probability distributions, e.g., Gaussian distribution.
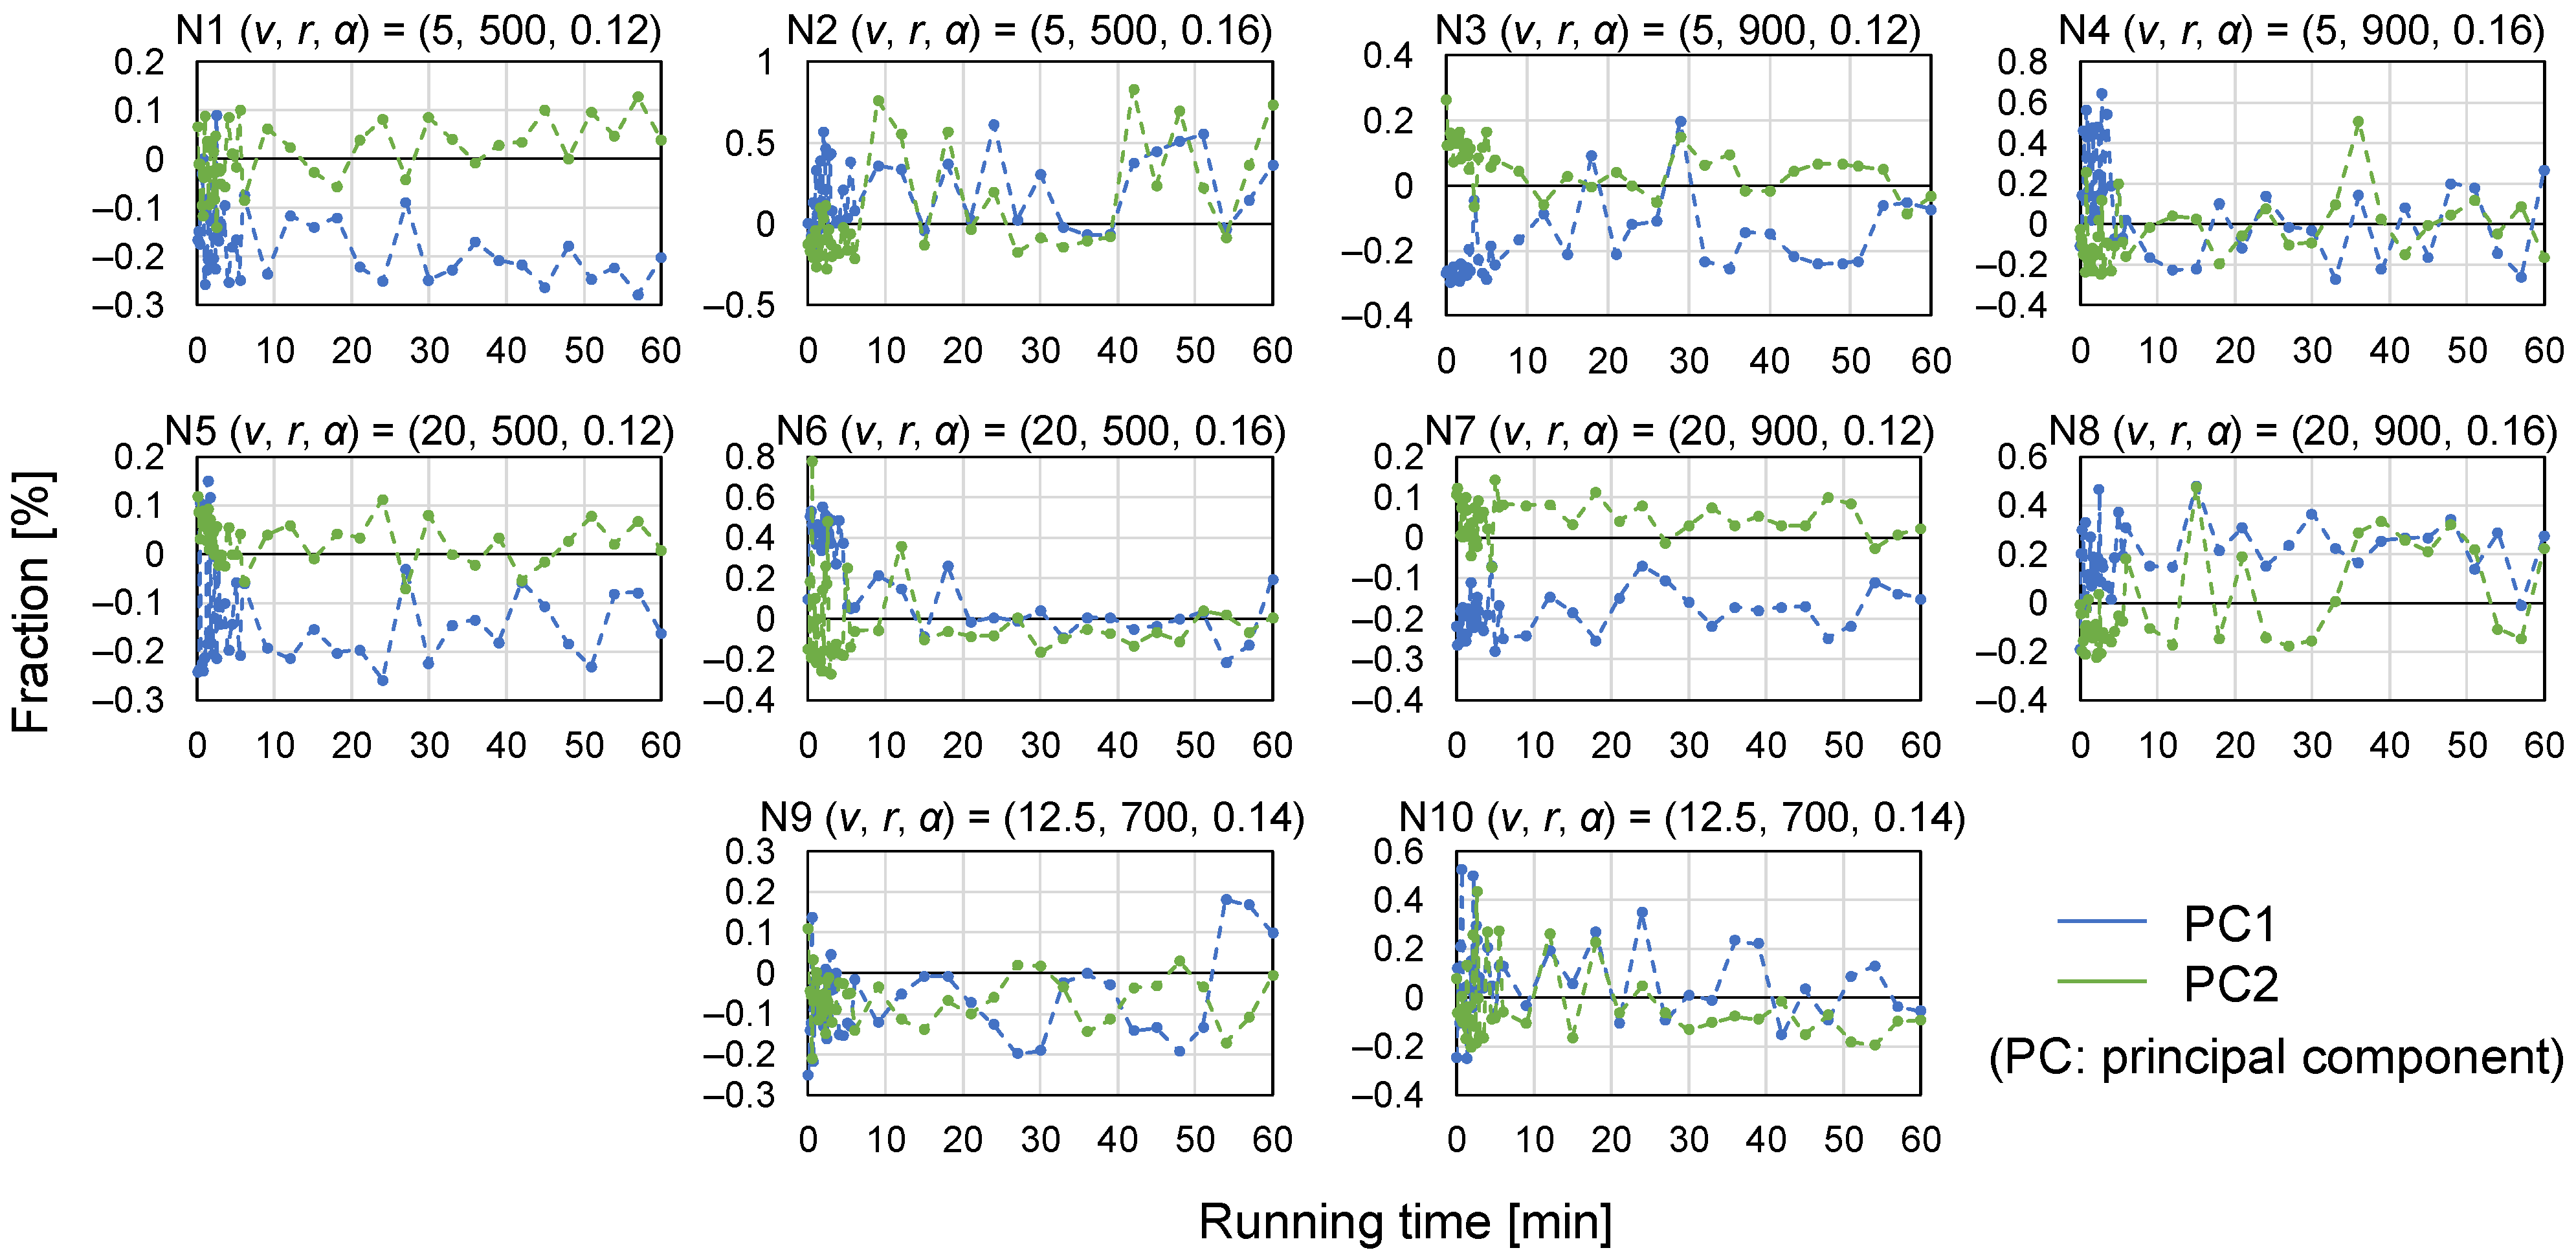
  • Multivariate analysis.
The visual comparison is qualitative and only works if a small number of granule size distributions are compared. While percentile diameter is frequently used in the pharmaceutical industry, it is not easy to interpret if the distribution does not follow any well-known distribution type. The same theory applies to fitting by distribution. In this study, both fraction and multivariate analysis were used as indicators. The fractions of granules smaller than 150 and larger than 1000 μm were respectively defined as fine fraction and oversized fraction for Parsum data; the fractions of granules smaller than 150 and larger than 1500 μm were defined as fines fractions and oversized fraction for QICPIC data, respectively.
Regarding multivariate analysis, employing kernel mean embedding was found to be useful for the prediction of granule size distributions [37]. Moreover, kernel principal component analysis (PCA) was recognized as a good tool to characterize distributions [38]. In kernel PCA, the original data space is first transferred into higher dimensional space using kernel trick and transferred into lower dimensional space using PCA. A kernel trick used in this study was radial basis functions (RBFs) φ, using hyperparameters σ and γ, as shown in Equation (3):
ϕ ( x i , x j ) = exp ( x i x j 2 2 σ 2 ) = exp ( γ x i x j 2 ) ,
While several methods exist to define γ, e.g., the median heuristics [39], the γ was set as 0.0005, considering the absolute values of x and responses.
Kernel PCA enables the description of nonlinear relationships, unlike the conventional PCA, though the interpretation of PCs becomes difficult. The definition of the start-up operation was performed by incorporating the proposed two types of indicators. The scikit-learn library 0.23.2 [40] in Python 3.7 was used for kernel PCA. All granule size distribution data of ten runs generated by QICPIC were used as the input parameters of kernel PCA at the same time.

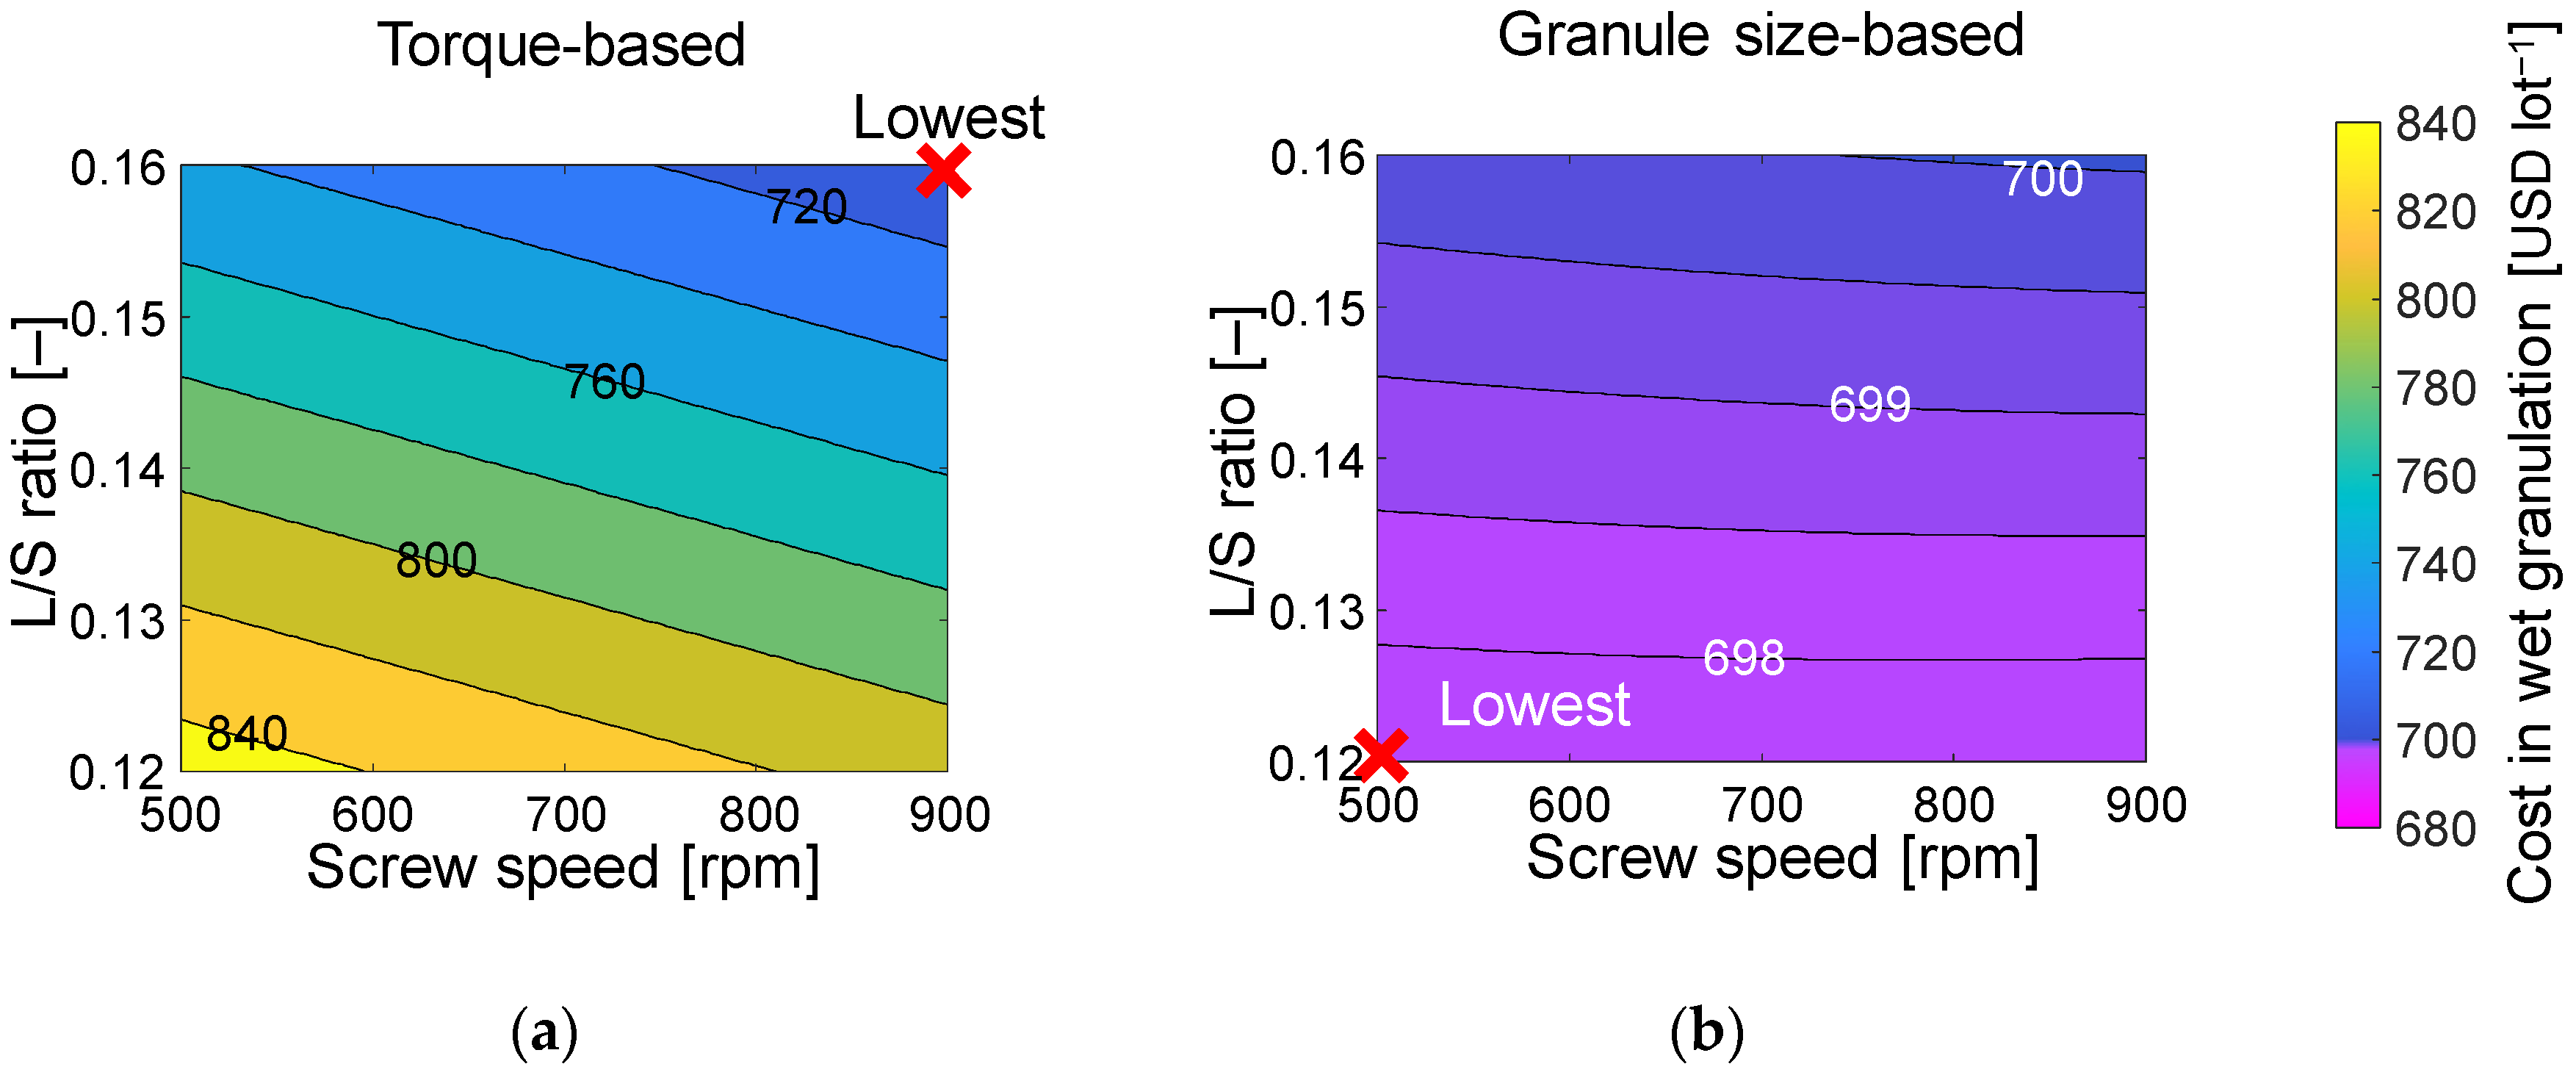
2.4.3. Cost Analysis

Economic impacts of start-up time were analyzed in terms of cost of wet granulation. Cost in wet granulation CWG [USD lot−1] was defined as Equation (4):
C WG = C material + C energy ,
where Cmaterial [USD lot−1] and Cenergy [USD lot−1] represent raw material cost and energy cost, respectively. Quantity of material used is the sum of lot size mlot [kg lot−1] and disposal in start-up operation; Cmaterial can be defined as Equation (5):
C material = C RM ( m lot + v t start ) ,
where CRM [USD kg−1] and tstart [h lot−1] represent the unit price of raw materials and the time needed for a start-up operation. Energy consumption in wet granulation is derived from torque, and Cenergy was formulated, as shown in Equation (6):
C energy = 2 π 6 × 10 4 C elec r 0 m lot v + t start T ( t ) d t ,
where Celec [USD kWh−1] represents the electricity price. After the experiments, cost analysis was performed by determining tstart and T(t) as functions of v, r, and α.
The definition of the start-up time has critical economic impacts, due to the disposal of materials produced in this time frame. The start-up time is normally the time needed for the process to stabilize. However, different process and product parameters can show varying stabilization speeds, which yield potentially different values for the start-up time tstart. Thus, the economic impact of relying on different indicators to define the start-up time was investigated. This is critical for both process design and regulatory purposes.

3. Results and Discussion

3.1. Assessment of Torque Profile

The torque profile results are shown in Figure 1a, where the start-up effects were observed during/for all experimental runs. Torque values fluctuated throughout the entire operation and had large deviations, especially for high torque, e.g., N6 (v, r, α) = (20.0, 500, 0.16). The main causes of large deviations were manual powder refilling into a feeder and liquid leakage from the tubes. Powder refilling was necessary for the production at a high manufacturing rate, because of the limitation of the hopper’s capacity, and caused a short disturbance in the process (e.g., 34 min and 49 min in N6). Liquid leakage from the tubes sometimes happened (e.g., N4) due to the clogging of tubes and was stopped immediately after visual detection. After smoothing of the profiles, as shown in Figure 1b, the fitted profiles were obtained, as shown in Figure 1c, where fitting parameters’ values are shown in Table 3. As indicated in Table 3 by the RMSE values, high fitting accuracy was achieved. For context, a constant 5% error in prediction would yield an RMSE value between 0.13 and 0.59 for N1 to N10. The fitting error for N6 is, however, slightly above these figures, and much higher than the other runs. The larger deviations in N6 are due to the high torque values used in this run and the resulting observed fluctuations.
Results of the t-statistic regarding the significance of regression coefficients are presented in Figure 2. In terms of the p-value, only the effect of α on Tend was significant, which is the same as previous studies [9]. Powder states during the wet granulation in the experiments were expected to be funicular or capillary stages according to the calculated values of α. It is known that a high L/S ratio increases torque in a funicular or capillary stage because of the effect of capillary bridge forces on granule agglomeration [41,42]. Capillary bridge forces can generate static surface tension forces and dynamic forces [43]. Conveying the wetted mass requires more power, which could also be a potential reason for the L/S ratio effect. The potential reasons for no detection of other significant impacts could be low fitting accuracy and operation conditions. Torque profiles showed fluctuation regularly, which decreased the fitting accuracy. In addition, continuous wet granulation still requires multiple manual operations that could cause variations and affect the experimental results. Cleaning and drying equipment, equipment assembly, and powder (re)filling are examples of such manual operations.
Regarding start-up operation, L/S ratio and screw speed were likely influential on the time constant and dead time, respectively. The higher L/S ratio and higher screw speed contributed to shortening the start-up time. Dead time was not observed in previous studies, e.g., Vercruysse et al. [25], because higher screw speeds (e.g., 900 rpm) were used in these experiments. One potential reason for shorter dead time observed with higher screw speed is the shorter residence time in the granulation barrel [13]. Further observations inside the barrels would be necessary to understand the effects of L/S ratio theoretically. Compared to other process parameters, the effect of the manufacturing rate was much smaller. In short, both the L/S ratio and screw speed were potential effective parameters on the start-up time.

3.2. Assessment of Granule Size Distribution

Inline measurement of granule size distribution was possible for a limited number of experimental runs, i.e., N5 (v, r, α) = (20, 500, 0.12) and N7 (v, r, α) = (20, 900, 0.12). The measurement was incomplete for other experimental runs because blockages occurred in the measurement equipment caused by large granules, as shown in Figure A1. Especially for a higher L/S ratio, granules were strongly agglomerated to a higher degree and caused frequent clogging of tubes. Results of fines and oversized fractions using inline measurement in the cases of N5 and N7 are shown in Figure 3. Light lines and dark lines represent the actual data and the smoothed data using a moving average of one-minute data, respectively. These results suggest that granule size distributions have fluctuated through the operation without clear signs of a start-up phase. Potential causes of the fluctuations were fluctuations of material feeding and screw speed, which could also be related to the fluctuations of torque profiles (see Section 3.1). In addition, due to the nature of continuous processing, powder flow can lead to dispersion and segregation of particles with a size distribution [44,45,46]. While the start-up in N5 and N7 was slightly observed in torque profiles, it is hard to differentiate between the start-up and the steady-state phases in granule size distributions. Granule size distribution profiles for experimental runs with higher torque cases, such as N6, were not available in the case study. However, since the torque profiles showed distinct impacts of start-up phases, it is possible that the granule size profiles could also show distinct impacts. This will need to be confirmed in further studies.
The fractions of fine and oversized granules using offline measurement are presented in Figure 4, where all experimental runs’ results are summarized separately. In some operating conditions, the fractions of both fine and oversized granules were higher at the beginning, e.g., in the first 5 min, because of heterogeneous agglomeration, and fluctuated throughout the entire run. This trend was clearly observed in N4 and N6, whereas some runs, e.g., N3, did not follow it. Although high L/S ratio generated more oversized granules and fewer fines through the operation, the impacts of process parameters on the time required for the stabilization of granule size were not obvious. One potential cause of fluctuations in offline measurement is short sampling time. There is a possibility that the sampled granules, especially for oversized granules, were not representative of the actual granules due to segregation and dispersion issues. In addition, the torque (Figure 1) and granule size (Figure 4) seemed to be correlated during the steady state, e.g., high torque caused more oversized granules, whereas clear relationships were not observed in the start-up operation. The deviations in granule size distributions were not fully correlated with the torque deviations. For example, there were no large deviations of granule size distributions in N6, whereas a large deviation was observed in the torque profile.
Principal component 1 (PC1) and PC2 of kernel PCA in all experimental runs are presented in Figure 5. Both PCs show the start-up phase and the fluctuations in the granule size distribution. Figure 6a represents the loading plot of kernel PCA, where the loadings of all sampled granule size distributions are plotted. Opposite quadrants (e.g., I-quadrant and III-quadrant) are negatively correlated. The larger the magnitude of each PC is, the stronger the impact on the respective PC is. To visualize granule size distributions by quadrants, Figure 6b shows the representative two granule size distributions from each quadrant. Distributions in I-quadrant showed the largest granule sizes, whereas those in II-quadrant showed the smallest granule sizes. PC1 and PC2 were interpreted as the indicator to show the existence of large particles and middle-sized particles, respectively. In terms of start-up time, some experimental runs showed clear start-up effects, e.g., N4 and N6. Fluctuations in granule size were common to all experimental runs, but made the start-up phase unclear for some runs, e.g., N2. In that sense, the determination of critical process parameters which define the start-up time was hardly possible.
As an overall tendency, the process dynamics of granule size distribution were observed differently depending on the conducted analysis, i.e., measurement equipment and dimensionality reduction methods. Although the start-up effects were observed in some experimental runs, the fluctuations throughout the entire run were larger than the start-up effects. The impact of fluctuations of granule size distributions should be considered in later unit operations and control strategy. It is worth noting that the time taken for granule size to stabilize was shorter than that needed for the stabilization of torque profiles. In terms of the stabilization of granule size distribution, the start-up time was around 5 min.

3.3. Economic Assessment with Different Start-Up Criteria

As mentioned in Section 3.1 and Section 3.2, the start-up time depended on the observed indicator, where different parameters took various durations to stabilize. In this work, it was shown that granule size (a product property) stabilized much faster than the torque (a process variable). This section estimates the resulting varying economic impact when using different indictors to define the start-up time. Although statistical significance has not been confirmed, the effects of process parameters (specifically, L/S ratio and screw speed) on steady-state levels and the duration needed to reach them (regarding torque profiles) were observed. Mass feed rate had a relatively negligible impact compared to other process parameters. The start-up time directly affects the mass of material losses, which influences the raw material cost, as shown in Equation (5). A cost analysis was performed to assess the impact of choosing different criteria for the definition of the start-up phase. In one case, the start-up phase was defined as the duration needed for stabilizing process parameters (here taken as the torque profile), and in the other, for stabilizing product properties (taken here as the granule size distribution). In the assessment, the mass feed rate v was fixed at 20 kg h−1 because it was not critical to start-up, and mlot was set as 100 kg lot−1, considering the industrial standards. The values of CRM and Celec were defined as USD 6.69 + 0.48α kg−1 and USD 0.24 kWh−1 based on the actual experimental situations. Note that EUR 1 was regarded as equivalent to USD 1.2. The start-up time tstart was defined as the time when T(t) is 0.8Tend + 0.2T0 for the torque-based definition, where regression models were used for the prediction of fitting parameters in T(t). For the granule size-based definition, the start-up time tstart was set as 10 min regardless of the values of process parameters. The optimization problem of cost in wet granulation was defined as shown in Equation (7):
min r , α C WG subject   to 500 r 900 0.12 α 0.16
where objective function CWG can be calculated by Equations (4)–(6).
Figure 7 represents the economic assessment when using stabilized (a) process parameters (i.e., torque profiles) and (b) product quality (granule size distribution) as the criterion to define the boundary of the start-up process. The difference between the two figures is the value of tstart used in the calculation. The solutions of Equation (7) were calculated based on brute-force search with mesh sizes of r and α taken as 4 rpm and 0.0004, respectively. Figure 7 suggests that the process parameters that made the lowest granulation cost were totally different depending on the start-up definition. In the case of torque-based definition (Figure 7a), the higher L/S ratio and screw speed resulted in a lower cost because the start-up time became shorter. In the case of granule size-based definition (Figure 7b), the lowest L/S ratio and screw speed gave the lowest cost because of lower torque and lower energy cost. The optimal points shown in Figure 7 are on the edge of the axes intercept due to the boundaries set in the experiments, which represent the boundaries of what is considered reasonable in an industrial manufacturing setting. In addition, the impact of process parameters on cost was larger when the torque-based definition was used for start-up time. The impact of process parameters on cost was not relevant when using the granule size-based definition, as the difference between the lowest and the highest cost was lower than USD 3 lot−1 (Figure 7b). It is quite remarkable that the analysis shows a very different, and even opposite, trend between torque-based and granule size-based definitions. The start-up operation appears differently depending on indicators and has high impacts on economic performance.

4. Conclusions

While, traditionally, the start-up time is defined as that when the process stabilizes, this work has shown that this could differ between process variables, such as torque, and product response variables, such as granule size. One interesting aspect that emerged from the analysis is the difference in the response at the start-up operation between torque and granule size distribution. The results of torque profiles show that the steady-state levels and the duration needed to reach them depended on process parameters, i.e., L/S ratio and screw speed. On the other hand, granule size distribution stabilized faster, or did not show clear start-up operation, which changed depending on multiple dimensionality reduction methods. Indicators used for the definition of start-up time can also have a profound impact on preferable process parameters for economic performance due to the amount of discarded product. Overall, this study reveals the high impact of start-up on economic performance as well as different responses at start-up between process condition and product quality. This work has demonstrated the differences in stabilization times needed for different process parameters and product qualities, as well as the strong economic impact resulting from choosing different indicators as the basis for the definition of the start-up phase. Therefore, it is a logical conclusion that there is a need for having a regulatory guideline for this definition on the basis of thorough scientific studies considering quality assurance. Such regulations could also incentivize further development of continuous processes and help safely minimize start-up time for better economic performance.
Altogether, the monitoring results of torque and granule size enabled the interpretation of the start-up operation. Torque was ramped up at the beginning in a high L/S ratio, whereas it was increased slowly in a low L/S ratio. Although not found to be statistically significant, the screw speed and L/S ratio were influential on the start-up time observed experimentally. The profiles of granule size distribution were more complicated, where the granule size continuously fluctuated regardless of the values of process parameters. Fluctuations can happen due to the nature of continuous powder processing, where dispersion and segregation might occur. Further understanding of start-up operation and fluctuations can determine key parameters to shorten start-up and clarify the acceptable ranges of the fluctuation at the steady state, respectively.
More research should address the detailed or comprehensive analysis of the start-up operation. The experiments were limited to specific formulation using theophylline and might have been influenced by the variations in the experimental set-up. Interpretation of the phenomena in the start-up operation with further experiments could help draw general conclusions about start-up in continuous tablet manufacturing processes. As a comprehensive analysis, many process and product indicators need to be monitored and assessed to define the start-up operation in the entire manufacturing process. While this study focused on wet granulation, subsequent unit operations should be performed simultaneously. The latter could also be modeled by a systems-based approach simulating the complete process line of unit blocks [47]. Further studies are needed to analyze the propagation of the start-up in twin-screw wet granulation to the final product quality, e.g., dissolution. Finally, the start-up operation can be clearly defined in the regulations and reflected in the existing economic assessment tools [28,29].

Author Contributions

Conceptualization, K.M., S.B., H.S., I.N. and T.D.B.; methodology, K.M., A.R., M.P., I.N. and T.D.B.; software, K.M.; validation, K.M., A.R. and M.P.; formal analysis, K.M.; investigation, K.M., A.R. and M.P.; resources, H.S., I.N. and T.D.B.; data curation, K.M., A.R. and M.P.; writing—original draft preparation, K.M.; writing—review and editing, A.R., M.P., S.B., H.S., I.N. and T.D.B.; visualization, K.M.; supervision, H.S., I.N. and T.D.B.; project administration, H.S., I.N. and T.D.B.; funding acquisition, K.M., H.S., I.N. and T.D.B. All authors have read and agreed to the published version of the manuscript.

Funding

K.M. was supported by Research Abroad Grant Award from The New Pharmaceutical Technology and Engineering Foundation, the Leading Graduate School Program, “Global Leader Program for Social Design and Management,” by the Ministry of Education, Culture, Sports, Science and Technology, and a Grant-in-Aid for JSPS Research Fellow [Grant number 18J22793].

Institutional Review Board Statement

Not applicable.

Informed Consent Statement

Not applicable.

Data Availability Statement

The data presented in this study are available on request from the corresponding author.

Conflicts of Interest

The authors declare no conflict of interest.

Abbreviations

APIactive pharmaceutical ingredient
DoEdesign of experiments
HPMChydroxypropylmethylcellulose
L/Dlength-to-diameter
L/Sliquid-to-solid
PATprocess analytical technology
PCprincipal component
PCAprincipal component analysis
RBFradial basis function
RMSEroot mean square error
Nomenclature
VariableDescription
cestestimated coefficient for each parameter
Celecelectricity price [USD KWh−1]
Cenergyenergy cost [USD lot−1]
Cmaterialraw material cost [USD lot–1]
CRMunit price of raw materials [USD kg−1]
CWGcost of wet granulation [USD lot−1]
mlotlot size [kg lot−1]
rscrew speed [rpm]
SEstandard error of the coefficient cest
trunning time [min]
Ttorque [N m]
tdeaddead time [min]
Tendterminal torque [N m]
tstarttime needed for a start-up operation [h lot−1]
tstatt-statistic [–]
T0initial torque [N m]
vmanufacturing rate [kg h−1]
αliquid-to-solid ratio [–]
γhyperparameter in RBFs
σhyperparameter in RBFs
τtime constant [min]
φRBFs

Appendix A

Figure A1. The fractions of fine and oversized granules based on inline measurement, where the monitoring was imperfect due to blocking and liquid leakage: (a) N1; (b) N2; (c) N3; (d) N4; (e) N6; (f) N8; (g) N9; (h) N10.
Processes 09 01502 g0a1aProcesses 09 01502 g0a1b

References

  1. Lee, S.L.; O’Connor, T.F.; Yang, X.; Cruz, C.N.; Chatterjee, S.; Madurawe, R.D.; Moore, C.M.V.; Yu, L.X.; Woodcock, J. Modernizing pharmaceutical manufacturing: From batch to continuous production. J. Pharm. Innov. 2015, 10, 191–199. [Google Scholar] [CrossRef] [Green Version]
  2. Teżyk, M.; Milanowski, B.; Ernst, A.; Lulek, J. Recent progress in continuous and semi-continuous processing of solid oral dosage forms: A review. Drug Dev. Ind. Pharm. 2016, 42, 1195–1214. [Google Scholar] [CrossRef]
  3. Domokos, A.; Nagy, B.; Szilágyi, B.; Marosi, G.; Nagy, Z.K. Integrated Continuous Pharmaceutical Technologies—A Review. Org. Process Res. Dev. 2021, 25, 721–739. [Google Scholar] [CrossRef]
  4. Ierapetritou, M.; Muzzio, F.; Reklaitis, G. Perspectives on the continuous manufacturing of powder-based pharmaceutical processes. AIChE J. 2016, 62, 1846–1862. [Google Scholar] [CrossRef]
  5. Vanhoorne, V.; Vervaet, C. Recent progress in continuous manufacturing of oral solid dosage forms. Int. J. Pharm. 2020, 579, 119194. [Google Scholar] [CrossRef]
  6. Kumar, A.; Gernaey, K.V.; De Beer, T.; Nopens, I. Model-based analysis of high shear wet granulation from batch to continuous processes in pharmaceutical production—A critical review. Eur. J. Pharm. Biopharm. 2013, 85, 814–832. [Google Scholar] [CrossRef] [Green Version]
  7. Portier, C.; Vervaet, C.; Vanhoorne, V. Continuous Twin Screw Granulation: A Review of Recent Progress and Opportunities in Formulation and Equipment Design. Pharmaceutics 2021, 13, 668. [Google Scholar] [CrossRef] [PubMed]
  8. Kim, S.H.; Hwang, K.M.; Cho, C.H.; Nguyen, T.T.; Seok, S.H.; Hwang, K.M.; Kim, J.Y.; Park, C.W.; Rhee, Y.S.; Park, E.S. Application of continuous twin screw granulation for the metformin hydrochloride extended release formulation. Int. J. Pharm. 2017, 529, 410–422. [Google Scholar] [CrossRef]
  9. Kumar, A.; Dhondt, J.; Vercruysse, J.; De Leersnyder, F.; Vanhoorne, V.; Vervaet, C.; Remon, J.P.; Gernaey, K.V.; De Beer, T.; Nopens, I. Development of a process map: A step towards a regime map for steady-state high shear wet twin screw granulation. Powder Technol. 2016, 300, 73–82. [Google Scholar] [CrossRef]
  10. Liu, H.; Galbraith, S.C.; Ricart, B.; Stanton, C.; Smith-Goettler, B.; Verdi, L.; O’Connor, T.; Lee, S.; Yoon, S. Optimization of critical quality attributes in continuous twin-screw wet granulation via design space validated with pilot scale experimental data. Int. J. Pharm. 2017, 525, 249–263. [Google Scholar] [CrossRef] [PubMed]
  11. Ryckaert, A.; Stauffer, F.; Funke, A.; Djuric, D.; Vanhoorne, V.; Vervaet, C.; De Beer, T. Evaluation of torque as an in-process control for granule size during twin-screw wet granulation. Int. J. Pharm. 2021, 602, 120642. [Google Scholar] [CrossRef]
  12. Pawar, P.; Clancy, D.; Gorringe, L.; Barlow, S.; Hesketh, A.; Elkes, R. Development and Scale-Up of Diversion Strategy for Twin Screw Granulation in Continuous Manufacturing. J. Pharm. Sci. 2020, 109, 3439–3450. [Google Scholar] [CrossRef]
  13. Kumar, A.; Alakarjula, M.; Vanhoorne, V.; Toiviainen, M.; De Leersnyder, F.; Vercruysse, J.; Juuti, M.; Ketolainen, J.; Vervaet, C.; Remon, J.P.; et al. Linking granulation performance with residence time and granulation liquid distributions in twin-screw granulation: An experimental investigation. Eur. J. Pharm. Sci. 2016, 90, 25–37. [Google Scholar] [CrossRef]
  14. Meng, W.; Kotamarthy, L.; Panikar, S.; Sen, M.; Pradhan, S.; Marc, M.; Litster, J.D.; Muzzio, F.J.; Ramachandran, R. Statistical analysis and comparison of a continuous high shear granulator with a twin screw granulator: Effect of process parameters on critical granule attributes and granulation mechanisms. Int. J. Pharm. 2016, 513, 357–375. [Google Scholar] [CrossRef]
  15. Hwang, K.M.; Cho, C.H.; Yoo, S.D.; Cha, K.I.; Park, E.S. Continuous twin screw granulation: Impact of the starting material properties and various process parameters. Powder Technol. 2019, 356, 847–857. [Google Scholar] [CrossRef]
  16. Vercruysse, J.; Córdoba Díaz, D.; Peeters, E.; Fonteyne, M.; Delaet, U.; Van Assche, I.; De Beer, T.; Remon, J.P.; Vervaet, C. Continuous twin screw granulation: Influence of process variables on granule and tablet quality. Eur. J. Pharm. Biopharm. 2012, 82, 205–211. [Google Scholar] [CrossRef] [PubMed] [Green Version]
  17. Vanhoorne, V.; Bekaert, B.; Peeters, E.; De Beer, T.; Remon, J.P.; Vervaet, C. Improved tabletability after a polymorphic transition of delta-mannitol during twin screw granulation. Int. J. Pharm. 2016, 506, 13–24. [Google Scholar] [CrossRef] [Green Version]
  18. Vanhoorne, V.; Vanbillemont, B.; Vercruysse, J.; De Leersnyder, F.; Gomes, P.; De Beer, T.; Remon, J.P.; Vervaet, C. Development of a controlled release formulation by continuous twin screw granulation: Influence of process and formulation parameters. Int. J. Pharm. 2016, 505, 61–68. [Google Scholar] [CrossRef]
  19. Liu, H.; Ricart, B.; Stanton, C.; Smith-Goettler, B.; Verdi, L.; O’Connor, T.; Lee, S.; Yoon, S. Design space determination and process optimization in at-scale continuous twin screw wet granulation. Comput. Chem. Eng. 2019, 125, 271–286. [Google Scholar] [CrossRef]
  20. Meng, W.; Oka, S.; Liu, X.; Omer, T.; Ramachandran, R.; Muzzio, F.J. Effects of process and design parameters on granule size distribution in a continuous high shear granulation process. J. Pharm. Innov. 2017, 12, 283–295. [Google Scholar] [CrossRef]
  21. Matsunami, K.; Nagato, T.; Hasegawa, K.; Sugiyama, H. Determining key parameters of continuous wet granulation for tablet quality and productivity: A case in ethenzamide. Int. J. Pharm. 2020, 579, 119160. [Google Scholar] [CrossRef]
  22. Meng, W.; Román-Ospino, A.D.; Panikar, S.S.; O’Callaghan, C.; Gilliam, S.J.; Ramachandran, R.; Muzzio, F.J. Advanced process design and understanding of continuous twin-screw granulation via implementation of in-line process analytical technologies. Adv. Powder Technol. 2019, 30, 879–894. [Google Scholar] [CrossRef]
  23. Meng, W.; Rao, K.S.; Snee, R.D.; Ramachandran, R.; Muzzio, F.J. A comprehensive analysis and optimization of continuous twin-screw granulation processes via sequential experimentation strategy. Int. J. Pharm. 2019, 556, 349–362. [Google Scholar] [CrossRef]
  24. Nasr, M.M.; Krumme, M.; Matsuda, Y.; Trout, B.L.; Badman, C.; Mascia, S.; Cooney, C.L.; Jensen, K.D.; Florence, A.; Johnston, C.; et al. Regulatory perspectives on continuous pharmaceutical manufacturing: Moving from theory to practice. J. Pharm. Sci. 2017, 106, 3199–3206. [Google Scholar] [CrossRef]
  25. Vercruysse, J.; Delaet, U.; Van Assche, I.; Cappuyns, P.; Arata, F.; Caporicci, G.; De Beer, T.; Remon, J.P.; Vervaet, C. Stability and repeatability of a continuous twin screw granulation and drying system. Eur. J. Pharm. Biopharm. 2013, 85, 1031–1038. [Google Scholar] [CrossRef] [PubMed] [Green Version]
  26. Pauli, V.; Kleinebudde, P.; Krumme, M. Predictive model-based process start-up in pharmaceutical continuous granulation and drying. Pharmaceutics 2020, 12, 67. [Google Scholar] [CrossRef] [Green Version]
  27. Matsunami, K.; Nagato, T.; Hasegawa, K.; Sugiyama, H. A large-scale experimental comparison of batch and continuous technologies in pharmaceutical tablet manufacturing using ethenzamide. Int. J. Pharm. 2019, 559, 210–219. [Google Scholar] [CrossRef] [PubMed]
  28. Matsunami, K.; Sternal, F.; Yaginuma, K.; Tanabe, S.; Nakagawa, H.; Sugiyama, H. Superstructure-based process synthesis and economic assessment under uncertainty for solid drug product manufacturing. BMC Chem. Eng. 2020, 2, 6. [Google Scholar] [CrossRef] [Green Version]
  29. Matsunami, K.; Miyano, T.; Arai, H.; Nakagawa, H.; Hirao, M.; Sugiyama, H. Decision Support Method for the Choice between Batch and Continuous Technologies in Solid Drug Product Manufacturing. Ind. Eng. Chem. Res. 2018, 57, 9798–9809. [Google Scholar] [CrossRef]
  30. Metta, N.; Ghijs, M.; Schäfer, E.; Kumar, A.; Cappuyns, P.; Van Assche, I.; Singh, R.; Ramachandran, R.; De Beer, T.; Ierapetritou, M.; et al. Dynamic flowsheet model development and sensitivity analysis of a continuous pharmaceutical tablet manufacturing process using the wet granulation route. Processes 2019, 7, 234. [Google Scholar] [CrossRef] [Green Version]
  31. Fonteyne, M.; Wickström, H.; Peeters, E.; Vercruysse, J.; Ehlers, H.; Peters, B.-H.; Remon, J.P.; Vervaet, C.; Ketolainen, J.; Sandler, N.; et al. Influence of raw material properties upon critical quality attributes of continuously produced granules and tablets. Eur. J. Pharm. Biopharm. 2014, 87, 252–263. [Google Scholar] [CrossRef]
  32. Verstraeten, M.; Van Hauwermeiren, D.; Lee, K.; Turnbull, N.; Wilsdon, D.; am Ende, M.; Doshi, P.; Vervaet, C.; Brouckaert, D.; Mortier, S.T.F.C.; et al. In-depth experimental analysis of pharmaceutical twin-screw wet granulation in view of detailed process understanding. Int. J. Pharm. 2017, 529, 678–693. [Google Scholar] [CrossRef] [PubMed]
  33. Li, H.; Thompson, M.R.; O’Donnell, K.P. Examining drug hydrophobicity in continuous wet granulation within a twin screw extruder. Int. J. Pharm. 2015, 496, 3–11. [Google Scholar] [CrossRef] [PubMed]
  34. Ge Wang, L.; Morrissey, J.P.; Barrasso, D.; Slade, D.; Clifford, S.; Reynolds, G.; Ooi, J.Y.; Litster, J.D. Model driven design for twin screw granulation using mechanistic-based population balance model. Int. J. Pharm. 2021, 120939. [Google Scholar] [CrossRef]
  35. Petrak, D. Simultaneous measurement of particle size and particle velocity by the spatial filtering technique. Part. Part. Syst. Charact. 2002, 19, 391–400. [Google Scholar] [CrossRef]
  36. Silva, A.F.T.; Burggraeve, A.; Denon, Q.; Van Der Meeren, P.; Sandler, N.; Van Den Kerkhof, T.; Hellings, M.; Vervaet, C.; Remon, J.P.; Lopes, J.A.; et al. Particle sizing measurements in pharmaceutical applications: Comparison of in-process methods versus off-line methods. Eur. J. Pharm. Biopharm. 2013, 85, 1006–1018. [Google Scholar] [CrossRef]
  37. Van Hauwermeiren, D.; Stock, M.; De Beer, T.; Nopens, I. Predicting pharmaceutical particle size distributions using kernel mean embedding. Pharmaceutics 2020, 12, 271. [Google Scholar] [CrossRef] [PubMed] [Green Version]
  38. Van Hauwermeiren, D. On the Simulation of Particle Size Distributions in Continuous Pharmaceutical Wet Granulation. Ph.D. Thesis, Universiteit Gent, Ghent, Belgium, 2020. [Google Scholar]
  39. Arthur, G.; Herbrich, R.; Smola, A.; Bousquet, O.; Bernhard, S. Kernel methods for measuring independence. J. Mach. Learn. Res. 2005, 6, 2075–2129. [Google Scholar] [CrossRef]
  40. Pedregosa, F.; Varoquaux, G.; Gramfort, A.; Michel, V.; Thirion, B.; Grisel, O.; Blondel, M.; Prettenhofer, P.; Weiss, R.; Dubourg, V.; et al. Scikit-learn: Machine learning in Python. J. Mach. Learn. Res. 2011, 12, 2825–2830. [Google Scholar] [CrossRef]
  41. Leuenberger, H. New trends in the production of pharmaceutical granules: The classical batch concept and the problem of scale-up. Eur. J. Pharm. Biopharm. 2001, 52, 279–288. [Google Scholar] [CrossRef]
  42. Matsui, Y.; Ando, Y.; Murakami, T.; Watano, S. Prediction of pharmaceutical product properties by compression test of wet granulated masses. J. Soc. Powder Technol. Japan 2019, 56, 328–338. [Google Scholar] [CrossRef]
  43. Iveson, S.M.; Litster, J.D.; Hapgood, K.; Ennis, B.J. Nucleation, growth and breakage phenomena in agitated wet granulation processes: A review. Powder Technol. 2001, 117, 3–39. [Google Scholar] [CrossRef]
  44. Gentzler, M.; Michaels, J.N.; Tardos, G.I. Quantification of segregation potential for polydisperse, cohesive, multi-component powders and prediction of tablet die-filling performance—A methodology for practical testing, re-formulation and process design. Powder Technol. 2015, 285, 96–102. [Google Scholar] [CrossRef]
  45. Liss, E.D.; Conway, S.L.; Zega, J.A.; Glasser, B.J. Segregation of powders during gravity flow through vertical pipes. Pharm. Technol. 2004, 28, 78–96. [Google Scholar]
  46. Kotamarthy, L.; Ramachandran, R. Mechanistic understanding of the effects of process and design parameters on the mixing dynamics in continuous twin-screw granulation. Powder Technol. 2021, 390, 73–85. [Google Scholar] [CrossRef]
  47. Ouranidis, A.; Gkampelis, N.; Vardaka, E.; Karagianni, A.; Tsiptsios, D.; Nikolakakis, I.; Kachrimanis, K. Overcoming the solubility barrier of ibuprofen by the rational process design of a nanocrystal formulation. Pharmaceutics 2020, 12, 969. [Google Scholar] [CrossRef] [PubMed]
Figure 1. Results of torque profiles: (a) measured values; (b) smoothed values; and (c) fitted values by the first-order system.
Processes 09 01502 g001
Figure 2. Results of t-statistic regarding the significance of regression coefficients (* p-value < 0.05).
Processes 09 01502 g002
Figure 3. The fractions of fine and oversized granules based on inline measurement: (a) N5; (b) N7.
Processes 09 01502 g003
Figure 4. The fractions of fine and oversized granules obtained by offline measurement.
Processes 09 01502 g004
Figure 5. Kernel PCA results of granule size distribution obtained by offline measurement.
Processes 09 01502 g005
Figure 6. (a) The loading plot of PCs in kernel PCA; (b) representative granule size distributions from each quadrant.
Processes 09 01502 g006
Figure 7. Contour line plots of wet granulation cost when using stabilized (a) process parameters (torque) and (b) product quality (granule size) as the criterion to define the boundary of the start-up process.
Processes 09 01502 g007
Table 1. Composition of the formulation.
ComponentSubstanceComposition [% (w/w)]
APITheophylline5.0
Fillerα-lactose monohydrate65.0
FillerMicrocrystalline cellulose15.0
BinderHydroxypropylmethylcellulose15.0
Table 2. Values of factors in all ten runs of the experiments based on a full-factorial design with additional repetitions of the center point.
ExperimentManufacturing Rate v [kg h–1]Screw Speed r [rpm]L/S Ratio α [–]
N15.05000.12
N25.05000.16
N35.09000.12
N45.09000.16
N520.05000.12
N620.05000.16
N720.09000.12
N820.09000.16
N912.57000.14
N1012.57000.14
Table 3. Fitting results of torque profiles by the first-order system.
ExperimentT0 [N m]Tend [N m]τ [min]tdead [min]RMSE
N11.613.4320.78.840.0775
N21.957.447.804.300.1765
N31.403.9144.12.89 × 10−140.0793
N41.995.044.082.620.1776
N52.104.3060.020.80.0900
N67.6912.33.343.310.7117
N72.092.8611.01.05 × 10−150.0407
N82.046.8612.87.47 × 10−150.1823
N92.364.6260.01.75 × 10−130.1643
N102.153.015.707.680.1312
Publisher’s Note: MDPI stays neutral with regard to jurisdictional claims in published maps and institutional affiliations.

