1. Introduction
With climate change considered to be one of the biggest challenges of the current time, the relevance of sustainable fuels and chemicals is ever-growing. Renewable hydrogen (H
2) and methanol are considered to be next generation energy carriers–up to the so-called hydrogen- and methanol-economies [
1]. While H
2 is a carbon-free high-caloric gas, methanol is a versatile and easy to handle liquid hydrocarbon. Both chemicals can be utilized for various applications. These include the production of power, heat or synthetic drop-in fuels (e.g., kerosene (HEFA), diesel (FAME) or gasoline) [
1,
2]. Another application is the production of short chain olefins or aromatic compounds, which are building block chemicals in plastics and solvents production. While H
2 and methanol are currently produced mainly on the basis of fossil feedstocks, such as natural gas or coal, an alternative raw material could be biogas [
3]. Biogas, a mixture of CH
4 and CO
2, can be obtained by anaerobic digestion of energy crops or municipal waste, as well as from algae residue.
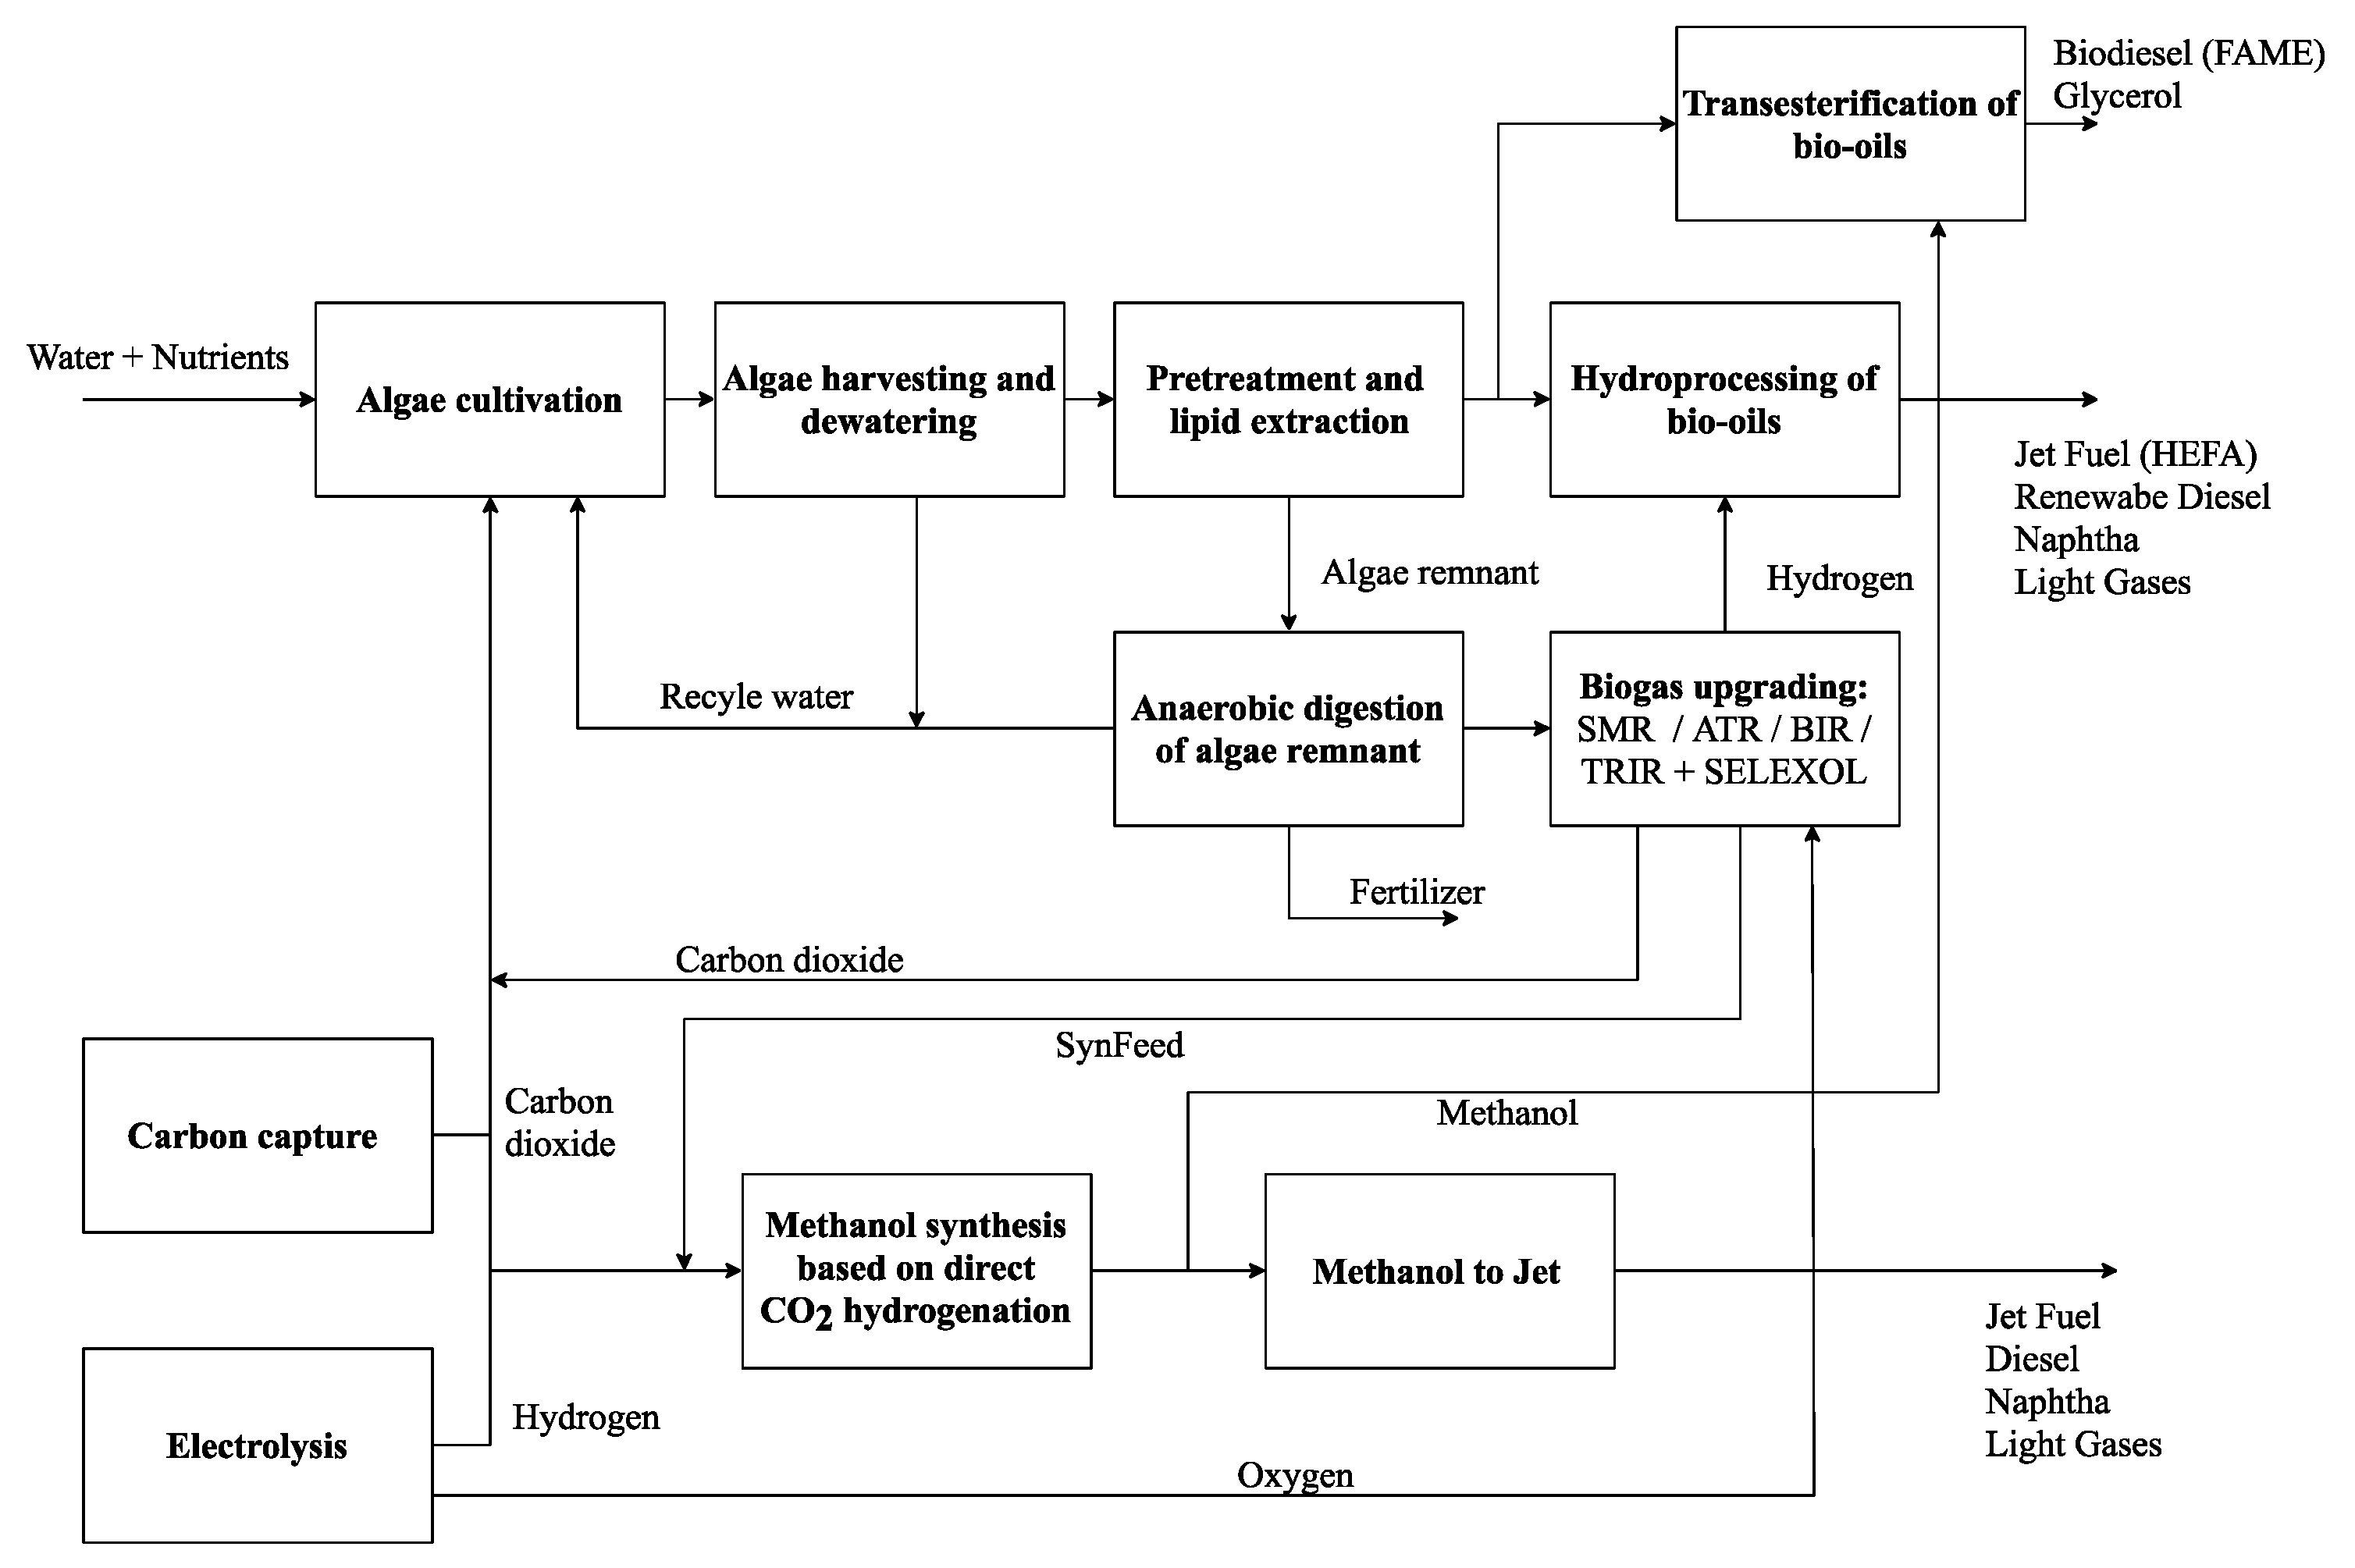
Algae represent an advanced biomass source, with lower land usage and higher productivity as compared with other types of biomass, while not competing with food production [
4,
5]. It can be utilized for a plethora of products. Algae refineries (see
Figure 1) cultivate algae in water using nutrients and carbon dioxide. The produced algae are harvested and dewatered. The biomass consists of a considerable amount of bio-oil, which is separated using solvent extraction (e.g., hexane). These algal oils can be converted to fatty acids methyl esters (FAME), also called biodiesel and glycerol or hydroprocessed esters and fatty acids (HEFA), which are usable as biokerosene. The algae residue, on the other hand, is composed of carbohydrates and proteins and can be used as a feedstock for bioethanol or biogas production [
2,
4,
5]. Biogas has many applications, including electricity and steam generation through combustion and the use of gas and steam turbines. However, biogas can also be employed for the production of pure H
2 or a mixture of H
2 and carbon dioxide (CO
2) (here referred to as SynFeed) or carbon monoxide (CO) (synthesis gas). Synthesis gas or SynFeed, in turn, can be used for methanol production based on conventional or direct CO
2 hydrogenation [
1].
Methanol in conjunction with H
2 and CO
2 are particularly interesting byproducts in an integrated algae-based biorefinery for the production of FAME or HEFA. FAME is produced by transesterification of bio-oils with methanol and is used mainly as a biodiesel blend [
4,
5]. HEFA, on the other hand, is manufactured by the hydrogenation of bio-oils using H
2, and provides a major ASTM certificated way to produce sustainable aviation fuel (SAF) [
6,
7,
8]. While methanol synthesis can be operated using SynFeed with H
2/CO
2 ratio of 3 as feedstock, pure H
2 for HEFA production has to be separated from the CO
2 first. However, the remaining CO
2 should not be considered as waste but can be used as a raw material for algae cultivation. Therefore, the biogas produced from algae residue can be recycled as a raw material for the further upgrading of algal oils to fuels.
Figure 1 depicts the concept of such an integrated algae refinery. To estimate costs and efficiencies of such integrated FAME or HEFA concepts, first the biogas upgrading processes have to be fully understood. The conversion of biogas to SynFeed can be designed with different concepts, using steam or autothermal as well as bi- or tri-reforming processes combined with CO
2 and H
2 capture. The economics of these processes are highly dependent on process performance indicators, such as yield, utility demand, efficiency or the production of byproducts.
Various researchers have produced significant work on the topic of biogas reforming. Zhao et al. 2020, as well as Minh et al. 2018, give a comprehensive overview on methane (CH
4) and biogas reforming processes in their review papers [
9,
10]. Important techno-economic investigations were performed by Di Marcoberardino et al., Chein and Hsu, De Rose et al., Mentenegro Camacho et al. and Madeira et al. [
11,
12,
13,
14,
15].
Di Marcoberardino et al. investigated green H
2 production from raw biogas using conventional reforming technologies in combination with pressure swing adsorption (PSA) for H
2 purification. The focus of their work is on the detailed modeling of pressure swing adsorption modes, leading to H
2 costs of 4.00 to 6.50 €/kg H
2 compressed to 20 bar [
11]. Chein and Hsu produced research about the production of synthesis gas by tri-reforming of biogas using air as oxygen-donor. Their work does not include an economic analysis, however they investigate the influence of different operating conditions, such as pressure, temperature and reactant composition [
15]. De Rose et al. performed a multi-criteria and thermodynamic analysis on biogas reforming to synthesis gas in order to detect optimal operational conditions [
12]. Mentenegro Camacho et al. investigated the BioRobur reactor concept for the production of H
2 by biogas autothermal reforming. Their work concluded that H
2 costs of 2.70–5.30 €/kg can be expected at an amortization time of 4 years [
13]. Madeira et al. analyzed biogas-based H
2 production from cassava waste water plants and identified H
2 costs of 0.13 US
$/kWh, including capital, fuel and maintenance costs at a payback period of 7 years [
14].
Integrated algae-based biorefineries, on the other hand, have been investigated by Gong and You, Gebreslassi and Galanopoulos et al. [
16,
17,
18,
19,
20]. Gong and You investigated the production of biodiesel (FAME) from bio-oil and methanol, the implementing of biogas production from algae residue, CO
2 separation from biogas as well as subsequent steam reforming, the mixing of synthesis gas with CO
2 and methanol synthesis [
17]. Gebreslassie et al. studied biogas production from algae residue, in combination with biogas upgrading and combustion to produce electricity [
20]. Galanopoulos et al. optimized an algae refinery integrated with a wheat straw refinery, implementing an additional conversion step of algae residue to bioethanol and levulinic acid [
19]. While Gong and You, as well as Gebreslassie, showed that biogas would be utilized to produce required heat and electricity, Galanopoulos showed that integration which results in value-added products can outperform pure energy production [
19].
What is missing in these studies to date is a detailed investigation of biogas reforming using different concepts with the goal of SynFeed production, which can be utilized either as a methanol synthesis feedstock or a pure H2 and CO2 feed as would be required in algae-based biorefineries producing either FAME or HEFA. This investigation includes different reforming technologies using either purified CH4 or direct biogas, as well as upgrading technologies like CO2 capture or H2 separation. This work could subsequently be used for further investigations, such as research about integrated algae-based biorefineries. To close this research gap and provide the required data, such as economy-of-scale capital costs, utility demands, operating pressures and temperatures, the work at hand presents a simulation study of different biogas reforming systems for the production of either SynFeed or pure H2 and CO2. The determined process performance indicators are used afterwards for a techno-economic analysis and a comparison of the net production costs of SynFeed in the context of the German energy system.
2. Methodology
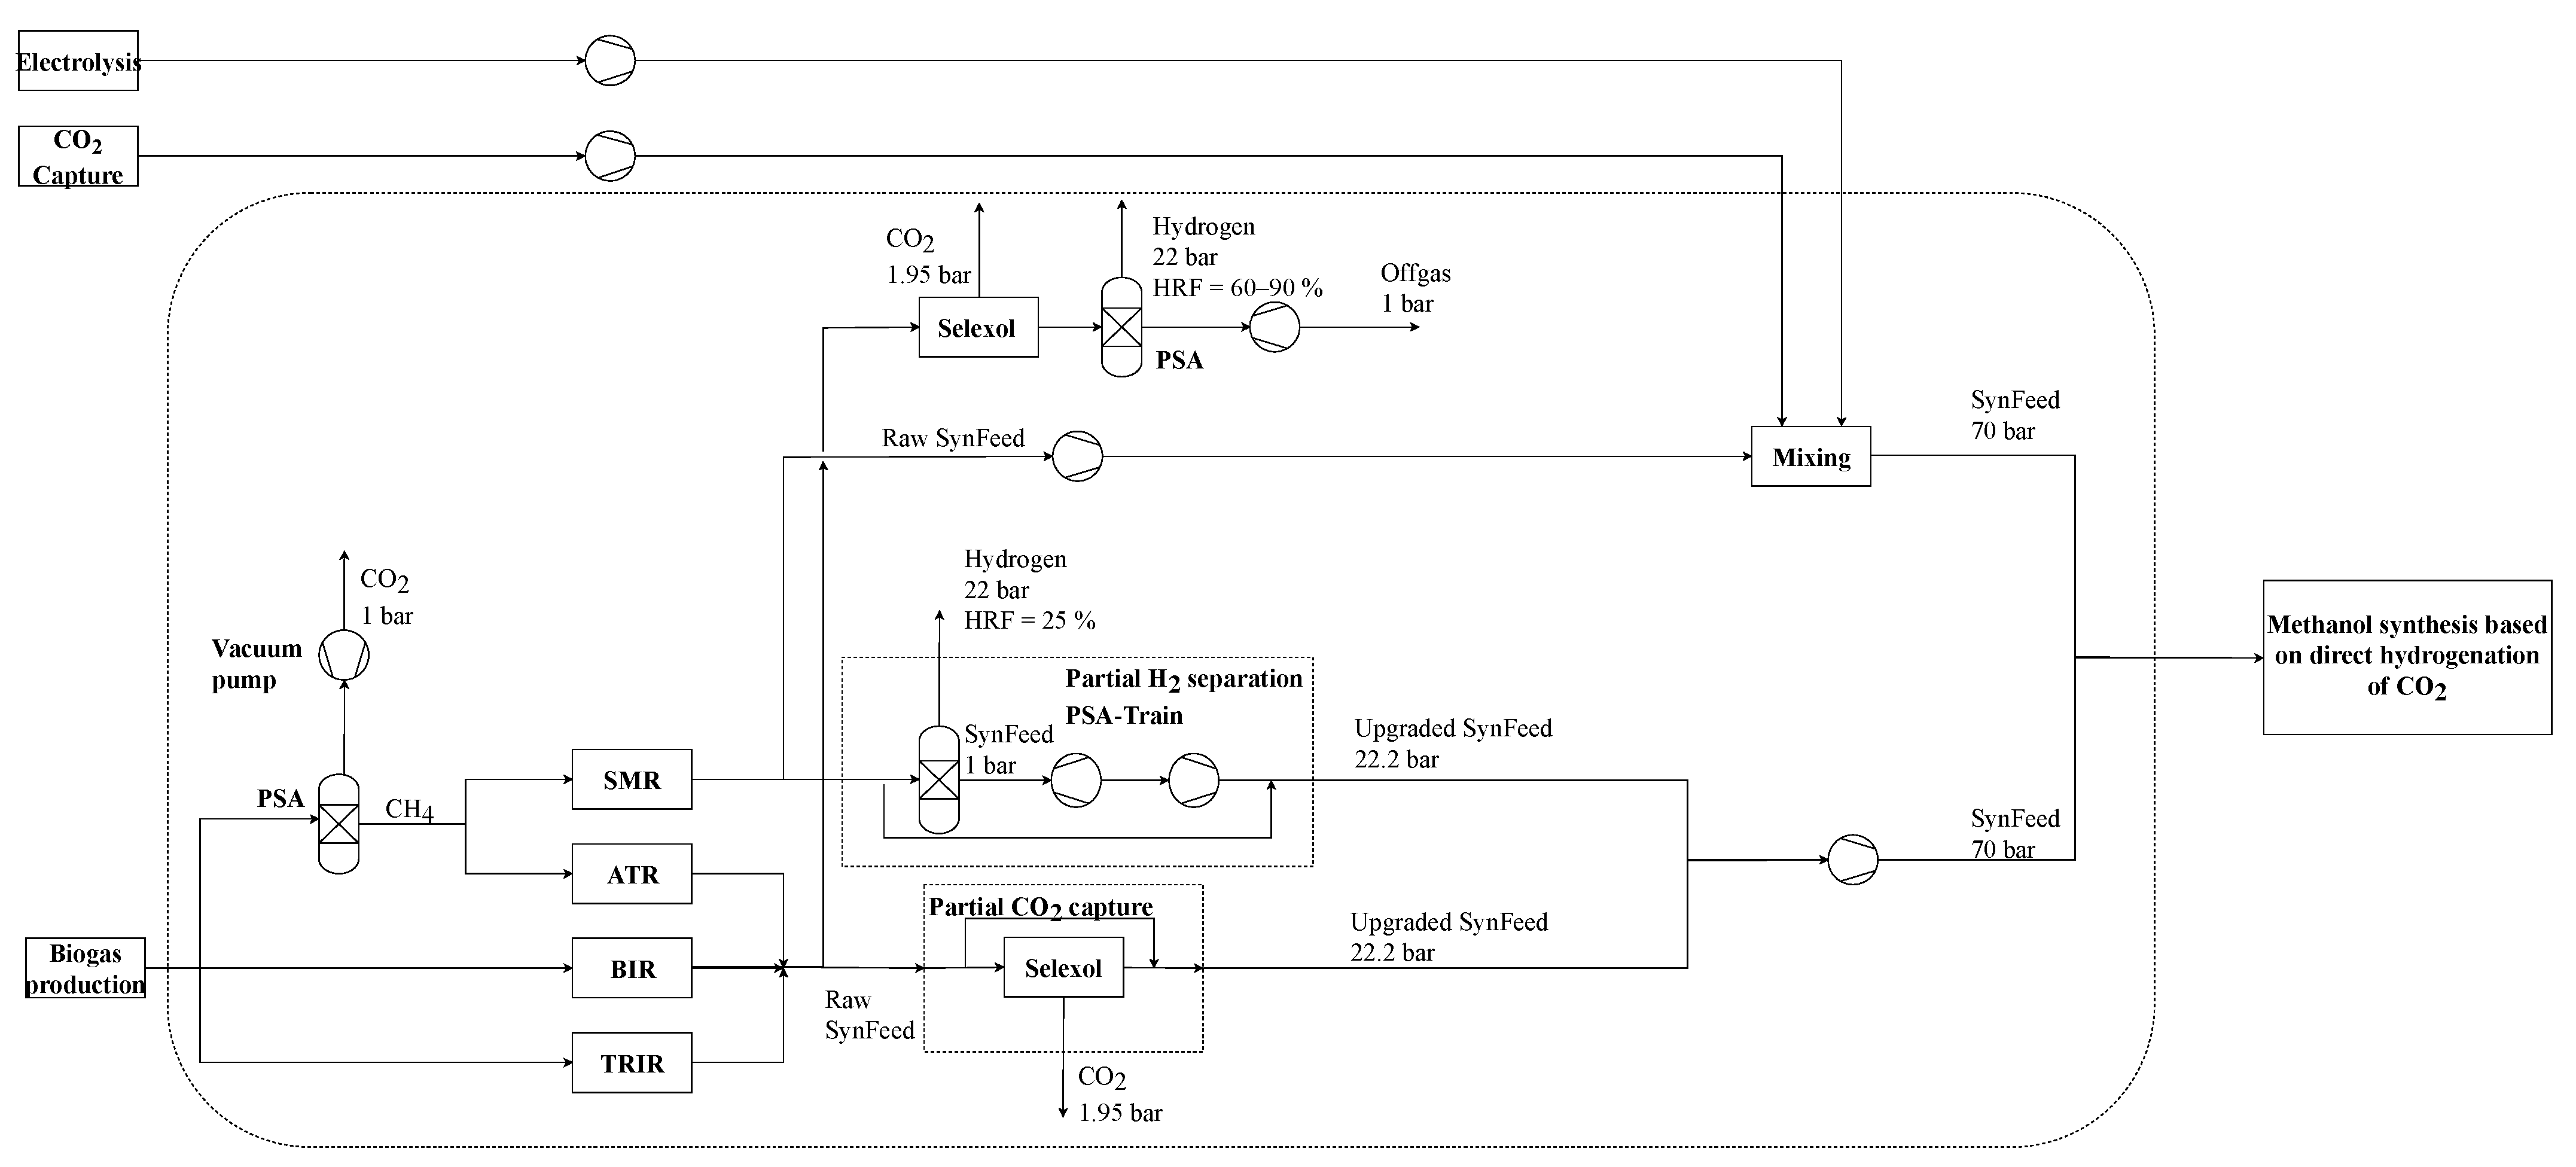
During residue treatment in an algae refinery, biomass can be converted into biogas by anaerobic digestion. This biogas is comprised of roughly 65 vol.-% CH4 and 35 vol.-% of CO2. A subsequent biogas reforming process can be designed in a variety of ways, with each design including upstream dehydration as well as the removal of trace components. After pre-treatment, the conventional design incorporates a pre-capture of CO2, leading to pure CH4, which is then converted to H2 and CO2 by either steam methane or autothermal reforming. Pre-removal of CO2 can be performed using various processes, however pressure swing adsorption is the most widely used process and thus is considered in the current study. A novel concept includes direct biogas reforming as steam- or autothermal biogas reforming, also called bi-and tri-reforming. Here, pre-capture of CO2 is omitted.
To account for novel and renewable concepts, direct CO
2 hydrogenation to methanol is considered to be a downstream conversion technology. Such a conversion technology would also allow for the integration of CO
2 capture units from various flue gases, as well as H
2 production from water electrolysis using renewable electricity (ref.
Figure 1). The methanol production step is not simulated or integrated in the techno-economic analysis, however it defines the specifications of the final SynFeed product. In order to meet the specification of direct CO
2 hydrogenation, raw synthesis gas from biogas/methane reforming has to be further converted to CO
2 and H
2 by the water gas shift reaction. An additional benefit of this process is that it results in maximizing the H
2 share in the raw SynFeed, which allows for a flexible operation as either a SynFeed production unit or pure H
2 and CO
2 production units. Utilizing these concepts, a total of four different biogas conversion technologies are considered, as well as CO
2 capture from SynFeed mixtures for H
2 production (ref.
Figure 2). The selected technology for CO
2 capture from raw SynFeed in this study is physical absorption using Selexol. This technology is highly developed, is operated at an industrial scale and favors high CO
2 contents as well as operating pressures. As such, it is an optimal choice for CO
2 capture from biogas/methane reformers. In the Chapters 2.1 to 2.5, the different process concepts are presented. The simulation models are then described in Chapter 3 and the process performance indicators, as well as economic key figures, are presented in Chapter 4.
2.1. Steam Methane Reforming (SMR)
Steam reforming of methane is a prominent way to produce synthesis gas or H
2; the former being feed for methanol or Fischer-Tropsch-Synthesis, and the latter being a major input for oil refineries or ammonia production [
3]. Industrial steam reformers are designed for small- to large-scale H
2 output of 1000–200,000 Nm
3/h, with 50,000 Nm
3/h being a typical capacity [
10]. In steam methane reforming (SMR), CH
4 reacts with steam over a nickel-based catalyst via the endothermic reaction Equation (1) to form CO and H
2 [
3]. Due to its endothermic nature and a surplus of substance on the product site, the equilibrium of this reaction is shifted to the product site by high temperatures and low pressures. Based on Equation (1), an equilibrium steam to carbon ratio (S/C) for SMR is reached at 1. The process is often operated at high temperatures of 700–900 °C and elevated pressures of 20–40 bar [
3,
21]. Higher temperatures can lead to coke formation, while lower temperatures can reduce CH
4 conversion [
10]. The effect of the pressure on CH
4 conversion is rather small compared to that of the temperature, while lower pressures account for higher conversion. Pressures of 20–40 bar are chosen anyway, due to reduced equipment size and lower capital expenditures, as well as down-stream processing at high pressures [
22]. The decreased CH
4 conversion due to high pressures is offset, to some extent, by an elevated S/C of 3–5.
Besides the steam reforming reaction, nickel-based catalysts also promote the water-gas-shift (WGS) reaction (Equation (2)). This reaction is slightly exothermic and is responsible for CO
2 formation from CO. Due to its exothermic nature, the WGS reaction is favored at low temperatures.
If H
2, rather than synthesis gas, is the target product of the reforming process, CO is not desired in the product stream. In addition, a maximum conversion of CH
4 and a maximum yield of H
2 is desired. If lower pressures are not practicable, higher S/C ratios are appropriate in order to maximize CH
4 conversion. Additionally, WGS reaction is enhanced by one or two additional WGS reactors. Often, these are designed as one high temperature water-gas-shift (HT-WGS) reactor and one low temperature water-gas-shift (LT-WGS) reactor. HT-WGS reactors operate at temperatures of 300–500 °C using Fe/Cr or Co/Mo catalysts, while LT-WGS operate at 190–280 °C using CuO/ZnO catalysts [
3,
21]. The dual reactor design is used to take advantage of the higher reaction rates at elevated temperatures and higher conversion at lower temperatures, thus minimizing capital costs while maximizing H
2 yield.
2.2. Autothermal Methane Reforming (ATR)
Another prominent way to produce synthesis gas or H
2 is by autothermal reforming (ATR). This process combines the partial oxidation of CH
4 (Equation (3)) with steam reforming (Equation (1)).
ATR can also be used to produce synthesis gas from longer hydrocarbons, such as gasoline or naphtha [
3]. The combination of endothermic steam reforming and exothermic partial oxidation ensures a high H
2 yield, while transforming the process into an autothermal process where the partial oxidation supplies the heat needed for the reforming process [
3]. Industrial reactors are designed as one unit-operation which utilizes two reaction zones. At the top, fuel as well as oxygen (or air) and steam are fed into the reactor and fuel and oxygen (O
2) are then partially oxidized, supplying heat. The reacted gas mixture then enters a tubular reaction zone filled with nickel catalysts in order to perform the reforming reactions. Operating temperatures of 850–1100 °C are slightly higher than in conventional steam reformers, while pressure is in the same range with 20–70 bar [
3,
23,
24]. Due to higher operating temperatures, as well additional partial oxidation reforming of CH
4 and O
2, CH
4, conversion is generally higher when using ATR compared to SMR, while H
2/CO
2 ratio is generally lower. Another advantage of using ATR is that the H
2/CO ratio can be adjusted by tuning the S/C and O
2/C ratio.
2.3. Biogas Steam Reforming/Bi-Reforming (BIR)
Direct steam reforming of biogas is also called steam biogas reforming (BGR) or bi-reforming (BIR). In bi-reforming, steam reforming reaction (Equation (1)) is accompanied by the dry reforming of CH
4 and CO
2 according to Equation (4), due to the presence of CO
2 in the feed.
The reaction is endothermic and favors high temperatures and low pressures. Often, the CH
4/CO
2 ratio in bi-reforming systems is considered to be an important design parameter. However, in this work this parameter was fixed due to the given composition of the biogas. Other process variables are the reforming temperature (500–1000 °C), as well as the pressure (1–40 bar) and S/C ratio (3–5, similar to SMR) [
9]. In the literature, bi-reforming processes are often described as being designed at a lower pressure (6–16 bar) and slightly lower temperatures of 800–850 °C, yielding higher CH
4 and CO
2 conversion [
9,
11].
2.4. Biogas Autothermal Reforming/Tri-Reforming (TRIR)
Biogas autothermal reforming, better known as tri-reforming (TRIR), combines bi-reforming with partial oxidation. Accordingly, Equations (1)–(4) take place in TRIR. O
2 for partial oxidation is supplied as air or pure O
2. Pure O
2 leads to higher purities in the product stream but is costly to produce. Studies investigating the thermodynamic behavior of TRIR indicate similar pressures as the other processes with 1–20 bar and high temperatures of 800 °C–1000 °C. Often, low pressures at around 1 bar with temperatures at the low end of 800 °C are investigated [
9,
11,
15].
2.5. CO2 Capture by Selexol Process
The presented reforming technologies produce H2/CO2 gas mixtures of different ratios. For some of the processes, a partial CO2 capture has to be incorporated in order to meet the H2/CO2 ratio specification required for direct CO2 hydrogenation methanol synthesis. Another approach is to produce pure CO2 and H2 as stand-alone products from the SynFeed. In both cases, CO2 capture is an integral part of the process design.
The most commonly used technologies for CO
2 capture are chemical absorption (MEA and MDEA), physical absorption (Selexol, Rectisol) or pressure swing adsorption [
25]. While chemical absorption relies on low pressure steam for solvent regeneration, physical absorption and pressure swing adsorption rely on pressure relief in combination with cooling.
Carbon capture using physical absorption is especially interesting for streams with a high CO
2 content and partial pressure. The Selexol process is one of the most advanced physical absorption processes and utilizes a mixture of polyethylene glycols as the solvent. Due to its high affinity to H
2S, this process can be designed for dual-extraction, capturing H
2S and CO
2 separately or together [
25]. This feature makes it interesting for a sulfur-rich gasification feed such as coal. However, in methane reforming systems, catalysts are sensitive to sulfur. Therefore, it is expected that sulfur components will be removed prior to the biogas reforming. Thus, the Selexol process can be designed as a single-stage extraction which reduces capital and operating costs.
3. Process Simulation
Process models for SMR, ATR, BIR, TRIR and Selexol carbon capture were developed. The models are implemented in Aspen Plus V10.
As in other literature-based studies, the Peng-Robinson equation of state is utilized in the process models for reforming technologies [
11,
12]. CO
2 capture by Selexol requires more complex solvent–gas interaction and is therefore modeled using PC-SAFT [
26,
27]. All the reforming processes are designed for a base capacity of 1000 kmol/h gas input, where SMR and ATR use pure CH
4 (16 t/h), BIR and TRIR use raw biogas with a CH
4/CO
2 ratio of 0.65/0.35 (25.8 t/h). This amount of biogas roughly corresponds to an algae refinery producing about 61 million liters (46 kt) of jet fuel per year via hydro-processing of algae oil [
28]. The base feed load for the Selexol units is the SynFeed output of the respective reforming technology.
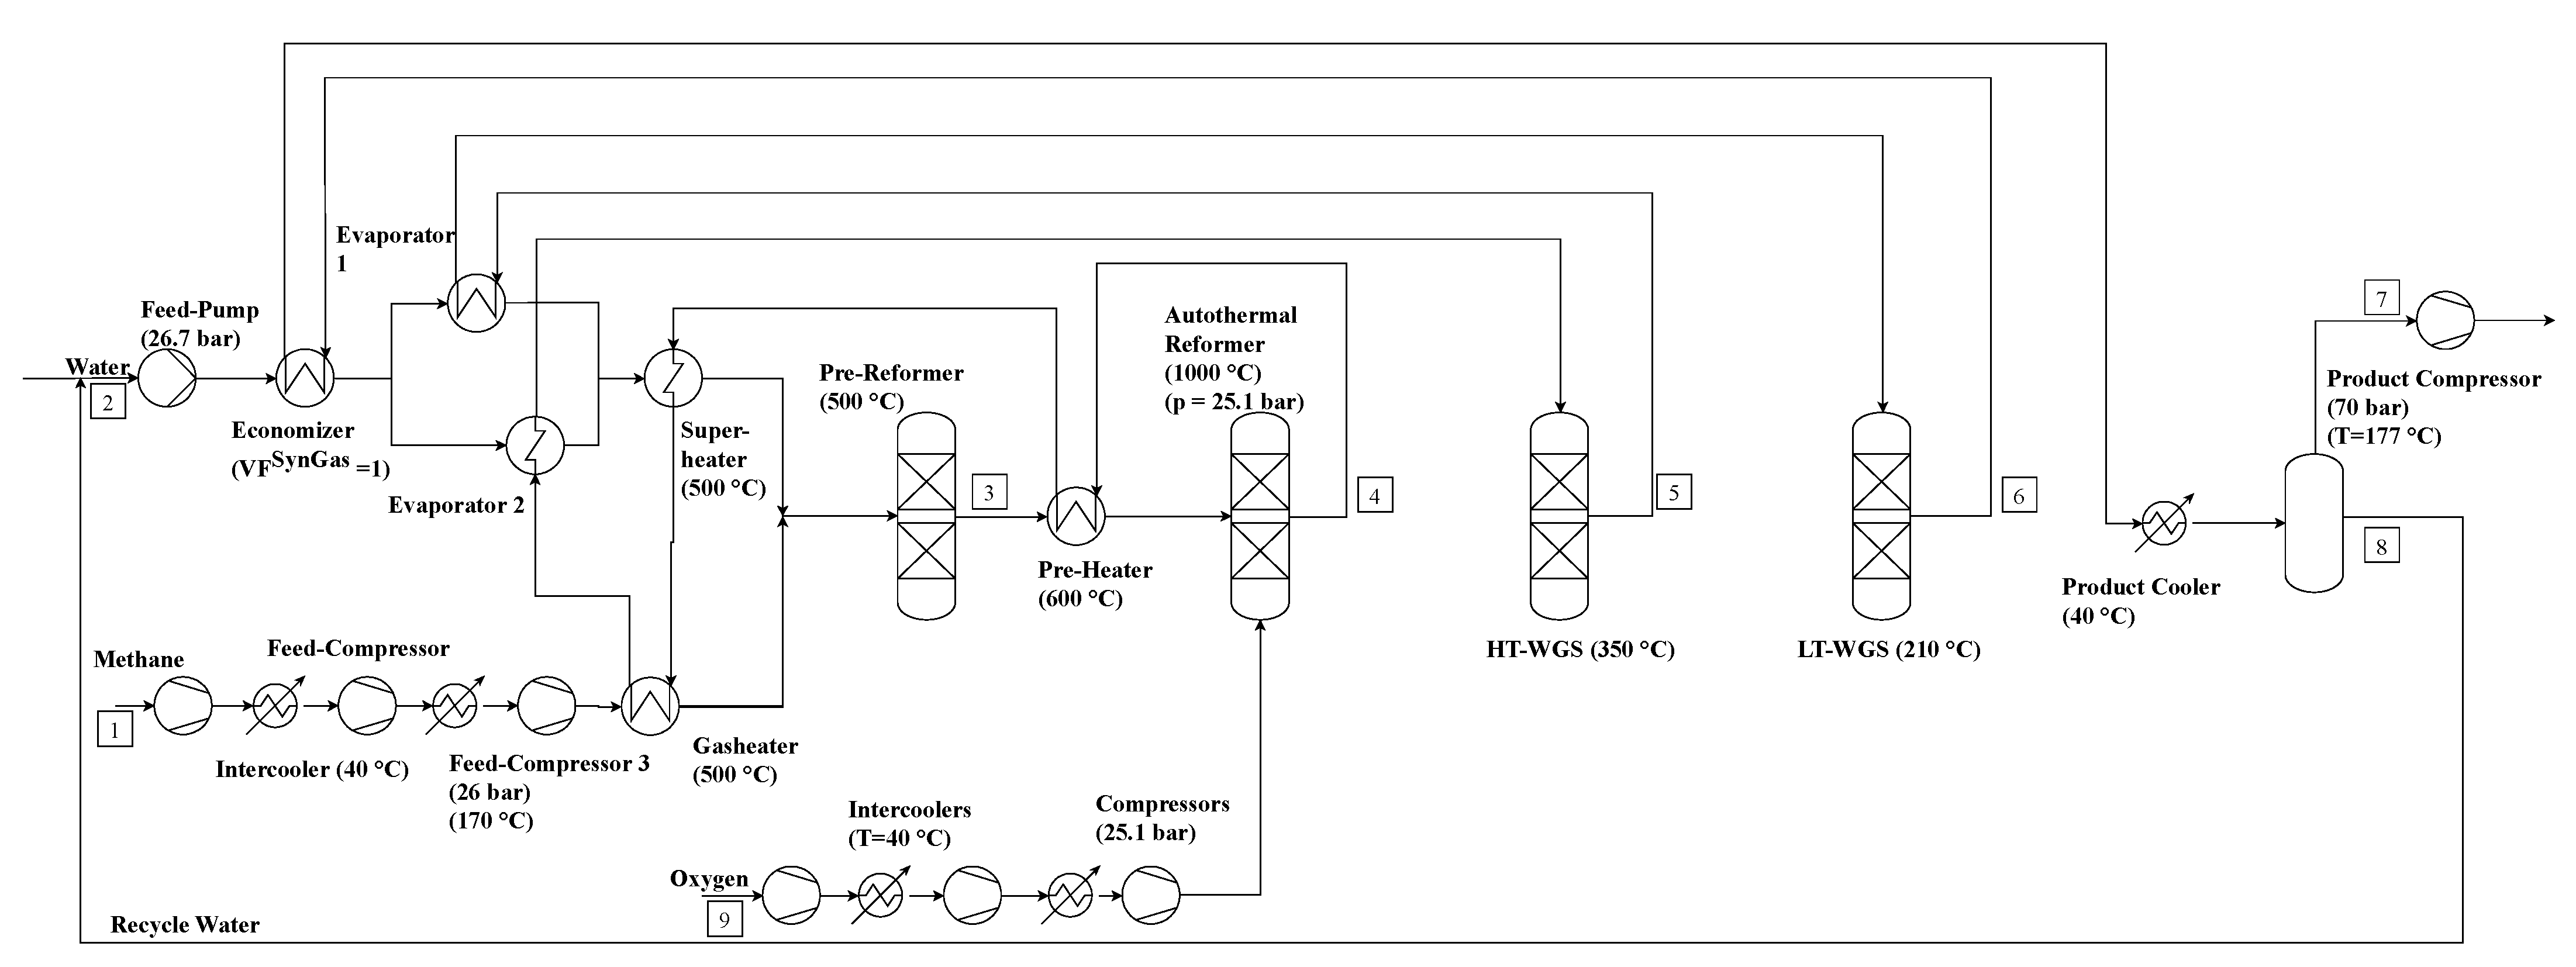
3.1. Process Design and Modeling of SMR Process
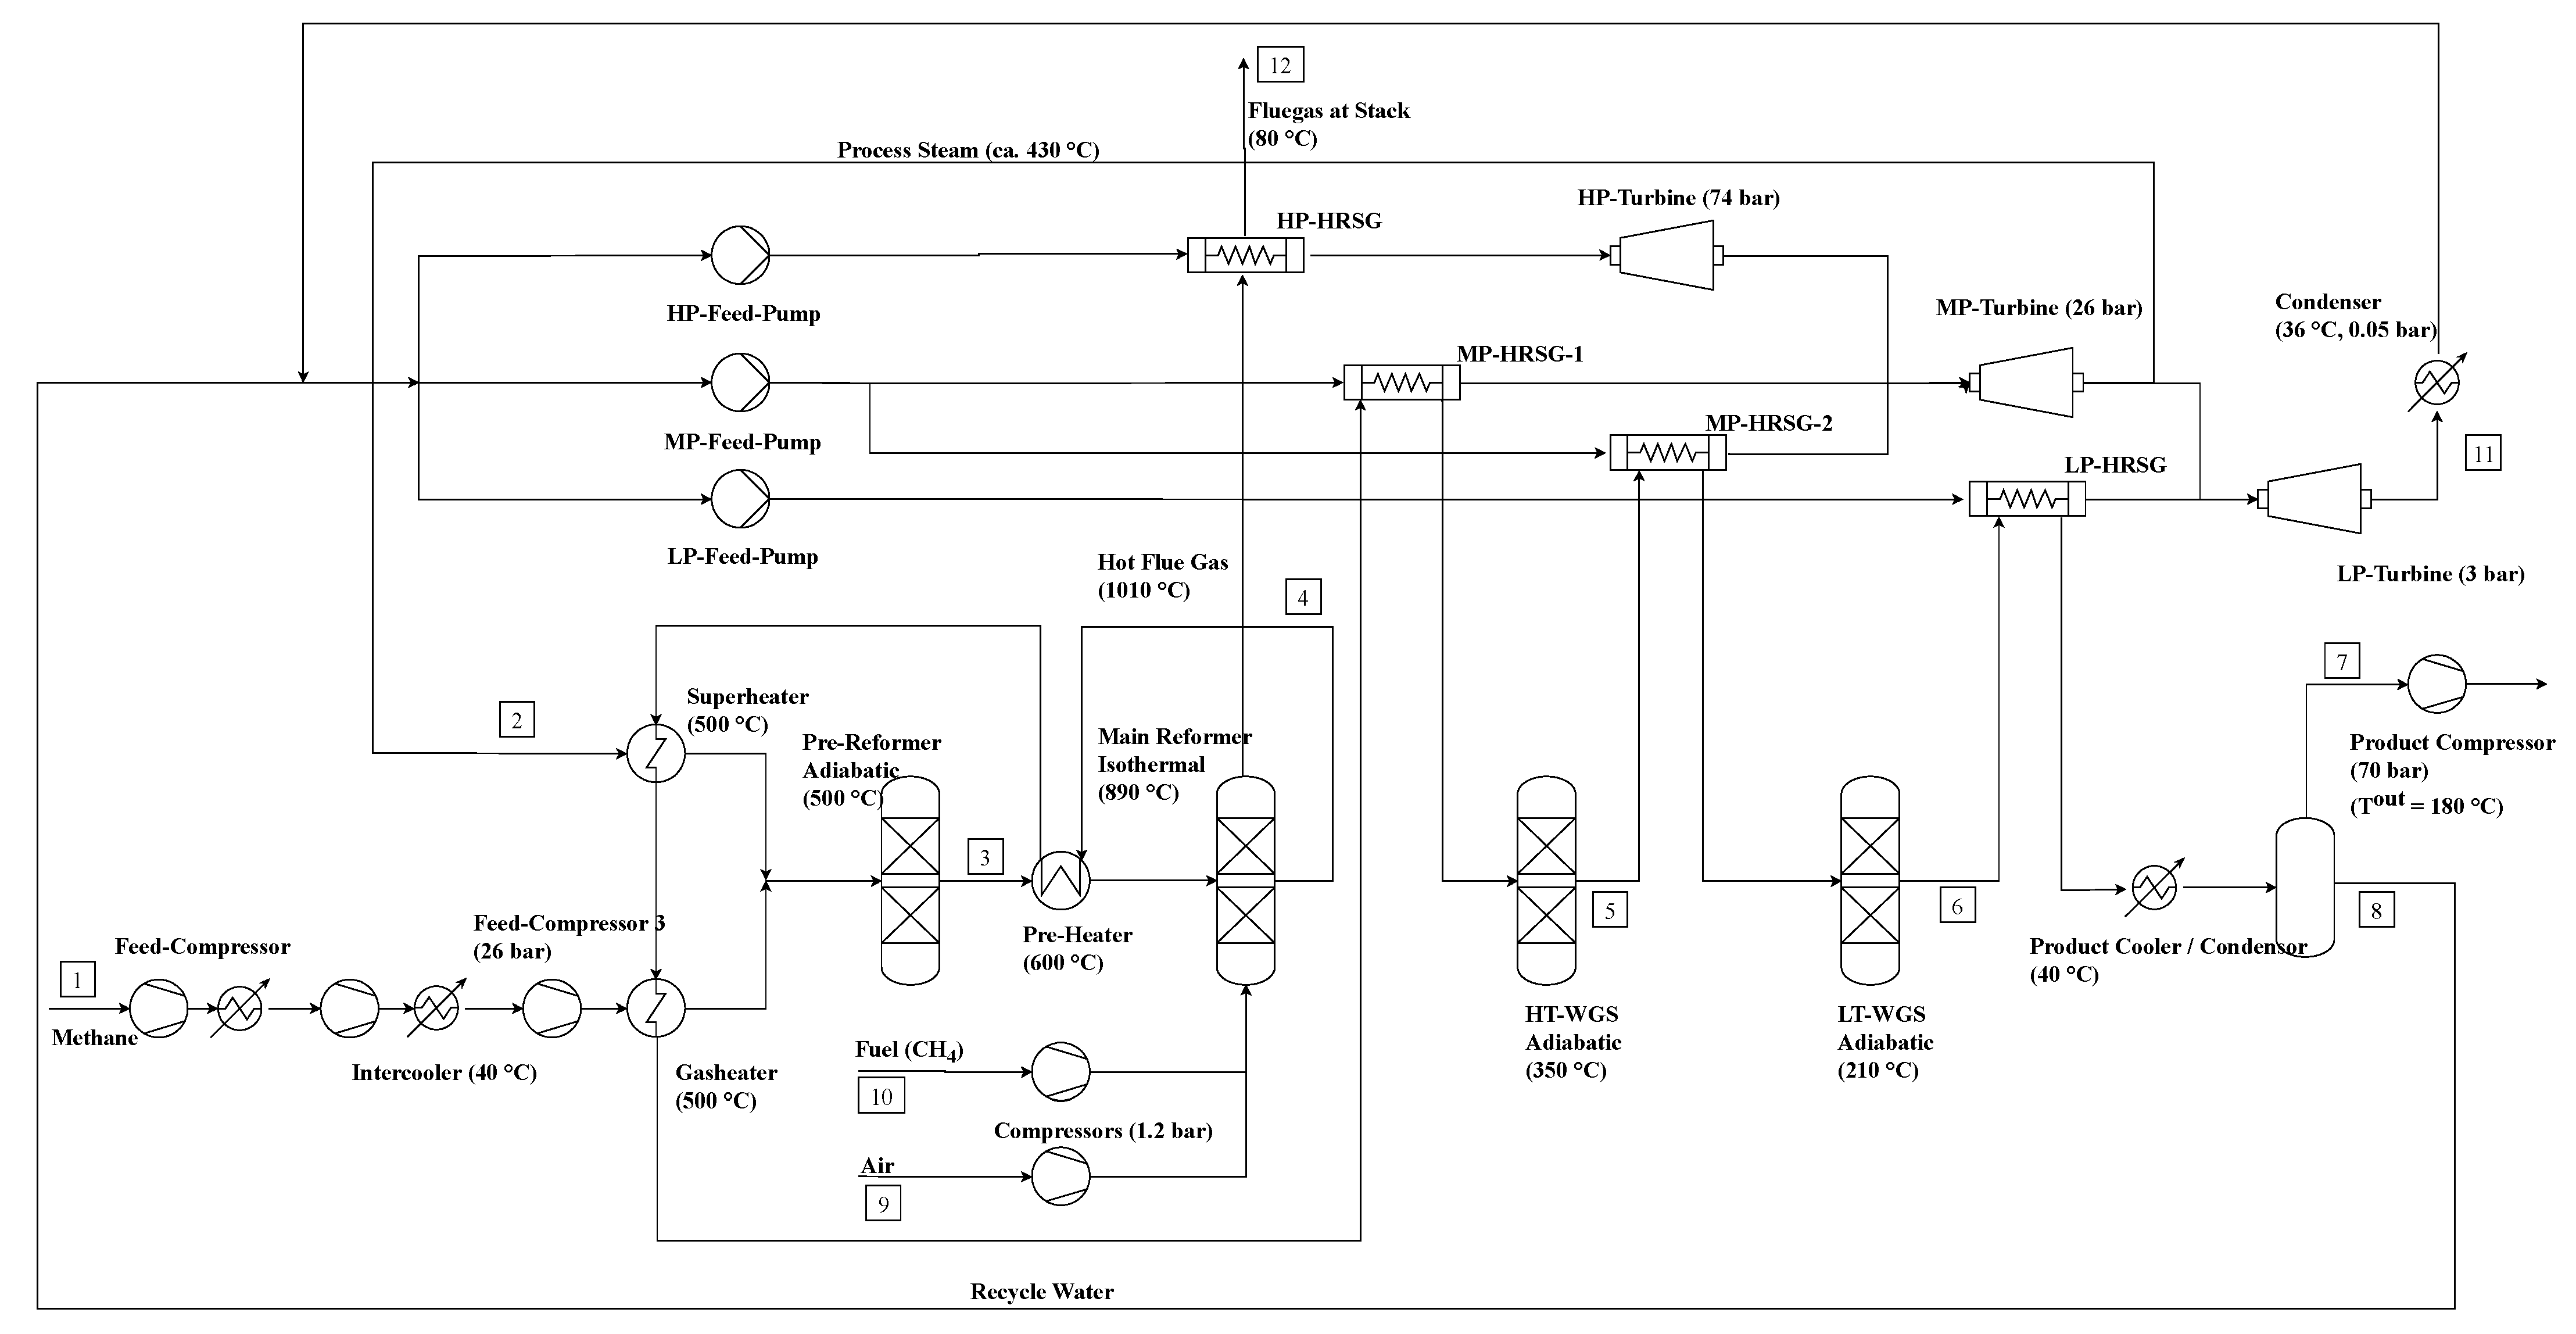
As described above, the SMR process is designed for high CH4 conversion as well as high H2 yield and low CO content in order to be utilized as either feed in direct hydrogenation of CO2 to methanol or as H2 feed in HEFA production using algal oil.
The process flow diagram is presented in
Figure 3. It is assumed that CO
2 is separated from the biogas beforehand, leading to a pure CH
4 input. First, this pure CH
4 is compressed in a two-stage compression with intercooling to 40 °C. Afterwards the gas feed is pre-heated to 500 °C and mixed with steam at 500 °C to the desired S/C ratio. Here, two different approaches are taken and investigated independently from each other.
The first approach is a medium S/C = 3.5, which is a common value for SMR. In this layout, the CH4 conversion is <90%, which is not critical in common applications. Unreacted off-gas is simply used as fuel for the heat integration of the conversion reactor. However, in this study the target process is the direct hydrogenation methanol synthesis using the complete product gas from the reforming process. Impurities, such as remaining CH4, lead to higher volume flows which would require larger equipment, thus they should be minimized. The other concepts that are investigated (ATR, BIR, TRIR) also yield higher conversion rates and, thus, lower impurities. To counter this effect and ensure a fair comparison of technologies, a second S/C ratio of 5 is investigated. Here, a conversion of at least 95% is achieved, leading to low CH4 impurities of maximum 1 mol.-% in the product stream. The mixture of steam and CH4 is fed into an adiabatic pre-reformer. Such reformers are normally used to break down longer hydrocarbons of fossil feedstock. Here it is used to guarantee that only short-chain hydrocarbons enter the main reformer. The pre-reformer is modeled as a Gibbs reactor. After pre-reforming, the gas mixture is pre-heated to 600 °C using the hot outlet from the main reformer. In industry, the main reformer is designed as a tubular reactor with external burners. Here it is modeled as two Gibbs reactors. The first one is the reformer itself, which operates at 890 °C and performs the endothermic steam reforming and slightly exothermic WGS reaction. This reactor represents the tubular catalytic reformer part. The second reactor represents the external burners. Here, additional CH4 fuel is mixed with air at 15% O2 excess. The fuel–air mixture is reacted to provide the required heat for the reforming reaction. The flue gas temperature is set at 1010 °C, while the fuel input is designed for full heat supply of the main reformer.
The hot flue gas is used to generate superheated steam at 74 bar and 600 °C. This steam is depressurized in the first steam turbine to 26 bar in order to generate electricity. The hot reformer outlet is cooled in several steps. At first, it is used to pre-heat the pre-reformer outlet. Following this, it is utilized to superheat the steam/methane feed to the pre-reformer to 500 °C. Finally, the remaining heat is used to evaporate and superheat water at 26 bar. After this series of heat exchanges, the reformer outlet enters the HT-WGS at 350 °C. The HT-WGS is modeled as an equilibrium reactor that performs the WGS-reaction at adiabatic conditions. The hot WGS outlet is then cooled down to 210 °C, generating steam at 26 bar. Part of the medium pressure steam is used as the feed for the reformer. This share depends on the S/C configuration. The rest of the medium pressure steam mixture is depressurized in a MP-steam turbine to 3 bar, in order to generate electricity. The cold WGS outlet enters the LT-WGS reactor, which is also modeled as an adiabatic equilibrium reactor, performing the reaction at 210 °C. Some of the heat of the LT-WGS outlet is recovered in order to produce 3 bar LP-steam, which is mixed with the MP-turbine outlet and depressurized to 0.25 bar in a LP-steam turbine. The LP-turbine outlet is afterwards condensed at about 36 °C and pumped to working pressures by several feed pumps. The cooled WGS-outlet is further cooled to 40 °C, utilizing cooling water. Afterwards it is injected into a flash drum, separating water and product gases. While the water is recycled and used as an input for the feed pumps, the gases, containing mainly H2 and CO2, are compressed to 70 bar for methanol synthesis using a product compressor.
In this study, the final product compressor is taken as a decisive unit-operation for the reforming operation pressure. The inlet temperature, as well as outlet pressure, are fixed at 40 °C and 70 bar. A single-stage compression should be applied, and the outlet temperature of the compressor should not exceed 180 °C. By further defining pressure drops in the unit-operations, the feed pressure is determined. Pressure drops for reactors, heat exchanger and heat recovery units are taken from the literature, while pressure stages for the different turbines are designed based on experience.
To properly size and cost heat exchangers, the thermal transmittance
U for each exchanger is calculated based on the VDI-Wärmeatlas using Equations (5)–(7) [
29]. Here U-values for the Gas–Gas as well as the Liquid–Liquid heat exchanger are assumed to be linear depending on pressure, while waste heat recovery has a fixed value. Where heat exchangers have multiple roles in one (e.g., economizing (liq.-liq.), evaporation (HRSG) and super heating (gas-gas)), a mean value based on the amount of heat exchanged for the different types of heat exchange is calculated.
Table 1 shows the calculated U-values for the described model.
Modeling the reactors as Gibbs or equilibrium reactors simplifies the simulation tremendously, however it is not completely accurate. While the reforming and WGS reaction are fast at the assumed temperatures, the real equilibrium is not reached in industrial reactors. Gibbs and equilibrium reactors assume an infinite reaction time. However, real reforming processes operate at small residence times of about 1 s [
22]. To balance this offset, the temperature approach method suggested by Hamelinck et al., as well as Katofsky, is used [
22,
24]. It allows for a definition of a temperature offset at which the equilibrium composition is calculated, while the energy balances are performed at the real reactor temperatures. This leads to a slightly reduced conversion and therefore to a more realistic representation.
Table 2 shows all the important key parameters for the SMR process design.
3.2. Process Design and Modeling of ATR Process
The general concept of autothermal reforming is similar to steam reforming and is depicted in
Figure 4. Steam and CH
4 are pressurized to operating pressure and, afterwards, are heated to 500 °C for adiabatic pre-reforming. After pre-reforming the mixture is fed to the autothermal reactor. Additionally, pure O
2 is fed to the reactor. In general, the ATR can be operated using air or O
2. However, air leads to diluted streams with a high content of nitrogen, requiring the complex separation of H
2 and CO
2. In addition, the process idea originates from integrated renewable processes, so it stands to reason that O
2 is available as a byproduct of water electrolysis. The pre- and main-reformer are designed as adiabatic Gibbs reactors. The hot outlet is used for heat integration and then fed to the dual-stage WGS at 350 °C and 210 °C. The WGS outlet is also used in the heat integration, and then cooled to 40 °C and flashed. The gaseous product is compressed to 70 bar.
The autothermal process concept has various design variables. These include the S/C ratio, which can be lower or equal to the SMR process (0.5–3.5); the reformer pressure, which is between 20–70 bar; and the O
2/C ratio, which is often around the partial oxidation stoichiometric value or higher [
3,
23,
24]. Directly connected to the S/C and O
2/C ratio is the reformer temperature, which is in the range of 850–1100 °C [
3,
23,
24].
In order to constrain the design of the ATR to some extent, the following design principles are considered:
The CO-content in the compressed product is limited to 1 mol.-%, since it serves as feed for direct hydrogenation methanol synthesis;
the required heat is provided by heat integration of the partially oxidized feed, so that the ATR process is fully autothermal;
the amount of O2 supplied is minimized, due to its energy-, emission- and cost-intensive provision.
To meet the CO-design criterion, the S/C ratio is set to 2.2/1. If the ratio is further increased, the CO content is further reduced, but more energy is required for steam generation, which leads to either external heat demand or the need for a higher O
2 supply. To meet autothermal design (design principle 2) at an S/C ratio of 2.2, the reformer outlet temperature has to be at least 999 °C. To achieve this temperature, a superstoichiometric O
2 supply is necessary. While it is possible to further increase the reformer temperature and thus generate excess energy that could be transformed into steam or electricity, this would contradict design principle 3 due to increased O
2 demand. Therefore, the O
2/C ratio is set at 0.574 in order to reach exactly 999 °C. As with the SMR process, U-values for heat exchangers are calculated using Equations (5)–(7). The resulting values are depicted in
Table 3. The key parameters as well as literature references for the ATR design are provided in
Table 4.
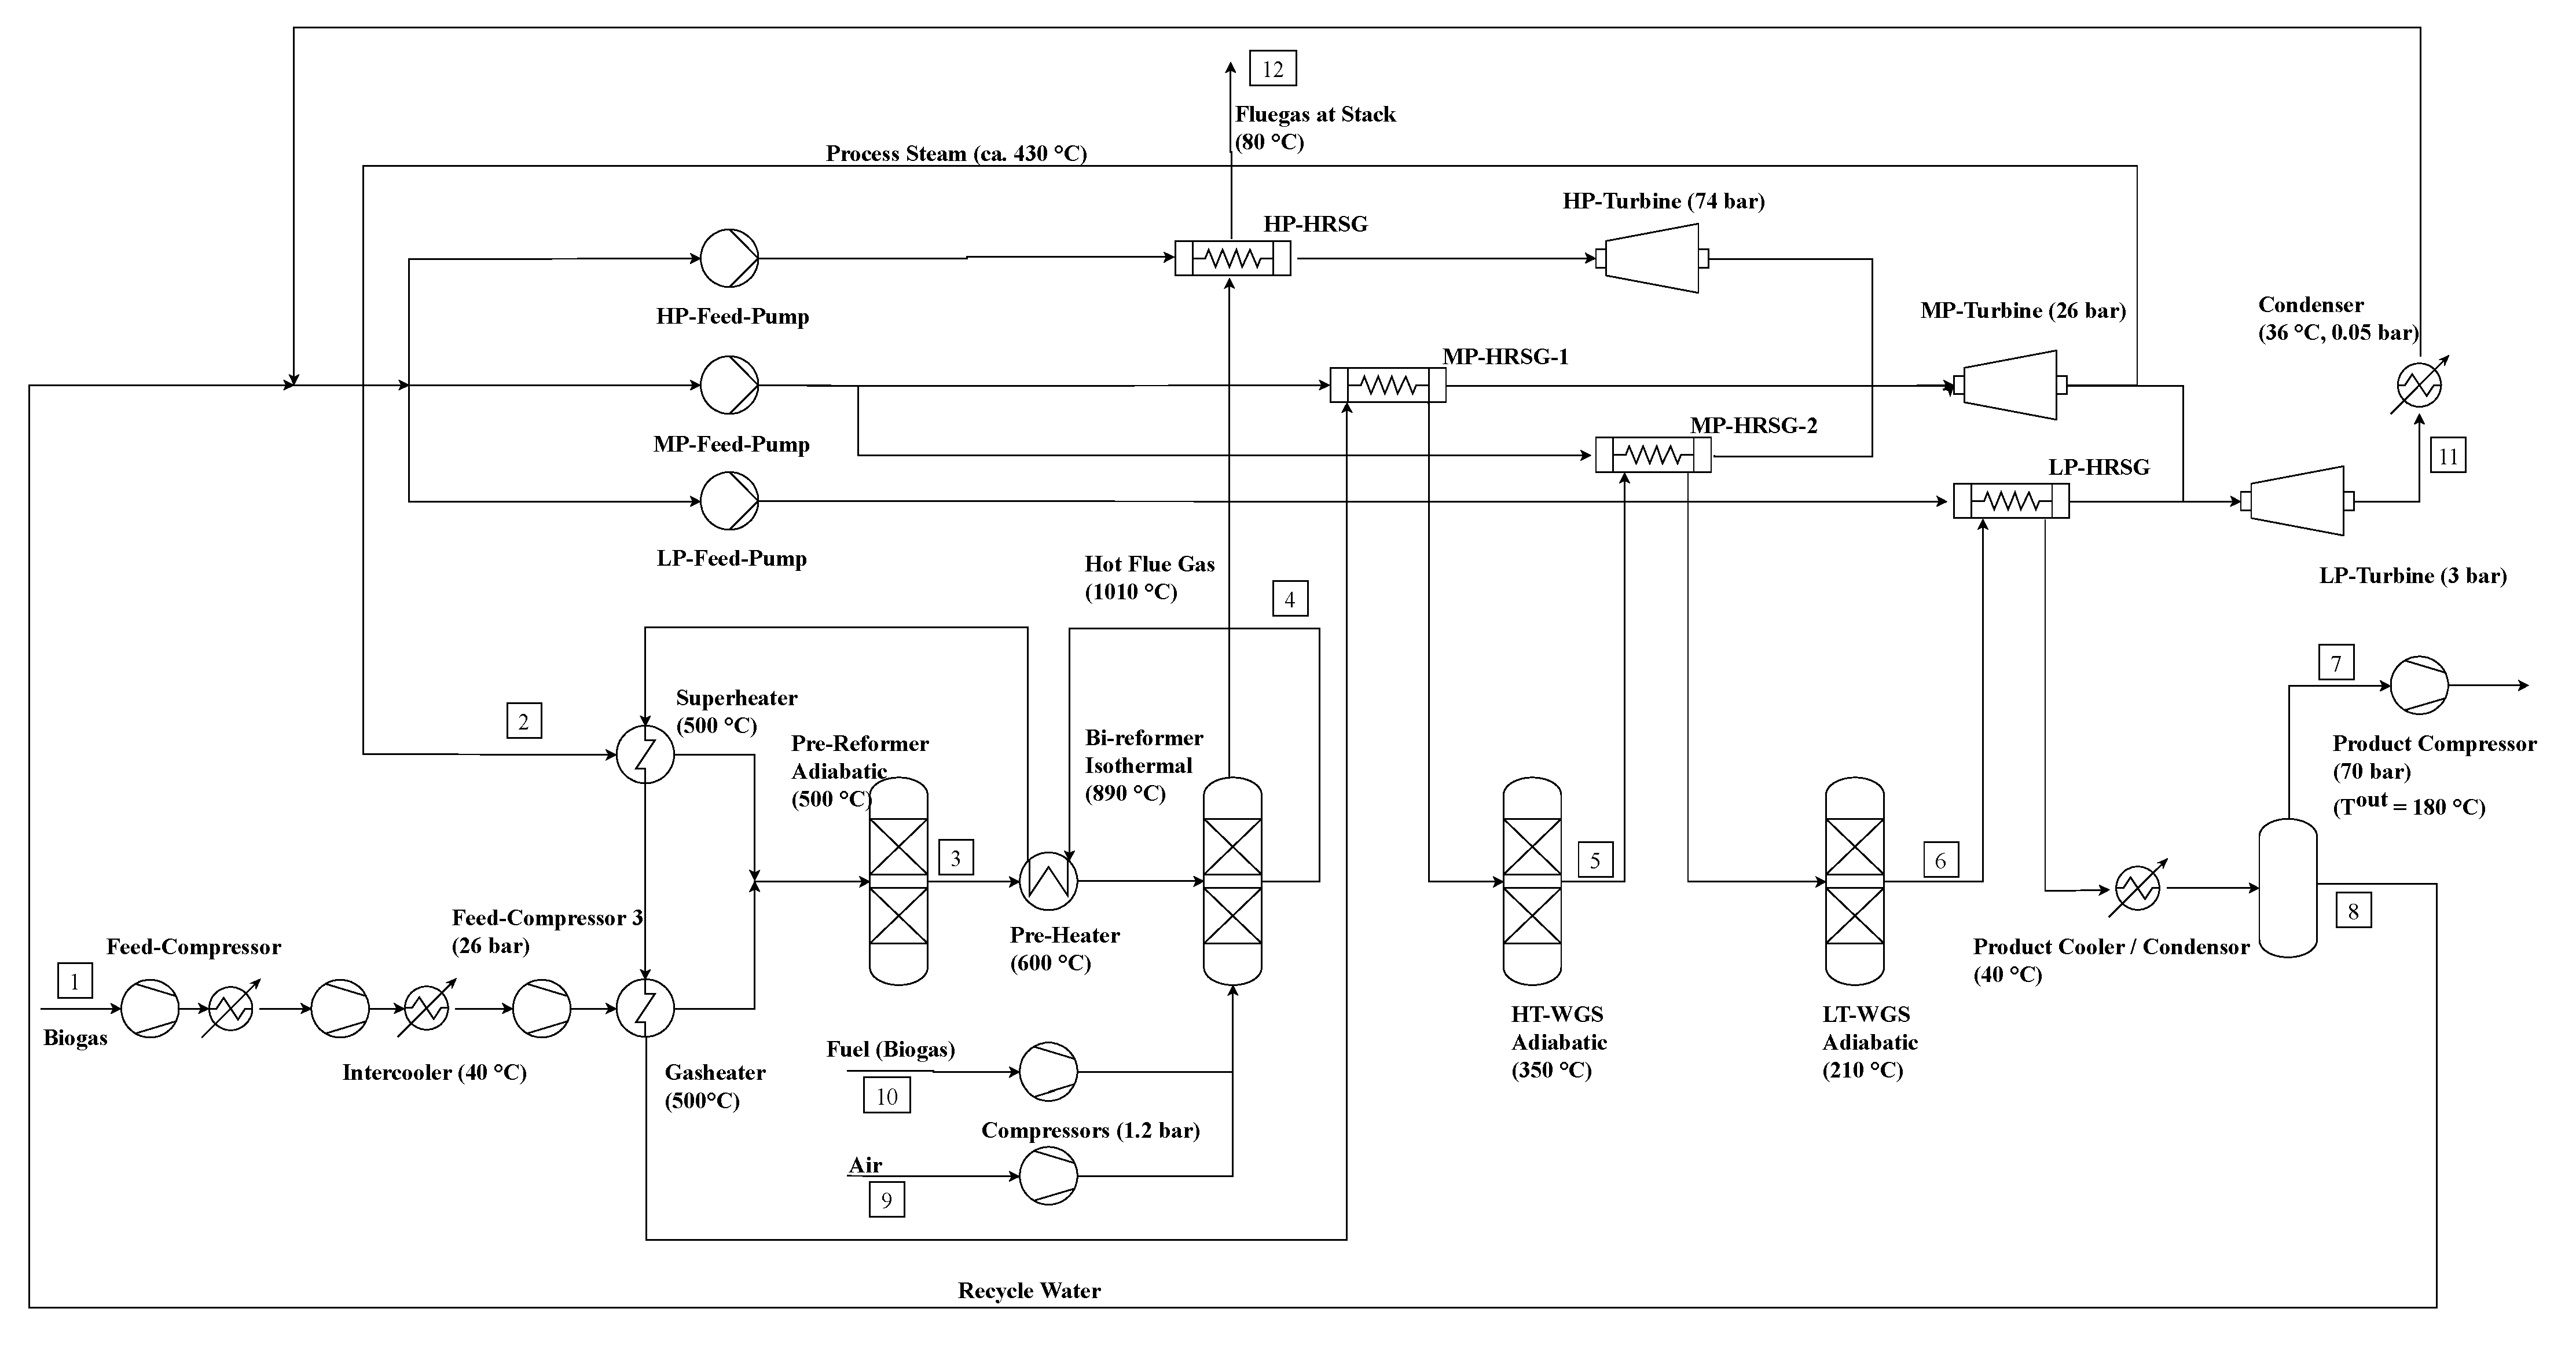
3.3. Process Design and Modeling of BIR
The design of the bi-reforming process is based on the SMR process. In the literature, standard temperatures and pressures of 800–860 °C and 6–16 bars are presented [
9,
11,
15]. However, pressures of 16 bar are too low to achieve the targeted design with a single-stage product compression. Therefore, the reforming pressure is adjusted to 25.1 bar, which is equal to SMR and ATR pressure. As a result of the elevated pressure, the temperature as well as the S/C ratio must be increased in order to guarantee a minimum CH
4 conversion of 95%. The maximum temperature values described in the literature correspond to 1000 °C, although a more conservative approach is taken here with T = 890 °C (SMR Basis). The ratio of steam and CH
4 is set to 5, based on the SMR process. Together with the CO
2 from the biogas, the S/C is 3.25. U-values are calculated using the same approach as in the SMR process, while all the remaining parameters are taken from the SMR case.
Figure 5 shows the process flow diagram of the bi-reforming process.
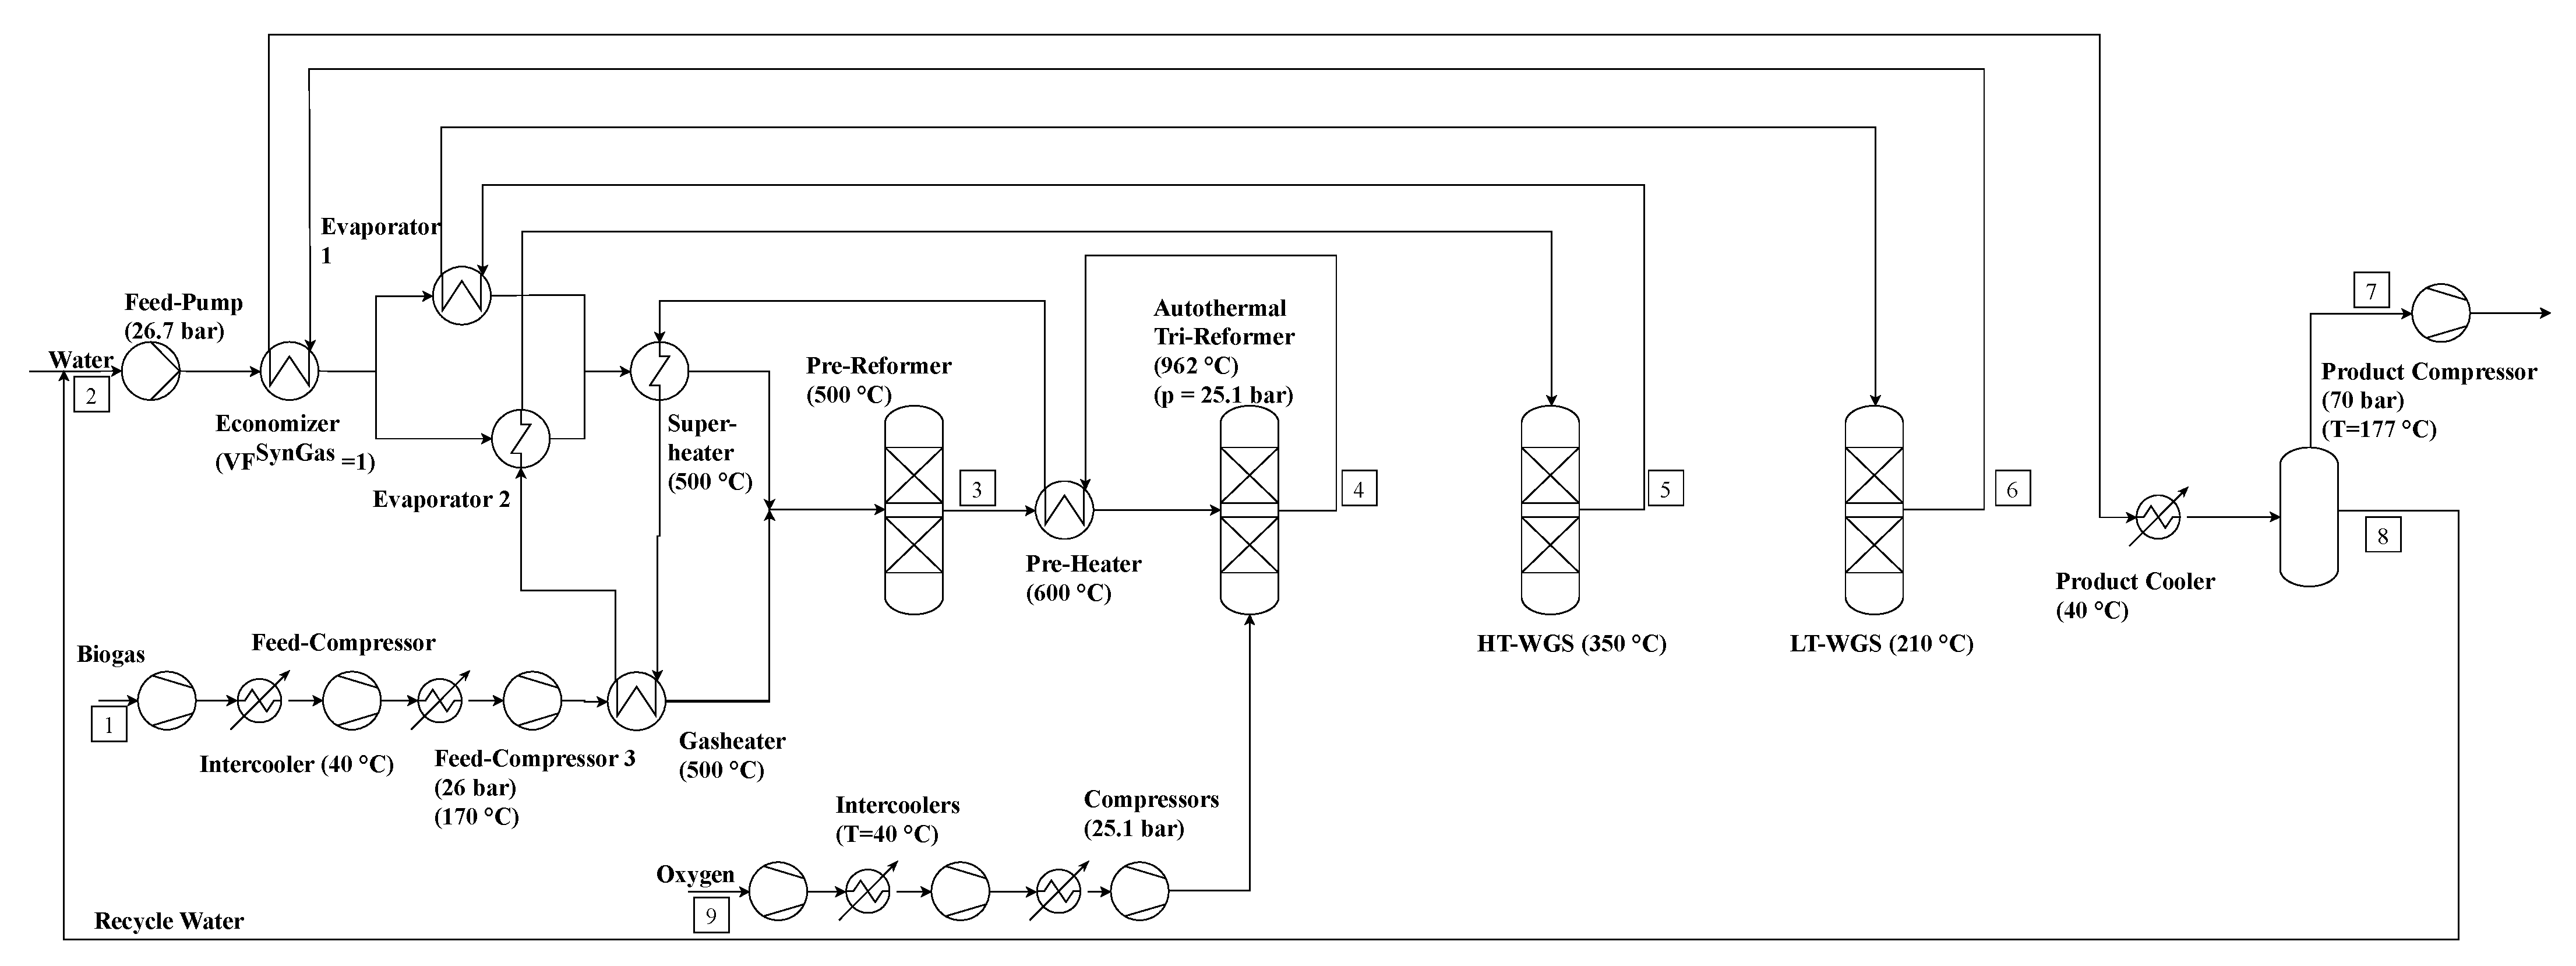
3.4. Process Design and Modeling of TRIR
The TRIR process is modeled based on the autothermal reformer system. The design is also constrained by the three design principles defined for the ATR mentioned in Chapter 3.2. The S/C and O
2/C ratios are designed in order to achieve high CH
4 conversion, while supplying all the required heat internally. The operating pressure of the reformer is once again limited by the product compressor outlet temperature. The final design specifies a reformer outlet temperature of 962 °C and CH
4/H
2O/O
2 ratio of 0.65/1.63/0.39. Due to a similar heat exchanger network design, U-values are identical to the ATR case, as are the remaining parameters. The process flow diagram is shown in
Figure 6.
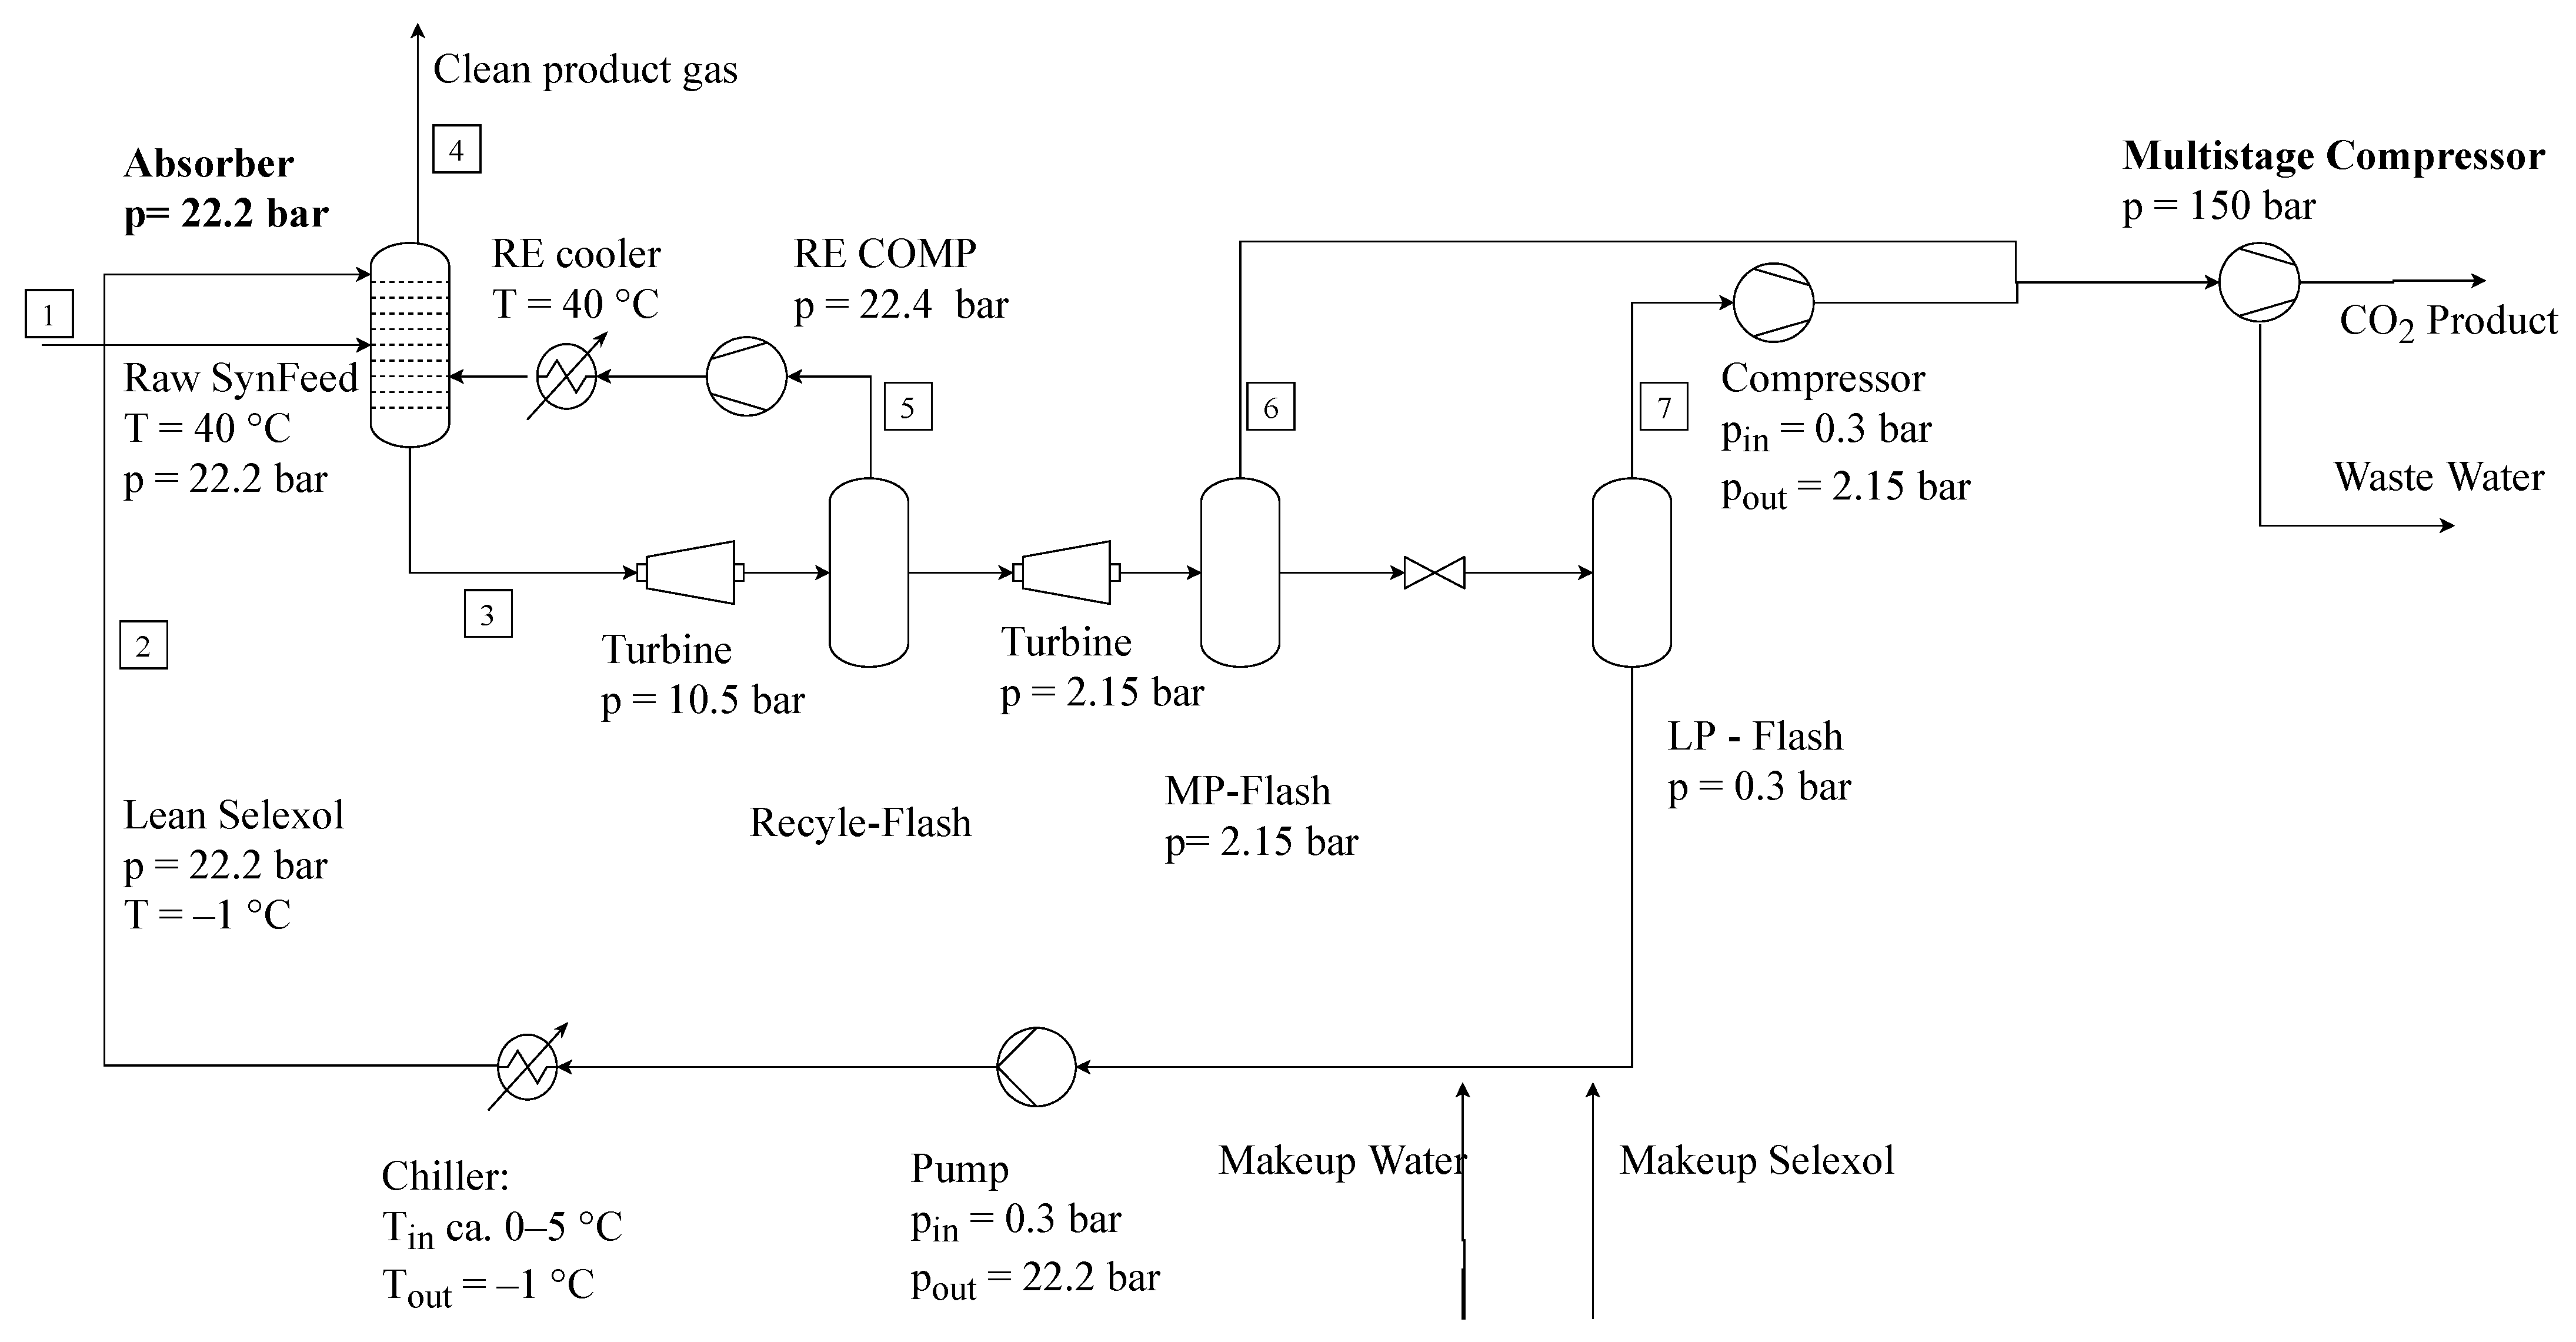
3.5. Process Design and Modeling of Selexol Process
The process design of a single-stage Selexol CO
2 capture process is depicted in
Figure 7. The cooled product gas from the steam reforming unit enters an absorber column at 40 °C and feed pressure of 22.2 bar. The absorber tower is operating at 22.2 bar. While the gas stream enters the tower at the bottom, a lean Selexol/H
2O mixture at −1 °C enters the tower at the top. The liquid and the gas pass the column in a countercurrent flow. During this process, the CO
2 and some amount of H
2 are dissolved into the solvent while releasing heat. After the capture process, the rich solvent is depressurized in a hydro-turbine to 10.5 bar and then flashed adiabatically. The resulting gaseous stream is recompressed to 22.2 bar, cooled down to 40 °C and consequently recycled back to the absorption column bottom. This is done in order to recycle most of the captured H
2. The goal is to produce a high concentration of CO
2 and H
2, hence capturing H
2 along with CO
2 is undesirable.
After H2 recycling, the remaining rich solvent is depressurized in two steps to 2.15 bar and 0.3 bar. The first step is performed by a turbine; the second step by a valve and vacuum pumps. The cleaned solvent is mixed with make-up water and Selexol to account for losses in degassing. Afterwards, it is pumped to feed pressure and cooled to feed temperature by a chilling unit. The degassed CO2 flows are compressed and mixed consecutively. The resulting raw CO2 stream is available at 1.95 bar and 40 °C. These settings are tailored for use in algae cultivation or, rather, algae-based biorefineries. To provide additional information and to be able to compare CO2 capture costs with other process concepts investigated in the literature, a subsequent compression to 150 bar was implemented (e.g., for transportation or storage). This compression is achieved using a multistage compressor with three compression units, intermediate cooling to 40 °C and subsequent condensate separation.
The carbon capture process is designed individually for all four types of biogas reformers. Due to the different H
2/CO
2 ratios, the amount of solvent required per ton of input gas, as well as the make-up Selexol and water requirements, vary. Common to all four cases is a CO
2 capture rate of 90%.
Table 5 shows the key modeling parameters of the Selexol process.
4. Results
In the following, the results of the simulations are presented. First, the process performance indicators for all processes, namely the SMR, ATR, BIR, TRIR and Selexol processes, are shown. These indicators include purchase equipment costs, utility and raw material demand, as well as inlet and outlet flow rates and compositions. Provision of these data enables other scientist to reproduce and investigate biogas reforming processes customized to their own set of background data (e.g., utility costs, operating hours etc.). After the presentation of process performance indicators, a techno-economic assessment is performed to present the net production costs of the SynFeed, as well as the carbon capture costs of CO2. The reforming systems are customized to the German energy system. Finally, a sensitivity analysis is presented, and the results are discussed in terms of an integrated biorefinery concept.
4.1. Process Performance Indicators of Biogas Reforming
4.1.1. Stream Characteristics
The product compositions of the different reforming technologies are presented in
Table 6. The mass flows of all the concepts are in the scale of 47–50 t/h. The H
2 output ranges from 3.5 t/h (TRIR) to 7.6 t/h (SMR), which corresponds to 40,000 to 80,000 Nm
3/h and depicts conventional reforming capacities. A detailed stream table can be found in
Appendix E.
Steam reforming processes achieve superstoichiometric H2/CO2 ratios of around 4, while the ATR process reaches slightly under the stoichiometric ration of 2.8. Biogas reforming systems show the lowest ratios of 2.5 and 1.8 for BIR and TRIR, respectively. These results show that SMR would need additional CO2 (or H2 separation) for utilization in methanol synthesis, while all the other processes would require additional H2 (or CO2 separation). While H2 concentration varies from 63.6 mol.-% (TRIR) to 78.8 mol.-% (SMR5), CO2 content varies from 19 mol.-% (SMR3.5) to 35 mol.-% (TRIR). This variation also indicates different behavior during the process of possible CO2 capture using Selexol.
The rate of conversion of CH4 is lowest for the SMR3.5, at 89%. SMR5 and BIR result in a higher rate of conversion at around 95%, while autothermal reforming processes (ATR and TRIR) show nearly complete CH4 conversion at 99%. Resulting CH4 impurities in the product gas are measured at 2 mol.-% for SMR3.5, while other designs are at mol-1% or lower. CO impurities are measured at below 1 mol.-% for all processes, with the steam reforming processes having the lowest levels.
Process concepts based on steam reforming require external burners for their heat supply. The hot flue gas is used for heat recovery and electricity generation. In the end, the flue gas is vented at around 80 °C into the environment. A detailed stream table for the flue gases which were produced is shown in
Appendix E. Conventional SMR processes produce slightly more flue gas than biogas reforming systems due to the different S/C ratio. Because the BIR process uses biogas, and therefore less CH
4 in the feed, the amount of steam required is also diminished, resulting in less demand for heat and combustion energy. The CO
2 concentrations of the flue gases are around 13 to 19 mass.-%. If the potential of carbon recycling is considered, CO
2 could be captured by well-known processes such as chemical absorption using MEA.
4.1.2. Purchase Equipment Costs
Table 7 lists the calculated purchase equipment costs of the different process designs. Since the product gas compressor to 70 bar is only required if the raw SynFeed is directly fed to the methanol synthesis, the corresponding costs are represented separately. The reformer, as well as the dual water-gas-shift reactor, are calculated using values drawn from the literature and given in
Table 8. Base flow rates (FBase), costs (CBase) and sizing exponents (fs) for reference plants are given. The approach is based on economies of scale, as shown in Equation (9) with year-dependent chemical engineering plant indices CECPI [
33,
34]. The compressor and balance of plant (BOP), including heat exchangers, pumps, turbines and flash evaporators, are derived from the Aspen Economic Analyzer tool. Equipment for steam reforming technologies (SMR/BIR) are more expensive than that of autothermal systems (ATR/TRIR) because they incorporate a more complex heat recovery system.
4.1.3. Utility and Raw Material Demands
Table 9 lists the major utility and raw material demands. The electricity demand is highly dependent on the process concept. Steam reforming concepts (SMR/BIR) are electricity producers, whereas autothermal concepts (ATR/TRIR) are designed for solely self-support and therefore do not produce electricity. The electric load of the product compressor is highest for SMR, followed by ATR and BIR. The lowest electric load is required by the TRIR process. This is explained by the H
2/CO
2 ratio in the product gas. With an increasing ratio, the electric load increases due to a higher effort being required for H
2 compression compared to CO
2 compression. ATR and TRIR are autothermal units and therefore no heat supply is calculated. SMR and BIR use additional fuel to supply 74 and 51 MW of heat respectively.
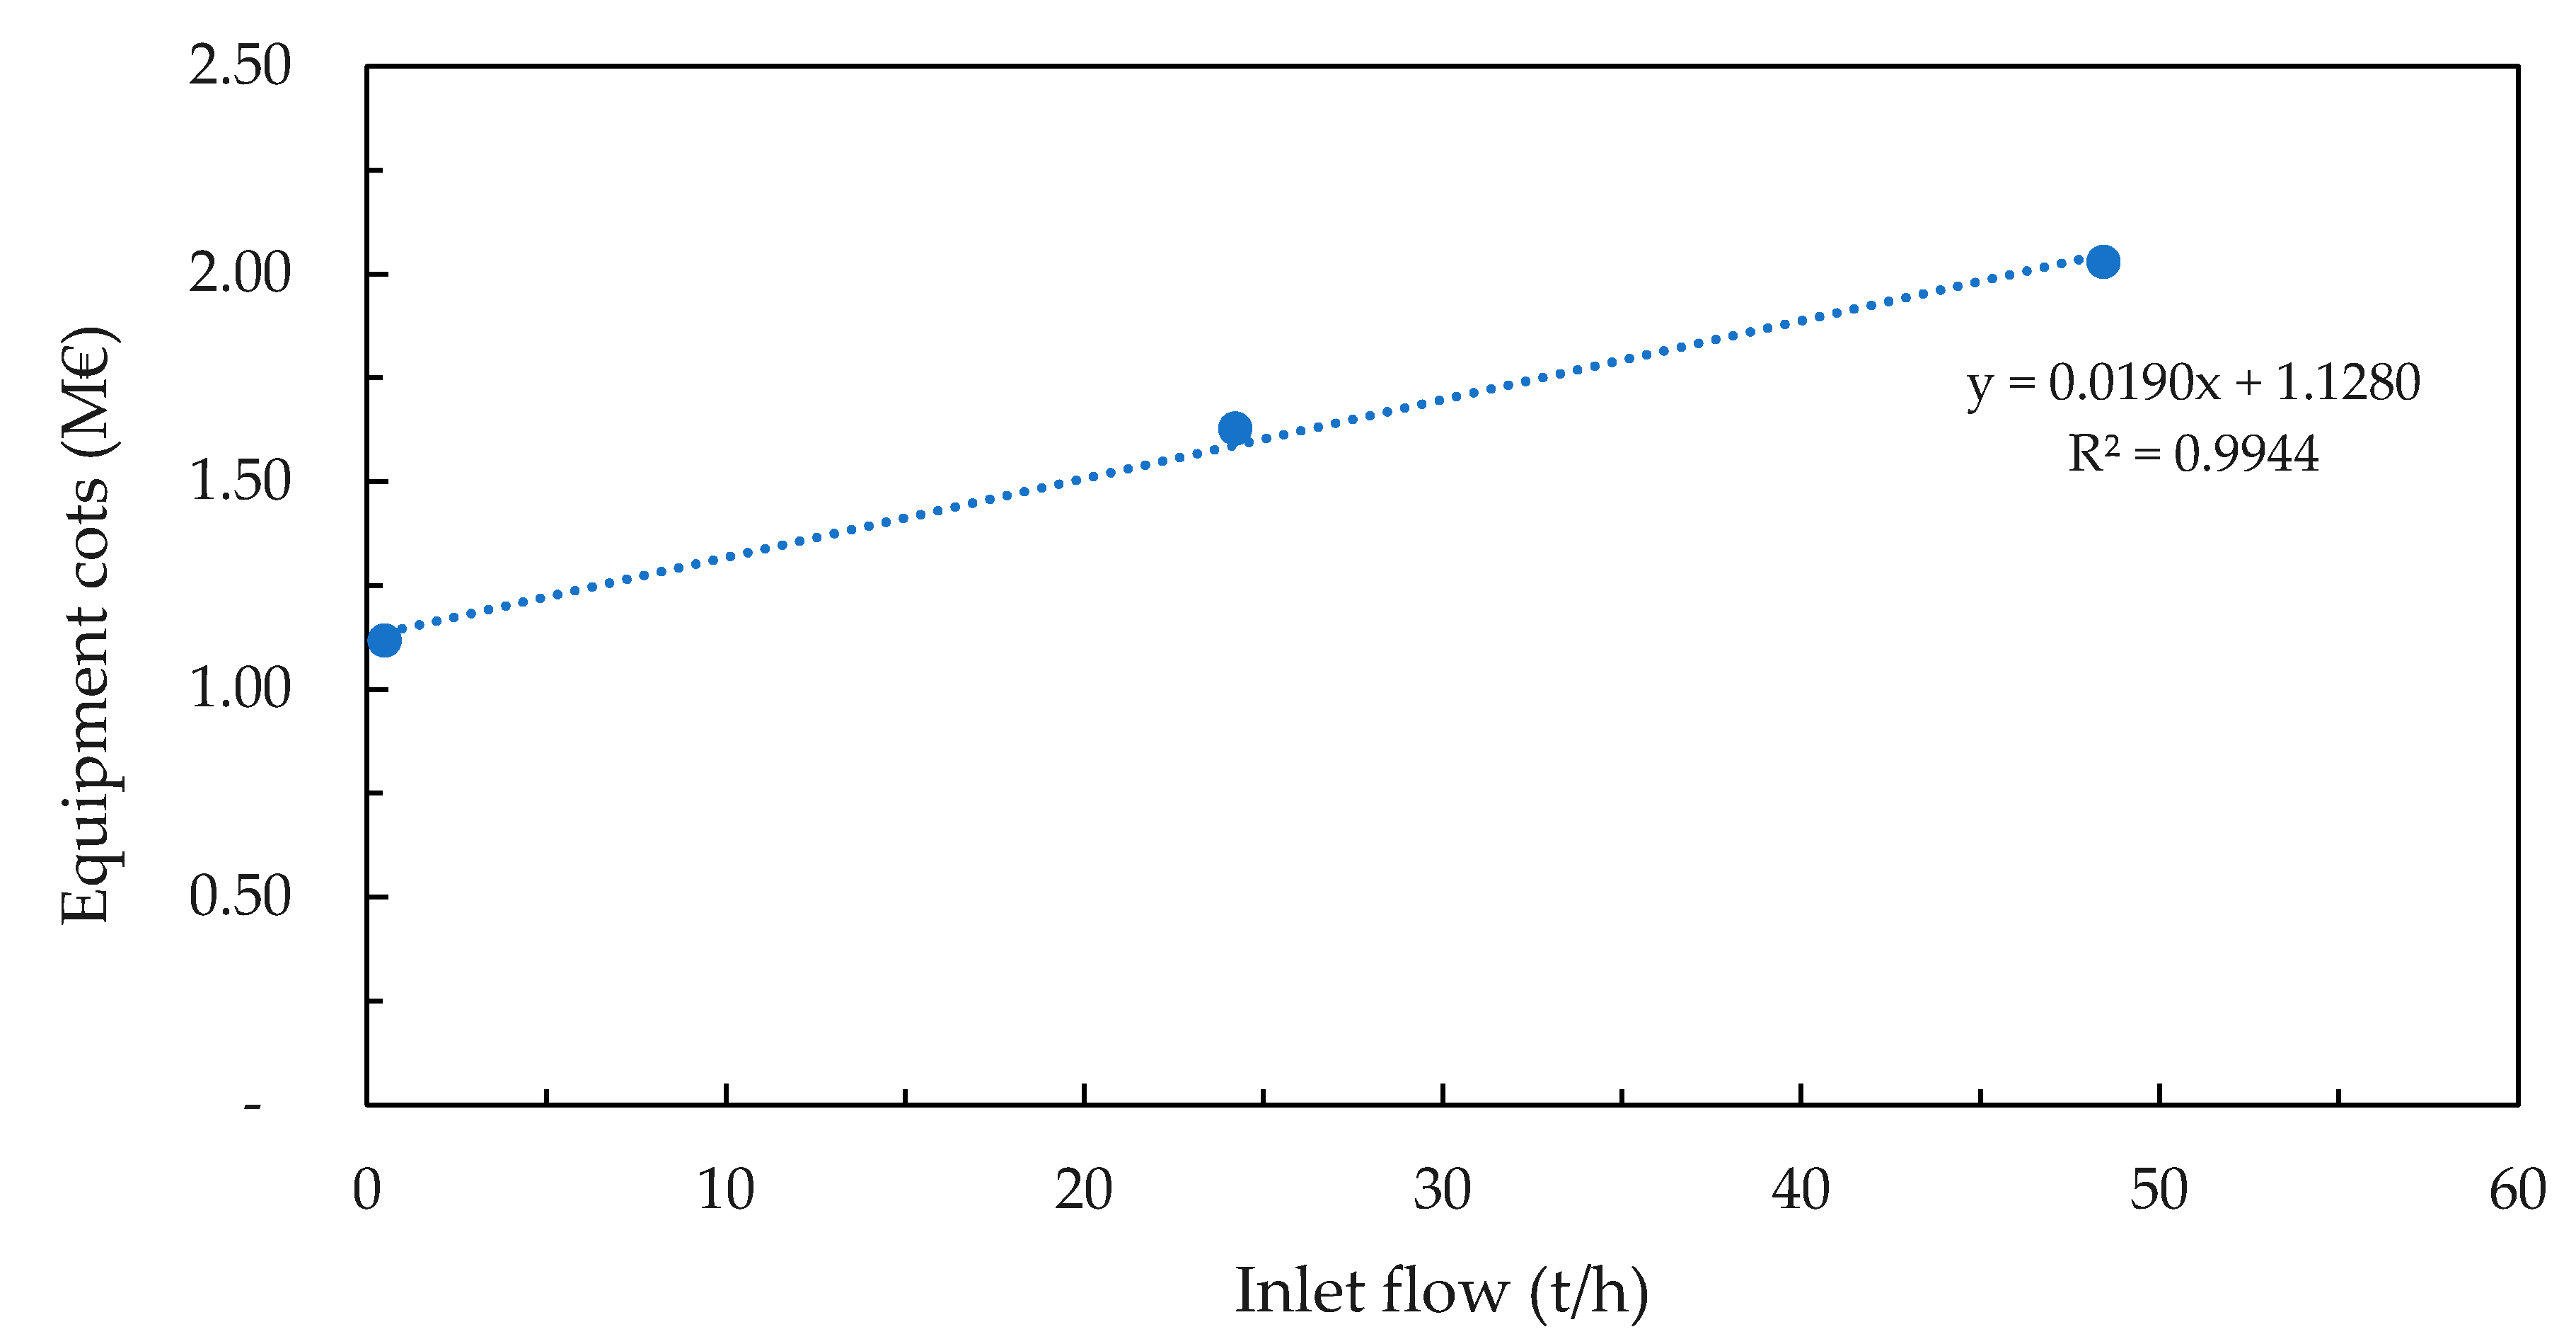
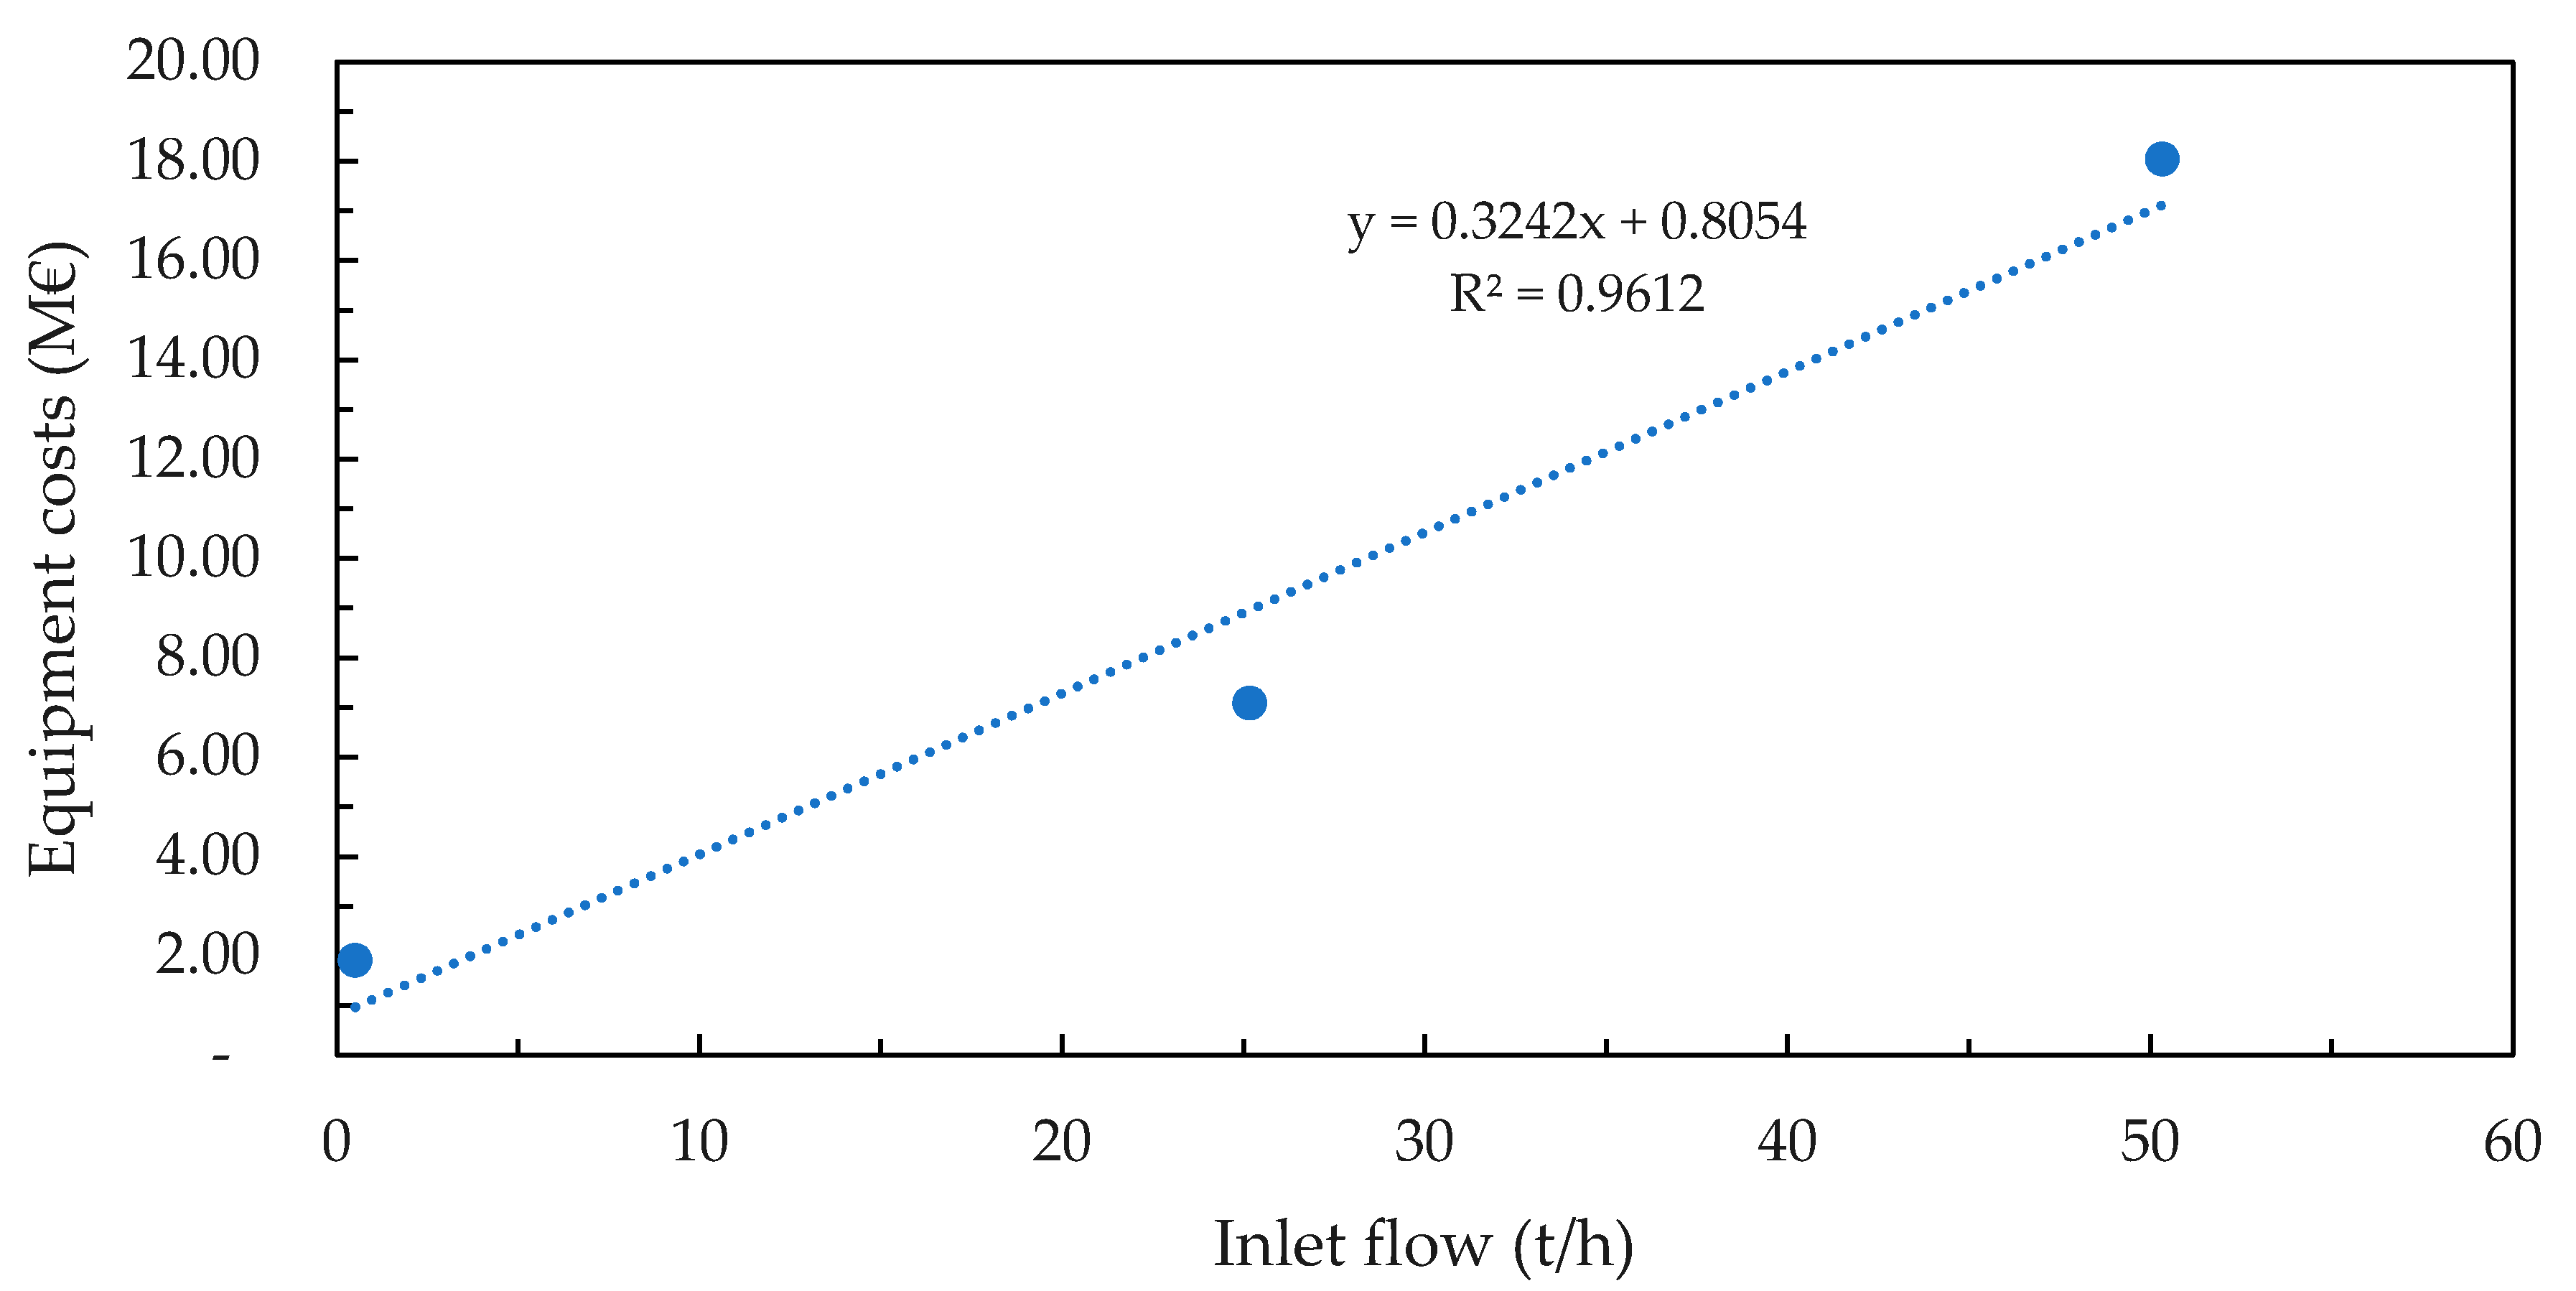
4.1.4. Economy of Scale for Reforming Technologies
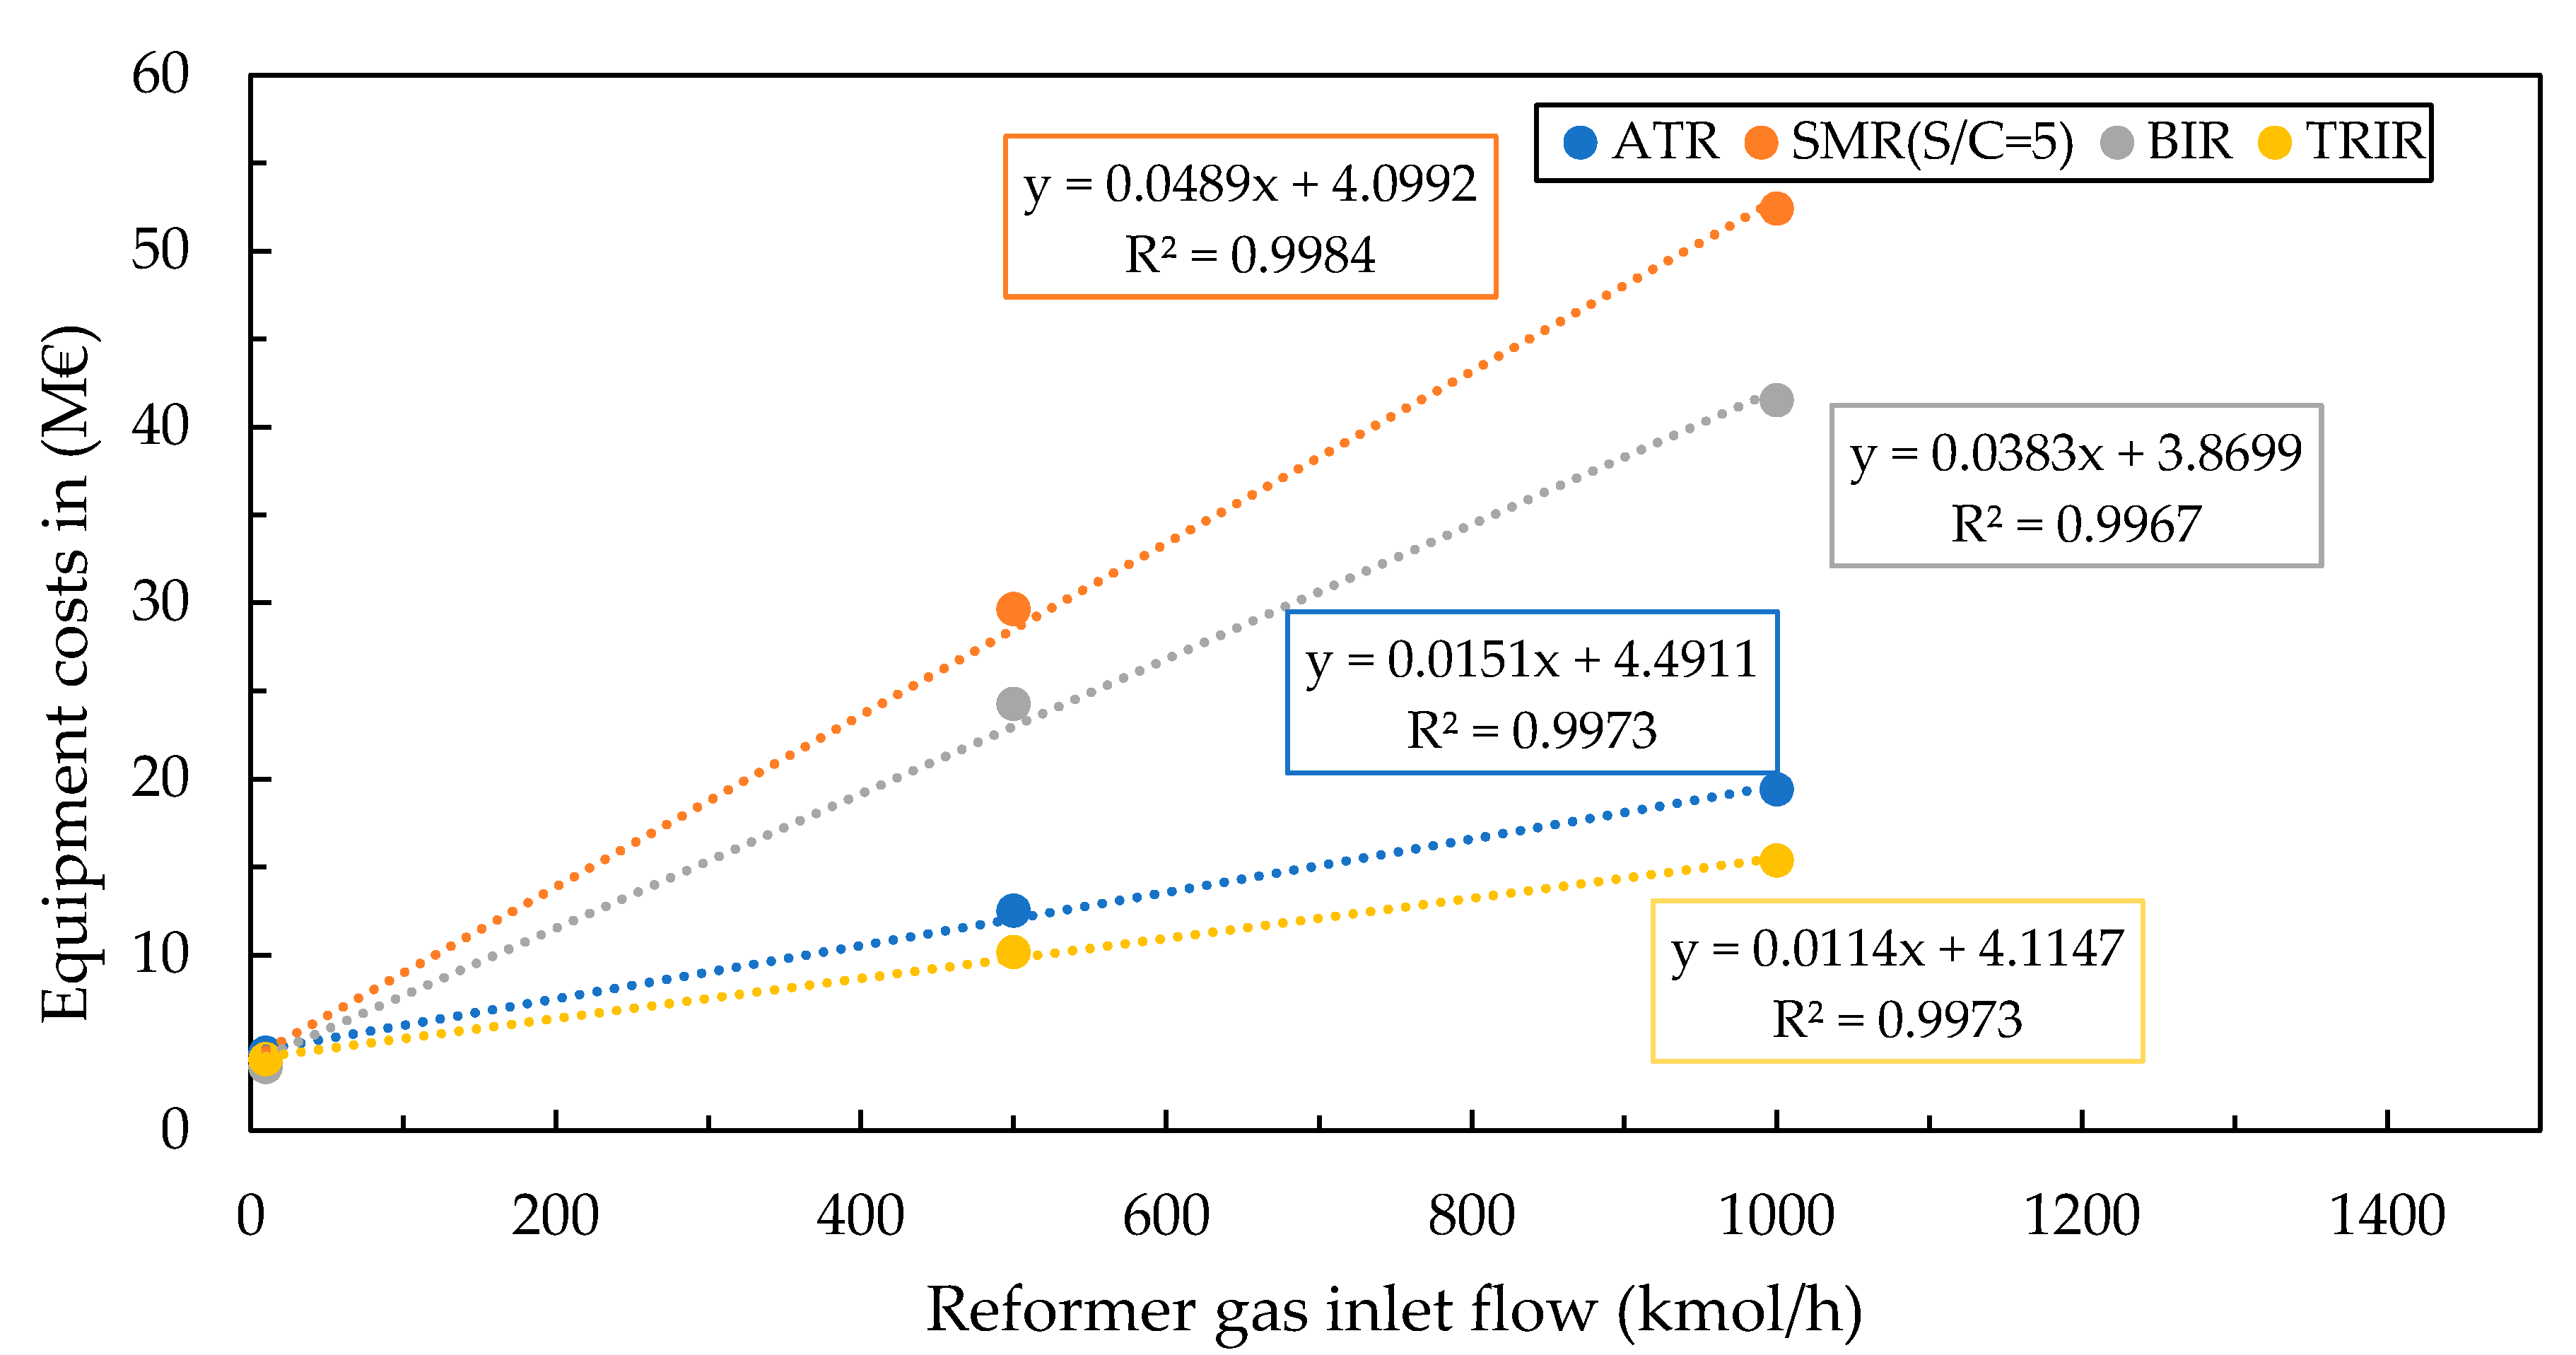
While the operating costs (e.g., electricity, water and reformer feed) are linear and dependent on the size of the plant, this is not the case for the capital costs. To gain a deeper understanding on how economies of scale affect the conversion process, two additional cases are simulated. Flow rates are modified as follows, while the remaining parameter set is kept constant:
A small-scale case with reformer input of 10 kmol/hCH4, which is equivalent to 345 Nm3/h biogas as reformer feed and about 600 Nm3/h biogas as total feed for steam reforming. This corresponds to a 2.5 MWel biogas plant;
a medium-scale case of halved capacity of 500 kmol/hCH4 reformer inlet.
Figure 8 and
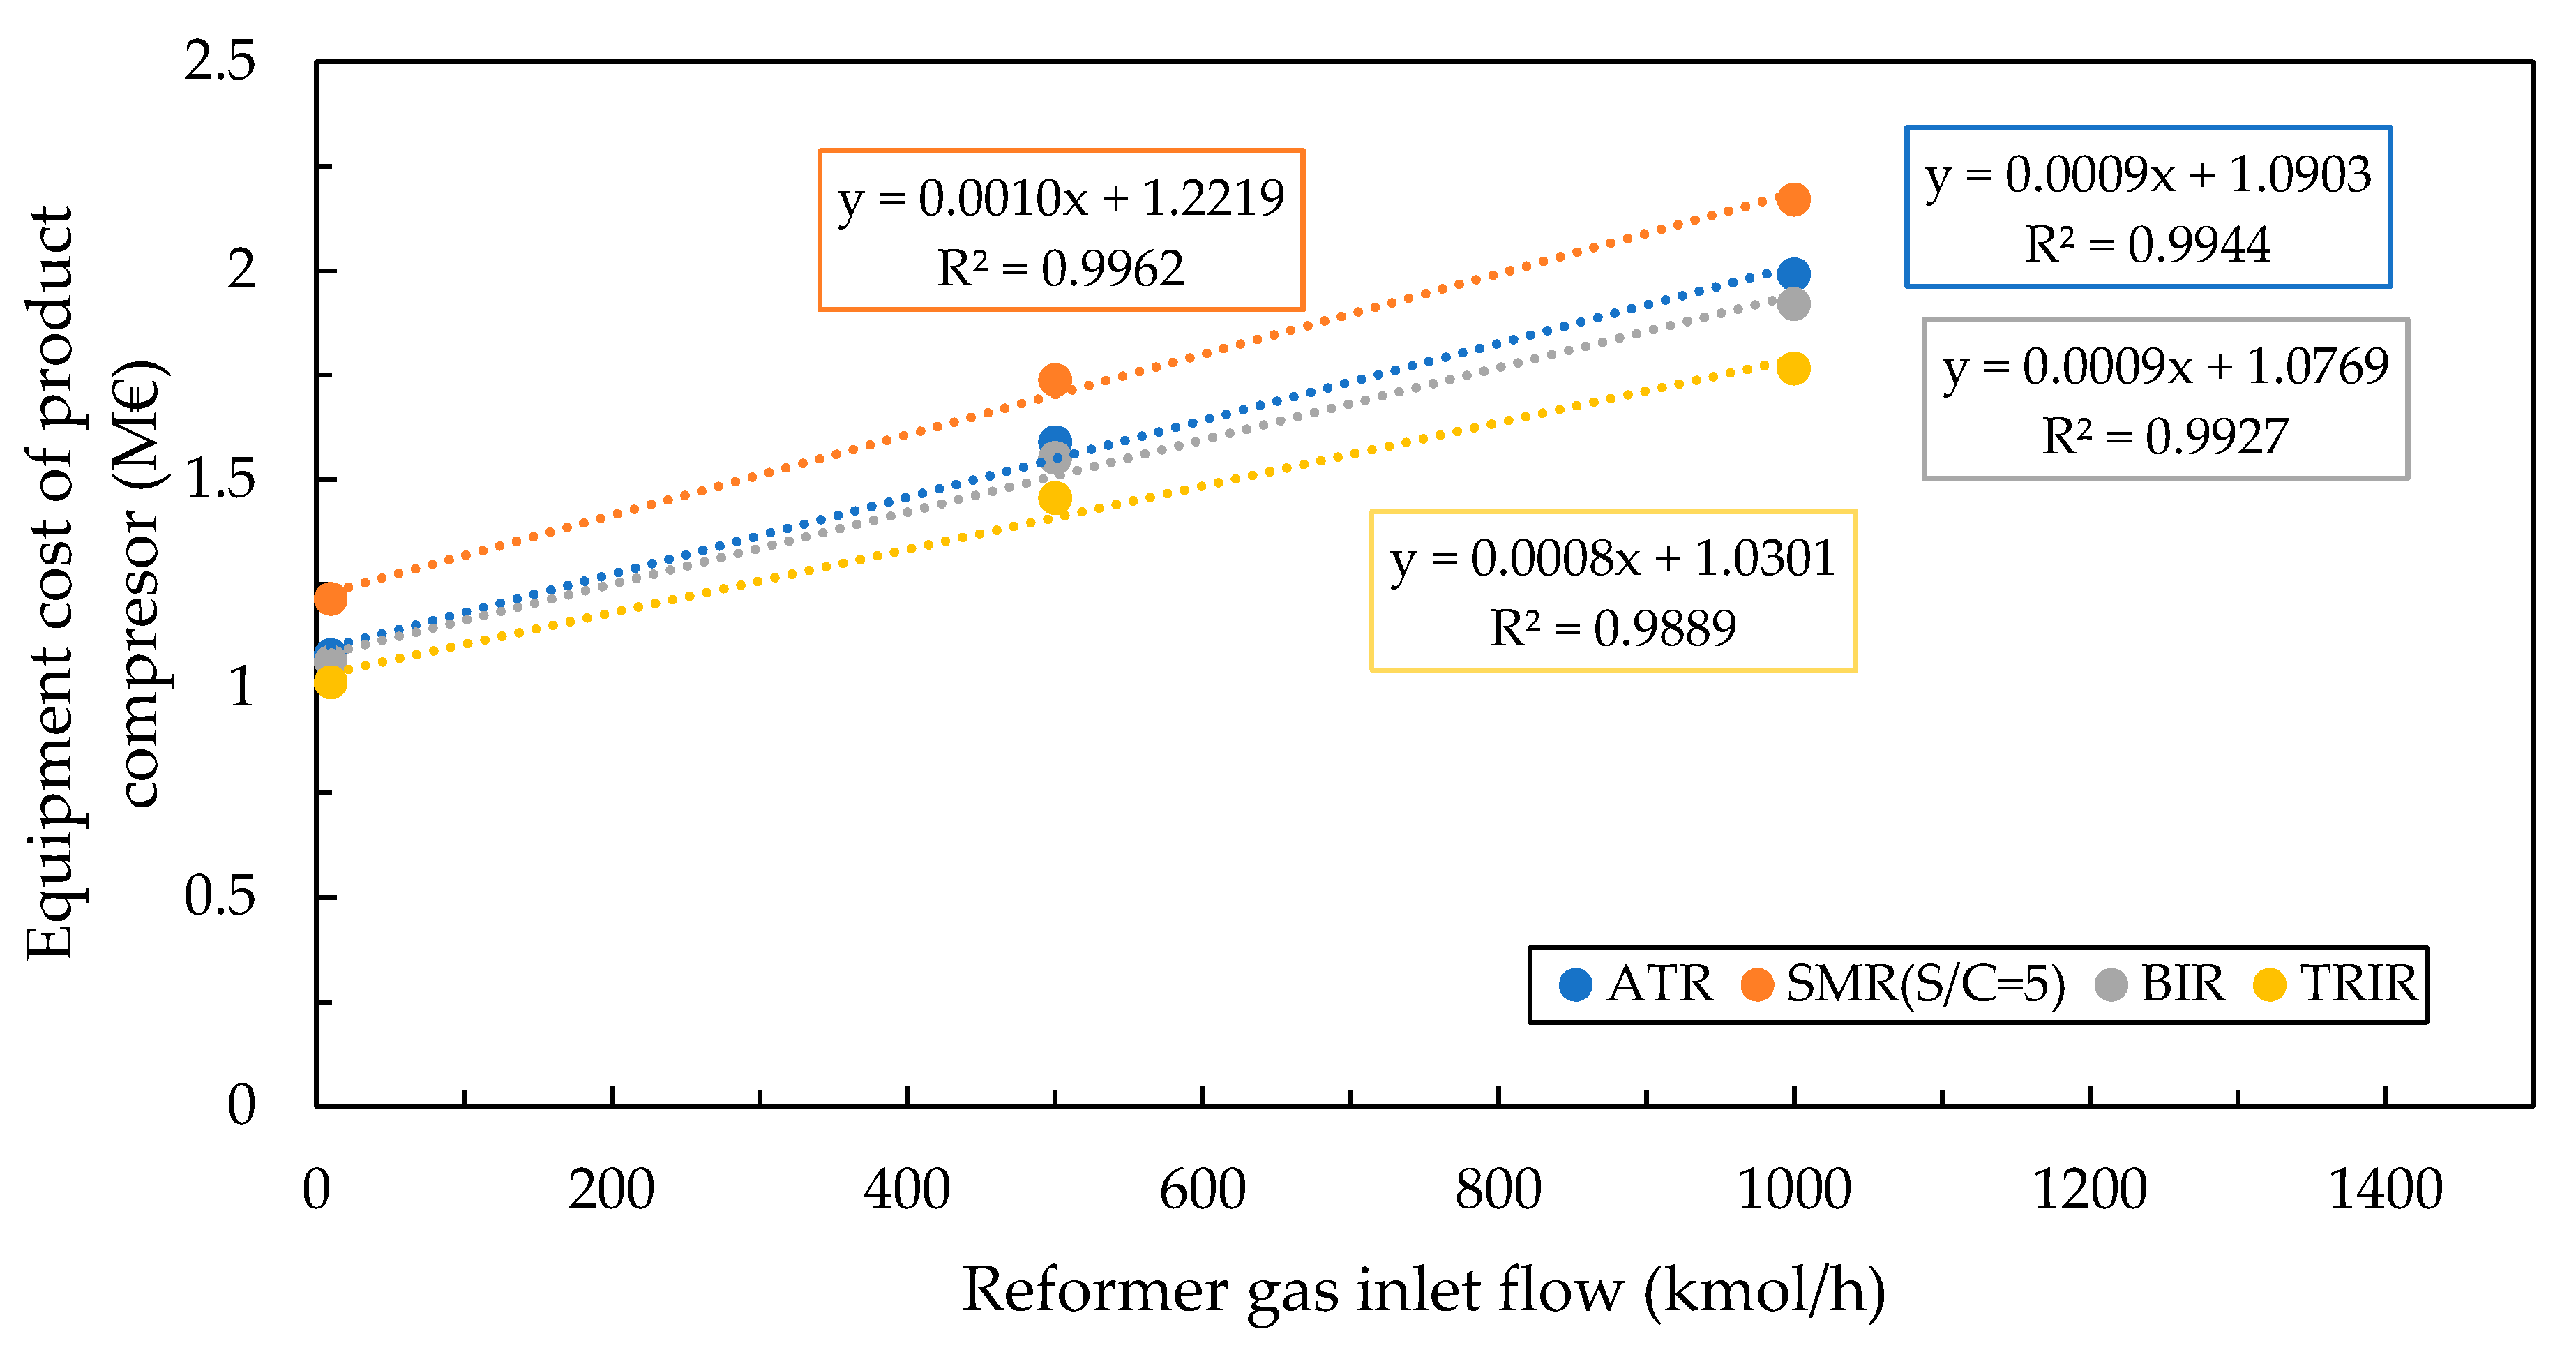
Figure 9 show the dependency of purchase equipment costs on the inlet flow rate of the different plant layouts, as well as the subsequent product compressor providing compression from 22.2 bar to 70 bar. Often, equipment costs are described by power laws for small capacity changes. However, due to the large capacity range in this context, the equipment costs are instead represented by a linear expression. Even though linear capital cost functions are less detailed then power laws, they are of interest for the purpose of simple costing over large capacity ranges. As can be observed in
Figure 8, the equipment costs of the allothermal steam reforming systems are higher and also have a steeper rise of cost escalation. This effect is due to the requirement for turbines and large waste heat recovery units. For very small capacities of around 10 kmol/h gas input, this effect is preserved, however the costs are nearly equal, indicating a trade-off point at small production capacities.
The costs functions for the product compressor show, more or less, the same slope for all process designs. The reason for this is that there are similar flow rates and pressure changes in every design. However, it can be seen that the costs increase, depending on the H2 share in the product gas. This is due to the greater effort required to compress small molecules like H2 compared to larger molecules like CO2.
4.2. Process Performance Indicators of Selexol Process
4.2.1. Flow Characteristics
CO
2 capture using Selexol absorption is simulated for all the process concepts with a CO
2 recovery factor of 90%. Depending on the process (cf.
Table 10), the cleaned product gas is mostly composed of H
2 with molar shares of 93 to 96%. In industry, H
2 is often provided at ultra-high purities of 99.999%. Therefore, the product gas has to be purified further using a pressure swing adsorption to generate ultra-pure H
2at 99.999% and an offgas containing the impurities, which can then be combusted for energy production.
The raw CO
2 outlet flow from the Selexol process is provided at 1.95 bar and purities of 98 to 99 mass.-% (cf.
Table 11). It can be directly utilized, for example, in algae cultivation, or it can be further compressed and dehydrated to 150 bar for transport or storage. If compression is chosen, the purity is enhanced to 99.5 mass.-% or higher due to dehydration.
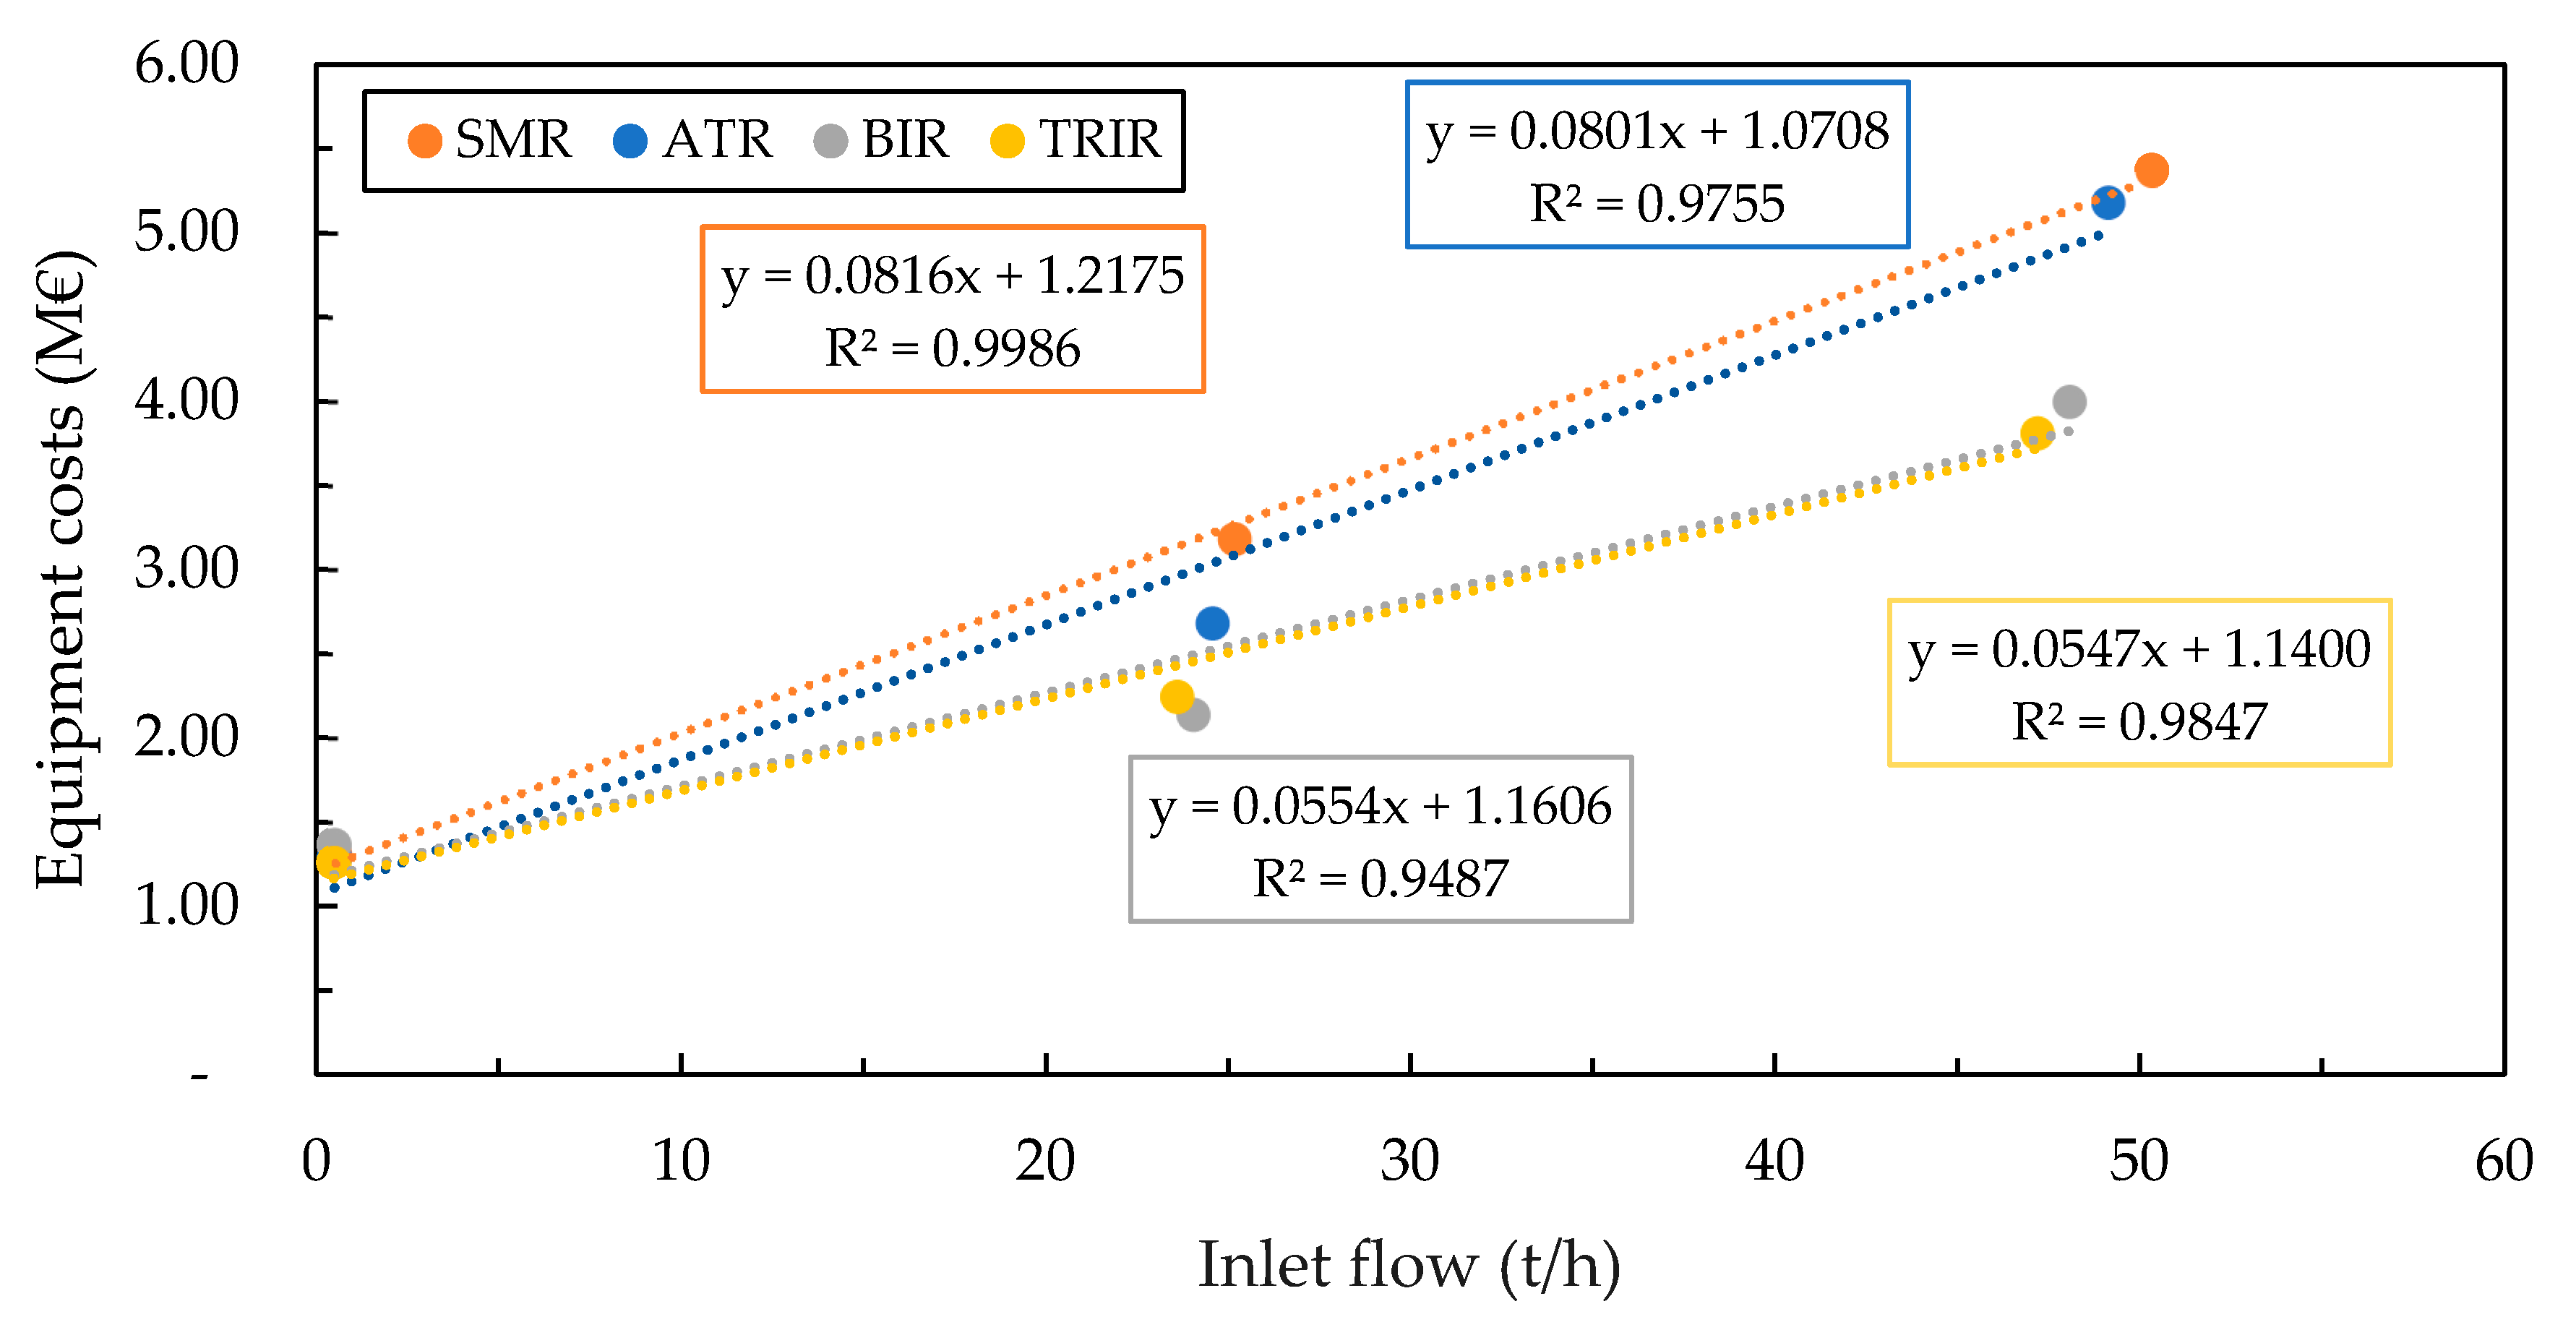
4.2.2. Equipment Costs and Economies of Scale
As with the reforming processes, two additional sizes are simulated for this process. Just as for the reformer, the capacity is once halved and once reduced by the order of one hundred.
Table 12 depicts the detailed purchase equipment costs of the Selexol process, as well as the potential CO
2 compression for the input of 1000 kmol/h in the reformer gas feed.
Figure 10 presents economy of scale graphs and functions for the different process inputs. The product gas from the SMR feed has the lowest CO
2 concentration, while product gas from the TRIR process has the highest concentration. This directly affects the equipment costs, which increase with decreasing CO
2 concentration.
4.2.3. Utility and Raw Material Demands
The Selexol process requires different utilities, such as electricity, cooling water, refrigeration to −1 °C, make-up process water and fresh Selexol. The demand for the CO
2 capture process (large capacity) is presented in
Table 13. The correlation between CO
2 concentration, utility and raw materials demand is similar to the correlation between CO
2 concentration and equipment costs. A lower CO
2 content leads to a higher demand of Selexol pump-around, which increases the demand of pumps, compressors, coolers and chillers.
Table 14 presents the demand for the optional final CO
2 compression. Here, waste water and flue gas are generated due to dehydration and the pressure release of waste streams. Waste water is nearly completely (99.9%) composed of water, while flue gas is made up to 96% of CO
2.
4.3. Techno-Economic Analysis
For the techno-economic analysis, the net production costs of the produced SynFeed (H2/CO2 -rich mixture) as well as the carbon capture costs per ton of product CO2 are calculated using the following approach.
First, the purchase equipment costs EC
u of the major equipment u are obtained, based on the derived process performance indicators. Based on those raw costs, the fixed capital investment costs (FCI
u) are calculated by multiplication with a cost factor, which includes direct costs like installation, electrics, buildings, service facilities or yard improvements, as well as indirect costs, such as engineering, contractor’s fees and contingencies (ref. Equation (9)). In this work, the approach by Peters et al. [
34] is followed, which yields cost accuracy of ± 30%. The fixed capital investment is afterwards converted into annualized capital costs (ACC) by considering the capital recovery factor (CRF) based on the unit-operation lifetime (LT) and interest rate (IR) (ref. Equations (10) and (11)).
Operational costs include costs for utilities (C
UT), such as electricity, cooling water or chilling energy, as well as raw materials (C
RM), such as biogas feed or process water, and operating and maintenance costs (ref. Equation (15)). Utility ut and raw material i costs are derived by calculating their hourly demand multiplied by operating hours per year (H), as well as the specific costs per ton (of raw material) or MWh (of utility) as depicted in Equations (12) and (13). Operating and maintenance costs (C
O&M) are derived by a factor of 4% of fixed capital investment, as shown in Equation (14).
Annualized operating costs (AOC) and annualized capital costs form the total annualized costs (TAC), which are divided by the produced product (total SynFeed or captured CO
2) to calculate the net production costs (NPC) (ref. Equations (15)–(17)).
4.3.1. Economic Assumptions
General assumptions regarding the economic data are presented in
Table 15. These include plant lifetime and interest rate, as well as specific utility and raw material costs.
4.3.2. Costs of Raw SynFeed
Table 16 shows the calculated annualized operating and capital costs, total annualized costs, yearly output flow of raw SynFeed, H
2/CO
2 ratio and the net production costs per ton of raw SynFeed. A first look suggests that autothermal reforming is the most cost-efficient process and bi-reforming of raw biogas is the most expensive one. However, considering the varying H
2/CO
2 ratios, it is apparent that the quality of the raw SynFeed is different. None of the produced stream shows a molar ration 3. SMR has excess H
2, while the other process types produce SynFeed with excess CO
2. In order to improve the SynFeed in terms of methanol production and form a fair basis for comparison with SynFeed, upgrading is considered. This upgrading consists of either the capture excess CO
2 (H
2) or mixing additional H
2 (CO
2). However, in order to calculate CO
2 capture for SynFeed upgrading, the capture costs using the Selexol process have to first be investigated.
4.3.3. Carbon Capture Costs
Table 17 presents the costs of CO
2 capture using the simulated Selexol process. It is possible to utilize CO
2 at low pressures in an algae refinery. Therefore, the costs for compression to 150 bar are displayed separately. The correlations between utility demand, capital expenditures and CO
2 content in the feed gas of the Selexol process lead to the lowest carbon capture costs of 22.6 €/t for SynFeed from TRIR, if CO
2 is to be compressed to 150 bar. The highest carbon capture costs are detected for the SMR process, with 27.2 €/t. For all processes it is observed that the CO
2 compression makes up about 50–60% of the total carbon capture costs. Therefore, it would be beneficial to utilize CO
2 at low pressures on-site, reducing the carbon capture costs to 9–14 €/t. Compared to other CO
2 capture technologies, such as pressure swing adsorption or MEA capture, Selexol is identified as a cost competitive option for biogas reforming feed.
4.3.4. Cost of Adjusted SynFeed
As already indicated, the different raw SynFeed streams are not on specification for methanol synthesis in regard to their H
2/CO
2. To provide a fair comparison, the raw SynFeed is conditioned to specifications by either H
2 separation, CO
2 addition (in the case of SMR), CO
2 separation or H
2 addition (for all other cases). Additional educts are priced by costs relating to CO
2 from flue gas capture using MEA (50/
) and H
2 from water electrolysis (3500 €/
). Separation of excess CO
2 is achieved through partial CO
2 capture using the simulated Selexol process. Here, linear dependent utility and raw material demands as well as the presented economies of scale are used to calculate the additional costs of partial separation. No CO
2 compression is considered in this case. In the case of H
2 excess, H
2 separation is calculated by pressure swing adsorption based on Spallina et al. [
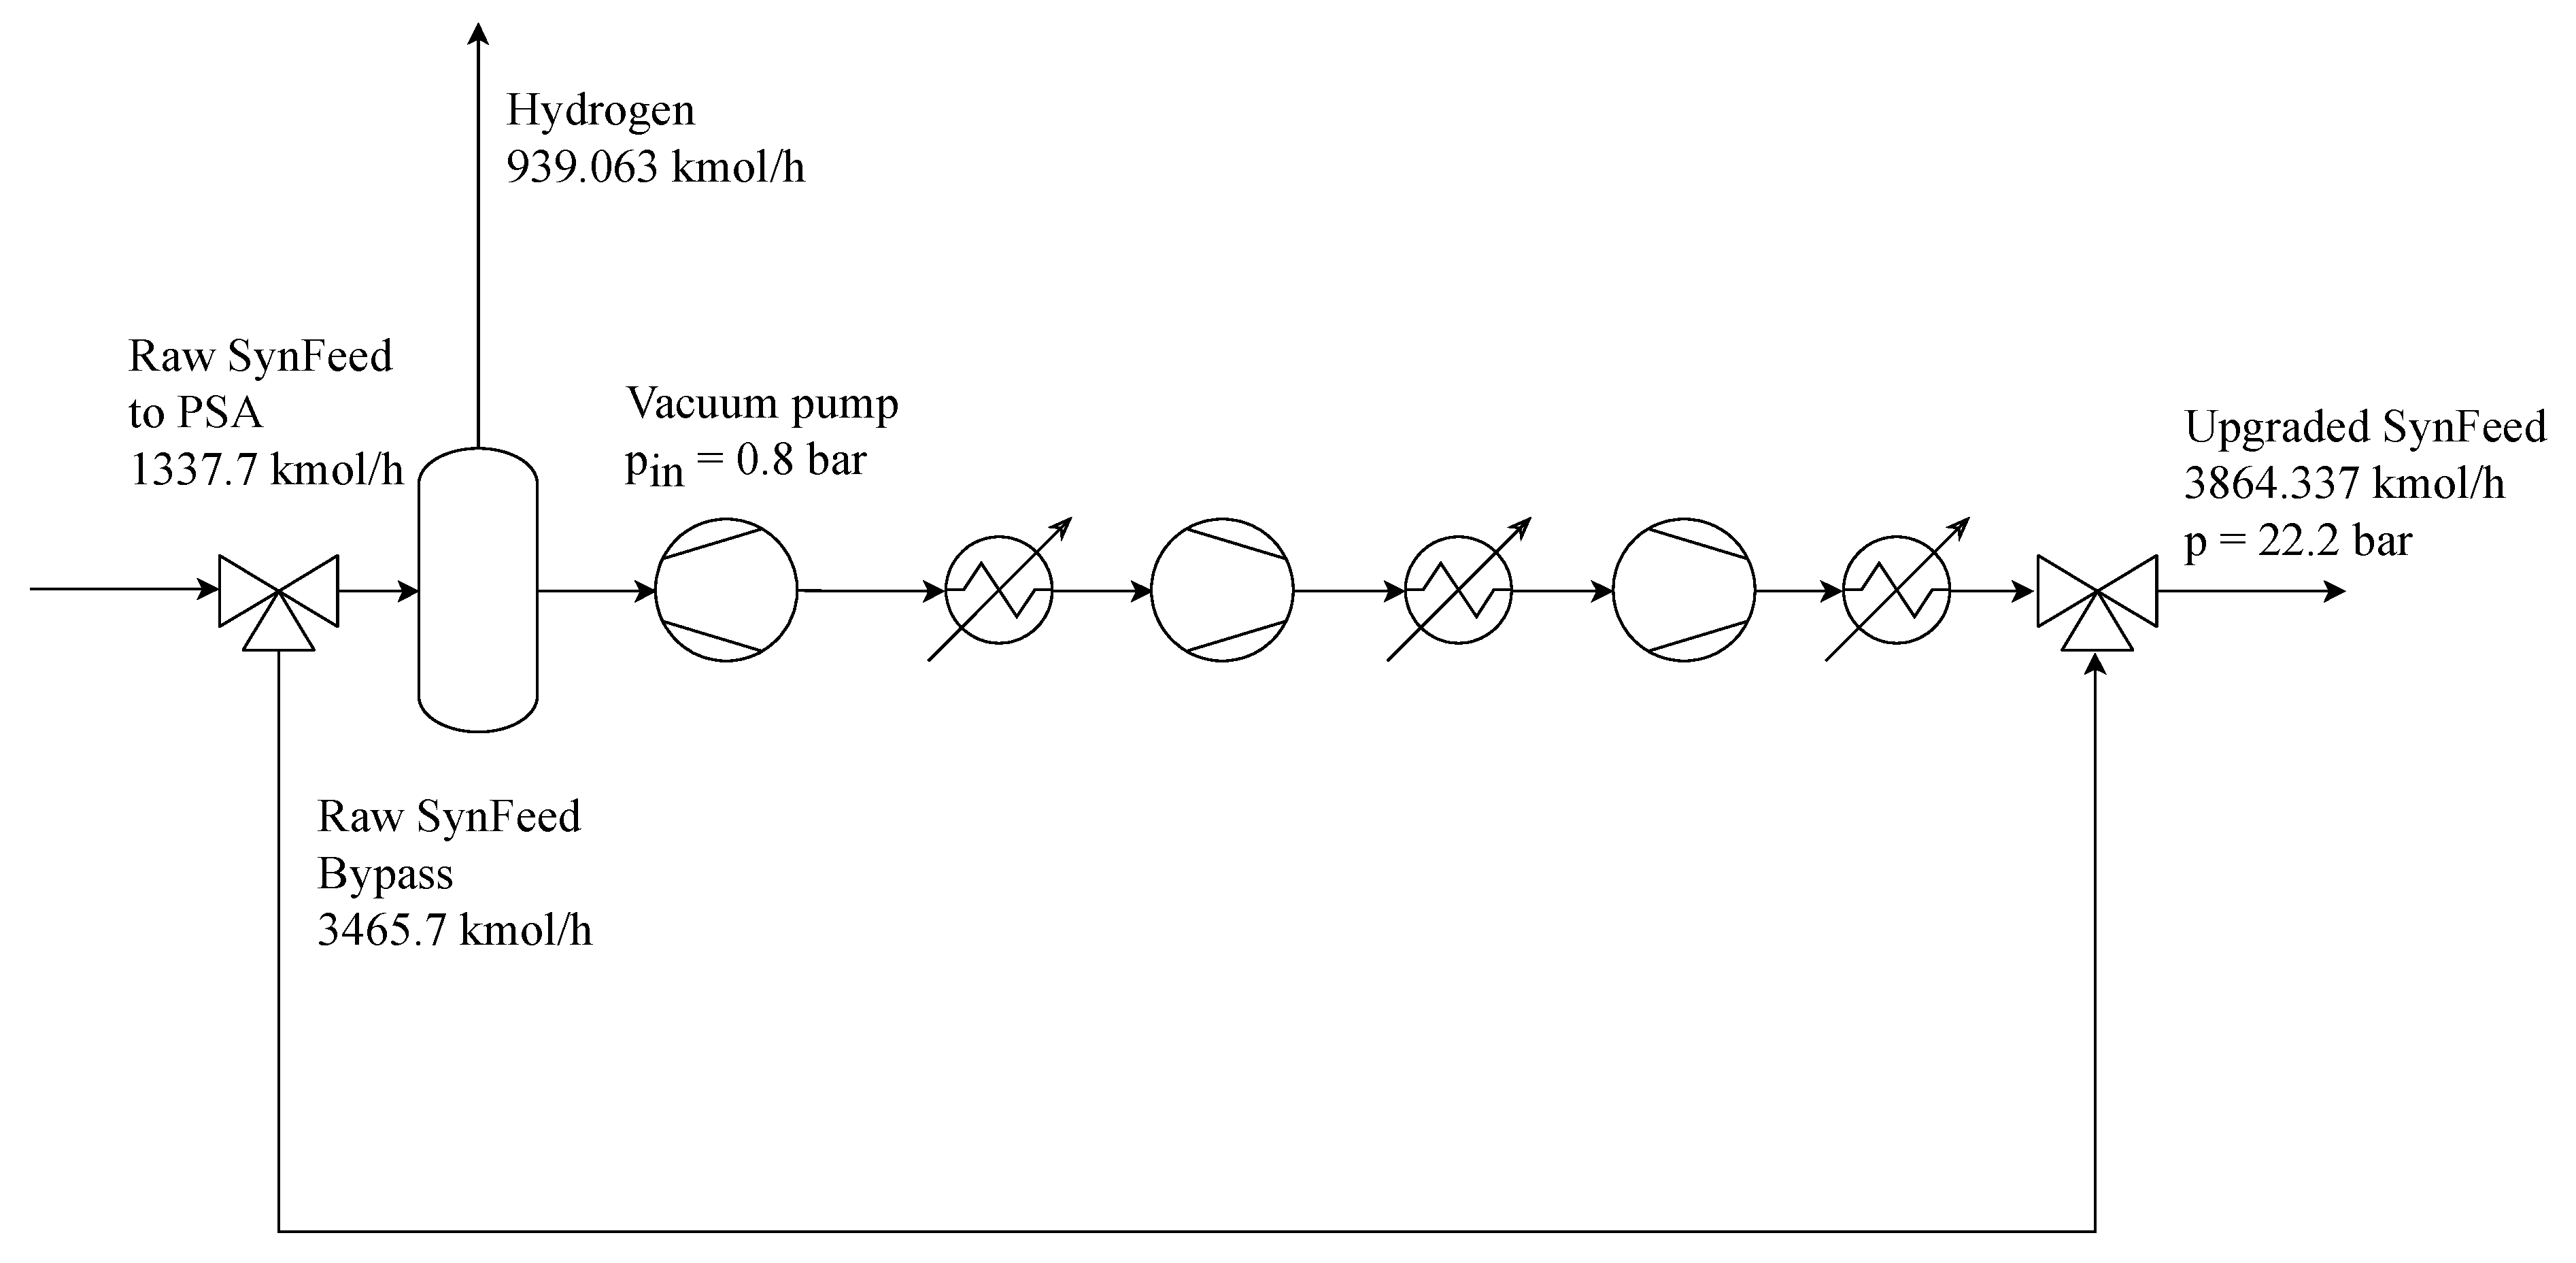
30]. Using PSA, pure H
2 is produced at feed pressures (22.2 bar), while the remaining SynFeed is depressurized to vacuum pressures. The PSA-train is simulated using Aspen Plus. Here, the PSA itself is modeled as a black-box component separator with a H
2 recovery factor of 89% (further information can be found in
Appendix C) [
30]. SynFeed is afterwards repressurized by a vacuum pump to 22.2 bar. For all conditioned SynFeed streams an additional product compressor, supplying pressurization from 22.2 bar to 70 bar, is implemented (further information can be found in
Appendix A). This way, the costs for capital expenditures and energy for the initial product compressor are adjusted to the new H
2/CO
2 ratio. In the case of separation, the byproducts (CO
2 or H
2) are assumed to be used on-site and replace additional production by either MEA carbon capture or water electrolysis, leading to additional accounted revenues.
Table 18 shows the results of the SynFeed conditioning. If byproducts can be utilized on-site, SMR is the most economical process with NPC of 142.5 €/t
SynFeed, followed by ATR with 167.7 €/t
SynFeed. However, if, for example, pure H
2 and CO
2 are not required, and it is not possible to gain revenue for these products, it is beneficial to use ATR when combined with additional CO
2 capture at NPC of 197.4 €/t
SynFeed.
If SynFeed from biogas reforming is compared to a SynFeed mixture prepared by CO
2 capture from flue gas and water electrolysis, it shows significantly lower costs of 142–438 €/t
SynFeed compared with 464 €/t
SynFeed (further information in
Appendix D). If SynFeed from biogas is compared to SynFeed from natural gas, it shows a higher cost of 142–438 €/t
SynFeed compared with 107–177 €/t
SynFeed, depending on the utilization of byproducts. Regardless of the case, it is always more economical to separate CO
2 from the raw biogas before processing, due to low purification costs of 24.2 €/
based on the values described in the literature.
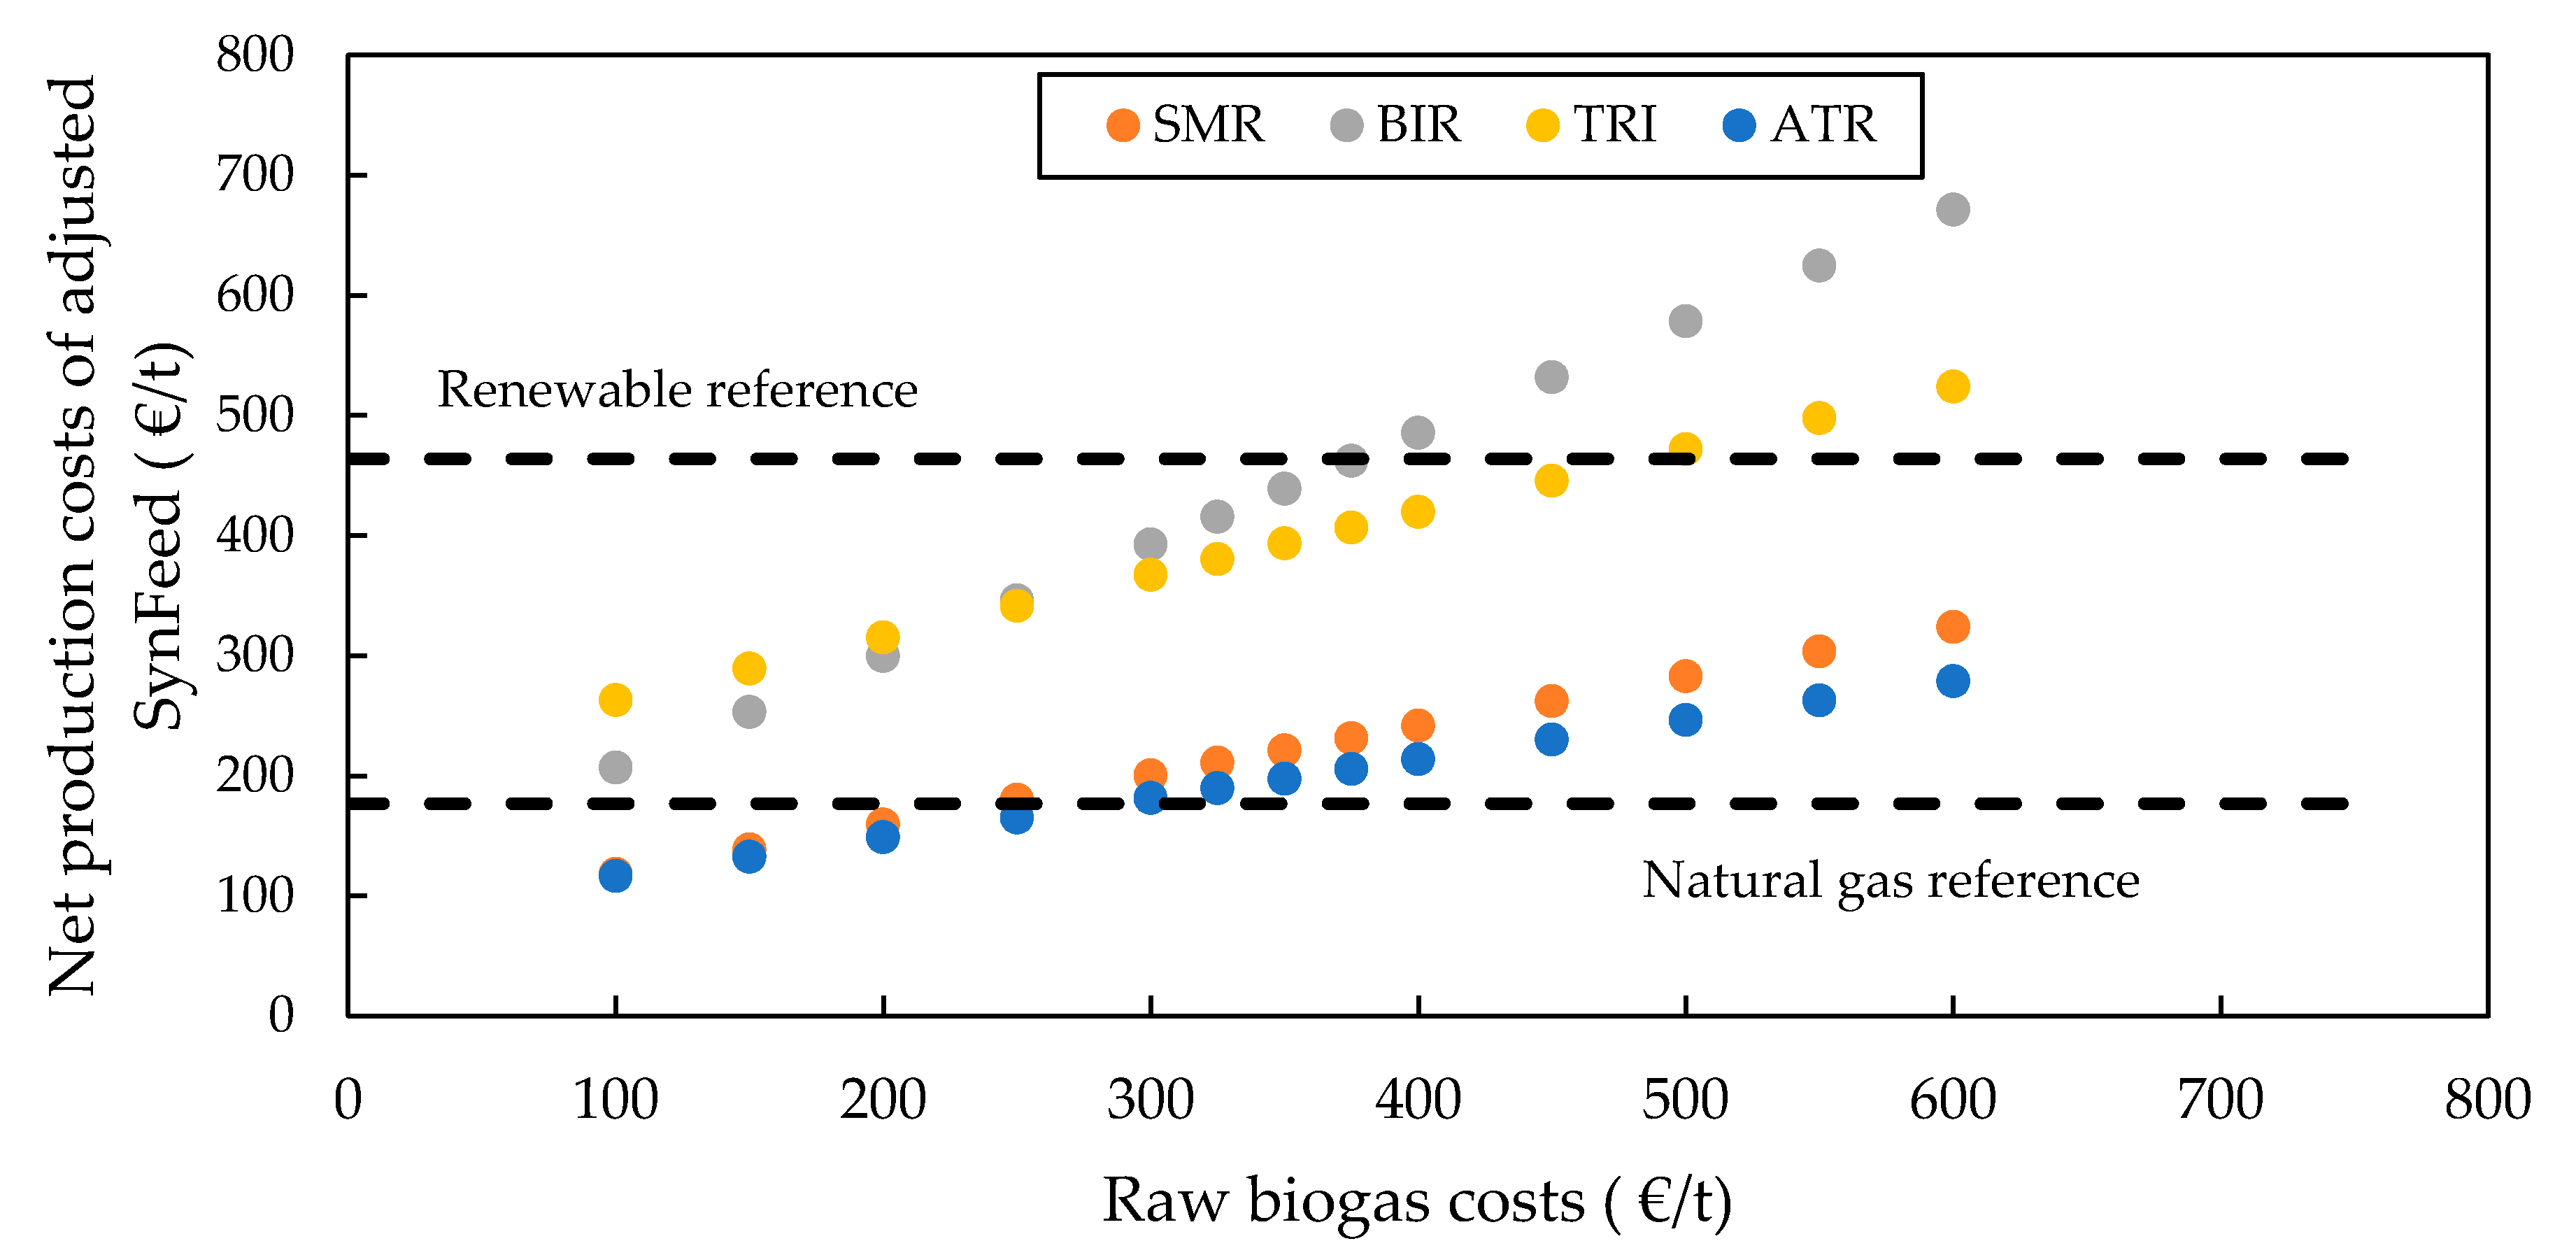
4.3.5. Sensitivity Analysis
In all biogas upgrading concepts presented, the operational costs significantly outweigh the capital costs. The biggest proportion of costs is comprised of the raw material costs for the biogas, which represent about 75 to 95% of the operating costs. Since biogas costs from algae remnant treatment are rarely discussed in the literature, these were approximated at 5.5 to 6.5 ct/kWh from conventional biogas production in Germany [
36]. The results reveal that SynFeed generated from such biogas is cost competitive in relation to SynFeed that is purely produced by water electrolysis and CO
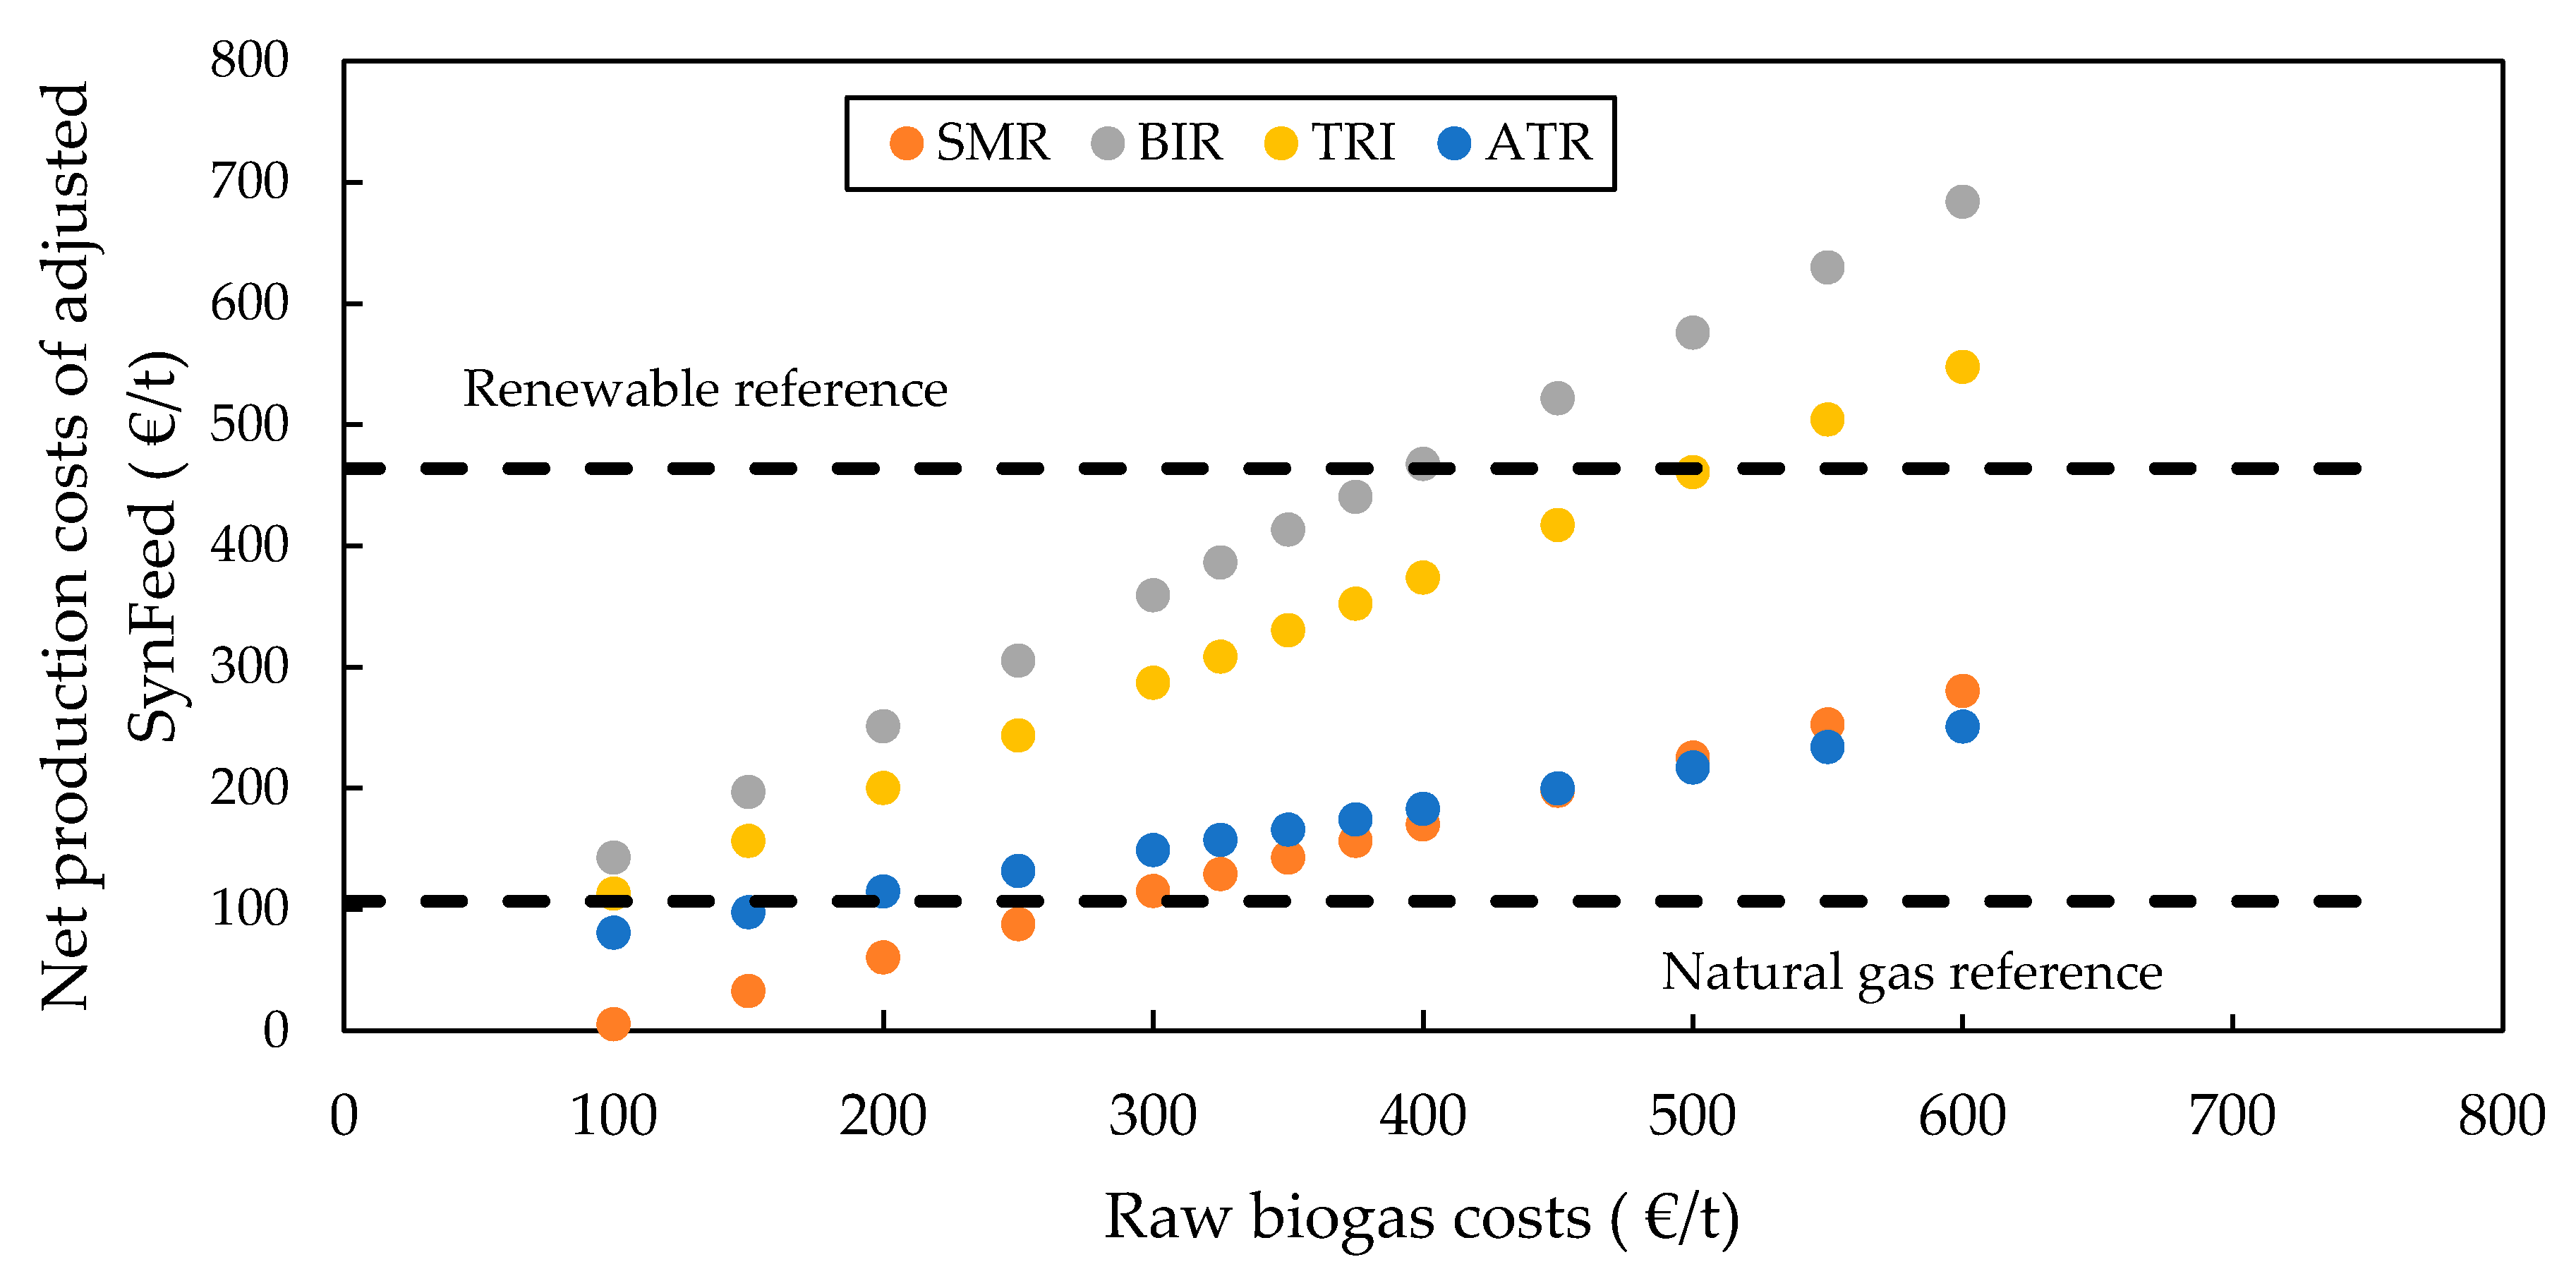
2 capture, however, it is not competitive with SynFeed generated from natural gas. To show the effect of biogas costs on the total costs of SynFeed,
Figure 11 and
Figure 12 depicts the costs for adjusted SynFeed by either mixing or separation conditions depending on the raw biogas costs. First, it can be seen that direct biogas reforming systems (BIR, TRIR) show steeper gradients and therefore a higher dependency. While they are not competitive at present costs, this could change if biogas becomes cheaper in the future. Secondly, even with high biogas costs, SMR and ATR are still cheaper than solely producing SynFeed with electrolysis and CO
2 capture. However, a break-even can be assumed at biogas costs around 1000 €/t. Lastly,
Figure 11 and
Figure 12 show that, for lower biogas costs at around 300 €/t, biogas reforming is even cheaper than utilizing natural gas.
4.3.6. Biogas Reforming as a Precursor for Integrated Algae Biorefineries
This techno-economic analysis reveals that SMR and ATR processes are the most economic options. The considered capacity is in the order of the algae refinery described by Klein-Marcuschamer et al., with an output of 46 kt of jet fuel [
28]. The hydro-processing step of this refinery requires 15 kt/y of H
2. By implementing the SMR process for biogas upgrading, 16 kt/y of H
2 and 400 kt/y of SynFeed are produced. In an integrated refinery, the produced H
2 could satisfy the hydro-processing demand, while the SynFeed could be converted to 250 kt/y of methanol. The methanol, in turn, could be further processed to 50 kt/y of jet fuel with diesel, gasoline and LPG as byproducts, using Lurgi’s MtSynfuels process [
37,
38]. This would double the capacity of the algae refinery and substitute about 320 MW electrolyser capacity, compared to an electricity-based approach [
39]. If the ATR case is considered, about 16 kt/y of CO
2 is produced, which corresponds to 1.4% of the total CO
2 input of the algae refinery. Additionally, about 390 kt/y of SynFeed is generated, which could supply about 240 kt/y of methanol. In this case, the H
2 in the algae oil hydro-processing has to be generated by a 100 MW electrolyser, which would also generate about 80% of the oxygen demand of the ATR process. It is evident that steam methane or autothermal reforming of arising biogas in an algae refinery can be a valuable tool to integrate different concepts and increase product output and economic feasibility.


