Article

Thermal and Kinetic Behaviors during Co-Pyrolysis of Microcrystalline Cellulose and Styrene–Butadiene–Styrene Triblock Copolymer

1
Key Laboratory for Thermal Science and Power Engineering of Ministry of Education, Beijing Key Laboratory of CO2 Utilization and Reduction Technology, Department of Energy and Power Engineering, Tsinghua University, Beijing 100084, China
2
Tsinghua University-University of Waterloo Joint Research Center for Micro/Nano Energy & Environment Technology, Tsinghua University, Beijing 100084, China
3
Department of Mechanical and Mechatronics Engineering, University of Waterloo, Waterloo, ON N2L 3G1, Canada
*
Authors to whom correspondence should be addressed.
Processes 2021, 9(8), 1335; https://doi.org/10.3390/pr9081335
Submission received: 29 June 2021 / Revised: 22 July 2021 / Accepted: 28 July 2021 / Published: 30 July 2021
(This article belongs to the Section Catalysis Enhanced Processes)

Abstract

:
The interaction between various municipal solid waste components is very important for the actual solid waste treatment process. Microcrystalline cellulose (MC) and styrene–butadiene–styrene triblock copolymer (SBS) are important components of municipal solid waste. In this paper, co-pyrolysis characteristics and kinetics of MC and SBS with different heating rates were investigated using a thermogravimetric analyzer. The overlap ratio was defined to evaluate the interaction between MC and SBS. The results showed that the decomposition temperature of MC was lower than that of SBS during pyrolysis. The interaction between MC and SBS, an inhibitory effect, was most significant when the MC mass fraction was 70% with an overlap ratio of 0.9764. SBS had almost no effect on the pyrolysis temperature of MC, while MC delayed the pyrolysis of SBS. Adding MC in SBS can significantly reduce the energy required for the reaction.

1. Introduction

With the rapid development of the global economy, the generation of municipal solid waste is increasing year by year [1]. The large amounts of municipal solid waste need to be disposed of safely and reliably for the sustainable development of cities. Traditional disposal methods, such as landfill, bring about a series of problems such as groundwater, pollution, and land occupation [2,3]. At present, thermochemical conversion is an important method of avoiding the aforementioned problems. It refers to the process of converting solid waste into energy, directly or indirectly, including pyrolysis, incineration, and gasification [4]. Among the three methods, pyrolysis is the most fundamental method and the basic process of incineration and gasification [5,6,7]. The mechanism of pyrolysis can guide the thermochemical conversion of municipal solid waste, which is worth further study.
A large number of studies on the pyrolysis of specific municipal solid waste have been carried out in recent years [8,9,10,11,12,13]. However, the conclusions of these studies are not consistent with each other due to the complexity of municipal solid waste. Therefore, more studies have begun to focus on a certain component of municipal solid waste, such as biomass and polymer [14]. Jia et al. [15] studied the pyrolysis of rice husk in a thermogravimetric analyzer at different heating rates and found that the pyrolysis of rice husk could be divided into three stages. The pyrolysis of cellulose conducted by Fan et al. [16] revealed that the organic species of furans, phenols, and aldehydes increased due to the fracture and isomerization of cellulose at high pyrolysis temperatures. Ji et al. [17] reported the pyrolysis of PVC with the transition metal oxide. It was suggested that the production of toluene, indene, naphthalene, and anthracene significantly decreased with the transition metal oxide during the pyrolysis of PVC [17]. However, most of the studies were about the pyrolysis of a single component of municipal solid waste, and little research paid attention to the interaction between different components of municipal solid waste, which is very important for the disposal process of actual municipal solid waste.
The pyrolysis of the biomass component and polymer component generally does not occur individually [18]. Therefore, co-pyrolysis is a promising method, whereby it is possible to explore whether there is an interaction effect between different components, and the energy and the value of organic ingredients in the wastes can be more fully utilized in the process of co-pyrolysis [19]. Some researchers have carried out related studies [20,21,22]. Lin et al. [23] found that liquid yields reduced and gas and char yields increased as the amount of potassium increased in the co-pyrolysis of corn stover and high-density polyethylene. The co-pyrolysis experiments of microalgae with low-density polyethylene conducted by Tang et al. [24] showed that the generation of nitrogen compounds was effectively inhibited, and the formation of pyrolytic oil was promoted. Xu et al. [25] investigated the co-pyrolysis of macroalgae with waste plastics and found that the contents of the acids and nitrogen compounds were greatly lowered in the pyrolytic oil. The co-pyrolysis of biomass component and polymer component proved to be more effective. Microcrystalline cellulose (MC) is a widely distributed and abundant ingredient in biomass [26], which has been extensively studied. Styrene–butadiene–styrene triblock copolymer (SBS) is an important polymer that is rarely studied in the process of co-pyrolysis. The co-pyrolysis of MC and SBS is expected to provide some new ideas for the interaction between the biomass component and polymer component of municipal solid waste.
The thermogravimetric analyzer (TGA) is a widely used technique in analyzing the co-pyrolysis process [27,28,29]. Through the experiment of thermogravimetric analysis, the thermal and kinetic behaviors of the sample can be analyzed [30,31]. In this paper, a thermogravimetric analyzer was used to study the co-pyrolysis process of MC and SBS under an inert atmosphere, and to explore the interaction between the two components. Through the co-pyrolysis experiment of the two components, using the obtained thermogravimetric data, the interaction and kinetic behavior of the two components were quantitatively analyzed.

2. Materials and Methods

2.1. Materials

All test samples used in the experiments were commercially available. MC was purchased from Sigma-Aldrich Ltd. (Darmstadt, Germany). SBS was purchased from Hengtai Co., Ltd. in the Guangdong province of China. Before the experiment, all samples were dried at 105 °C to remove moisture. All samples were ground and screened to a particle size below 250 μm to prevent heat transfer interference in the experiment. The proximate and ultimate analyses of MC and SBS are shown in Table 1. The volatile matter content of MC and SBS is very high, while the ash content of MC and the fixed carbon content of SBS is almost zero. The oxygen and carbon content are the components with the highest content of MC and SBS, respectively.

2.2. Experiments

The TGA experiments were performed using a NETZSCH STA 449F3 thermogravimetric analyzer (NETZSCH, Selb, Germany). The samples were heated under atmospheric pressure in an Al2O3 crucible at heating rates of 10, 20, and 30 °C min−1 from room temperature to 1000 °C. The target temperature of 1000 °C was high enough to consider the possible interaction between the two components in the high-temperature zone. Pure nitrogen was used as the carrier gas and the flow rate was 100 mL min−1. During each test, an empty crucible was used to conduct a blank control experiment at the same time as the conventional experiment. Moreover, any error caused by buoyancy in the furnace could be minimized by deducting a blank control curve from the curve measured by crucible containing samples. The reproducibility was confirmed in our previous study through repeated experiments, and the error of repeated experiments was within an acceptable range [32].

2.3. Kinetic Method

The kinetic parameters were calculated using the Flynn–Wall–Ozawa (FWO) method, which is a widely used method in the analysis of TGA [33,34].
The rate of solid non-isothermal decomposition reactions can be defined as [35]:
d α d T = A β exp E R T f ( α )
where T is the temperature, A is the pre-exponential factor, β is the heating rate, E is the activation energy, R is the gas constant, f(α) is the reaction mechanism function, and α is the extent of conversion, which can be defined as [36]:
α = m 0 m t m 0 m e
where m0 is the original mass of the sample, mt is the mass at time t, and me is the ultimate mass.
Rearranging Equation (1) and using Doyle’s approximation [37,38]:
lg β = lg A E R G ( α ) 2.315 0.4567 E R T
where G(α) is an integral form of the reaction mechanism function.
By analyzing the linear relationship between lg β and 1/T, the activation energy can be determined.

3. Results and Discussion

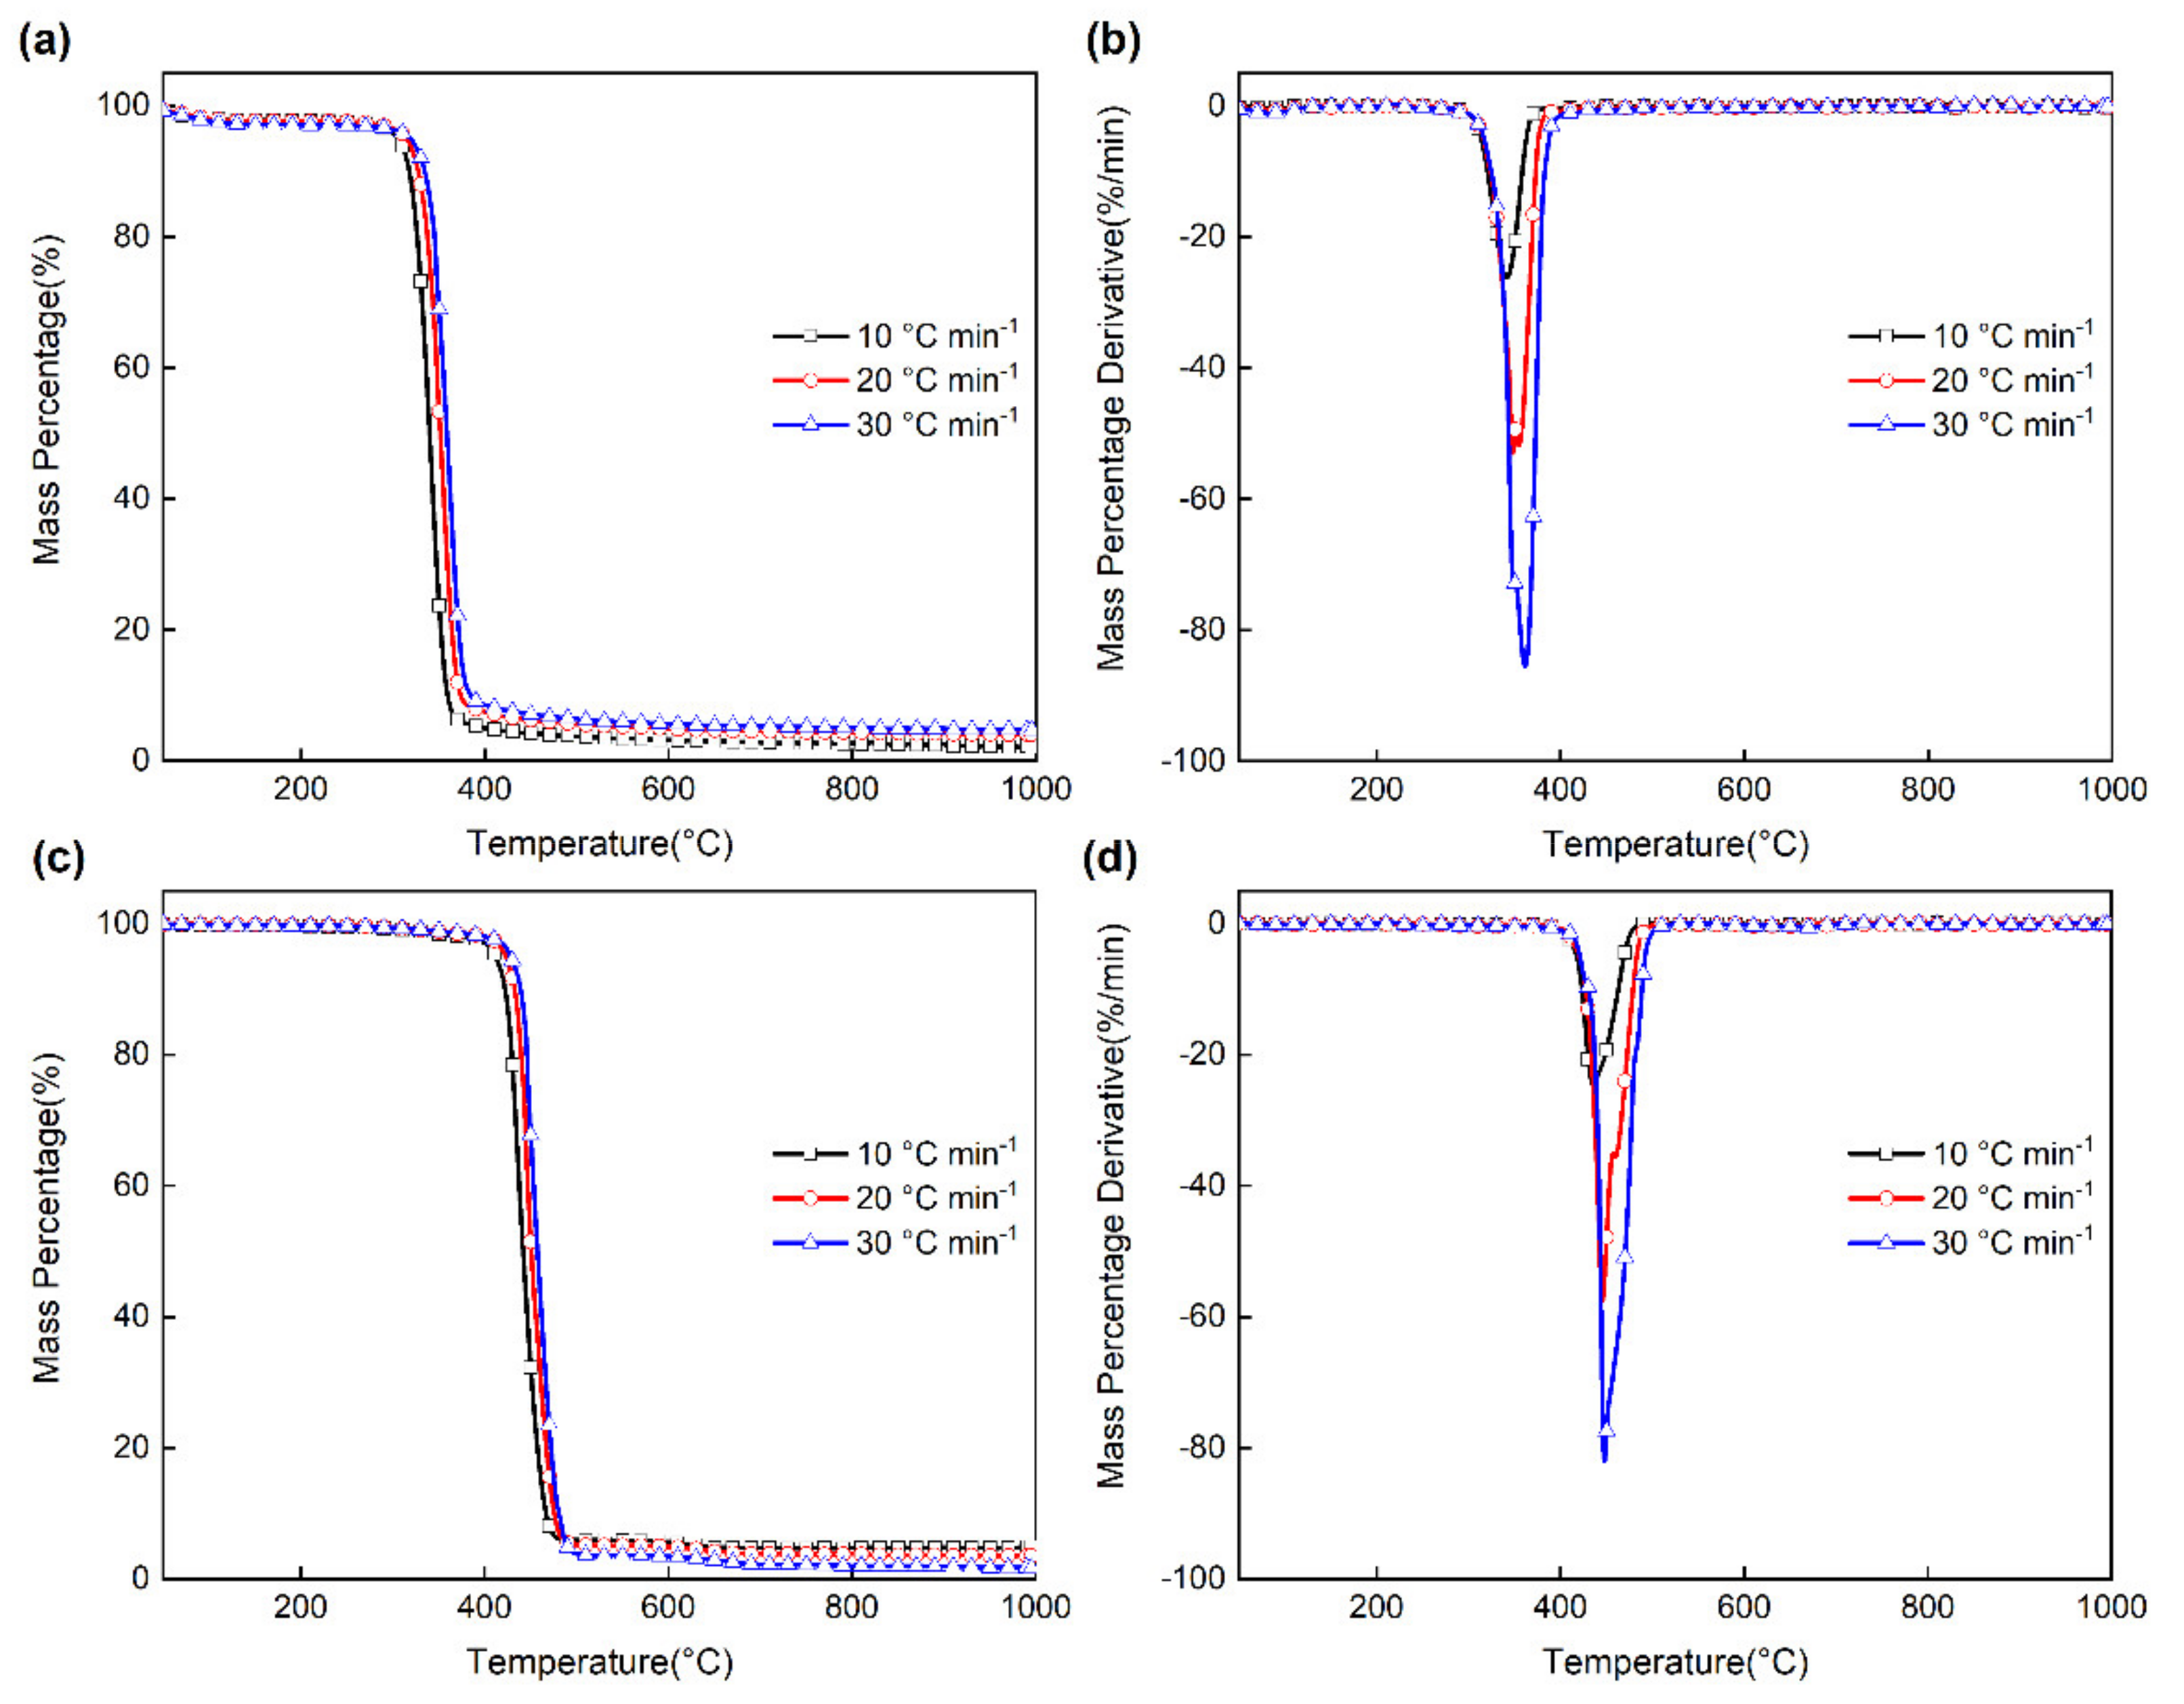
3.1. Pyrolysis of Single Component

Figure 1 shows the TG and DTG curves of MC and SBS at heating rates of 10, 20, and 30 °C min−1, which can be used to analyze the independent pyrolysis behavior of the two samples. As shown in the figure, the pyrolysis of MC and SBS presents only one peak. The pyrolysis of MC mainly occurred at 270–400 °C, while the pyrolysis of SBS mainly occurred between 370 and 520 °C. Besides this, it is worth noting that as the heating rate increased, the TG and DTG curves gradually shifted to the high-temperature region. This can be attributed to the untimely heat transfer caused by the higher heating rate, which led to the delay of the pyrolysis of some samples [39].
MC is a typical biomass model compound. For general biomass, pyrolysis can be divided into three main stages: moisture drying, main degradation of unstable polymers, and continuous residue slow decomposition [40,41]. Figure 1 shows that the pyrolysis of MC is divided into three stages. The first stage occurs from room temperature to about 200 °C. At this stage, the moisture in the MC is dried. Correspondingly, a slight weight loss can be seen in the TG curve, but the slight weight change is not enough to make the DTG curve produce obvious peaks. Stage 2 is the most important pyrolysis process of MC, which mainly occurred at 200–430 °C. The organic components of the main body were decomposed in this process. The mass change reached about 90% at all three heating rates, corresponding to an obvious peak in the DTG curve. The peak value increased with the increasing heating rate. The corresponding temperatures were 342.3, 348.0, and 360.7 °C, respectively. Zhou et al. [42] studied the pyrolysis of MC at the heating rate of 10 °C min−1 and reported that the peak happened at 344.2 °C. This is consistent with the above result, due to the structure of MC being without any branches [43]. The third stage occurred in the subsequent temperature range. The mass reduction is caused by the decomposition of thermally stable residues. The mass change is small and there is no obvious fluctuation in the DTG curve.
Compared with MC, SBS has a simpler structure, and its inherent moisture content is lower [19]. As shown in Figure 1, the decomposition of SBS is also divided into three stages. The first stage is the process from room temperature to 200 °C. The mass reduction in SBS in the first stage was lower than that of the MC, which also confirms the lower inherent moisture mentioned above. The second stage occured at 200-530 °C, which is also the decomposition process of the main organic components. Compared with MC, the quality of SBS at this stage saw a greater change, reaching almost 95%, which is almost consistent with the volatile content (94.03%) of SBS. This indicates that the mass change in this stage is mainly the release of volatiles. The temperatures corresponding to the maximum peak of the DTG curve at different heating rates were 438.8, 443.9, and 447.8 °C. The third stage occurred in the subsequent temperature range. It can be seen from the figure that, compared with MC, the quality change of SBS was smaller at this stage.

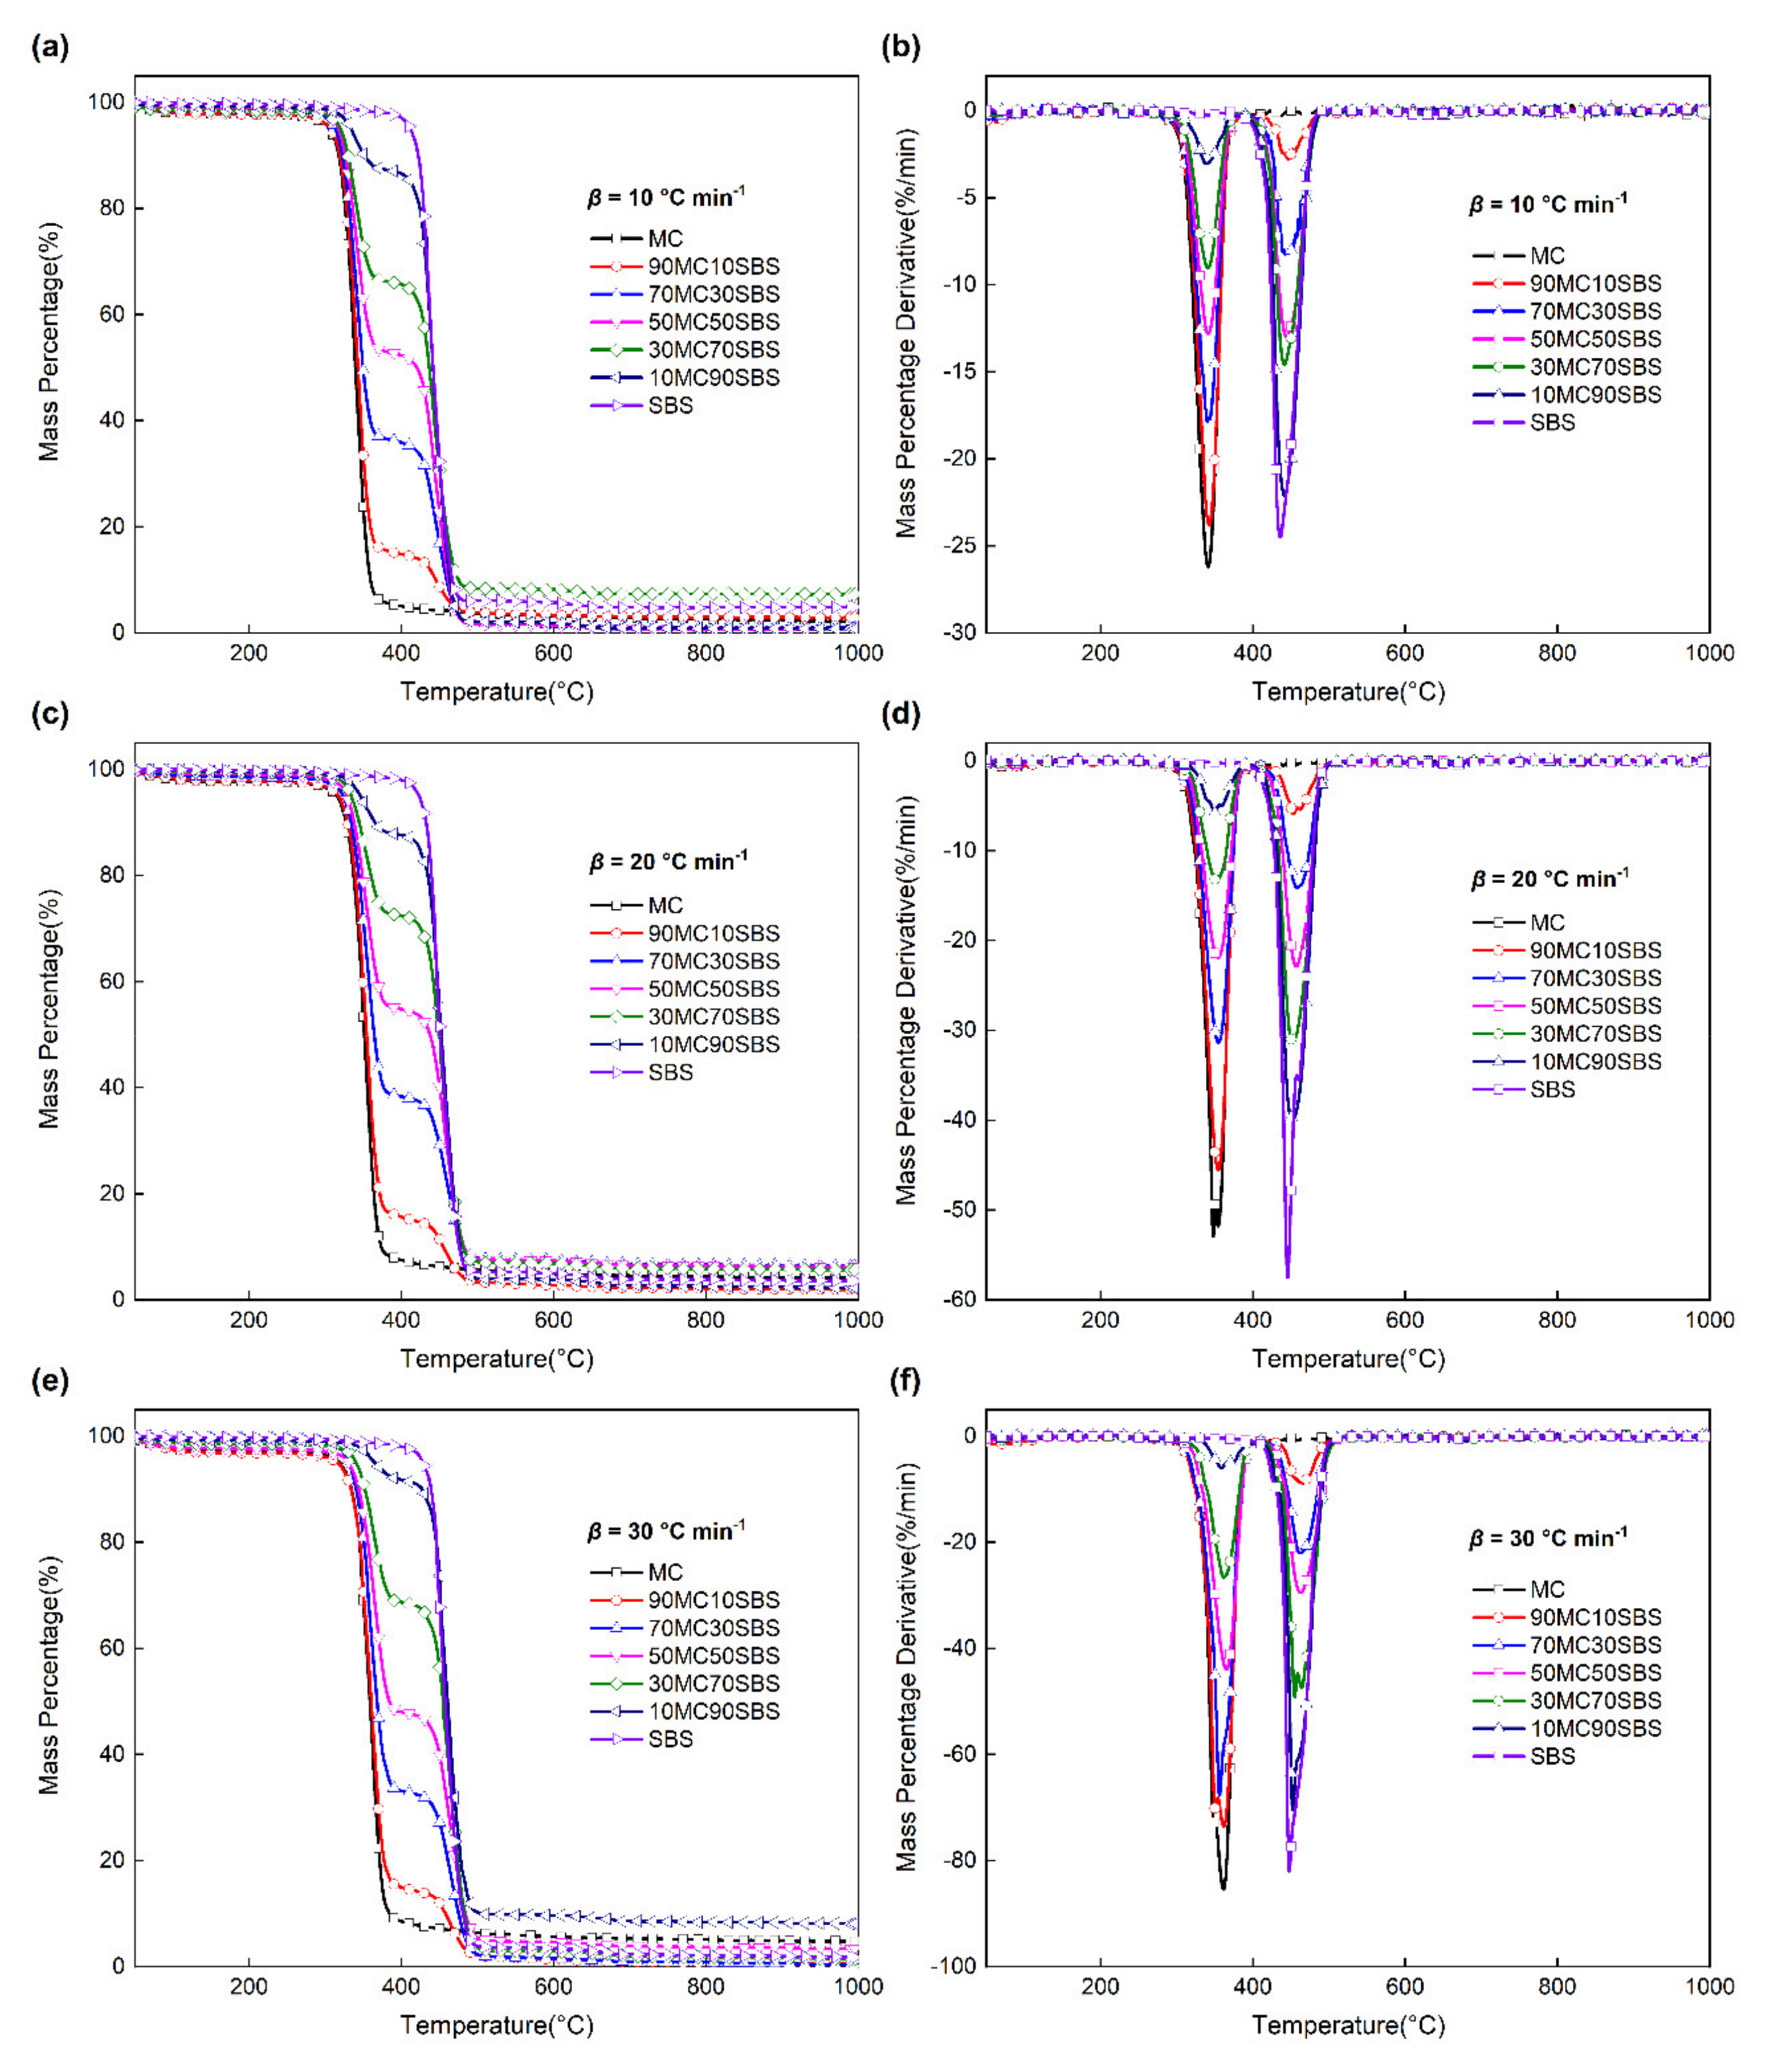
3.2. Pyrolysis of Mixed Components

To investigate the co-pyrolysis characteristics of MC and SBS, thermogravimetric experiments were performed on samples with different mixing ratios at heating rates of 10, 20, and 30 °C min−1. The TG and DTG curves are displayed in Figure 2. “XXMCYYSBS” is defined as the mixed sample containing XX% MC and YY% SBS. For example, “90MC10SBS” refers to the mixed sample containing 90% MC and 10% SBS.
The TG curve of the MC and SBS mixture was divided into two weight loss stages, while two obvious peaks appeared on the DTG curve, corresponding to the main decomposition stage of the two components. The first stage corresponds to the degradation of the main components of MC, and the second stage corresponds to the degradation of the main components of SBS. With the different mixing ratios, the sample quality at the end of the first degradation stage presented a roughly uniform change in height, and two peaks appeared on the DTG curve at the same time. The uneven quality change of the sample in the first stage may be attributed to the internal interaction between MC and SBS. Besides this, the increase in the heating rate also exacerbated this unevenness to some extent.

3.3. Interaction between MC and SBS

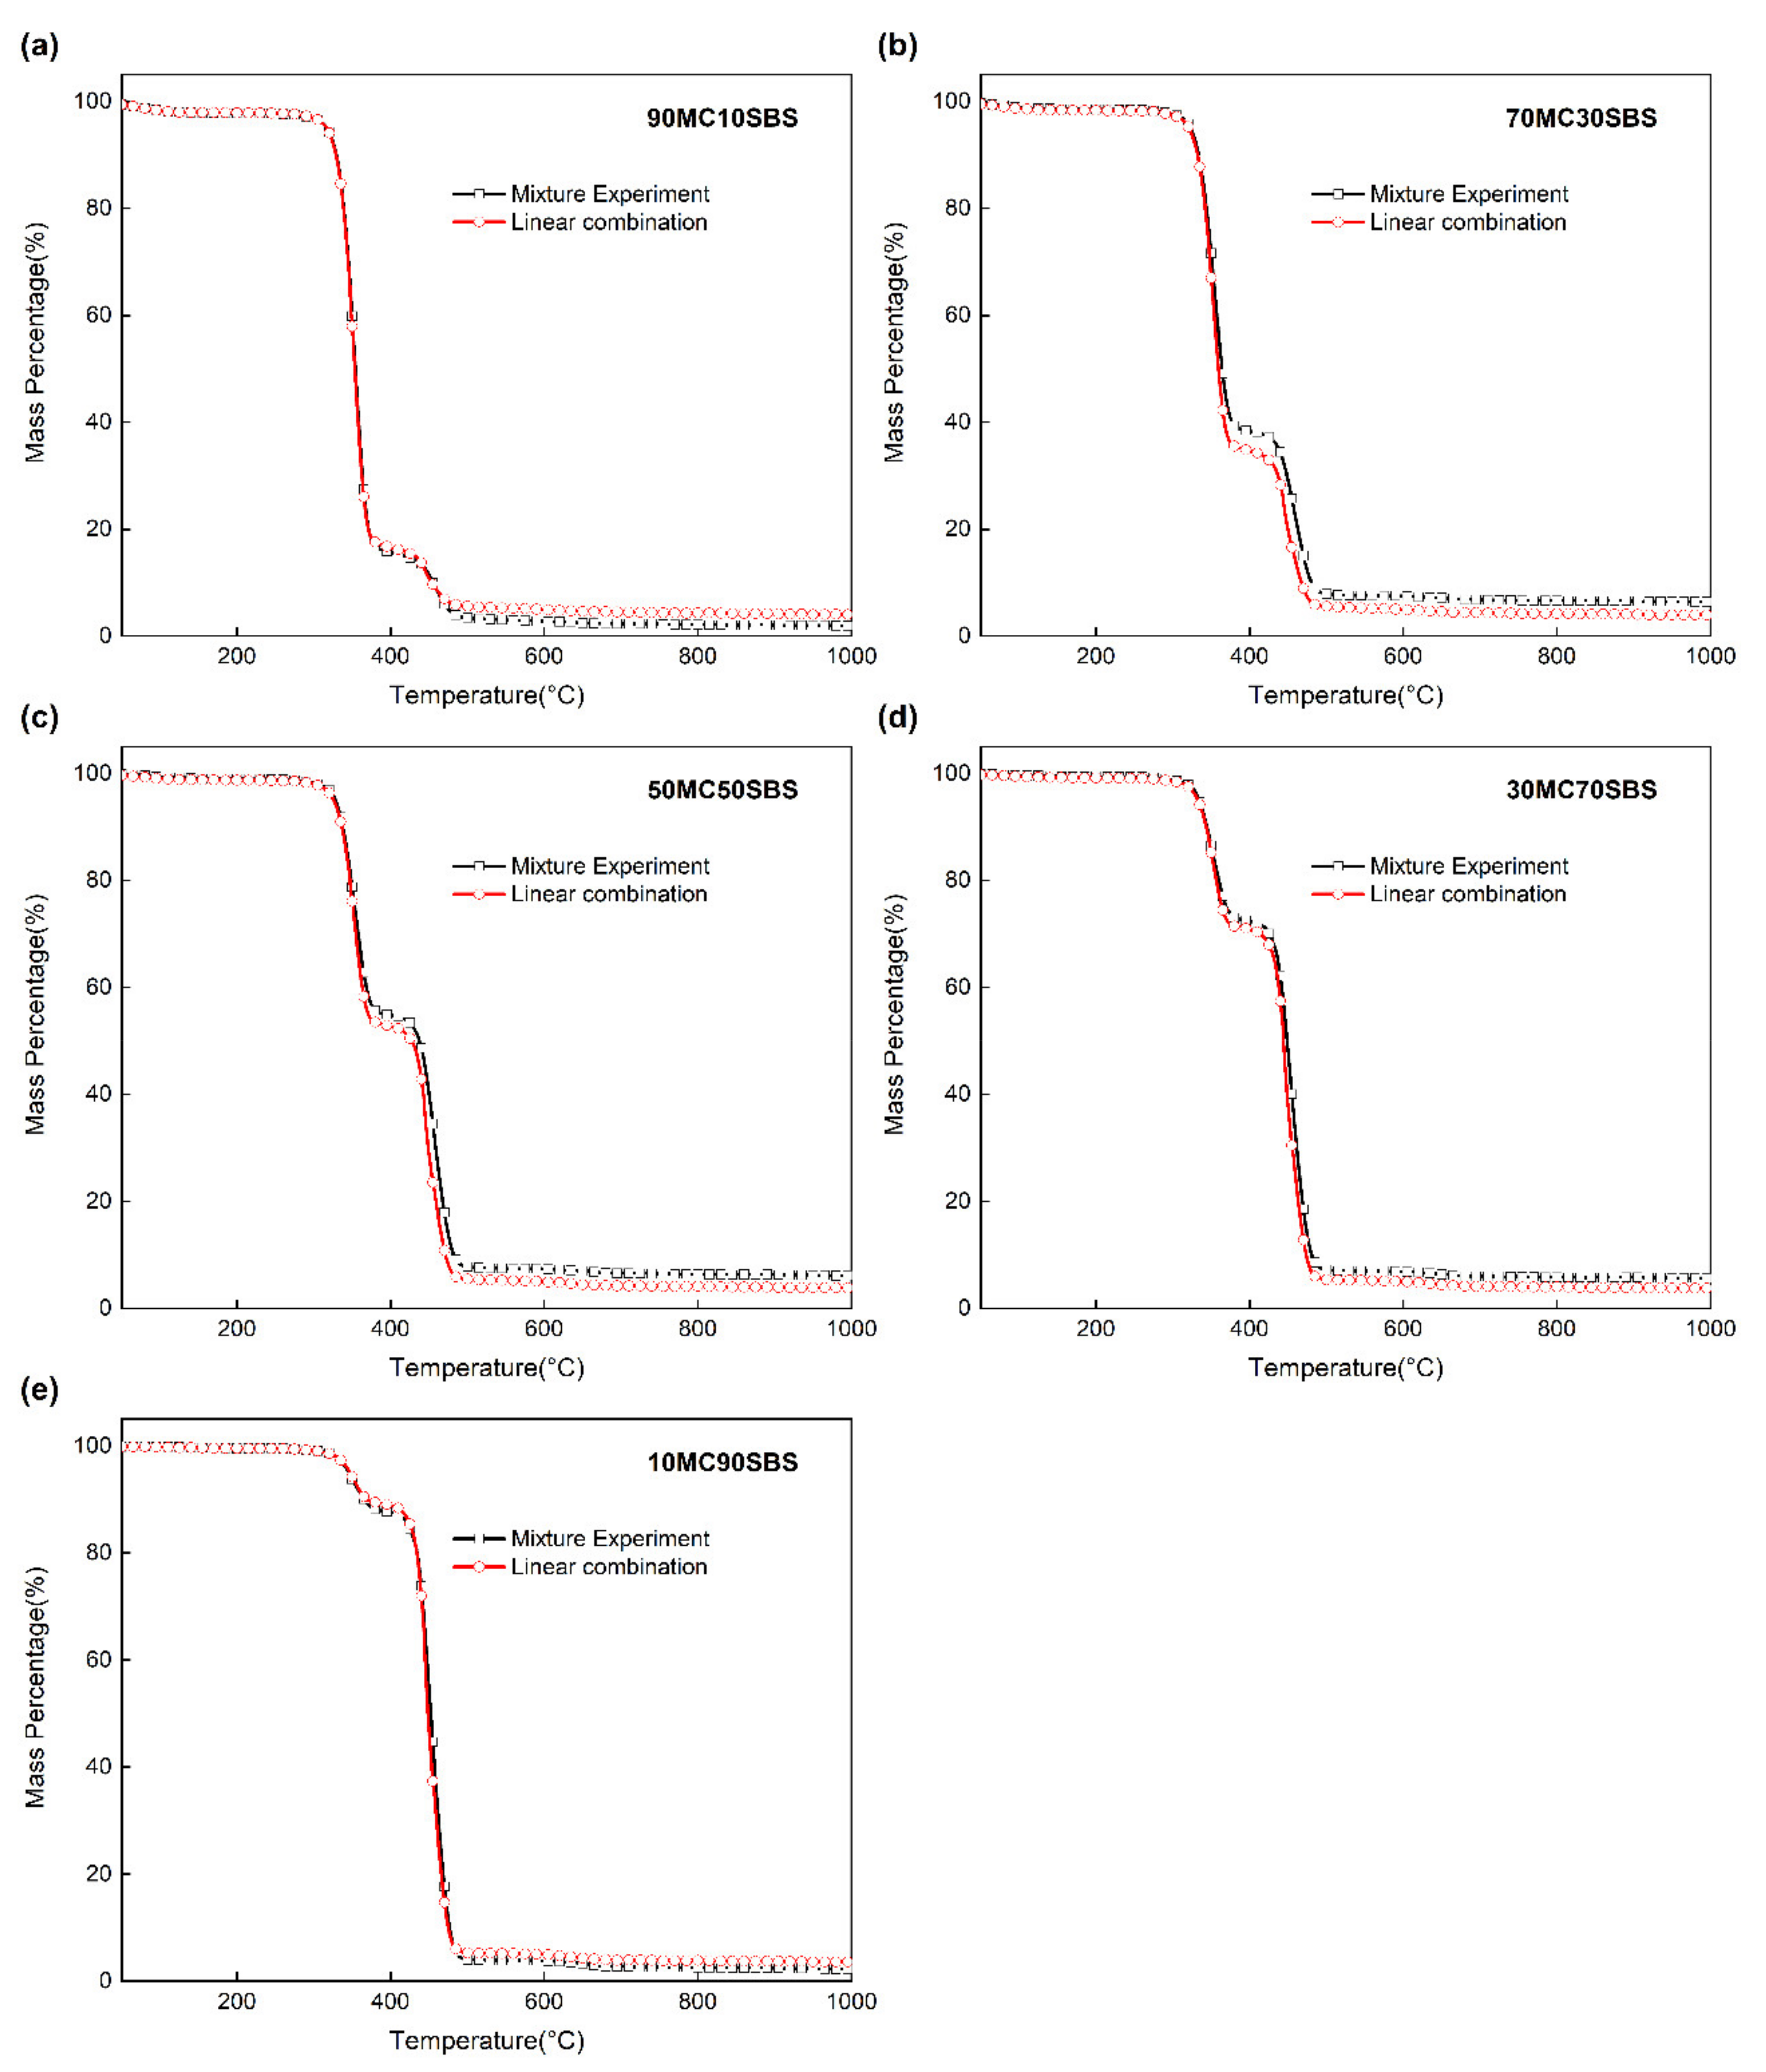
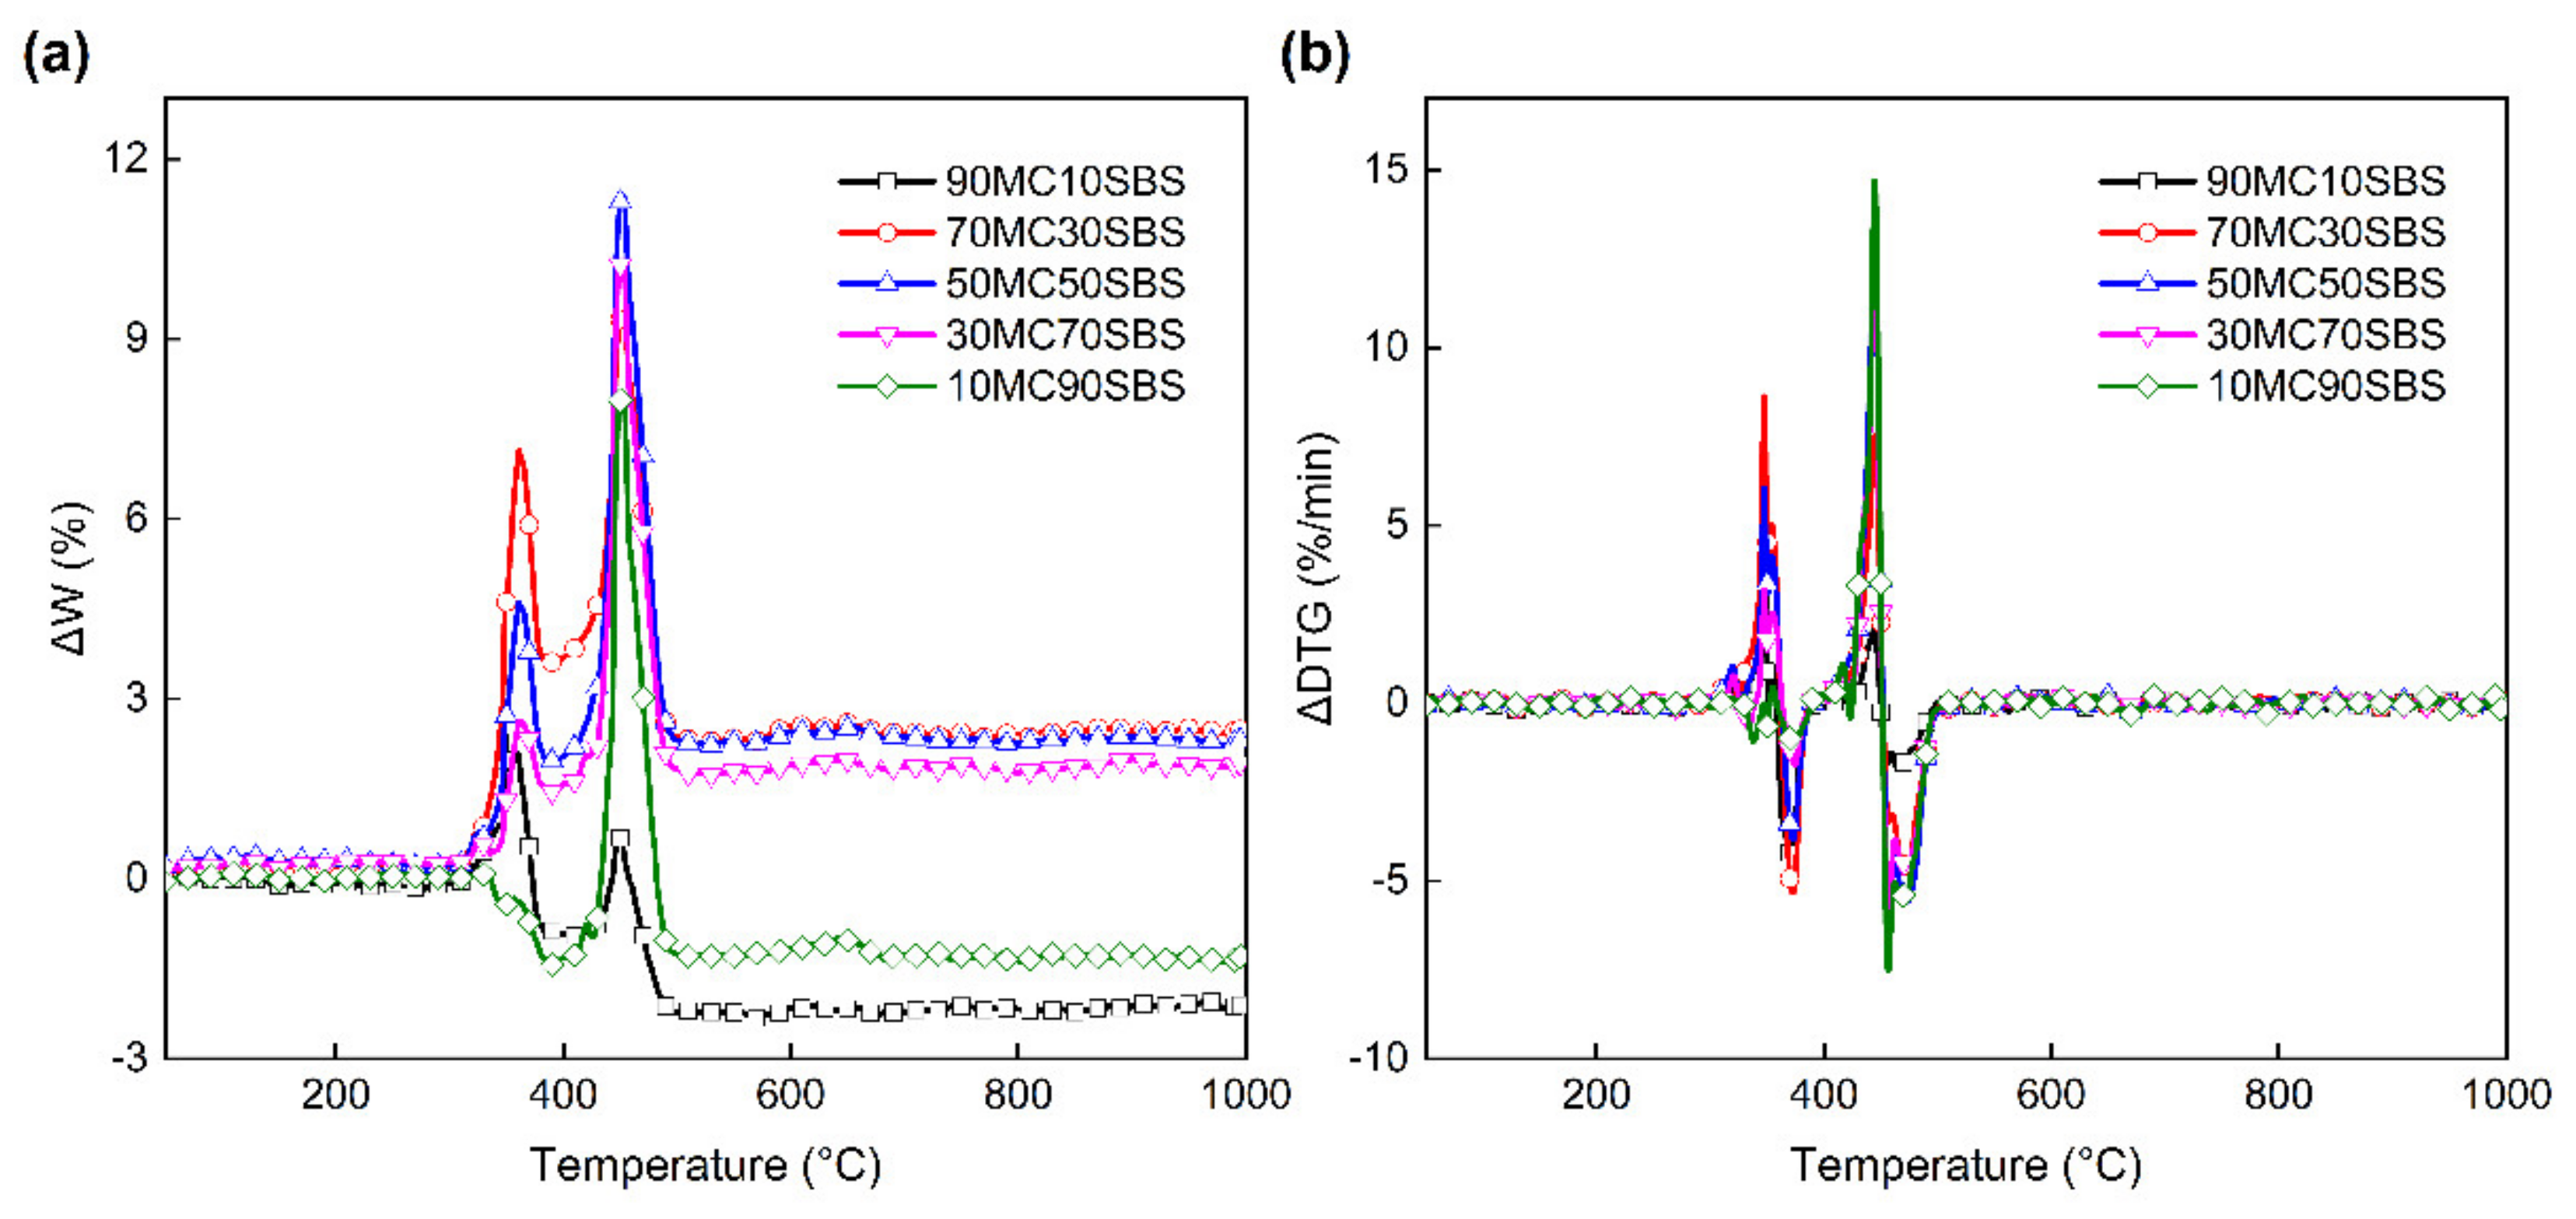
3.3.1. Interaction on the TG Curves

To further analyze the interaction between MC and SBS, the theoretical TG and DTG curves were drawn by linear combination according to the mixing ratio of the sample, and were compared with the experimental curve. The difference between the theoretical curve and the experimental curve characterized the interaction in the mixed sample. If there is no interaction between the components, the theoretical curve and the experimental curve should overlap. To evaluate the deviation of the two curves, the overlap ratio (OR) of the TG curve was introduced [44,45], which can be defined as:
O R = 1 A S A T = 1 T 0 T e Δ m ( T ) d T ( m 0 m e ) ( T e T 0 ) 1 lim N i = 1 N Δ m ( T i ) N ( m 0 m e )
where AS represents the area sandwiched by the two curves, AT represents the total area between the effective temperature range and the effective mass change range, T0 represents the initial temperature, Te represents the terminal temperature, m0 represents the initial mass, and me represents the residue quality. Δm(T) represents the difference between the theoretical curve and the experimental curve. When the two curves coincide, OR = 1; otherwise, 0 ≤ OR < 1.
Figure 3 shows the comparison of the TG curves between the mixture experiments and the theoretical linear combinations at a heating rate of 20 °C min−1 with different mixing ratios. When the mass fraction of MC was 90% and 10%, the interaction between the two components was not significant, and the OR was 0.9876 and 0.9942, respectively. In the other mixing ratios, the interaction between the two components was more significant. Among them, when the MC quality fraction was 70%, it was most significant, and the OR was 0.9764. At this time, the theoretical curve and the experimental curve of the first stage of pyrolysis were clearly separated. The experimental curve was higher than the theoretical curve, indicating that SBS had a significant inhibitory effect on the degradation of MC. However, the interaction between samples with other mixing ratios at this stage was not significant. From the perspective of residual quality, MC and SBS showed inhibition when their mass fractions were close and showed promotion when their mass fractions differed greatly.

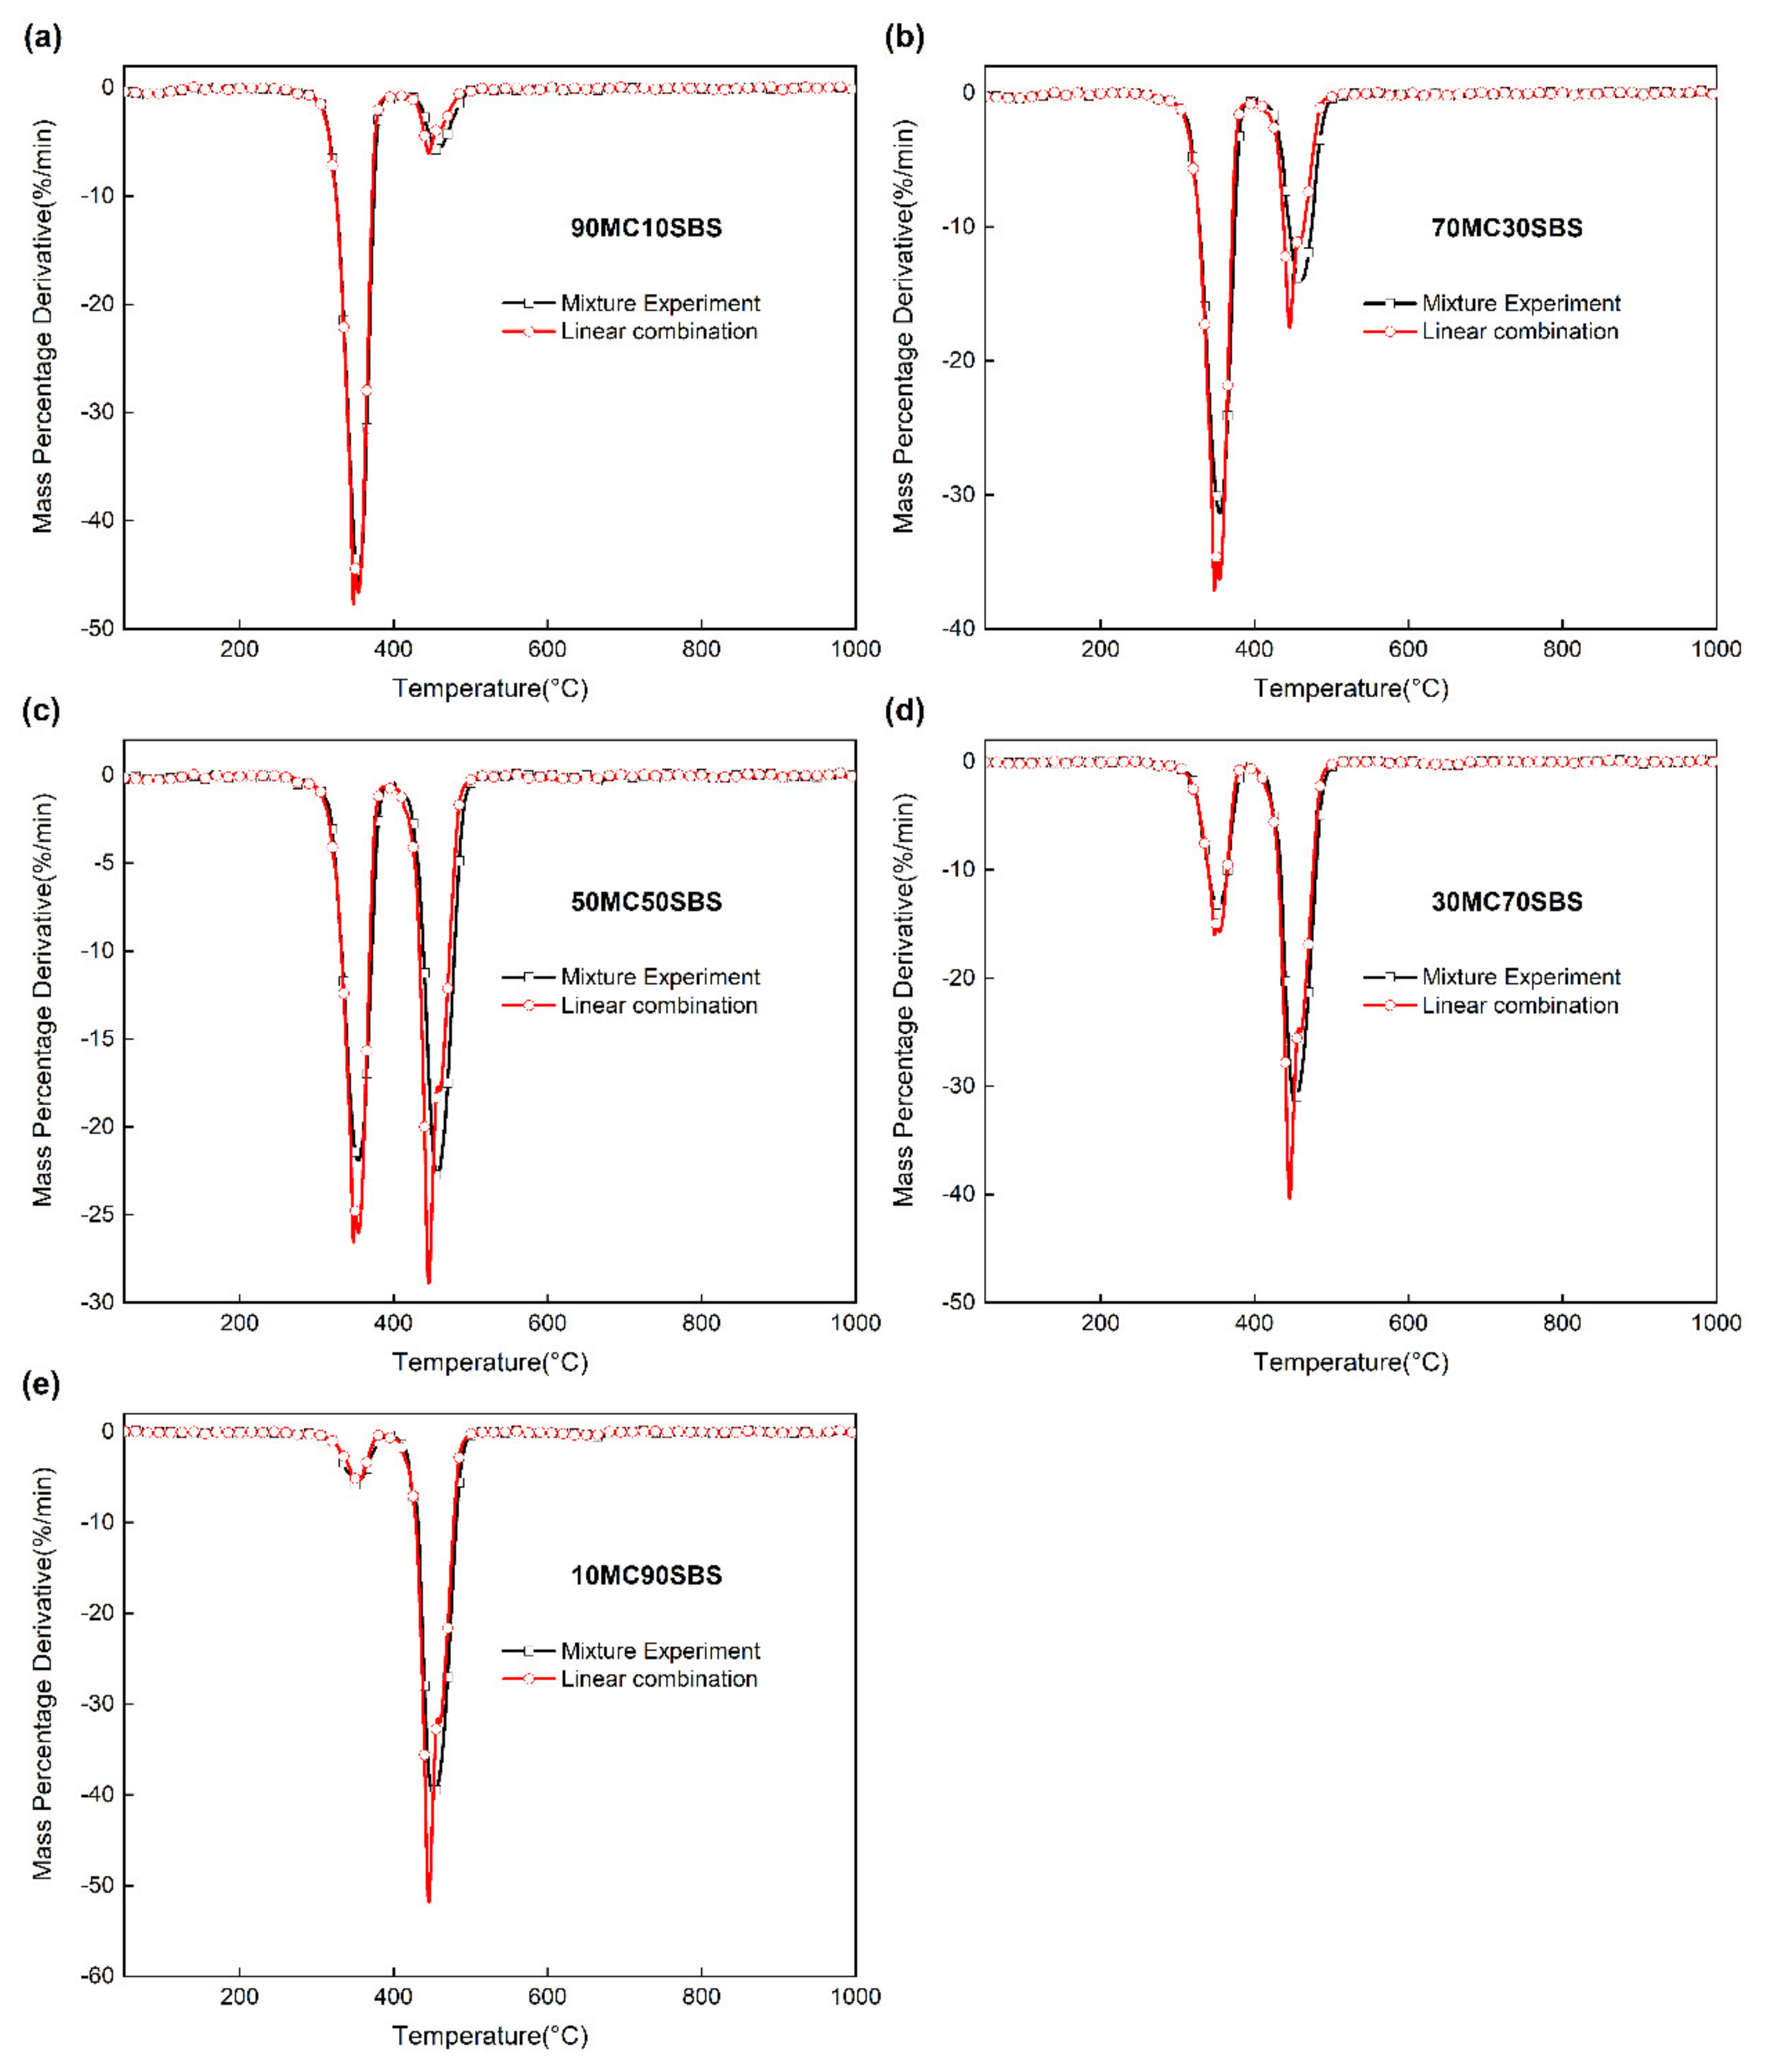
3.3.2. Interaction on the DTG Curves

The shift in the peak of the DTG curve can also reflect the interaction between the components. The DTG curves of the mixture experiments and the theoretical linear combinations with different mixing ratios at a heating rate of 20 °C min−1 are displayed in Figure 4.
Each curve has two peaks. The peak on the left corresponds to the degradation of MC, while the peak on the right corresponds to the degradation of SBS. When the MC mass fraction was 90% and 10%, the overlap of the theoretical curve and the experimental curve was good, and when the MC mass fraction was 70%, 50%, and 30%, the overlap of the two curves was relatively worse. This is consistent with the trend on the TG curve. Moreover, the peak value of the linear synthesis curve was larger than the peak value of the experimental curve, which may be due to the interaction between the samples reducing the pyrolysis rate. As far as the positions of the two peaks are concerned, the experimental results of the left peak were essentially the same as the theoretical results, while the experimental curve of the right peak was shifted to the right compared to the theoretical results. This indicates that SBS has almost no influence on the temperature at which the pyrolysis of MC occurs, but MC delays the pyrolysis of SBS, which is similar to the results of previous related studies [46]. This phenomenon may be attributed to the fact that the biochar generated in the pyrolysis of MC forms a certain hindrance to the decomposition process of SBS, producing a high number of free radicals. Interestingly, MC contains 14.34% fixed carbon components.

3.3.3. Interaction Indices

To analyze the strength of the interaction between MC and SBS, the interaction indices Δw and ΔDTG of co-pyrolysis were defined as the following equations [47]:
Δ w ( T ) = w exp ( T ) w cal ( T )
Δ DTG ( T ) = DTG exp ( T ) DTG cal ( T )
where “exp” denotes the experimental results, and “cal” denotes the calculated results.
If Δw is positive, this means that there is an inhibitory effect between the two components; if Δw is negative, this means that there is a promoting effect between the two components. ΔDTG reflects how fast the interaction changes. The co-pyrolysis interaction indices with different mixing ratios are shown in Figure 5.
When the mass fraction of MC was 90% and 10%, MC and SBS mainly showed mutual promotion, but they showed short-term mutual inhibition around 350 and 450 °C. These two temperatures are in the critical period of pyrolysis of the two components. When the mass fraction of MC was 70%, 50%, and 30%, MC and SBS were in a mutual inhibition situation during the whole reaction process. Similarly, the inhibitory effect peaked around 350 and 450 °C. In general, except for the second pyrolysis stage where the mass fraction of MC was 90%, the two components showed a mutual inhibition state in the main co-pyrolysis zone, regardless of the mixing ratio of the components. When the mass fraction of MC and SBS was similar, this inhibitory effect was still reflected in the residual mass at the end of the reaction. It can be seen from the ΔDTG curve that the rate of the interaction change presented four peaks, which exactly corresponded to the two peaks of Δw. The peak temperature of ΔDTG appeared near the peak temperature of Δw, and the distance between the two peak temperatures was within 30 °C.

3.4. Kinetic Analysis

The activation energy of MC and SBS co-pyrolysis was calculated by the FWO method. Use Equation (2) to calculate the conversion rate at each temperature and obtain the corresponding temperature. For each conversion rate, the activation energy was determined by analyzing the linear relationship between lg β and 1/T. The calculated correlation coefficient (R2) is defined as:
R 2 = [ ( lg β lg β ¯ ) ( 1 / T 1 / T ¯ ) ] 2 ( lg β lg β ¯ ) 2 ( 1 / T 1 / T ¯ ) 2
The R2 are all larger than 0.9, and only three R2 are less than 0.99. This shows that the degrees of linear fitting for the activation energy are effective, and the FWO method is a suitable method for the kinetic calculation of the thermogravimetric experiment. Table 2 shows the calculation results of kinetic parameters with different mixing ratios.
The activation energy of SBS is higher than that of MC, which shows that it is more difficult for SBS to achieve degradation conditions than it is for MC. Therefore, it is not difficult to understand that the degradation temperature of SBS is higher than that of MC. According to the kinetic results of the mixed sample, as the proportion of SBS in the mixed sample was continuously increased, the activation energy showed a trend of first increasing and then decreasing. This showed that adding SBS to MC can increase the energy of pyrolysis, and the effect reaches its peak when the mixing ratio is 1:1. Further increasing the proportion of SBS reduced the energy consumption of pyrolysis to a certain extent. When the mass fraction of MC was 30% and 10%, the result of the activation energy of the mixed sample was significantly lower than the linear superimposed value of the activation energy of the two components alone, which shows that the appropriate amount of MC can significantly reduce the energy required in the reaction of SBS. This may be attributed to the small molecules and free radicals (e.g., ketone, carboxylic acid, and aldehyde-based substances) produced in the pyrolysis of MC promoting the decomposition of SBS and reducing the activation energy, similarly to the results on the co-prolysis of other biomasses and polymers [19,48]. Besides this, as the mass fraction of SBS in the mixed sample increased, the reaction conversion temperature regularly shifted from the pyrolysis zone of MC to the pyrolysis zone of SBS, which is consistent with the previous results.

4. Conclusions

The interaction between microcrystalline cellulose (MC) and styrene–butadiene–styrene triblock copolymer (SBS) in the pyrolysis process was studied using a thermogravimetric analyzer. The decomposition temperature of MC was lower than that of SBS during pyrolysis. As the heating rate increased, the decomposition of all samples was delayed. When the MC mass fraction was 70%, the interaction between MC and SBS was the most significant, which was an inhibitory effect, and the overlap ratio was 0.9764. SBS had almost no effect on the pyrolysis temperature of MC, but MC delayed the pyrolysis of SBS. Except for the second pyrolysis stage where the mass fraction of MC was 90%, the two components showed a mutual inhibition state in the main co-pyrolysis zone, regardless of the mixing ratio. Additionally, the activation energy of SBS was higher than that of MC. Adding MC to SBS could significantly reduce the energy required for the reaction.

Author Contributions

Conceptualization, investigation and original draft preparation, S.Y.; writing—review and editing, X.Y., H.Z., Z.T., Q.L.; methodology, K.C., Y.Z.; funding acquisition, Y.Z. All authors have read and agreed to the published version of the manuscript.

Funding

This research was funded by the National Natural Science Foundation of China, grant number 52070116.

Institutional Review Board Statement

Not applicable.

Informed Consent Statement

Not applicable.

Acknowledgments

The financial support from the National Natural Science Foundation of China (No. 52070116) is gratefully acknowledged.

Conflicts of Interest

The authors declare no conflict of interest.

References

  1. Liu, C.; Wu, X.W. Factors influencing municipal solid waste generation in China: A multiple statistical analysis study. Waste Manag. Res. 2011, 29, 371–378. [Google Scholar] [PubMed]
  2. Ma, S.; Lu, J.; Gao, J. Study of the low temperature pyrolysis of PVC. Energy Fuels 2002, 16, 338–342. [Google Scholar] [CrossRef]
  3. Huai, X.L.; Xu, W.L.; Qu, Z.Y.; Li, Z.G.; Zhang, F.P.; Xiang, G.M.; Zhu, S.Y.; Chen, G. Numerical simulation of municipal solid waste combustion in a novel two-stage reciprocating incinerator. Waste Manag. 2008, 28, 15–29. [Google Scholar] [CrossRef]
  4. Liu, Y.; Liu, Y. Novel incineration technology integrated with drying, pyrolysis, gasification, and combustion of MSW and ashes vitrification. Environ. Sci. Technol. 2005, 39, 3855–3863. [Google Scholar] [CrossRef] [PubMed]
  5. Paradela, F.; Pinto, F.; Ramos, A.M.; Gulyurtlu, I.; Cabrita, I. Study of the slow batch pyrolysis of mixtures of plastics, tyres and forestry biomass wastes. J. Anal. Appl. Pyrolysis 2009, 85, 392–398. [Google Scholar] [CrossRef]
  6. Lee, K.-H.; Shin, D.-H. Characteristics of liquid product from the pyrolysis of waste plastic mixture at low and high temperatures: Influence of lapse time of reaction. Waste Manag. 2007, 27, 168–176. [Google Scholar] [CrossRef] [PubMed]
  7. Aboulkas, A.; El Harfi, K.; El Bouadili, A. Thermal degradation behaviors of polyethylene and polypropylene. Part I: Pyrolysis kinetics and mechanisms. Energy Convers. Manag. 2010, 51, 1363–1369. [Google Scholar] [CrossRef]
  8. Dorez, G.; Ferry, L.; Sonnier, R.; Taguet, A.; Lopez-Cuesta, J.M. Effect of cellulose, hemicellulose and lignin contents on pyrolysis and combustion of natural fibers. J. Anal. Appl. Pyrolysis 2014, 107, 323–331. [Google Scholar] [CrossRef]
  9. Fang, S.; Lin, Y.; Huang, Z.; Huang, H.; Chen, S.; Ding, L. Investigation of co-pyrolysis characteristics and kinetics of municipal solid waste and paper sludge through TG-FTIR and DAEM. Thermochim. Acta 2021, 700, 178889. [Google Scholar] [CrossRef]
  10. Genieva, S.; Gonsalvesh, L.; Georgieva, V.; Tavlieva, M.; Vlaev, L. Kinetic analysis and pyrolysis mechanism of raw and impregnated almond shells. Thermochim. Acta 2021, 698, 178877. [Google Scholar] [CrossRef]
  11. Hu, D.H.; Chen, M.Q.; Huang, Y.W.; Wei, S.H.; Zhong, X.B. Evaluation on isothermal pyrolysis characteristics of typical technical solid wastes. Thermochim. Acta 2020, 688, 178604. [Google Scholar] [CrossRef]
  12. Radojević, M.; Janković, B.; Stojiljković, D.; Jovanović, V.; Čeković, I.; Manić, N. Improved TGA-MS measurements for evolved gas analysis (EGA) during pyrolysis process of various biomass feedstocks. Syngas energy balance determination. Thermochim. Acta 2021, 699, 178912. [Google Scholar] [CrossRef]
  13. Sfakiotakis, S.; Vamvuka, D. Study of co-pyrolysis of olive kernel with waste biomass using TGA/DTG/MS. Thermochim. Acta 2018, 670, 44–54. [Google Scholar] [CrossRef]
  14. Zhou, H.; Meng, A.H.; Long, Y.Q.; Li, Q.H.; Zhang, Y.G. An overview of characteristics of municipal solid waste fuel in China: Physical, chemical composition and heating value. Renew. Sustain. Energy Rev. 2014, 36, 107–122. [Google Scholar] [CrossRef]
  15. Jia, C.; Chen, J.; Liang, J.; Song, S.; Liu, K.; Jiang, A.; Wang, Q. Pyrolysis characteristics and kinetic analysis of rice husk. J. Therm. Anal. Calorim. 2020, 139, 577–587. [Google Scholar] [CrossRef]
  16. Fan, F.; Yang, Z.; Xing, X. Study on the pyrolysis properties of corn straw by TG–FTIR and TG–GC/MS. J. Therm. Anal. Calorim. 2021, 143, 3783–3791. [Google Scholar] [CrossRef]
  17. Ji, M.X.; Chen, L.; Que, J.J.; Zheng, L.L.; Chen, Z.Z.; Wu, Z.S. Effects of transition metal oxides on pyrolysis properties of PVC. Process Saf. Environ. Prot. 2020, 140, 211–220. [Google Scholar] [CrossRef]
  18. Wang, S.; Guo, X.; Wang, K.; Luo, Z. Influence of the interaction of components on the pyrolysis behavior of biomass. J. Anal. Appl. Pyrolysis 2011, 91, 183–189. [Google Scholar] [CrossRef]
  19. Çepelioğullar, Ö.; Pütün, A.E. Thermal and kinetic behaviors of biomass and plastic wastes in co-pyrolysis. Energy Convers. Manag. 2013, 75, 263–270. [Google Scholar] [CrossRef]
  20. Aboyade, A.O.; Carrier, M.; Meyer, E.L.; Knoetze, H.; Görgens, J.F. Slow and pressurized co-pyrolysis of coal and agricultural residues. Energy Convers. Manag. 2013, 65, 198–207. [Google Scholar] [CrossRef]
  21. Ateş, F.; Pütün, A.E.; Pütün, E. Fixed bed pyrolysis of Euphorbia rigida with different catalysts. Energy Convers. Manag. 2005, 46, 421–432. [Google Scholar] [CrossRef]
  22. Park, D.K.; Kim, S.D.; Lee, S.H.; Lee, J.G. Co-pyrolysis characteristics of sawdust and coal blend in TGA and a fixed bed reactor. Bioresour. Technol. 2010, 101, 6151–6156. [Google Scholar] [CrossRef]
  23. Lin, X.N.; Zhang, D.H.; Ren, X.J.; Zhang, Q.F.; Cai, H.Z.; Yi, W.M.; Lei, H.W. Catalytic co-pyrolysis of waste corn stover and high-density polyethylene for hydrocarbon production: The coupling effect of potassium and HZSM-5 zeolite. J. Anal. Appl. Pyrolysis 2020, 150, 104895. [Google Scholar] [CrossRef]
  24. Tang, Z.Y.; Chen, W.; Hu, J.H.; Li, S.Q.; Chen, Y.Q.; Yang, H.P.; Chen, H.P. Co-pyrolysis of microalgae with low-density polyethylene (LDPE) for deoxygenation and denitrification. Bioresour. Technol. 2020, 311, 123502. [Google Scholar] [CrossRef] [PubMed]
  25. Xu, S.N.; Cao, B.; Uzoejinwa, B.B.; Odey, E.A.; Wang, S.; Shang, H.; Li, C.H.; Hu, Y.M.; Wang, Q.; Nwakaire, J.N. Synergistic effects of catalytic co-pyrolysis of macroalgae with waste plastics. Process Saf. Environ. Prot. 2020, 137, 34–48. [Google Scholar] [CrossRef]
  26. Thoorens, G.; Krier, F.; Leclercq, B.; Carlin, B.; Evrard, B. Microcrystalline cellulose, a direct compression binder in a quality by design environment—A review. Int. J. Pharm. 2014, 473, 64–72. [Google Scholar] [CrossRef] [PubMed] [Green Version]
  27. Ishaq, M.; Ahmad, I.; Shakirullah, M.; Khan, M.A.; ur Rehman, H.; Bahader, A. Pyrolysis of some whole plastics and plastics–coal mixtures. Energy Convers. Manag. 2006, 47, 3216–3223. [Google Scholar] [CrossRef]
  28. Shen, B.; Qin, L. Study on MSW catalytic combustion by TGA. Energy Convers. Manag. 2006, 47, 1429–1437. [Google Scholar] [CrossRef]
  29. Zhang, C.; Jiang, X.; Wei, L.; Wang, H. Research on pyrolysis characteristics and kinetics of super fine and conventional pulverized coal. Energy Convers. Manag. 2007, 48, 797–802. [Google Scholar] [CrossRef]
  30. Liu, Q.; Hu, H.; Zhou, Q.; Zhu, S.; Chen, G. Effect of inorganic matter on reactivity and kinetics of coal pyrolysis. Fuel 2004, 83, 713–718. [Google Scholar] [CrossRef]
  31. Zabaniotou, A.A.; Kantarelis, E.K.; Theodoropoulos, C.D. Sunflower shells utilization for energetic purposes in an integrated approach of energy crops: Laboratory study pyrolysis and kinetics. Bioresour. Technol. 2008, 99, 3174–3181. [Google Scholar] [CrossRef]
  32. Zhou, H. Combustible Solid Waste Thermochemical Conversion: A Study of Interactions and Influence Factors; Springer: Berlin/Heidelberg, Germany, 2017. [Google Scholar]
  33. Varma, A.K.; Mondal, P. Physicochemical characterization and kinetic study of pine needle for pyrolysis process. J. Therm. Anal. Calorim. 2016, 124, 487–497. [Google Scholar] [CrossRef]
  34. Flynn, J.H.; Wall, L.A. A quick, direct method for the determination of activation energy from thermogravimetric data. J. Polym. Sci. Part B Polym. Lett. 1966, 4, 323–328. [Google Scholar] [CrossRef]
  35. Burnham, A.K. Computational aspects of kinetic analysis: Part D: The ICTAC kinetics project—Multi-thermal–history model-fitting methods and their relation to isoconversional methods. Thermochim. Acta 2000, 355, 165–170. [Google Scholar] [CrossRef]
  36. Yan, L.; He, B.; Hao, T.; Pei, X.; Li, X.; Wang, C.; Duan, Z. Thermogravimetric study on the pressurized hydropyrolysis kinetics of a lignite coal. Int. J. Hydrogen Energy 2014, 39, 7826–7833. [Google Scholar] [CrossRef]
  37. Doyle, C.D. Kinetic analysis of thermogravimetric data. J. Appl. Polym. Sci. 1961, 5, 285–292. [Google Scholar] [CrossRef]
  38. Cong, K.; Zhang, Y.U.; Gan, Y.; Li, Q.H. Experimental study of the ignition temperatures of low-rank coals using TGA under oxygen-deficient conditions. J. Therm. Anal. Calorim. 2018, 133, 1597–1607. [Google Scholar] [CrossRef]
  39. Müsellim, E.; Tahir, M.H.; Ahmad, M.S.; Ceylan, S. Thermokinetic and TG/DSC-FTIR study of pea waste biomass pyrolysis. Appl. Therm. Eng. 2018, 137, 54–61. [Google Scholar] [CrossRef]
  40. White, J.E.; Catallo, W.J.; Legendre, B.L. Biomass pyrolysis kinetics: A comparative critical review with relevant agricultural residue case studies. J. Anal. Appl. Pyrolysis 2011, 91, 1–33. [Google Scholar] [CrossRef]
  41. Idris, S.S.; Rahman, N.A.; Ismail, K.; Alias, A.B.; Rashid, Z.A.; Aris, M.J. Investigation on thermochemical behaviour of low rank Malaysian coal, oil palm biomass and their blends during pyrolysis via thermogravimetric analysis (TGA). Bioresour. Technol. 2010, 101, 4584–4592. [Google Scholar] [CrossRef]
  42. Zhou, H.; Long, Y.Q.; Meng, A.H.; Chen, S.; Li, Q.H.; Zhang, Y.G. A novel method for kinetics analysis of pyrolysis of hemicellulose, cellulose, and lignin in TGA and macro-TGA. RSC Adv. 2015, 5, 26509–26516. [Google Scholar] [CrossRef]
  43. Zhou, H.; Long, Y.Q.; Meng, A.H.; Li, Q.H.; Zhang, Y.G. The pyrolysis simulation of five biomass species by hemi-cellulose, cellulose and lignin based on thermogravimetric curves. Thermochim. Acta 2013, 566, 36–43. [Google Scholar] [CrossRef]
  44. Zhou, H.; Meng, A.H.; Long, Y.Q.; Li, Q.H.; Zhang, Y.G. Interactions of municipal solid waste components during pyrolysis: A TG-FTIR study. J. Anal. Appl. Pyrolysis 2014, 108, 19–25. [Google Scholar] [CrossRef]
  45. Chen, R.J.; Zhang, S.Y.; Cong, K.L.; Li, Q.H.; Zhang, Y.G. Insightinto synergistic effects of biomass -polypropylene co -pyrolysis using representative biomass constituents. Bioresour. Technol. 2020, 307, 8. [Google Scholar] [CrossRef] [PubMed]
  46. Wu, X.; Wu, Y.; Wu, K.; Chen, Y.; Hu, H.; Yang, M. Study on pyrolytic kinetics and behavior: The co-pyrolysis of microalgae and polypropylene. Bioresour. Technol. 2015, 192, 522–528. [Google Scholar] [CrossRef] [PubMed]
  47. Cong, K.L.; Han, F.; Zhang, Y.G.; Li, Q.H. The investigation of co-combustion characteristics of tobacco stalk and low rank coal using a macro-TGA. Fuel 2019, 237, 126–132. [Google Scholar] [CrossRef]
  48. Önal, E.; Uzun, B.B.; Pütün, A.E. Bio-oil production via co-pyrolysis of almond shell as biomass and high density polyethylene. Energy Convers. Manag. 2014, 78, 704–710. [Google Scholar] [CrossRef]
Figure 1. TG and DTG curves of MC (a,b) and SBS (c,d) at heating rates of 10, 20, and 30 °C min−1.
Processes 09 01335 g001
Figure 2. TG and DTG curves of samples with different mixing ratios at heating rates of 10 (a,b), 20 (c,d), and 30 (e,f) °C min−1 (“XXMCYYSBS” means the mixed sample containing XX% MC and YY% SBS).
Processes 09 01335 g002
Figure 3. The TG comparison of mixture experiments and linear combinations of pyrolysis of samples with different mixing ratios. (a) Mixture of 90% MC and 10% SBS (90MC10SBS); (b) mixture of 70% MC and 30% SBS (70MC30SBS); (c) mixture of 50% MC and 50% SBS (50MC50SBS); (d) mixture of 30% MC and 70% SBS (30MC70SBS); (e) mixture of 10% MC and 90% SBS (10MC90SBS).
Processes 09 01335 g003
Figure 4. The DTG comparison of mixture experiments and linear combinations of pyrolysis of samples with different mixing ratios. (a) Mixture of 90% MC and 10% SBS (90MC10SBS); (b) mixture of 70% MC and 30% SBS (70MC30SBS); (c) mixture of 50% MC and 50% SBS (50MC50SBS); (d) mixture of 30% MC and 70% SBS (30MC70SBS); (e) mixture of 10% MC and 90% SBS (10MC90SBS).
Processes 09 01335 g004
Figure 5. Co-pyrolysis interaction indices of samples with different mixing ratios (“XXMCYYSBS” means the mixed sample containing XX% MC and YY% SBS). (a) Δw; (b) ΔDTG.
Processes 09 01335 g005
Table 1. Proximate and ultimate analyses of MC and SBS.
SamplesMCSBS
Proximate analysis/wt%
Ash, db0.005.97
Volatile matter, daf85.6694.03
Fixed carbon, db14.340.00
Ultimate analysis/wt%, db
C42.2181.92
H6.2511.42
O (by difference)51.296.37
N0.210.25
S0.040.05
db, dry basis. daf, dry ash-free basis.
Table 2. Kinetics parameters of samples with different mixing ratios.
MaterialConversion (%)T (°C)E (kJ/mol) E ¯ (kJ/mol) R2
MC20336.2174.8183.30.9980
40345.5183.90.9999
60353.0183.80.9999
80360.9190.90.9996
90MC10SBS20337.6185.6184.60.9990
40347.9189.20.9982
60356.5184.00.9997
80367.9179.70.9992
70MC30SBS20341.9171.2212.00.9995
40353.8181.30.9960
60368.0202.50.9925
80454.1292.90.9952
50MC50SBS20346.8170.0232.60.9980
40363.5188.20.9990
60443.7303.30.9080
80461.7268.81.0000
30MC70SBS20356.0135.7224.40.9936
40438.4210.70.9842
60452.7254.80.9999
80466.5296.50.9990
10MC90SBS20435.0197.0219.50.9741
40446.7239.20.9989
60456.2232.01.0000
80467.4210.00.9990
SBS20438.1263.4281.20.9999
40445.6280.00.9980
60454.0284.60.9956
80464.5296.81.0000
Publisher’s Note: MDPI stays neutral with regard to jurisdictional claims in published maps and institutional affiliations.

