Article

Optimization of Microwave-Assisted Extraction of Polyphenols from Lemon Myrtle: Comparison of Modern and Conventional Extraction Techniques Based on Bioactivity and Total Polyphenols in Dry Extracts

1
School of Environmental and Life Sciences, College of Engineering, Science and Environment, The University of Newcastle, Ourimbah, NSW 2258, Australia
2
Department of Agro Product Processing Technology, Faculty of Applied Science and Technology, Jashore University of Science and Technology, Jashore 7408, Bangladesh
*
Authors to whom correspondence should be addressed.
Processes 2021, 9(12), 2212; https://doi.org/10.3390/pr9122212
Submission received: 3 November 2021 / Revised: 3 December 2021 / Accepted: 4 December 2021 / Published: 8 December 2021
(This article belongs to the Special Issue Extraction Optimization Processes of Antioxidants)

Abstract

:
The aromatic herb lemon myrtle is a good source of polyphenols, with high antioxidant and antimicrobial capacity. In this study, the green extraction technique microwave-assisted extraction (MAE) was applied and the extraction parameters were optimized using response surface methodology (RSM) to maximize the extraction yield of phenolic compound and antioxidant properties. Then, it was compared with other popular novel and conventional extraction techniques including ultrasound-assisted extraction (UAE) and shaking water bath (SWB) to identify the most effective technique for extraction of phenolic compounds from lemon myrtle. The results showed that the MAE parameters including radiation time, power, and sample to solvent ratio had a significant influence on the extraction yield of phenolic compounds and antioxidant capacity. The optimal MAE conditions were radiation time of 6 min, microwave power of 630 W, and sample to solvent ratio of 6 g/100 mL. Under optimal conditions, MAE dry extract had similar levels of total phenolic compounds (406.67 ± 8.57 mg GAE/g DW), flavonoids (384.57 ± 2.74 mg CE/g DW), proanthocyanidins (336.54 ± 7.09 mg CE/g DW), antioxidant properties, and antibacterial properties against (Staphylococcus lugdunensis and Bacillus cereus) with the other two methods. However, MAE is eight-times quicker and requires six-times less solvent volume as compared to UAE and SWB. Therefore, MAE is recommended for the extraction of polyphenols from lemon myrtle leaf.

1. Introduction

Phenolic compounds are non-nutritive phytochemical groups synthesized in the plant as secondary metabolites. Despite the lack of nutritional attributes, they have been widely used as natural antioxidants and antimicrobial agents in foods [1,2]. In addition, they have been used as supplements or therapeutic agents for prevention and/or delay several health complications such as cancer, diabetes, neurodegeneration, early aging, inflammation, hypertension, allergies, arthritis, and cardiovascular diseases [3,4,5]. Lemon myrtle leaves are rich in polyphenols with strong antioxidant properties [6,7]. Polyphenols derived from lemon myrtle leaves also have various bioactivities such as anti-inflammation [8,9], antimicrobial [10,11], cytoprotective, and pro-apoptotic properties [12].
Lemon myrtle leaves have been used as traditional medicine and in cuisine for centuries [13]. The leaves also contain a refreshing sweet lemon-flavored essential oil, which also has numerous applications in various sectors. More applications of lemon myrtle are being explored through the advancement of research [13] and its demand is rising with time. To meet the demand it has been growing commercially in different parts of the world, though it is native to the Australian coastal rainforest of Queensland and New South Wales [14,15]. Initially, it was identified as an aromatic plant and a potential source of essential oil, and it is still, mainly produced for essential oil. Despite numerous benefits of lemon myrtle polyphenols, research on extraction and isolation of polyphenols from lemon myrtle leaves, effects of various extraction methods and conditions on extraction yield and their properties are very limited up to date.
Extraction is the first crucial step to isolate the polyphenols from plant material for chromatographic identification and quantification or further applications [16]. Neverthe-less, the development of an optimal extraction procedure (i.e., suitable method and extraction conditions) for polyphenols from biological material is complicated because of the structural diversity, and stability of the phenolic compounds under various extraction conditions [17]. The selection of inappropriate extraction methods/conditions may lessen the extraction yield of phenolics and their bioactivity [18]. The selection of extraction method and/or conditions depends on several factors including cost and time effectiveness, the final use of the extract, and most importantly the extraction yield of phytochemicals and retention of their biological activities. Conventionally, the phenolic compounds are extracted under stirring conditions for long hours, requiring a large volume of solvent under vigorous agitation and/or high temperature [19]. Extraction in high temperatures and/or long extraction time may lead to damage of expected phenolic compounds and/or release of toxic substances from the plant material [20,21].
Modern extraction techniques such as microwave-assisted extraction and ultra-sound-assisted extraction might overcome the drawbacks of conventional extraction techniques [22,23]. These modern techniques can extract the target compounds with higher yields while using less solvent and time as compared to conventional techniques [24]. Ultrasound creates cavitation and mechanical mixing effects, which helps the disruption of plant cells and penetration of solvent into the plant cells [19]. On the other hand, micro-waves interact with a polar solvent (asymmetric electron cloud), which generates heat in the extraction solvent by dipole rotation. This heat creates internal pressure in the plant sample cells, eventually, it disrupts and its internal phytochemicals are released [25]. Sample to solvent ratio, radiation time and applied power level (microwave/ultrasound), sample particle size, solvent concentration, and pH are the main factors, which influence the extraction yield of phenolic compounds [18]. However, investigation and optimization of their effects using single-factor analysis are laborious, time-consuming, and unable to determine the interaction effects of various parameters on the extraction yields [26]. Response surface methodology (RSM) is known as an effective technique to identify the interaction effects and optimize the processing parameters on extraction yields of the target compounds [27].
In previous studies, we investigated the impact of extraction solvents and optimized UAE conditions for polyphenols from lemon myrtle and found that extraction solvents significantly affect the extraction yield of phenolic compounds and antioxidant properties of lemon myrtle, and 50% acetone in water is the most effective solvent [28]. However, chlorophyll content, antibacterial properties, and extraction methods comparison were not considered in that study. Therefore, this study investigate the impact of major MAE factors including radiation time, radiation power, and sample to solvent ratio using 50% aqueous acetone as extraction solvent, and optimize the MAE conditions for polyphenols and antioxidant capacity using RSM. In addition, this study comprehensively compared the effectiveness of the MAE technique with UAE and a conventional extraction technique shaking water bath (SWB). The total polyphenols, antioxidants properties, chlorophyll content, and antibacterial properties of the extracts were compared in order to identify the most effective extraction technique for the recovery of polyphenol from lemon myrtle leaves for future applications.

2. Materials and Methods

2.1. Plant Materials

Lemon myrtle leaves were authenticated through the herbarium at the University of Newcastle, Australia with voucher number 10638. The leaves were collected randomly from Ourimbah, Central coast region, NSW, Australia. After collecting, the leaves were immediately transferred to the lab and dipped into liquid nitrogen then dried using a freeze dryer (SP Scientific, Bench Top Pro BTP-3ESE0X, Warminster, Philadelphia, PA, USA) for 24 h. Then the dried leaves were ground using a commercial blender (John Morris Scientific, Chastwood, NSW, Australia) and manually sieved through a standard 1.4-mm mesh sieve (EFL 2000; Endecotts Ltd., London, UK) respectively, and finally kept in an airtight container for extraction and analysis.

2.2. Chemical and Reagents

All the solvents, chemicals, and reagents used in this study were analytical grade. The organic solvents acetone (99%), ethanol (>99%), and methanol (>99%) were purchased from Merck (Darmstadt, Germany). For different phenolic compounds and antioxidant capacity assays. Folin–Ciocalteu’s reagent and other chemicals anhydrous sodium carbonate (Na2CO3) (99.95%), sodium nitrite (NaNO2) (99%), hydrochloric acid (HCl) (36%), potassium persulfate (K2S2O8) (≥99%), copper (II) chloride (CuCl2) (97%), ferric chloride (FeCl3) (97%), aluminum chloride six hydrate (AlCl3•6H2O) (99%), ammonium acetate (≥99%), 2,2-diphenyl-1-picrylhydrazyl (DPPH), 2,2-Azino-bis (3-ethylbenzothiazoline-6-sulfonic acid) diammonium salt (ABTS) (≥98%), (±)-6-hydroxy-2,5,7,8-tetramethylchroman-2-carboxylic acid (Trolox) (97%), 2, 4, 6-tripyridyl-s-triazine (TPTZ), neocuproine (≥98%), gallic acid, and catechin were purchased from Sigma-Aldrich Pty Ltd. (Castle Hill, Sydney, Australia). Vanillin (99%) and sodium hydroxide (NaOH) were obtained from Merck (Darmstadt, Germany). For antibacterial analysis nutrient agar, nutrient broth, and Mueller Hinton agar were purchased from Thermo Fisher Scientific Australia Pty Ltd. (Victoria, Australia).

2.3. Experimental Design

In this study, three extraction techniques were applied including MAE, UAE, and SWB. A 50% aqueous acetone was applied as the extraction solvent as it is the most effective solvent for the extraction from lemon myrtle leaves [28]. Optimal MAE conditions including radiation time, radiation power, and sample to solvent ratio were established as described in Section 2.3.1. Optimal conditions for the UAE extraction technique were applied as described in our previous study [28] and SWB extraction was performed as mentions in the following section. After lemon myrtle leaves were extracted under optimal MAE, UAE, and SWB, the extracts were concentrated to around 30% of initial volume using a rotary evaporator (Buchi Rotavapor R-114, Buchi Australia, Noble Park, VIC, Australia) set at 40 °C and pressure of 150 mbar, which was gradually decreased to 50 mbar and further freeze dried to obtain powdered extracts. Finally, the powdered extract (500 µg) from each extraction technique was diluted in 50% aqueous acetone (1 mL) for further analysis.

2.3.1. Optimization of MAE Conditions Using Response Surface Methodology (RSM)

MAE was performed using a partially modified domestic microwave oven (Pana-sonic NN-7855, Japan) as described previously [29]. The sample and solvent were put into the oven in a round bottom flask then it was connected to a condenser through a glass tube (Figure 1). The MAE extraction parameter’s values were selected according to RSM design (Table 1). After extraction, the extract was cooled down to room temperature in an ice bath followed by filtering through a 0.45 µm cellulose syringe filter (Phenomenex Australia Pty. Ltd., Lane Cove, NSW, Australia). The filtrate was stored at −18 °C for further analysis and also for freeze drying to obtain powdered extract for comparison.
A three-level three-factor Box–Behnken design was used to observe the individual, interaction, and quadratic effect of extraction parameters on the extraction yield of phenolic compounds and antioxidant capacities and to find out the optimal extraction conditions for the maximum yield of phenolic compounds and antioxidant properties. The extraction parameters were radiation time (X1): 2–6 min, microwave power level (X2): 10% (90 W)–100% (900 W), sample to solvent ratio X3: 2–8 g/100 mL. The parameters range was selected based on initial experiments (data not presented in this manuscript). A second-order polynomial equation represents a functional relationship between the predicted yield of phenolic or antioxidant properties and extraction parameters, which was as follows:
Y = β 0 + i = 1 n β i X i + i = j i < j n 1 j = 2 n β i j X i X j + i = 1 n β i i X i 2

2.3.2. Ultrasound-Assisted Extraction (UAE)

UAE was performed under optimal conditions as previously described [28] using an ultrasonic bath (Soniclean, 220 V, 50 Hz, and 250 W, Soniclean Pty LTD, Dudley Park, SA, Australia). A preheated (at 60 °C) volume of 25 mL of 50% acetone in water was added with 0.25 g of dried ground lemon myrtle leaves in a 50-mL centrifuge tube with a screw cap. The sonication bath was preheated at 60 °C and the UAE conditions were time (50 min), temperature (60 °C), and sonication power (250 W). During extraction, the tubes were vortexed for 2–3 s every 5 min. After finishing extraction the tubes were cooled down to room temperature in an ice bath followed by filtering using a 0.45-µm cellulose syringe filter (Phenomenex Australia Pty. Ltd., NSW, Australia) and stored at −18 °C for further freeze drying to obtain powdered extract for comparison.

2.3.3. Conventional Extraction Using Shaking Water Bath Extraction (SWB)

The conventional extraction was performed by following Saifullah, et al. [30] with modifications. Shaking water bath extraction was performed in a pre-heated shaking water bath at 60 °C and under the extraction conditions of time 50 min, temperature 60 °C, and sample to a solvent ratio 1 g/100 mL. Then, 0.25 g of freeze-dried ground lemon myrtle leaves and 25 mL of solvent (50% aqueous acetone) were put into a 50-mL centrifuge tube. Then the tube was closed with a lid before being put into the shaking water bath. During extraction, the samples were agitated at a constant speed. At the end of extraction, the tubes were immediately cooled to room temperature in an ice bath and then the extract was filtered using a 0.45-μm cellulose syringe filter (Phenomenex Australia Pty. Ltd., Australia) and stored at −18 °C for further freeze drying to obtain powdered extract for comparison.

2.4. UV Spectrophotometric Measurement of Total Phenolics (TPC), Flavonoids (TFC), and Proanthocyanidins (Pro. A)

TPC, TFC, and Pro. A were measured according to the method described by Škerget et al. [31], Zhishen, Mengcheng, and Jianming [32], and Li et al. [33] respectively. A UV spectrophotometr (Cary 60 Bio, UV-Vis, Penang, Malaysia) was used to measure the absorbance of light (wavelength 765, 510, and 500 nm for TPC, TFC, and Pro. A, respectively). TPC results were expressed as milligrams of gallic acid equivalent per gram dry weight of the sample. TFC and Pro. A results were stated as milligrams of catechin equivalent per gram dry weight of the sample.

2.5. Measurement of Antioxidant Properties

Antioxidant properties of the extracts were measured using four antioxidant assays, including FRAP, ABTS, and DPPH assays Thaipong et al. [34], and CUPRAC assay Apak et al. [35]. The absorbance was taken at 593, 450, 734, and 515 nm for FRAP, CUPRAC, ABTS, and DPPH, respectively. Trolox was used to prepare the standard curves and the results were expressed as mM Trolox equivalent per gram dry weight of the sample.

2.6. Total Chlorophyll Content

Total chlorophyll content in leaf extract powder was measured according to a method reported by Sudhakar et al. [36] with some modifications. Then, 0.1 g of leaf extract was dissolved in 10 mL of 80% acetone in water followed by vortex to mix well. Then the optical density of the leaf extract solution was measured using a UV spectrophotometer (Cary 60 Bio, UV-Vis, Malaysia) at 663 and 645 nm. Finally, the amount of chlorophyll present in the dry extract was calculated using following equations:
mg   chlorophyll / g   dry   extract   = 20.2 A 645 + 8.02 A 663 × V 1000 × W
Here, A = absorbance at specific wavelengths, V = final volume of chlorophyll extract, and W = weight of dry powder

2.7. Antimicrobial Activity Assay

2.7.1. Bacterial Culture and Preparation of Inoculum

The antimicrobial activity of the extracts was investigated using agar disc diffusion technique. Two gram-positive and two gram-negative bacteria were used in this study. The bacterial cultures Escherichia coli (ATCC 10536), Enterobacter aerogenes (ATCC 13048), and Staphylococcus lugdunensis (ATCC 700328) were obtained from Thermo Scientific™ Oxoid™, Melbourne, Australia) in the form of Culti-Loops®. Bacillus cereus derived from (ATCC 11778™) KWIK-STIK was purchased from Cell Biosciences Pty Ltd., Melbourne, Australia). The bacterial inoculums were prepared according to a method described by Bhuyan et al. [37]. The bacterial cultures were prepared by growing the selected bacteria in nutrient broth at 37 °C for 24 h. Then sterile physiological saline was used to dilute the nutrient broth containing bacterial culture to adjust its turbidity to MacFarland turbidity standard of 0.5 (Oxoid™) (106 colony forming units per mL).

2.7.2. Disc Diffusion Bioassay

This assay was performed according to a method described by Chandrasekaran and Venkatesalu [38] and Bhuyan et al. [37]. In brief, the freeze dried extracts were dissolved in 5% dimethylsulfoxide (DMSO) to prepare concentrations of 15 and 20 mg/mL. A volume of 0.1 mL of bacterial inoculum was spread uniformly on Mueller Hinton agar (MHA) and allowed to dry for 5 min at room temperature. Antimicrobial susceptibility disks (6 mm) Thermo Scientific™ Oxoid™ were impregnated with 20 µL of extracts (concentration of 15 or 20 mg/mL) and left them drying at room temperature. A blank disc soaked with 5% DMSO commercial discs (Thermo Scientific™ Oxoid™) with ciprofloxacin (5 μg) was set as positive and negative control reference, respectively. The discs impregnated with extracts, positive and negative reference were placed on bacterial inoculated MHA plates using sterile forceps. The plates were incubated at 37 °C temperature for 24 h followed by the bacterial growth inhibition zone were measured.

2.8. Statistical Analysis

The RSM design was performed using a statistical software JMP (version 14), which was applied to predict the impact and optimize the extraction parameters for MAE. JMP was also applied to formulate an estimation model equation, create 2D counterplots, and 3D surface profiles. To compare the predicted values with experimental results paired sample t-test was performed using SPSS (IBM, Version 27). Different extraction methods were compared using all pairs Tukey–Kramer HSD. The difference between the mean values is considered statistically significant at p < 0.05. The experimental run and data accusation was performed at least three times (n = 3). For antimicrobial studies, experimental run performed at least three times and data accusation was performed at least nine times. The data are represented as mean ± standard deviation.

3. Result and Discussion

3.1. Investigation of MAE Influencing Factors and Optimisation of MAE Conditions

3.1.1. Accuracy of the Polynomial Prediction Models

The RSM develops polynomial model equations, which predict the value of the dependent variable in the response of independent variables [39]. In this study, the models predict the extraction yield value of phenolics and antioxidant levels in the lemon myrtle extract in response to the MAE parameters. Table 2 represents the analysis of variance (ANOVA) results, which shows how well the prediction models are fit to predict the extraction yield of phenolics and antioxidant capacity values in response to different extraction parameters.
A high coefficient of determination R2 value, significant p-value, insignificant (p > 0.5) lack of fit, and low root mean square error are commonly used as indicators to determine the suitability of the prediction models [30,40,41]. The R2 value is an index of the goodness of fit of the predicting models [42]. The ANOVA results show that the R2 values for phenolics and antioxidant capacities range from 0.91–0.97, which represents that above 91% of the experimental data can be explained by the predicting models. The adjusted R2 values ranged from 0.74–0.92, which also shows reliability of the models; as the R2 value above 0.70 represents a strong relationship. The significant p-values of the model and insignificant lack of fit values (at p < 0.05) for the phenolic compounds and antioxidant capacities further confirm the accuracy of the models. Low RMSE values further support the model fitting. The fitted polynomial model equation for polyphenols (TPC, TFC, and Pro. A), and antioxidants capacity (FRAP, CUPRAC, DPPH, and ABTS) are represented in Equations (3)–(9) as follows:
YTPC = 9.95 + 8.37X1 + 0.41X2 + 13.93X3 − 0.0095X1X2 − 0.57X1X3 + 0.02X2X3 − 0.0053X12 − 0.0026X22 − 1.04X32
YTFC = 20.28 + 12.28X1 + 0.61X2 + 4.28X3 − 0.021X1X2 − 0.55X1X3 + 0.004X2X3 − 0.43X12 − 0.003X22 − 0.15X32
YPro. A = 48.39 + 12.58X1 + 0.3X2 + 0.41X3 − 0.01X1X2 − 0.48X1X3 − 0.0001X2X3 − 0.46X12 − 0.001X22 + 0.15X32
YFRAP = −163.04 + 92.75X1 + 3.88X2 + 140.43X3 − 0.024X1X2 − 3.05X1X3 + 0.25X2X3 − 4.07X12 − 0.03X22 − 9.53X32
YCUPRAC = 351.55 + 505.91X1 + 14.65X2 + 864.91X3 − 1.69X1X2 − 51.16X2X3 + 1.84X2X3 + 15.34X12 − 0.06X22 − 51.50X32
YDPPH = −236.93 + 175.87X1 + 0.25X2 + 233.04X3 + 0.13X1X2 − 15.45X1X3 + 0.26X2X3 − 6.51X12 + 0.003X22 − 14.58X32
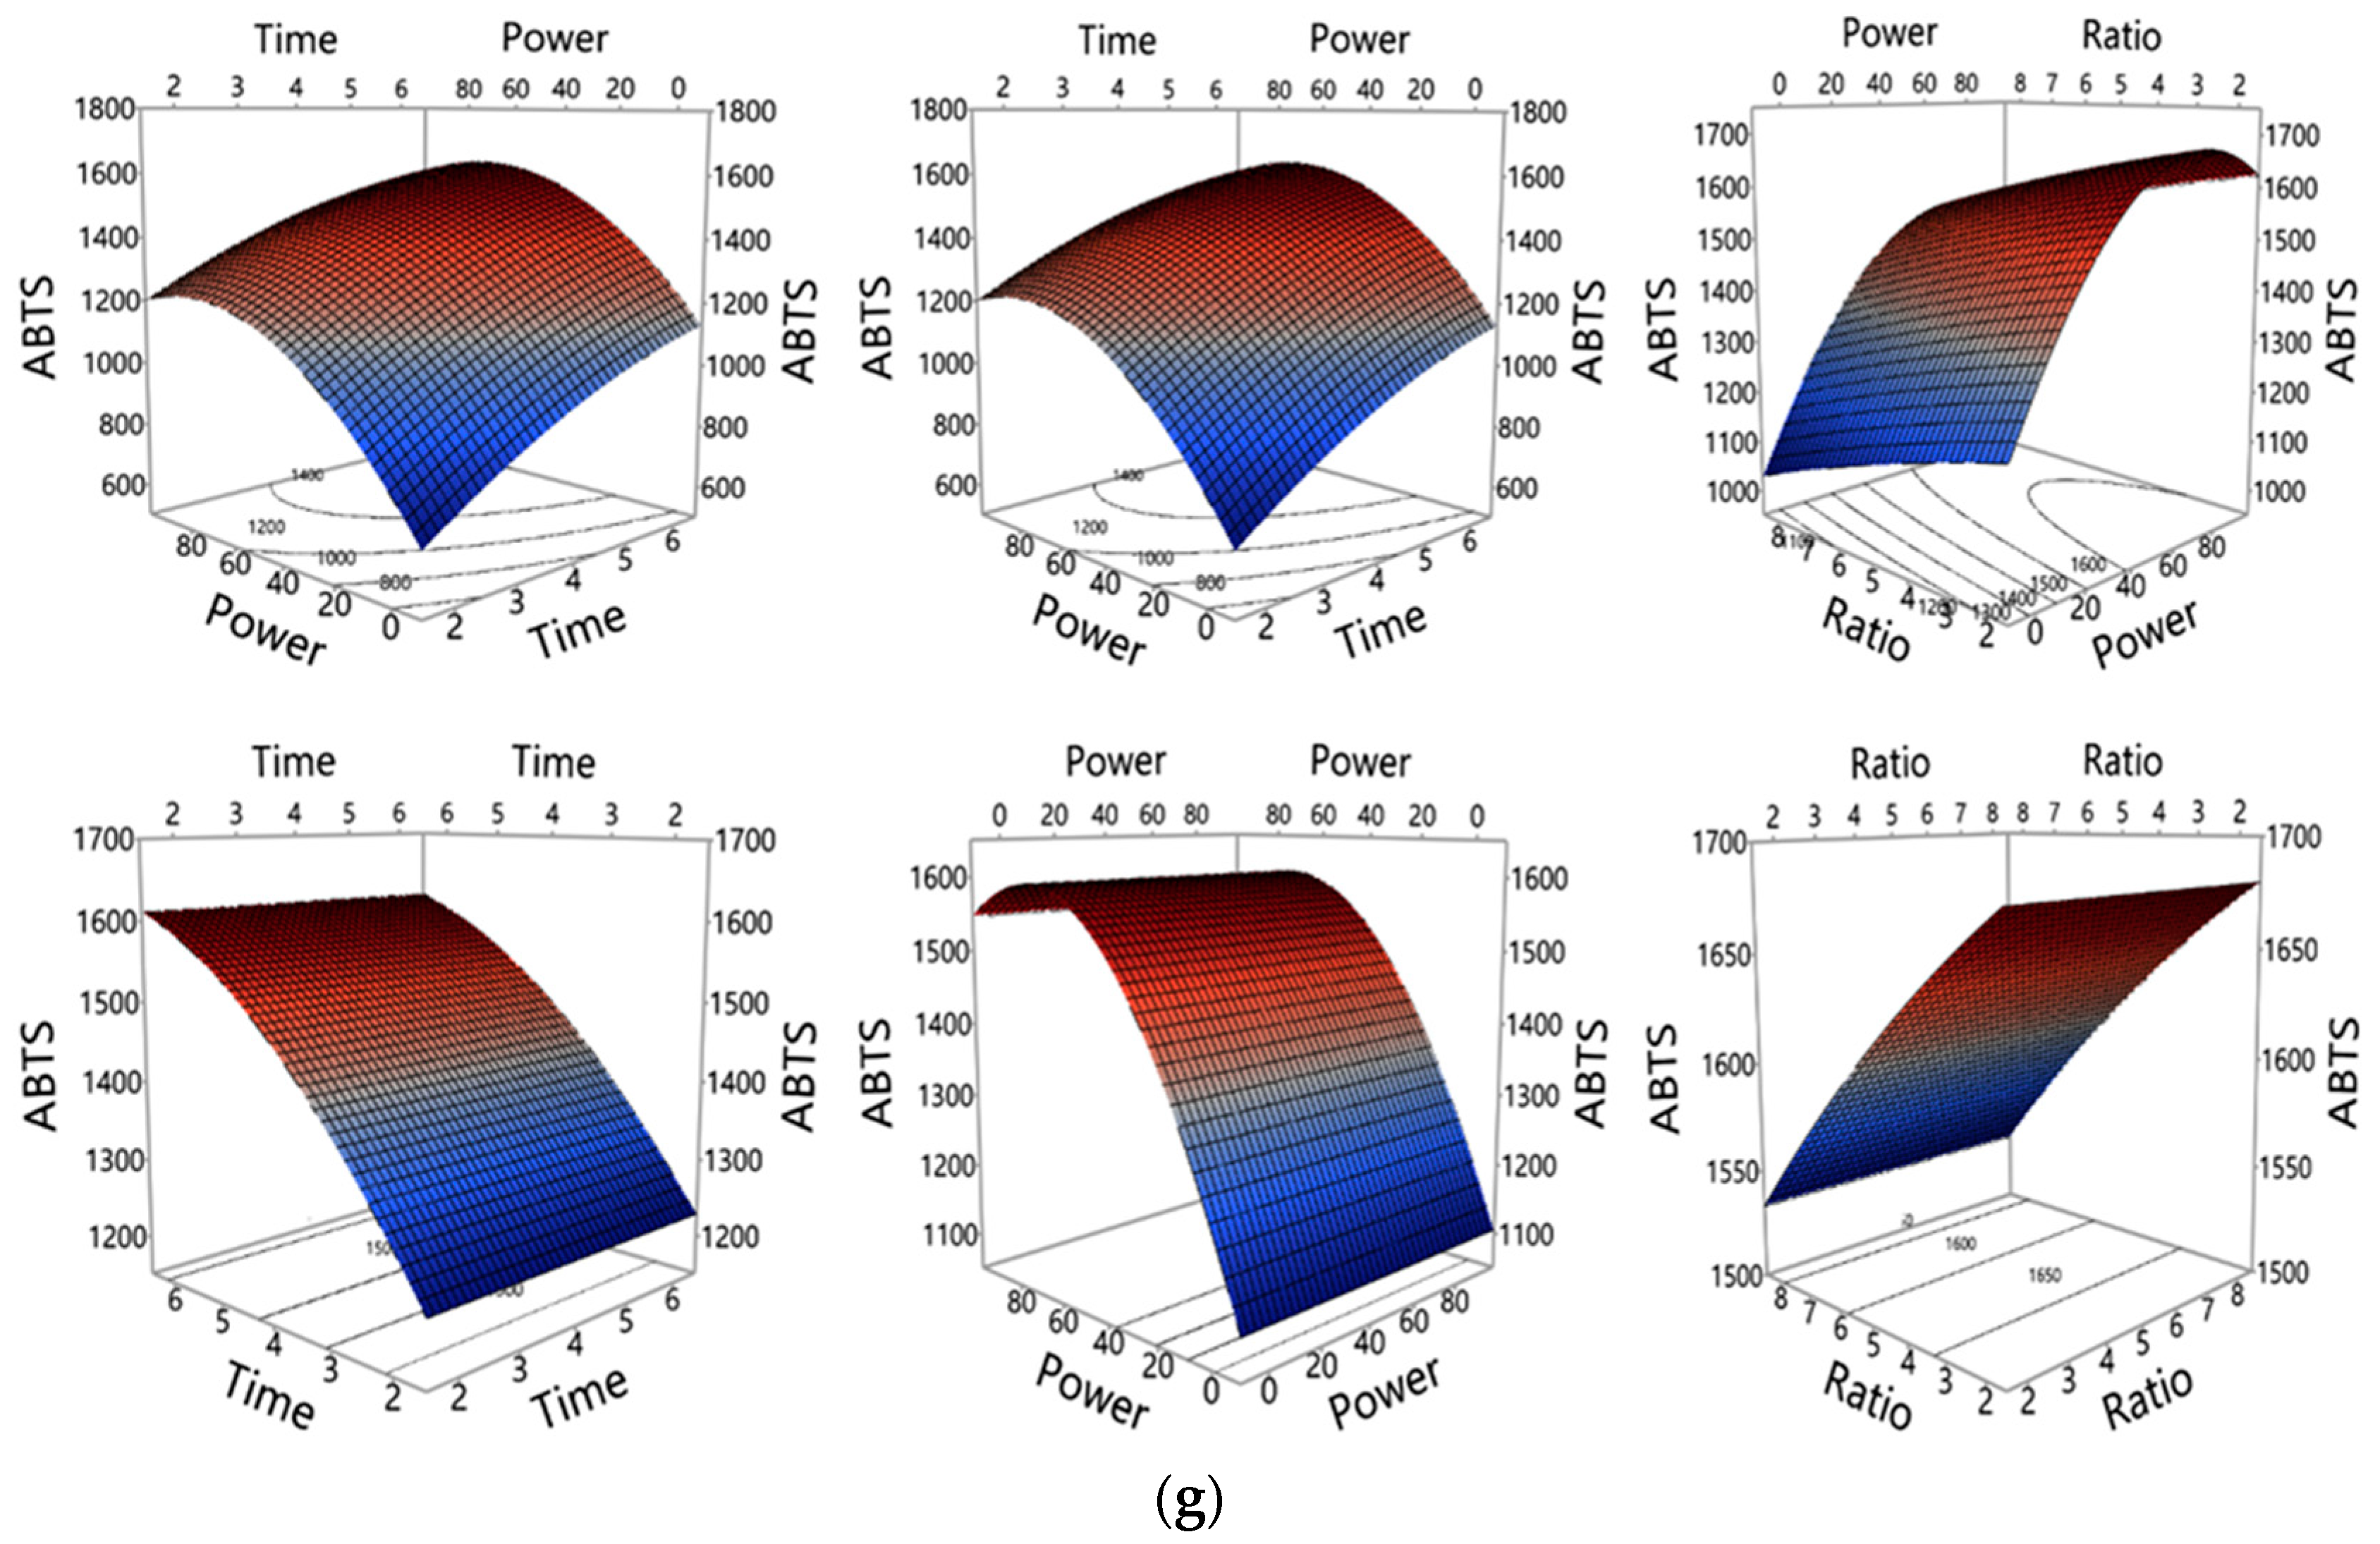
YABTS = 506.75 + 197.95X1 + 10.76X2 + 17.48X3 − 0.14X1X2 − 5.86X1X3 + 0.07X2X3 − 9.48X12 − 0.7X22 − 0.83X32

3.1.2. Influence of MAE Parameters on Polyphenols and Antioxidant Properties Yield

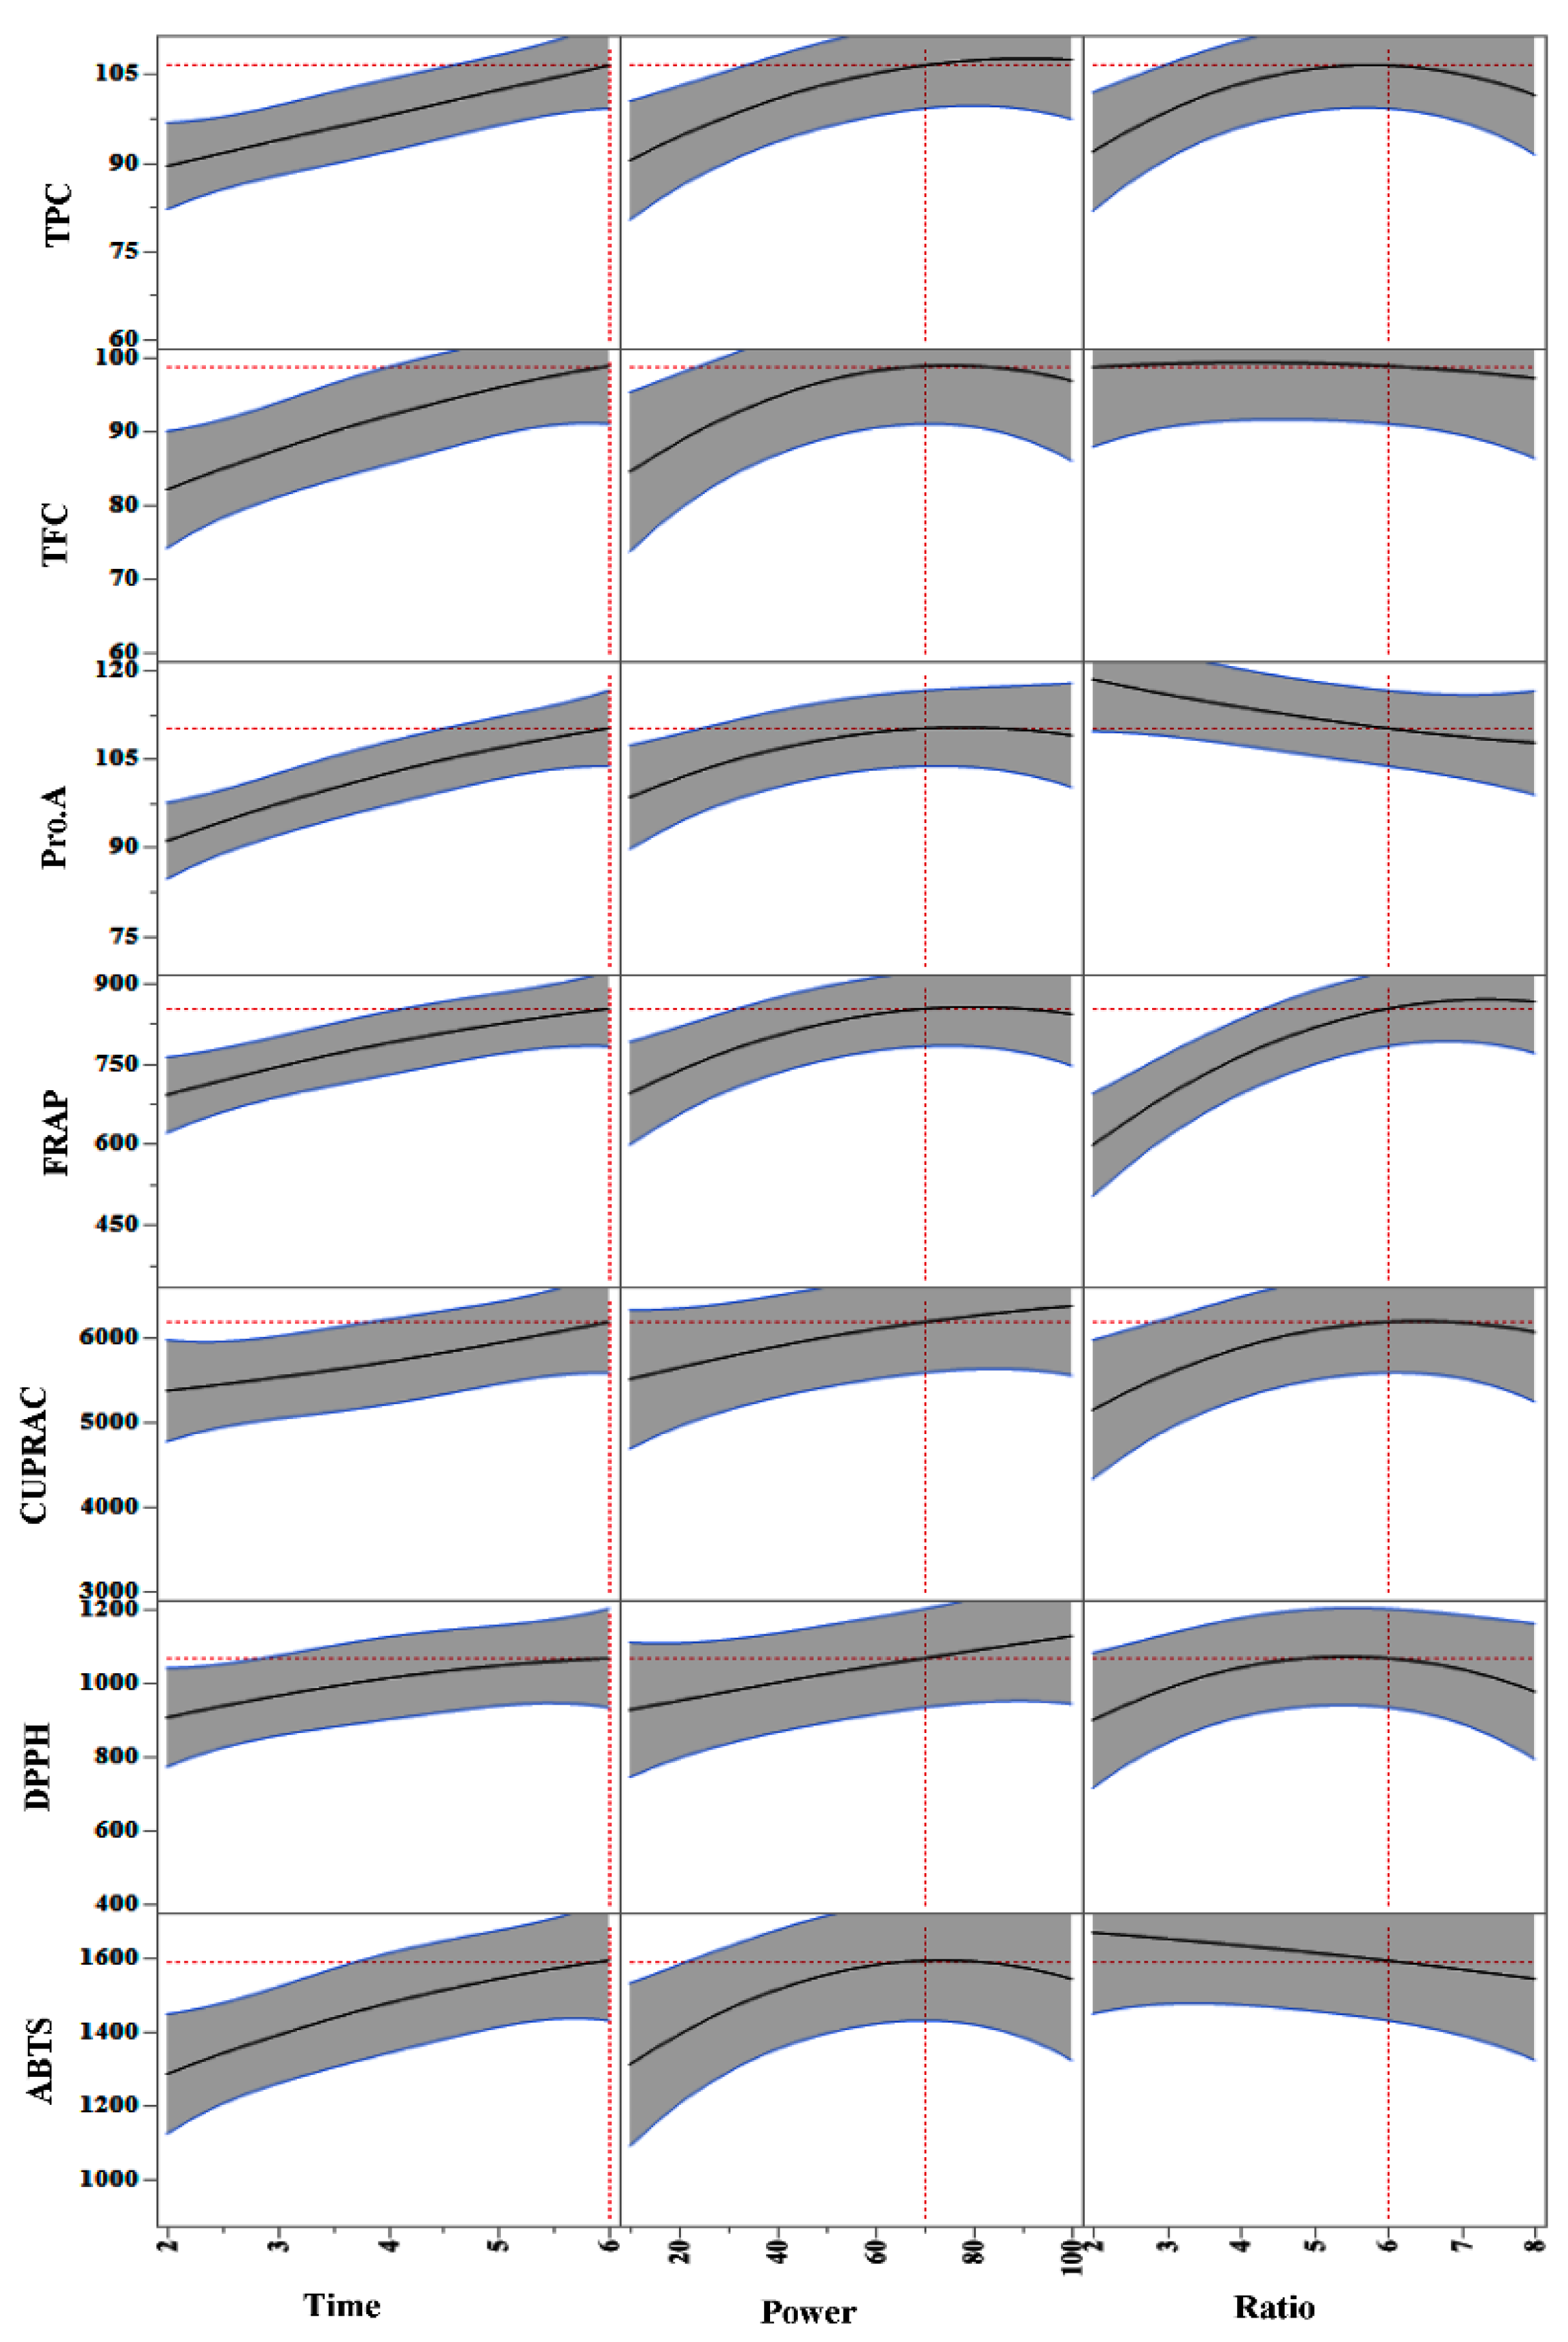
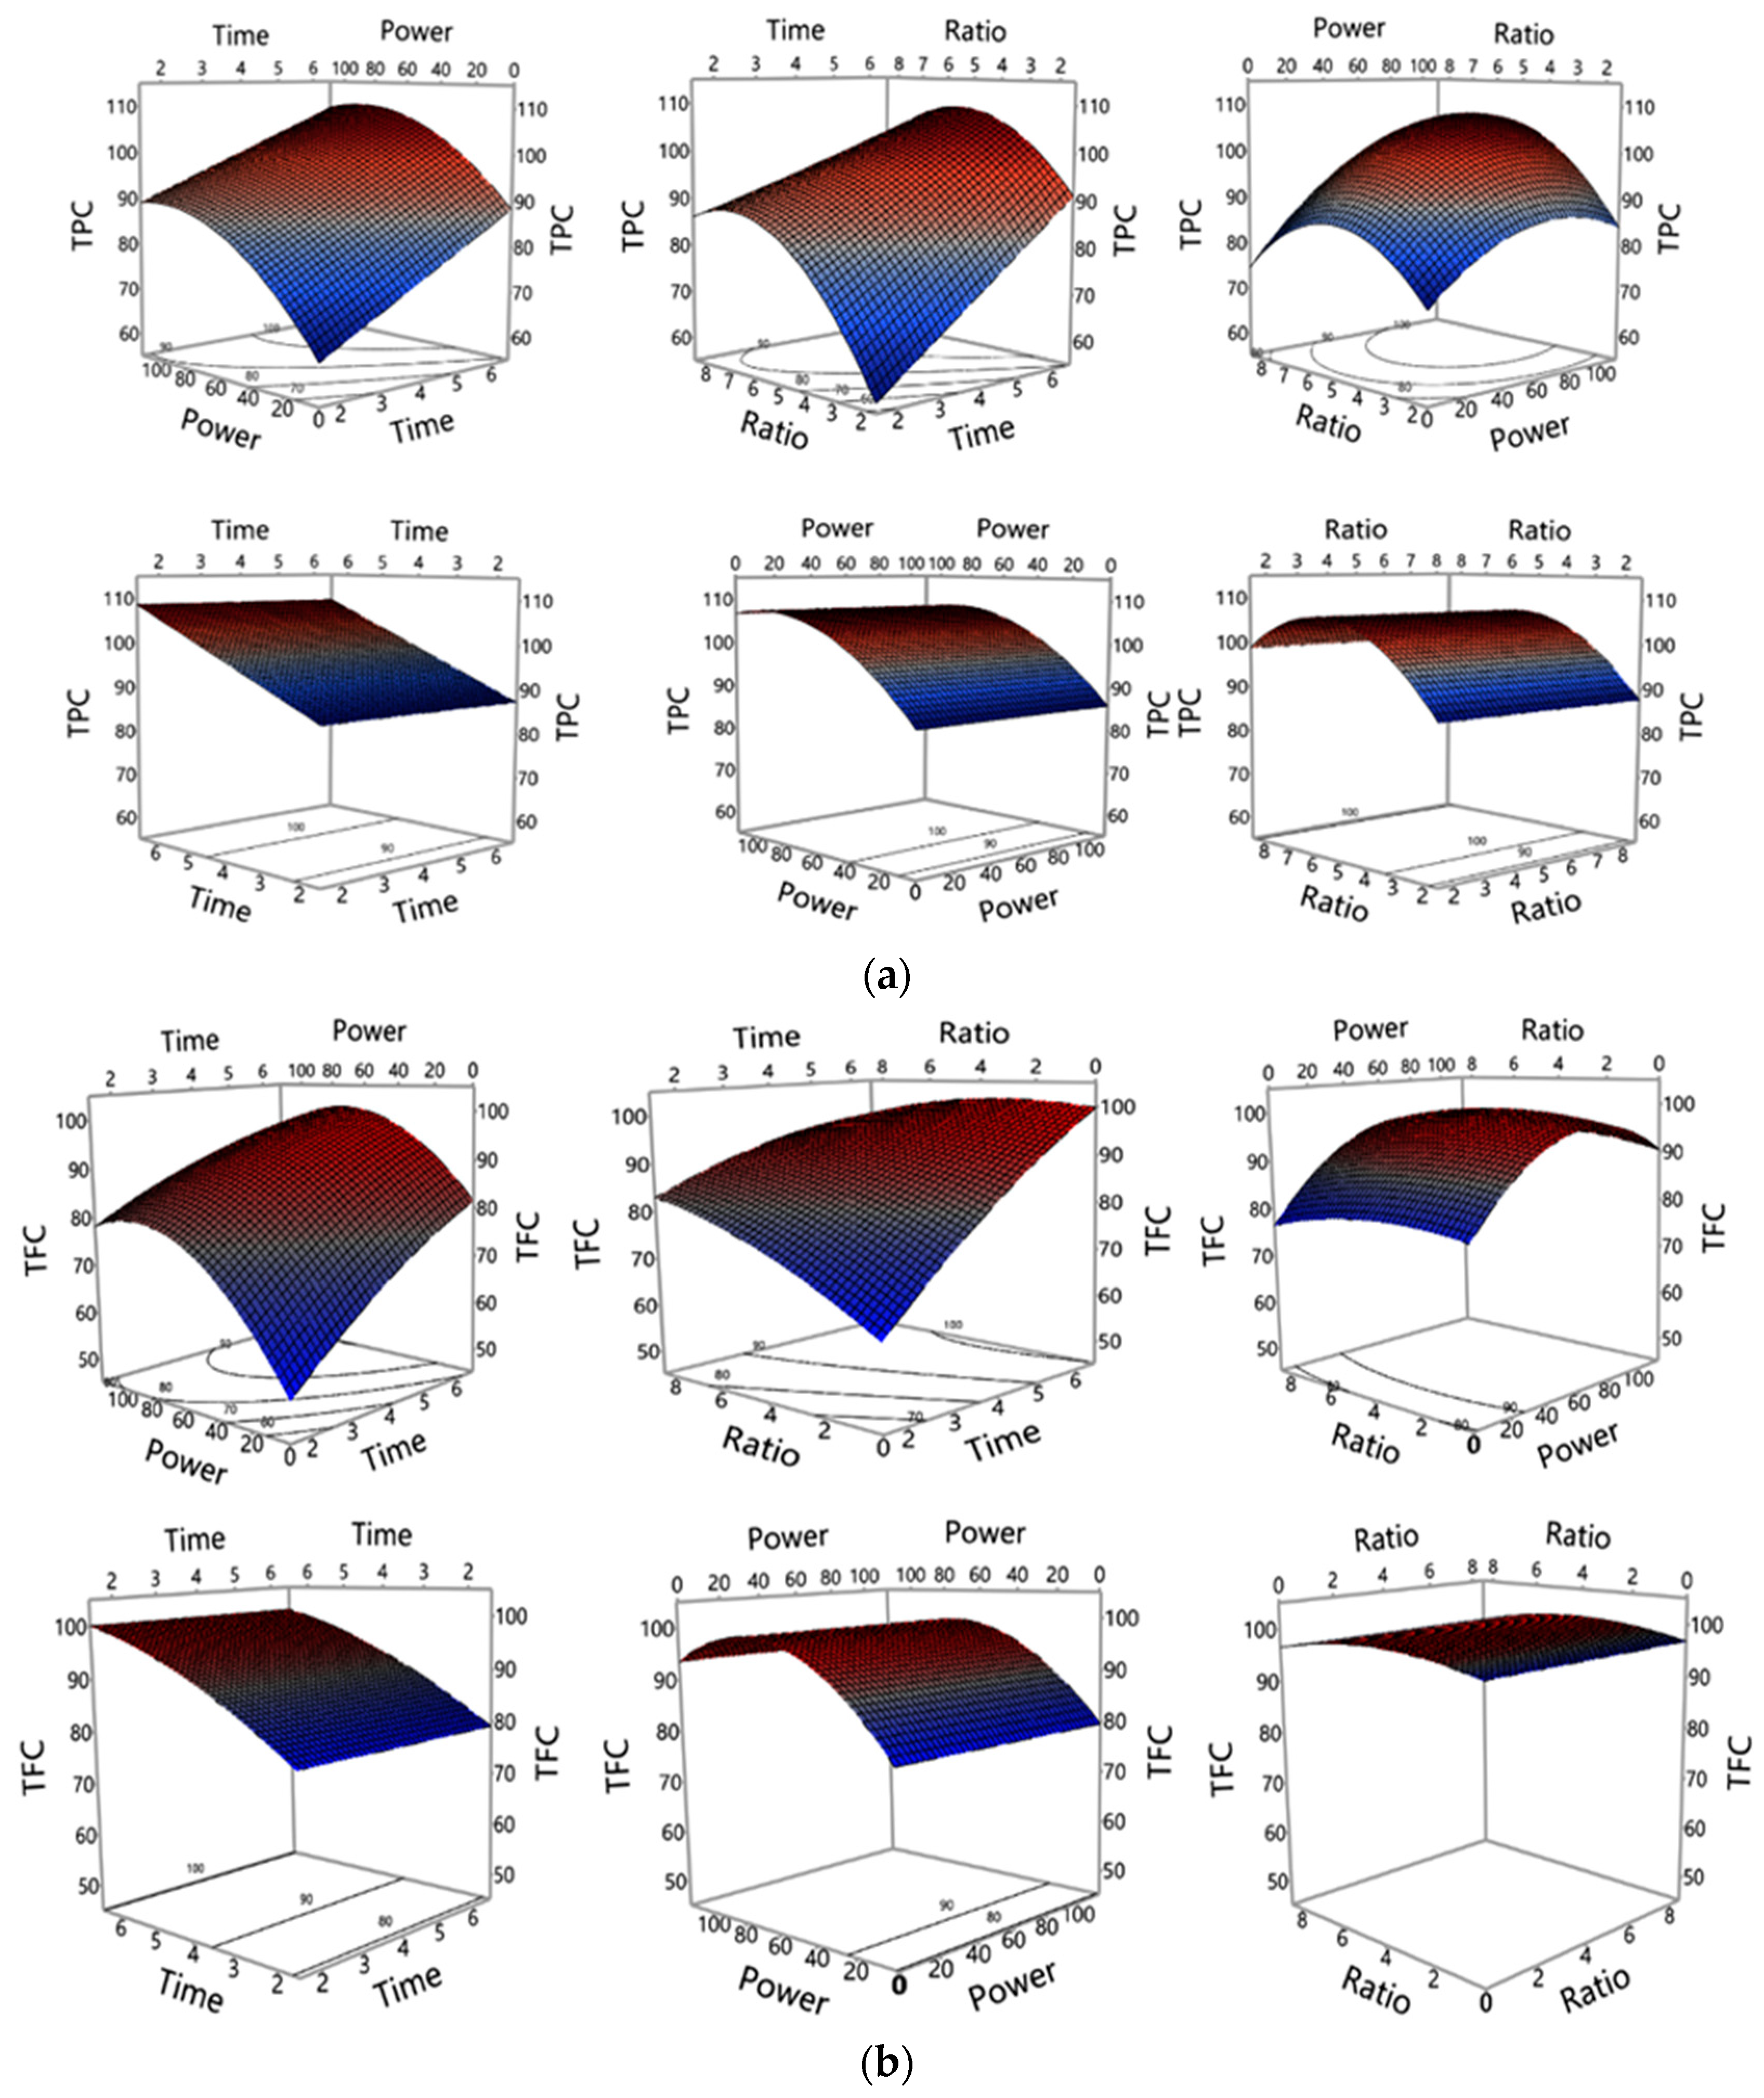
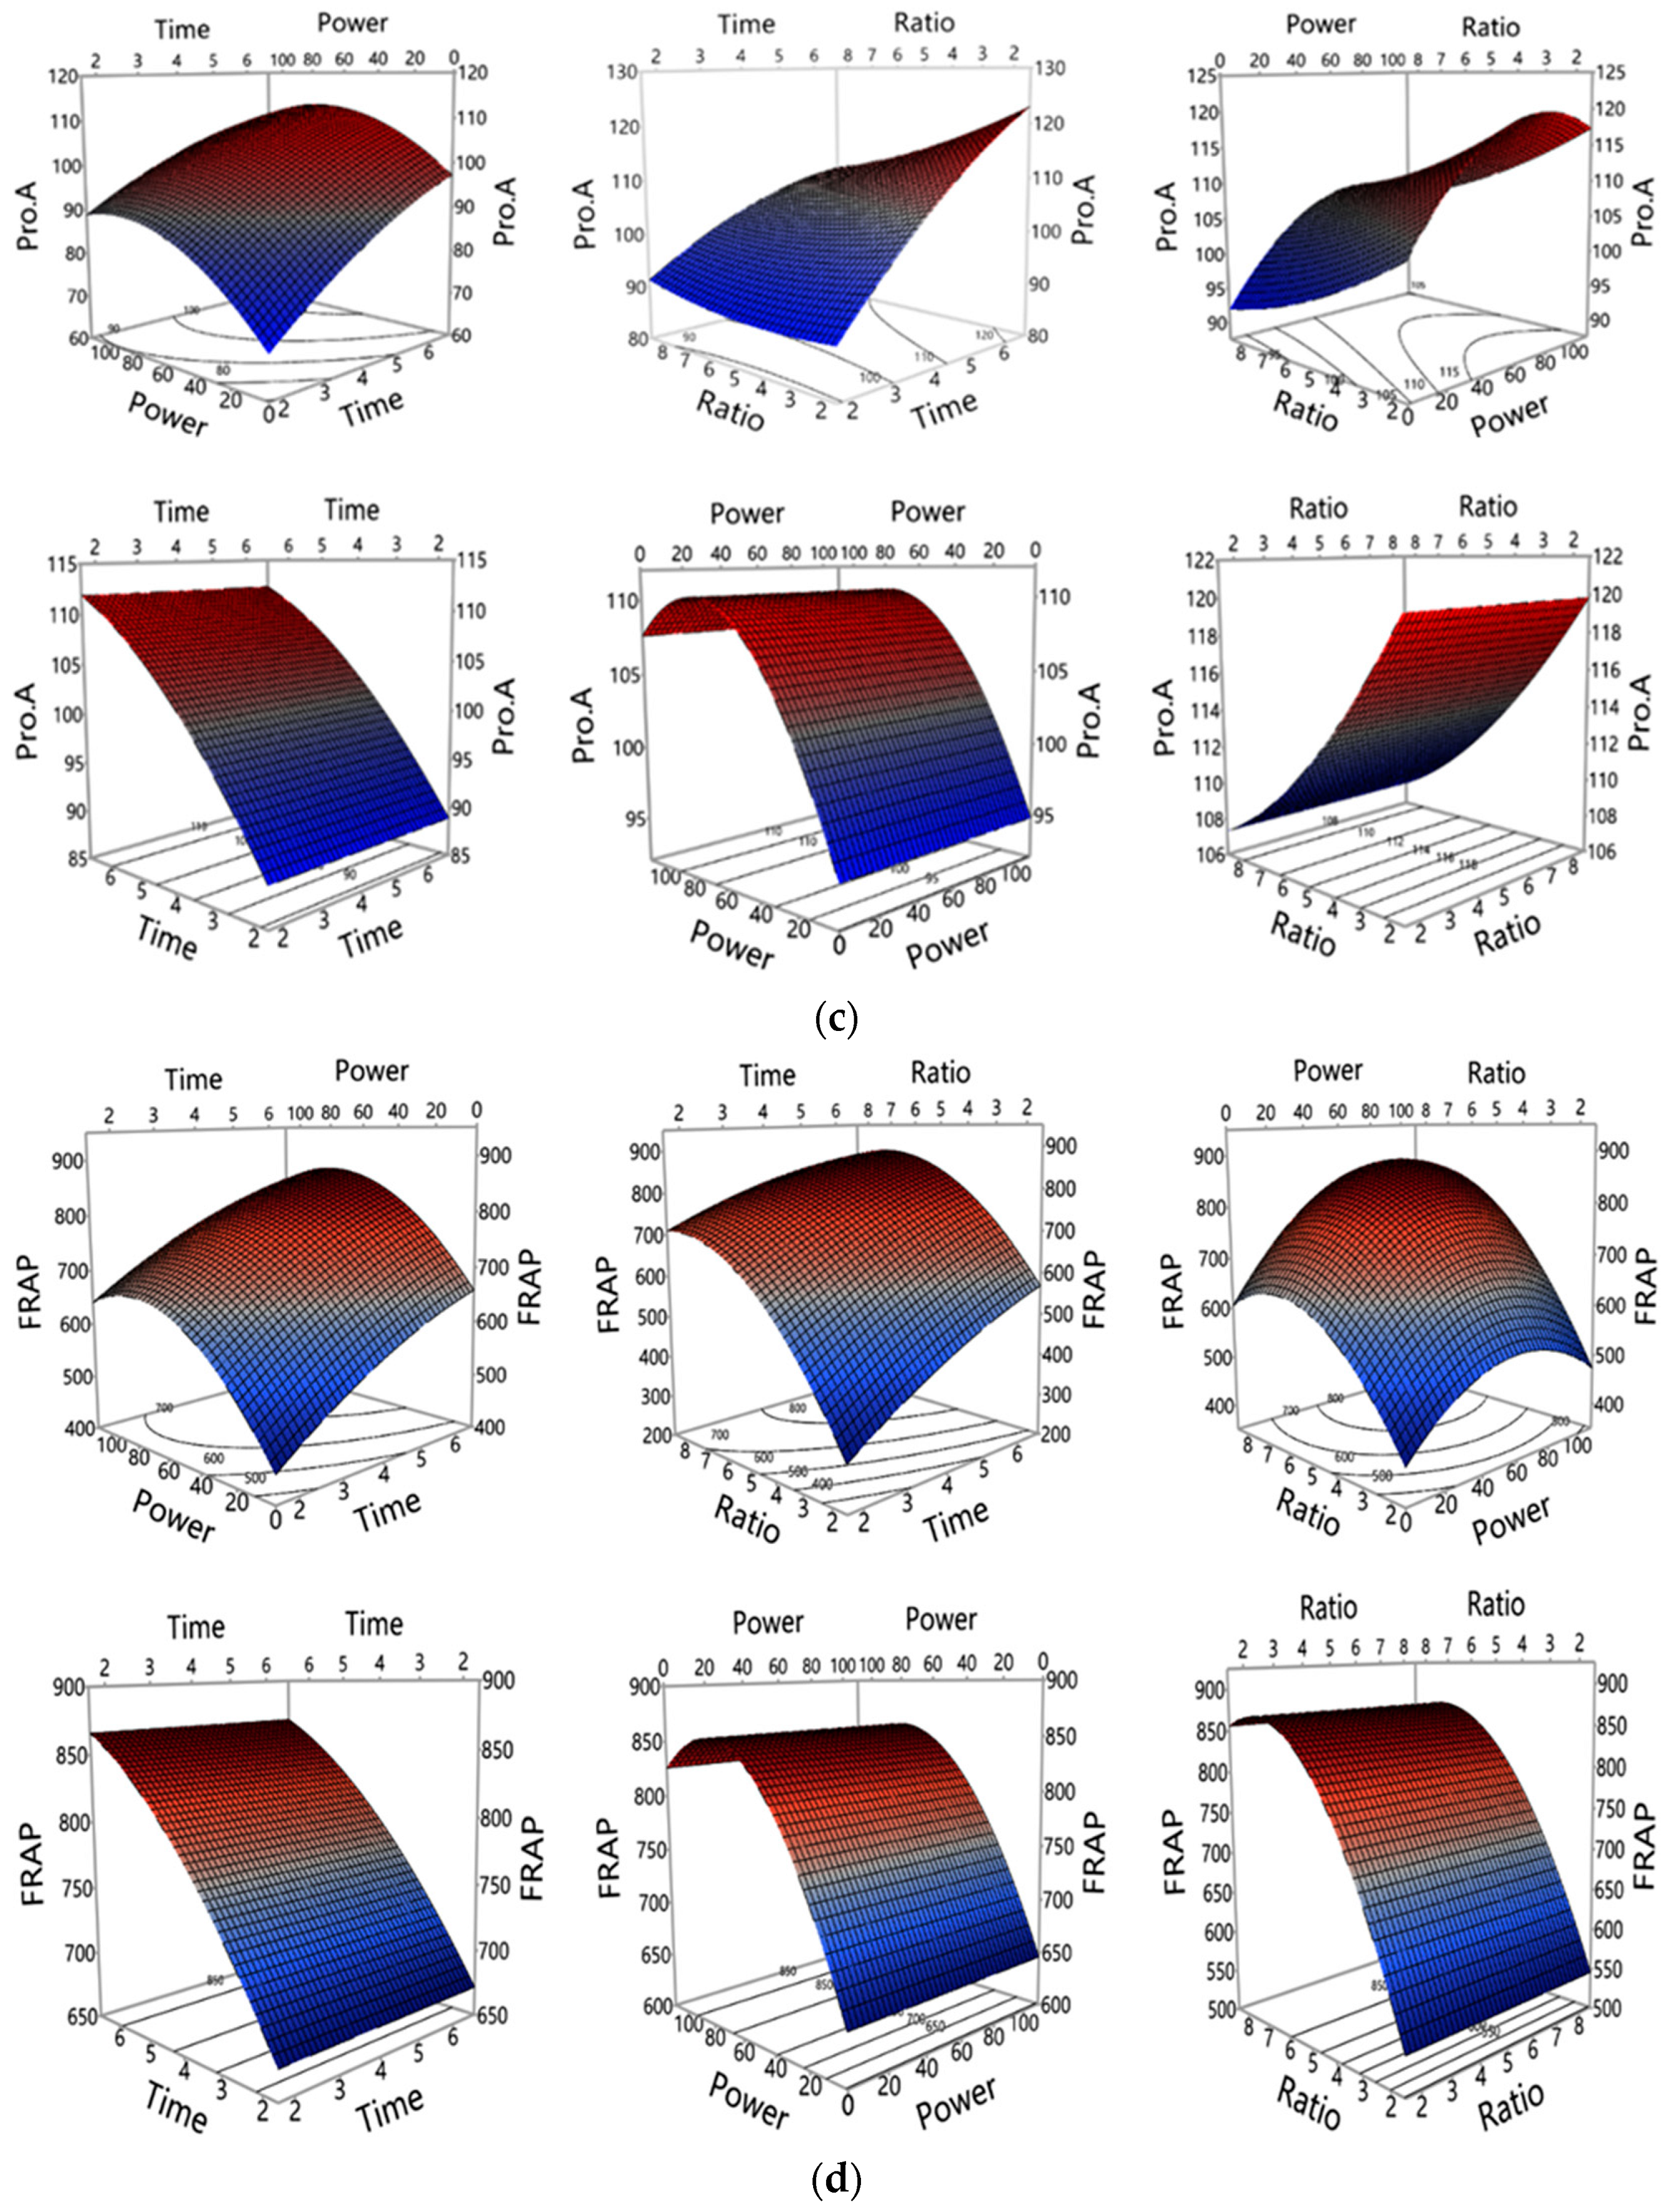
The regression analysis results in Table 2 show the individual, interaction, and quadratic effects of MAE parameters on the extraction yield of polyphenols (TPC, TFC, and Pro. A) and antioxidant capacity (measured by FRAP, CUPRAC, DPPH, and ABTS). Figure 2 also depicts the linear effects of extraction parameters on the extraction yields. The extraction parameters linearly, positively, and significantly (p < 0.05) affected the extraction yield of TPC. Conversely, the quadratic effects of all three parameters on TPC yield were negative, but only the sample to solvent ratio’s influence was significant (p < 0.05). The interaction effects of the extraction parameters were insignificant and negative for TPC, however, the effect of the interaction of power × ratio was positive. Figure 3a–c depicts the 3D surface profiles for interaction and quadratic effects of extraction parameters on phenolics. For TFC and Pro. A, the radiation time and power positively and significantly influenced the extraction yield. However, the influence of sample to solvent ratio was insignificant for both TFC and Pro. A. There were also no significant interaction effects between MAE tested parameters on both TFC and Pro. A yield. The quadratic effect of power was not only significantly but negatively influential to the TFC and Pro. A content in the extract.
The positive linear effect and negative quadratic term indicate that by increasing extraction parameters values, higher extraction yield of phenolics will result to a certain level, then the extraction yield will decrease when the MAE conditions exceed the optimal points.
The higher yield can be explained by the increasing solubility of polyphenols at higher temperatures and increased microwave power and/or extraction time/microwave irradiation time [43]. High temperature can soften the plant tissue and increase penetration of solvent into the sample, increasing mass transfer rate [44], it can also break down chemical bonds or reduce intermolecular interaction that increases the solubility of certain compounds [45,46], resulting in higher extractable compounds in the solution.
In addition, microwaves can create a pressure gradient between the inside and outside of the plant tissues or cells and thus rupture the sample tissue and cell wall, consequently releasing more phenolic compounds [47]. However, high temperatures can lead to the degradation of phenolic compounds, especially heat-sensitive compounds. Therefore, exceeding optimal conditions, a lower level of phenolic compounds was observed [48,49].
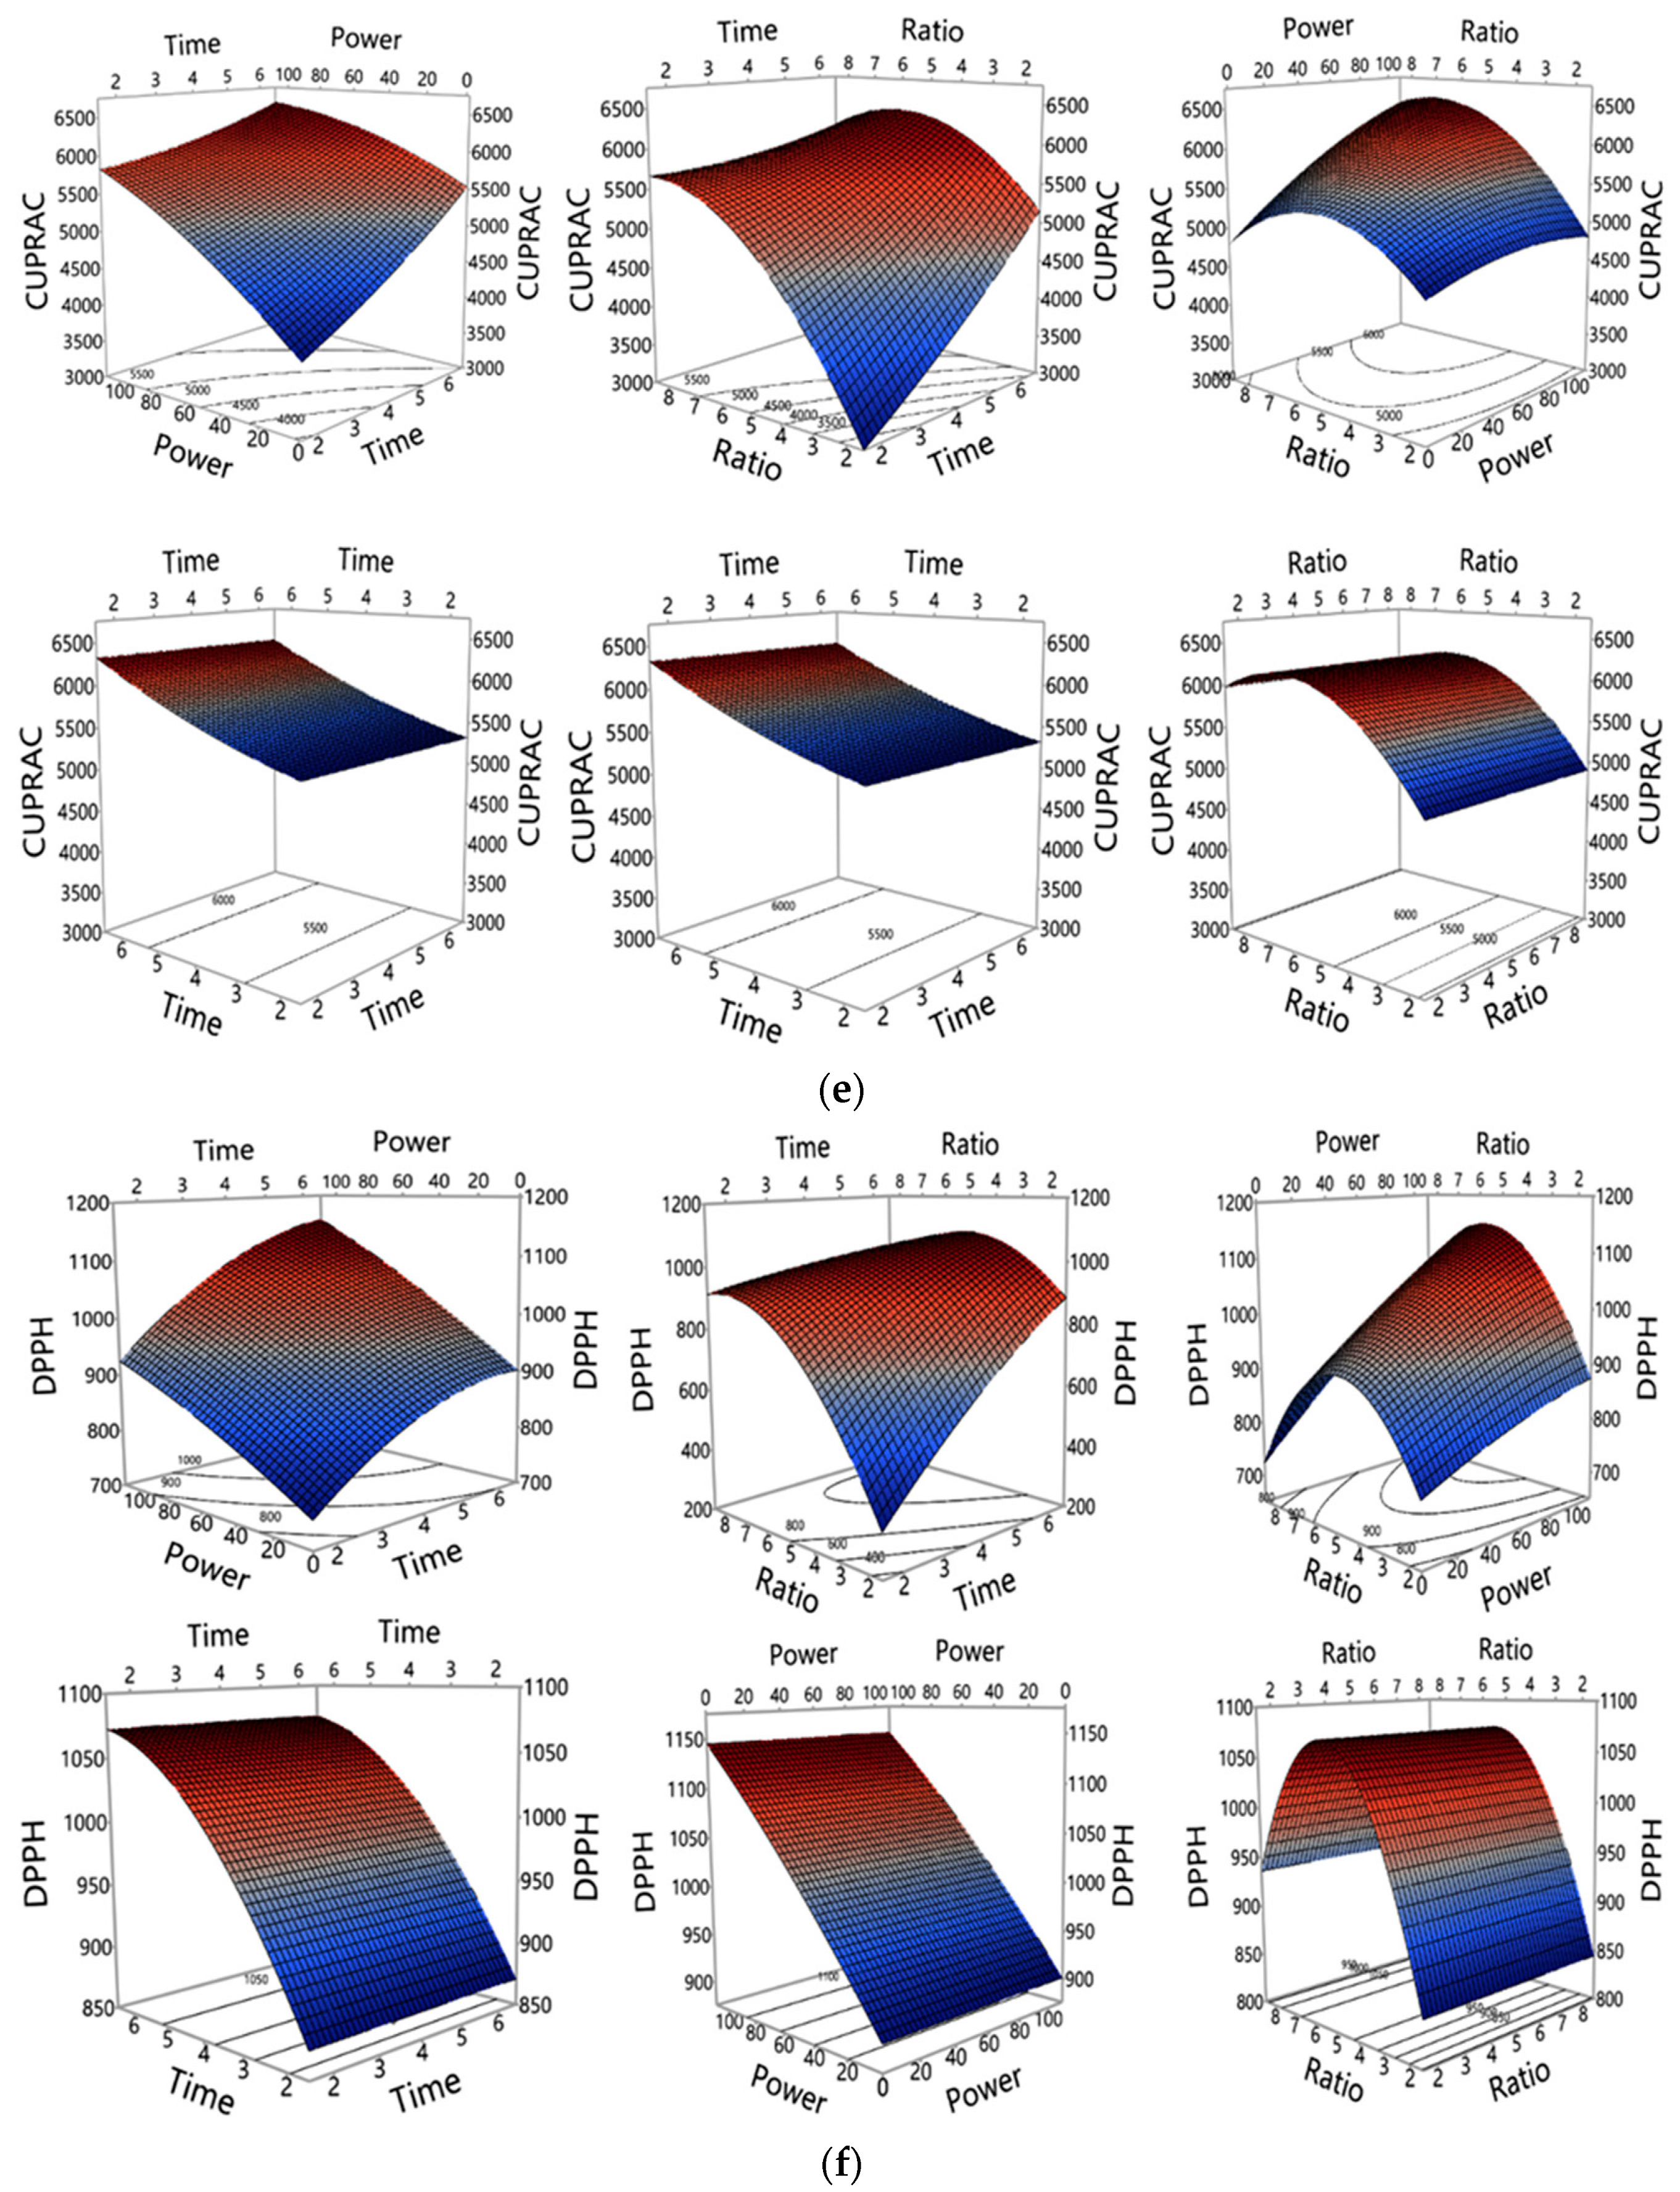
Our results reveal that higher sample to solvent ratios have lower extraction yields of phenolic compounds. This could be explained by the saturation of phenolics in the solvent. The higher quantity of sample requires more solvent to be immersed, thus reduces the contact between the sample and solvent [50]. Our findings also show that the linear effect of radiation time, microwave power, and sample to solvent ratio is positive; however, the quadratic action of the same parameters is negative. The outcomes of this study are in agreement with previous studies on MAE of phenolics from eggplant peel and algae reported by Doulabi et al. [47] and Dang et al. [51] respectively; who found that the extraction yields of various phenolic groups and their antioxidant properties increase with increasing MAE parameters (radiation time, microwave power, and sample to solvent ratio), then gradually declines when these parameters exceeded the optimal levels. Belwal et al. [26] also reported similar findings of a significant positive linear effect of microwave power level and sample to solvent ratio on the extraction yield of total phenolics and antioxidant capacities in MAE derived extract from Berberis asiatica leaves. Their study showed that in quadratic terms, sample to solvent ratio influences ABTS and FRAP significantly and negatively. Various effects on antioxidant capacity and the patterns of effects can also be seen in Table 2. A 2D counter plot (Figure 2) and 3D surface plot (Figure 3d–g) for antioxidant capacity further depicts the effects of the extraction parameter on antioxidant capacity of the extract. In this study, the antioxidant capacity of the extract was measured using two reducing capacity (FRAP and CUPRAC) assays and two free radical scavenging capacity (DPPH and ABTS) assays.
Similar to phenolic compounds, the antioxidant capacities are also influenced by individual parameters. It is likely because there is a strong correlation between phenolic compounds and antioxidant capacities in lemon myrtle extract [6]. A positive, linear, and significant effect of all extraction parameters on antioxidant capacity were observed; except the ratio had a negative and not significant effect on ABTS. All the interaction effects of the extraction parameters for FRAP, CUPRAC, ABTS, and DPPH were insignificant. The extraction parameters adversely affected the antioxidant capacities of the extract in quadratic terms. Except for ABTS, all of the antioxidant property measures were significantly (p < 0.05) influenced by the quadratic action of sample to solvent ratio. Quadratic (microwave power × microwave power) also showed significant influence on FRAP and ABTS values of the extract.

3.1.3. Optimization and Validation

Based on the RSM analysis, the predicted optimal conditions for the maximum yield of polyphenols and antioxidant capacities are radiation time of 6 min, power of 70% (630 W), and sample to solvent ratio 6 g/100 mL. Under these predicted optimal conditions, the extraction yields of TPC, TFC, Pro. A, FRAP, CUPRAC, DPPH, and ABTS was 106.51 ± 7.32 mg GAE/g DW, 98.85 ± 7.88 mg CE/g DW, 110.18 ± 6.43 mg CE/g DW, 852.30 ± 70.03 mM TE/g DW, 6194.44 ± 601.82 mM TE/g DW, 1067.14 ± 133.93 mM TE/g DW, and 1594.73 ± 161.7 mM TE/g DW respectively. The predicted optimal yields of total phenolic compounds and antioxidants were compared with the experimental yield to validate the predicted optimal MAE conditions and justify the accuracy of the predicted models. An insignificant difference between predicted and experimental values indicates the accuracy of the model and validity of the optimal conditions [48,52]. Table 3 presents the outcomes of paired sample comparison between the predicted and experimental values. The results show that there was no significant difference between the predicted and experimental values at a significant level of p < 0.05; which confirms the predicted optimal extraction conditions were validated successfully and it can be applied for further extraction of phenolic compounds and antioxidant-enriched extract from lemon myrtle leaves. The optimal yield of phenolic and antioxidant from MAE was comparable with the extraction yields from lemon myrtle leaves using UAE reported by Saifullah et al. [6]. The TPC and TFC yield using optimal MAE conditions was considerably high compared to the reported UAE method; however, the Pro. A yield and antioxidant capacity values were close for both methods. The extraction yield of phenolic compounds and antioxidants can vary according to extraction conditions and methods.

3.2. Comparison of the Effects of Conventional and Novel Extraction Techniques on Phenolics, Chlorophyll, Antioxidants, and Antimicrobial Properties

The cost-effective extraction of the maximum possible concentration of compounds with the highest bioactivity is important for natural product development industries [53]. The extraction yield and efficiency can vary depending on the extraction methods [54]. The yield of phenolics and their various properties (i.e., antioxidant, antimicrobial, and anti-inflammatory) are important factors for the selection of the extraction method. In this study, we compared the extraction efficiency of two novel and common extraction techniques, including MAE, UAE with a common conventional extraction technique shaking SWB under their optimal conditions on the extraction efficiency of TPC, TFC, and Pro. A, antioxidant capacity, and total chlorophyll content (TCC) (Table 4). The results show that there was no significant difference among the three tested methods on the extraction efficiency of TPC, TFC, and Pro. A. However, MAE has approximately 11% and 14% less extraction efficiency for chlorophyll in comparison with UAE and SWB respectively. The difference in chlorophyll can be explained by the influence of heat on chlorophyll [55]. In terms of antioxidant capacity, there was no significant impact on FRAP, but SWB yields better CUPRAC, ABTS, and DPPH than MAE and UAE.
We further compared the effectiveness of the extracts prepared from MAE, UAE, and SWB techniques on the selected bacteria (Table 5). The extracts do not possess inhibitory actions against tested gram-negative bacteria Escherichia coli and Enterobacter aerogenes. All the extracts at the concentrations of 15 and 20 mg/mL show antibacterial activities against Staphylococcus lugdunensis and Bacillus cereus. The bacterial growth inhibition zone size was increased with increasing extract concentration for both bacteria. The inhibition zone for both concentrations was significantly lower compared to the control ciprofloxacin (5 µg/disc). A similar finding was reported by Pham, et al. [56], where they found with increasing the applied phenolic extract concentration the growth inhibition zone also increased and the growth inhibition zone for Ciprofloxacin (5 µg/disc) was significantly bigger than that of the extract.
The S. lugdunensis growth inhibition zone ranged from 8.83 ± 0.81–9.42 ± 0.49 mm and 10.17 ± 0.26–10.58 ± 0.38 mm for the sample concentrations of 15 and 20 mg/mL respectively. On the other hand, B. cereus growth inhibition zone ranged from 8.75 ± 0.61–8.58 ± 0.38 mm and 9.83 ± 0.26–9.33 ± 0.26 mm for the sample concentrations of 15 and 20 mg/mL respectively. The bacterial growth inhibition activities of phenolic compounds are influenced by the molecular structure of the polyphenol, the position of the active group, and the tested dose of the compound [57]. Polyphenols prevent bacterial growth by disrupting the function and structural integrity of membranes, denaturing proteins, and altering the intercellular pH of bacteria [58,59]. Our findings are in agreement with a previous study reported by Cock [60], who found antibacterial activities of methanol extract of lemon myrtle against B. cereus (7.6 ± 0.3 mm) upon applying a concentration of extract of 15 mg/mL. He also noticed 6.0 ± 0 mm growth inhibition zone for E. coli at the same extract concentration. Alderees et al. [61] applied lemon myrtle extracts obtained using various solvents and they found that only hexane-derived extract exhibits antimicrobial activities against E. coli. Mehmood and Murtaza [62] reported for the same bacterial strain the growth inhibition capacity of an extract varies with extraction solvent. The total phytochemical yield, its composition, and properties vary with extraction solvent and conditions [28,63,64]. The antibacterial properties of the extracts prepared from MAE, UAE, and SWB are not significantly different. This could be due to the similarity of phenolics and antioxidant properties in the extracts obtained from these extraction techniques.
In general, the two novel extraction techniques UAE and MAE do not have significantly higher extraction efficiency for phenolics, and chlorophyll as compared to the conventional technique using the SWB. Their antioxidant capacity and antibacterial properties are also not significantly different. It should be noted that MAE can be conducted with a much shorter time (6 min) than UAE and SWB (both with 50 min). Especially, the volume of solvent for MAE is six-times less (6:100 g/mL) than that of UAE and SWB (ratio 1:100 (g/mL). This is the advantage of MAE; however, the cost of set up remains a major challenge for this technique.

4. Conclusions

The optimization tool RSM was applied to maximize the extraction yield of phenolics and antioxidant properties from lemon myrtle leaves. The optimal MAE conditions generated by RSM models were validated by the actual experiment and are: radiation time of 6 min, power of 70% (630 W), and sample to solvent ratio 6 g/100 mL. In comparison with UAE and SWB, MAE extract has a similar content of phenolics, antioxidant properties, and antibacterial activities. However, the extraction time of MAE is eight-times less and the volume of the solvent used is six-times less than those of UAE and SWB. Therefore, MAE has the economic advantage of short extraction time with less solvent as compared to UAE and SWB. However, the cost of setting up a microwave extraction system could be an issue on an industrial scale. Future studies are recommended to further study the impact of MAE on extractions of major individual compounds from lemon myrtle leaves, and compare the extraction yield with other eco-friendly novel extraction methods such as supercritical fluid extraction and enzyme-assisted extraction.

Author Contributions

Conceptualization, investigation, data collection and analysis, preparation of the first draft: M.S.; review& editing: R.M.; conceptualization, supervision, review & editing: Q.V.V. All authors have read and agreed to the published version of the manuscript.

Funding

This research received no external funding.

Institutional Review Board Statement

Not applicable.

Informed Consent Statement

Not applicable.

Data Availability Statement

Data is contained within this article.

Acknowledgments

We greatly appreciate the Australian Government’s support that awarded the Australian Government Research. Training Program (RTP) scholarship to Md Saifullah.

Conflicts of Interest

The authors declare no conflict of interest.

References

  1. Jimenez-Lopez, C.; Fraga-Corral, M.; Carpena, M.; García-Oliveira, P.; Echave, J.; Pereira, A.G.; Lourenço-Lopes, C.; Prieto, M.A.; Simal-Gandara, J. Agriculture waste valorisation as a source of antioxidant phenolic compounds within a circular and sustainable bioeconomy. Food Funct. 2020, 11, 4853–4877. [Google Scholar] [CrossRef]
  2. Martillanes, S.; Rocha Pimienta, J.; Cabrera-Bañegil, M.; Martín-Vertedor, D.; Delgado, J. Application of Phenolic Compounds for Food Preservation: Food Additive and Active Packaging. Phenolic Compounds Biological Activity, 1st ed.; Marcos, S.H., Mariana, P.T., Rosario, G.M., Eds.; IntechOpen: London, UK, 2017; pp. 39–58. [Google Scholar]
  3. Bhuyan, D.J.; Basu, A. Phenolic compounds: Potential Health Benefits and Toxicity. In Utilization of Bioactive Compounds from Agricultural and Food Waste; Vuong, Q.V., Ed.; CRC Press: Boca Raton, FL, USA, 2017; pp. 27–59. [Google Scholar]
  4. Dai, J.; Mumper, R.J. Plant phenolics: Extraction, analysis and their antioxidant and anticancer properties. Molecules 2010, 15, 7313–7352. [Google Scholar] [CrossRef] [PubMed]
  5. Sharma, R. Chapter 59—Polyphenols in Health and Disease: Practice and Mechanisms of Benefits. In Polyphenols in Human Health and Disease; Watson, R.R., Preedy, V.R., Zibadi, S., Eds.; Academic Press: San Diego, CA, USA, 2014; pp. 757–778. [Google Scholar]
  6. Saifullah, M.; McCullum, R.; McCluskey, A.; Vuong, Q. Effects of different drying methods on extractable phenolic compounds and antioxidant properties from lemon myrtle dried leaves. Heliyon 2019, 5, e03044. [Google Scholar] [CrossRef] [PubMed] [Green Version]
  7. Konczak, I.; Zabaras, D.; Dunstan, M.; Aguas, P. Antioxidant capacity and phenolic compounds in commercially grown native Australian herbs and spices. Food Chem. 2010, 122, 260–266. [Google Scholar] [CrossRef]
  8. Guo, Y.; Sakulnarmrat, K.; Konczak, I. Anti-inflammatory potential of native Australian herbs polyphenols. Toxicol. Rep. 2014, 1, 385–390. [Google Scholar] [CrossRef] [Green Version]
  9. Kang, E.J.; Lee, J.K.; Park, H.R.; Kim, H.; Kim, H.S.; Park, J. Antioxidant and anti-inflammatory activities of phenolic compounds extracted from lemon myrtle (Backhousia citriodora) leaves at various extraction conditions. Food Sci. Biotechnol. 2020, 29, 1425–1432. [Google Scholar] [CrossRef]
  10. Dupont, S.; Caffin, N.; Bhandari, B.; Dykes, G.A. In vitro antibacterial activity of Australian native herb extracts against food-related bacteria. Food Control 2006, 17, 929–932. [Google Scholar] [CrossRef]
  11. Wilkinson, J.M.; Hipwell, M.; Ryan, T.; Cavanagh, H.M.A. Bioactivity of Backhousia citriodora: Antibacterial and Antifungal Activity. J. Agric. Food Chem. 2003, 51, 76–81. [Google Scholar] [CrossRef]
  12. Sakulnarmrat, K.; Fenech, M.; Thomas, P.; Konczak, I. Cytoprotective and pro-apoptotic activities of native Australian herbs polyphenolic-rich extracts. Food Chem. 2013, 136, 9–17. [Google Scholar] [CrossRef]
  13. Mazzorana, G.; Mazzorana, M. Cultivation of Lemon Myrtle (Backhousia citriodora), 1st ed.; CRC Press: Boca Raton, FL, USA, 2016; pp. 113–126. [Google Scholar]
  14. Brophy, J.J.; Goldsack, R.J.; Fookes, C.J.R.; Forster, P.I. Leaf Oils of the Genus Backhousia (Myrtaceae). J. Essent. Oil Res. 1995, 7, 237–254. [Google Scholar] [CrossRef]
  15. Lassak, V.E. Revision of Backhousia Citriodora Essential Oil Standard; R. I. R. D. C. Publication No. 11/37; Union Offset Printing: Canberra, Australia, 2012. [Google Scholar]
  16. Setyaningsih, W.; Saputro, I.E.; Palma, M.; Barroso, C.G. Optimisation and validation of the microwave-assisted extraction of phenolic compounds from rice grains. Food Chem. 2015, 169, 141–149. [Google Scholar] [CrossRef]
  17. Ajila, C.M.; Brar, S.K.; Verma, M.; Tyagi, R.D.; Godbout, S.; Valéro, J.R. Extraction and Analysis of Polyphenols: Recent trends. Crit. Rev. Biotechnol. 2011, 31, 227–249. [Google Scholar] [CrossRef]
  18. Alara, O.R.; Abdurahman, N.H.; Ukaegbu, C.I. Extraction of phenolic compounds: A review. Curr. Res. Food Sci. 2021, 4, 200–214. [Google Scholar] [CrossRef] [PubMed]
  19. Alonso-Carrillo, N.; Aguilar-Santamaría, M.d.l.Á.; Vernon-Carter, E.J.; Jiménez-Alvarado, R.; Cruz-Sosa, F.; Román-Guerrero, A. Extraction of phenolic compounds from Satureja macrostema using microwave-ultrasound assisted and reflux methods and evaluation of their antioxidant activity and cytotoxicity. Ind. Crop. Prod. 2017, 103, 213–221. [Google Scholar] [CrossRef]
  20. Sharmila, G.; Nikitha, V.S.; Ilaiyarasi, S.; Dhivya, K.; Rajasekar, V.; Kumar, N.M.; Muthukumaran, K.; Muthukumaran, C. Ultrasound assisted extraction of total phenolics from Cassia auriculata leaves and evaluation of its antioxidant activities. Ind. Crop. Prod. 2016, 84, 13–21. [Google Scholar] [CrossRef]
  21. Odabaş, H.İ.; Koca, I. Application of response surface methodology for optimizing the recovery of phenolic compounds from hazelnut skin using different extraction methods. Ind. Crop. Prod. 2016, 91, 114–124. [Google Scholar] [CrossRef]
  22. De Monte, C.; Carradori, S.; Granese, A.; Di Pierro, G.B.; Leonardo, C.; De Nunzio, C. Modern extraction techniques and their impact on the pharmacological profile of Serenoa repens extracts for the treatment of lower urinary tract symptoms. BMC Urol. 2014, 14, 63. [Google Scholar] [CrossRef] [Green Version]
  23. Chuyen, H.V.; Nguyen, M.H.; Roach, P.D.; Golding, J.B.; Parks, S.E. Microwave-assisted extraction and ultrasound-assisted extraction for recovering carotenoids from Gac peel and their effects on antioxidant capacity of the extracts. Food Sci. Nutr. 2018, 6, 189–196. [Google Scholar] [CrossRef] [PubMed] [Green Version]
  24. Dahmoune, F.; Nayak, B.; Moussi, K.; Remini, H.; Madani, K. Optimization of microwave-assisted extraction of polyphenols from Myrtus communis L. leaves. Food Chem. 2015, 166, 585–595. [Google Scholar] [CrossRef]
  25. Ince, A.E.; Sahin, S.; Sumnu, G. Comparison of microwave and ultrasound-assisted extraction techniques for leaching of phenolic compounds from nettle. J. Food Sci. Technol. 2014, 51, 2776–2782. [Google Scholar] [CrossRef]
  26. Belwal, T.; Bhatt, I.D.; Rawal, R.S.; Pande, V. Microwave-assisted extraction (MAE) conditions using polynomial design for improving antioxidant phytochemicals in Berberis asiatica Roxb. ex DC. leaves. Ind. Crop. Prod. 2017, 95, 393–403. [Google Scholar] [CrossRef]
  27. Bezerra, M.A.; Santelli, R.E.; Oliveira, E.P.; Villar, L.S.; Escaleira, L.A. Response surface methodology (RSM) as a tool for optimization in analytical chemistry. Talanta 2008, 76, 965–977. [Google Scholar] [CrossRef]
  28. Saifullah, M.; McCullum, R.; Vuong, Q.V. Development of Ultrasound-assisted Extraction Conditions for the Optimal Yield of Phenolic Compounds and Antioxidant Properties from Lemon Myrtle (Backhousia citriodora) Leaves. Curr. Nutraceuticals 2021, 2, 1–14. [Google Scholar] [CrossRef]
  29. Nana, O.; Momeni, J.; Boyom, F.F.; Njintang, N.Y.; Ngassoum, M.B. Microwave-assisted extraction as an advanced technique for optimisation of limonoid yields and antioxidant potential from Trichilia roka (Meliaceae). Curr. Res. Green Sustain. Chem. 2021, 4, 100–147. [Google Scholar] [CrossRef]
  30. Saifullah, M.; McCullum, R.; McCluskey, A.; Vuong, Q. Comparison of conventional extraction technique with ultrasound assisted extraction on recovery of phenolic compounds from lemon scented tea tree (Leptospermum petersonii) leaves. Heliyon 2020, 6, e03666. [Google Scholar] [CrossRef]
  31. Škerget, M.; Kotnik, P.; Hadolin, M.; Hraš, A.R.; Simonič, M.; Knez, Ž. Phenols, proanthocyanidins, flavones and flavonols in some plant materials and their antioxidant activities. Food Chem. 2005, 89, 191–198. [Google Scholar] [CrossRef]
  32. Zhishen, J.; Mengcheng, T.; Jianming, W. The determination of flavonoid contents in mulberry and their scavenging effects on superoxide radicals. Food Chem. 1999, 64, 555–559. [Google Scholar] [CrossRef]
  33. Li, Y.; Guo, C.; Yang, J.; Wei, J.; Xu, J.; Cheng, S. Evaluation of antioxidant properties of pomegranate peel extract in comparison with pomegranate pulp extract. Food Chem. 2006, 96, 254–260. [Google Scholar] [CrossRef]
  34. Thaipong, K.; Boonprakob, U.; Crosby, K.; Cisneros-Zevallos, L.; Hawkins Byrne, D. Comparison of ABTS, DPPH, FRAP, and ORAC assays for estimating antioxidant activity from guava fruit extracts. J. Food Compos. Anal. 2006, 19, 669–675. [Google Scholar] [CrossRef]
  35. Apak, R.; Güçlü, K.; Özyürek, M.; Karademir, S.E. Novel Total Antioxidant Capacity Index for Dietary Polyphenols and Vitamins C and E, Using Their Cupric Ion Reducing Capability in the Presence of Neocuproine: CUPRAC Method. J. Agric. Food Chem. 2004, 52, 7970–7981. [Google Scholar] [CrossRef]
  36. Sudhakar, P.; Latha, P.; Reddy, P.V. Chapter 15—Plant pigments. In Phenotyping Crop Plants for Physiological and Biochemical Traits; Sudhakar, P., Latha, P., Reddy, P.V., Eds.; Academic Press: Cambridge, MA, USA, 2016; pp. 121–127. [Google Scholar]
  37. Bhuyan, D.J.; Vuong, Q.V.; Chalmers, A.C.; van Altena, I.A.; Bowyer, M.C.; Scarlett, C.J. Phytochemical, antibacterial and antifungal properties of an aqueous extract of Eucalyptus microcorys leaves. S. Afr. J. Bot. 2017, 112, 180–185. [Google Scholar] [CrossRef]
  38. Chandrasekaran, M.; Venkatesalu, V. Antibacterial and antifungal activity of Syzygium jambolanum seeds. J. Ethnopharmacol. 2004, 91, 105–108. [Google Scholar] [CrossRef] [PubMed]
  39. Nwabueze, T.U. Review article: Basic steps in adapting response surface methodology as mathematical modelling for bioprocess optimisation in the food systems. Int. J. Food Sci. Technol. 2010, 45, 1768–1776. [Google Scholar] [CrossRef]
  40. Saifullah, M.; McCullum, R.; Vuong, Q. Maximising extraction yields of gallic acid and hesperetin from lemon myrtle (Backhousia citriodora) leaf using microwave assisted extraction. Results Chem. 2020, 2, 100080. [Google Scholar] [CrossRef]
  41. Nipornram, S.; Tochampa, W.; Rattanatraiwong, P.; Singanusong, R. Optimization of low power ultrasound-assisted extraction of phenolic compounds from mandarin (Citrus reticulata Blanco cv. Sainampueng) peel. Food Chem. 2018, 241, 338–345. [Google Scholar] [CrossRef]
  42. Harel, O. The estimation of R2 and adjusted R2 in incomplete data sets using multiple imputation. J. Appl. Stat. 2009, 36, 1109–1118. [Google Scholar] [CrossRef]
  43. Yan, M.-M.; Liu, W.; Fu, Y.-J.; Zu, Y.-G.; Chen, C.-Y.; Luo, M. Optimisation of the microwave-assisted extraction process for four main astragalosides in Radix Astragali. Food Chem. 2010, 119, 1663–1670. [Google Scholar] [CrossRef]
  44. Dahmoune, F.; Boulekbache, L.; Moussi, K.; Aoun, O.; Spigno, G.; Madani, K. Valorization of Citrus limon residues for the recovery of antioxidants: Evaluation and optimization of microwave and ultrasound application to solvent extraction. Ind. Crop. Prod. 2013, 50, 77–87. [Google Scholar] [CrossRef]
  45. Xu, D.-P.; Zheng, J.; Zhou, Y.; Li, Y.; Li, S.; Li, H.-B. Ultrasound-assisted extraction of natural antioxidants from the flower of Limonium sinuatum: Optimization and comparison with conventional methods. Food Chem. 2017, 217, 552–559. [Google Scholar] [CrossRef]
  46. Jianming, W.; Yuan, G.; Ping, L.; Feng, H.; Liying, L. Optimization of Ultrasound-Assisted Extraction Procedure to Determine Total Isoflavones in Chinese Soybean Cheese by Box–Behnken Design. Food Anal. Methods 2013, 6, 221–226. [Google Scholar] [CrossRef]
  47. Doulabi, M.; Golmakani, M.-T.; Ansari, S. Evaluation and optimization of microwave-assisted extraction of bioactive compounds from eggplant peel by-product. J. Food Process. Preserv. 2020, 44, e14853. [Google Scholar] [CrossRef]
  48. Ali, A.; Lim, X.Y.; Chong, C.H.; Mah, S.H.; Chua, B.L. Optimization of ultrasound-assisted extraction of natural antioxidants from Piper betle using response surface methodology. LWT 2018, 89, 681–688. [Google Scholar] [CrossRef]
  49. Tomšik, A.; Pavlić, B.; Vladić, J.; Ramić, M.; Brindza, J.; Vidović, S. Optimization of ultrasound-assisted extraction of bioactive compounds from wild garlic (Allium ursinum L.). Ultrason. Sonochem. 2016, 29, 502–511. [Google Scholar] [CrossRef]
  50. Milutinović, M.; Radovanović, N.; Rajilić-Stojanović, M.; Šiler-Marinković, S.; Dimitrijević, S.; Dimitrijević-Branković, S. Microwave-assisted extraction for the recovery of antioxidants from waste Equisetum arvense. Ind. Crop. Prod. 2014, 61, 388–397. [Google Scholar] [CrossRef]
  51. Dang, T.T.; Bowyer, M.C.; Van Altena, I.A.; Scarlett, C.J. Optimum conditions of microwave-assisted extraction for phenolic compounds and antioxidant capacity of the brown alga Sargassum vestitum. Sep. Sci. Technol. 2018, 53, 1711–1723. [Google Scholar] [CrossRef]
  52. Bhuyan, D.J.; Van Vuong, Q.; Chalmers, A.C.; van Altena, I.A.; Bowyer, M.C.; Scarlett, C.J. Microwave-assisted extraction of Eucalyptus robusta leaf for the optimal yield of total phenolic compounds. Ind. Crop. Prod. 2015, 69, 290–299. [Google Scholar] [CrossRef]
  53. Grigonis, D.; Venskutonis, R.; Sivik, B.; Sandahl, M.; Eskilsson, C.S. Comparison of different extraction techniques for isolation of antioxidants from sweet grass (Hierochloë odorata). J. Supercrit. Fluids 2005, 33, 223–233. [Google Scholar] [CrossRef]
  54. Bimakr, M.; Rahman, R.A.; Taip, F.S.; Ganjloo, A.; Salleh, L.M.; Selamat, J.; Hamid, A.; Zaidul, I.S.M. Comparison of different extraction methods for the extraction of major bioactive flavonoid compounds from spearmint (Mentha spicata L.) leaves. Food Bioprod. Process. 2011, 89, 67–72. [Google Scholar] [CrossRef]
  55. Gaur, S.; Shivhare, U.S.; Sarkar, B.C.; Ahmed, J. Thermal Chlorophyll Degradation Kinetics of Mint Leaves Puree. Int. J. Food Prop. 2007, 10, 853–865. [Google Scholar] [CrossRef]
  56. Pham HN, T.; Sakoff, J.A.; Van Vuong, Q.; Bowyer, M.C.; Scarlett, C.J. Screening phytochemical content, antioxidant, antimicrobial and cytotoxic activities of Catharanthus roseus (L. ) G. Don stem extract and its fractions. Biocatal. Agric. Biotechnol. 2018, 16, 405–411. [Google Scholar] [CrossRef]
  57. Pacheco-Ordaz, R.; Wall-Medrano, A.; Goñi, M.G.; Ramos-Clamont-Montfort, G.; Ayala-Zavala, J.F.; González-Aguilar, G.A. Effect of phenolic compounds on the growth of selected probiotic and pathogenic bacteria. Lett Appl. Microbiol. 2018, 66, 25–31. [Google Scholar] [CrossRef]
  58. Rempe, C.S.; Burris, K.P.; Lenaghan, S.C.; Stewart, C.N., Jr. The Potential of Systems Biology to Discover Antibacterial Mechanisms of Plant Phenolics. Front. Microbiol. 2017, 8, 422. [Google Scholar] [CrossRef] [Green Version]
  59. Zamuz, S.; Munekata, P.E.; Dzuvor, C.K.; Zhang, W.; Sant’Ana, A.S.; Lorenzo, J.M. The role of phenolic compounds against Listeria monocytogenes in food. A review. Trends Food Sci. Technol. 2021, 110, 385–392. [Google Scholar] [CrossRef]
  60. Cock, I. Antimicrobial activity of Backhousia citriodora (lemon myrtle) methanolic extracts. Pharmacogn. Commun. 2013, 3, 58–63. [Google Scholar] [CrossRef] [Green Version]
  61. Alderees, F.; Mereddy, R.; Webber, D.; Nirmal, N.; Sultanbawa, Y. Mechanism of Action against Food Spoilage Yeasts and Bioactivity of Tasmannia lanceolata, Backhousia citriodora and Syzygium anisatum Plant Solvent Extracts. Foods 2018, 7, 179. [Google Scholar] [CrossRef] [Green Version]
  62. Mehmood, A.; Murtaza, G. Phenolic contents, antimicrobial and antioxidant activity of Olea ferruginea Royle (Oleaceae). BMC Complementary Altern. Med. 2018, 18, 173. [Google Scholar] [CrossRef] [PubMed] [Green Version]
  63. Xu, B.J.; Chang, S.K.C. A Comparative Study on Phenolic Profiles and Antioxidant Activities of Legumes as Affected by Extraction Solvents. J. Food Sci. 2007, 72, S159–S166. [Google Scholar] [CrossRef]
  64. El Mannoubi, I. Effect of extraction solvent on phenolic composition, antioxidant and antibacterial activities of skin and pulp of Tunisian red and yellow–orange Opuntia Ficus Indica fruits. J. Food Meas. Charact. 2021, 15, 643–651. [Google Scholar] [CrossRef]
Figure 1. Microwave-assisted extraction system for lemon myrtle leaves.
Processes 09 02212 g001
Figure 2. A 2D counter plot of effect of extraction parameters (time: min; power: W; ratio: g/100 mL) on the extraction yield of polyphenols (TPC: mg GAE/g DW, TFC and Pro. A: mg CE/g DW) and antioxidant capacity (FRAP, CUPRAC, ABTS, and DPPH: mM TE/g DW).
Processes 09 02212 g002
Figure 3. (a) A 3D surface profile of interaction and quadratic effects of extraction parameters (time: min; power: W; ratio: g/100 mL) on TPC (mg GAE/g DW). (b) A 3D surface profile of interaction and quadratic effects of extraction parameters (time: min; power: W; ratio: g/100 mL) on TFC (mg CE/g DW). (c) A 3D surface profile of interaction and quadratic effects of extraction parameters (time: min; power: W; ratio: g/100 mL) on Pro. A (mg CE/g DW). (d) A 3D surface profile of interaction and quadratic effects of extraction parameters (time: min; power: W; ratio: g/100 mL) on FRAP (mM TE/g DW). (e) A 3D surface profile of interaction and quadratic effects of extraction parameters (time: min; power: W; ratio: g/100 mL) on CUPRAC (mM TE/g DW). (f) A 3D surface profile of interaction and quadratic effects of extraction parameters (time: min; power: W; ratio: g/100 mL) on DPPH (mM TE/g DW). (g) A 3D surface profile of interaction and quadratic effects of extraction parameters (time: min; power: W; ratio: g/100 mL) on ABTS (mM TE/g DW).
Processes 09 02212 g003aProcesses 09 02212 g003bProcesses 09 02212 g003cProcesses 09 02212 g003d
Table 1. Box–Behnken experimental design and observed responses.
RunExperimental Conditions (Independent Variables)Observed Responses (Dependent Variables) (n = 3)
PatternX1X2X3PhytochemicalsAntioxidant Capacity
TPCTFCPro. AFRAPCUPRACDPPHABTS
1+−0610593.6724788.02825104.0927683.44165827.626985.77161371.562
2−0+255889.3107285.1982192.55855737.62185723.661991.68011296.063
3000455594.7729186.7464499.4709695.88745338.929997.07791322.186
40++4100896.5872591.91176103.6901793.66216163.6161007.5081407.265
5−+02100585.4341777.7676387.44164621.32355105.042839.38121221.161
6−−0210569.8679562.684274.89885484.43474070.798718.2009990.0688
7++061005105.802395.40555111.5702811.58016260.0001155.1951549.675
80−+410871.0284170.4314387.62903599.00814384.782777.60931087.066
9000455595.132592.49178103.0034730.46545451.429951.29871561.580
100−−410267.7604471.6721591.63295436.11543884.874703.01761239.114
110+−4100282.0703391.03641107.7913493.93624659.139789.96371520.961
12−0−255262.3749568.8253692.46291370.51183378.939471.97291216.816
13+0−655286.9222794.55304115.2998561.01994783.613796.40941609.769
14000455592.3519489.33138102.3861772.87055309.874927.33001505.634
15+0+6558100.234597.62057103.7533854.77545900.446945.21101548.363
X1 (radiation time/time, min), X2 (% microwave power level/power, W), and X3 (sample to solvent ratio/ratio g/100 mL), TPC (mg GAE/g DW), TFC (mg CE/g DW), Proanthocyanidins (Pro. A) (mg CE/g DW), FRAP (mM TE/g DW), ABTS (mM TE/g DW), DPPH (mM TE/g DW), CUPRAC (mM TE/g DW).
Table 2. Regression coefficients of the polynomial model and analysis of variance for the determination of model fit.
Model ParametersPhytochemicalsAntioxidant Capacity Measures
TPCTFCPro. AFRAPCUPRACDPPHABTS
Intercept β094.08 ***89.52 ***101.62 ***733.07 ***5366.74 ***958.67 ***1463.13 ***
Linear term
β19.96 ***10.14 **10.92 ***87.12 **561.66 **107.67 *169.41 **
β28.45 **7.91 **6.53 **64.68 **502.46 *75.93 *126.41 *
β37.25 **2.38−2.44140.44 ***683.24 **120.08 **−30.99
Interactions
β12−0.86−1.93−1.27−2.19−150.4712.06−13.24
β13−3.41−3.33−2.91−18.34−306.97−92.73−35.16
β232.810.53−0.0234.21251.1435.749.59
Quadratic
β11−0.02−1.63−1.89−16.2961.34−26.07−37.93
β22−5.37−6.9190 *−5.23 *−66.59 *−112.22−7.86−142.08
β33−9.35 **−1.341.29−85.81 *−481.42 *−131.1815 *−7.45
Model fitting indicators
R20.960.940.950.970.940.920.91
Adjusted R20.890.820.870.920.830.770.74
RMSE4.3374.70653.837741.805359.2779.95696.53
Lack of fit0.07090.21570.14150.46420.02590.1160.8132
F ratio of model13.20338.089311.3418.998.536.245.34
P of model > F0.0060.0170.00780.00240.01470.02890.0397
Significantly different at * p< 0.05, ** p < 0.01, and *** p < 0.001; β0: intercept; β1, β2, and β3: linear regression coefficients for time, power, and ratio; β12, β13, and β23: regression coefficients for interaction between time × power, time × ratio, power× ratio; β11, β22, and β33: quadratic regression coefficients for time × time, power × power, and ratio × ratio.
Table 3. Validation of the predicted value for phytochemical content and antioxidant capacity.
Values (n = 3)
PredictedExperimental
TPC (mg GAE/g DW)106.51 ± 7.32 a108.06 ± 3.73 a
TFC (mg CE/g DW)98.85 ± 7.88 a101.41 ± 3.82 a
Proanthocyanidins (mg CE/g DW)110.18 ± 6.43 a114.23 ± 2.39 a
FRAP (mM TE/g DW)852.30 ± 70.03 a947.15 ± 36.37 a
CUPRAC (mMTE/g DW)6194.44 ± 601.82 a6395.53 ± 157.82 a
DPPH (mMTE/g DW)1067.14 ± 133.93 a1188.311 ± 39.17 a
ABTS (mMTE/g DW)1594.73 ± 161.7 a1797.17 ± 91.20 a
All the values are means ± standard deviations and the values in the same row with the same superscript letter are not significantly (p > 0.05) different from each other.
Table 4. Phytochemical and antioxidant content in the dried extract from three different extraction methods.
MAEUAESWB
Phenolic compounds
TPC (mg GAE/g DW)406.67 ± 8.57 a399.03 ± 7.65 a398.10 ± 2.76 a
TFC (mg CE/g DW)384.57 ± 2.74 a381.57 ± 5.29 a379.13 ± 7.77 a
Pro. A (mg CE/g DW)336.54 ± 7.09 a347.58 ± 6.85 a347.39 ± 5.76 a
Antioxidant capacities
FRAP (mM TE/g DW)3175.56 ± 79.39 a3221.73 ± 158.54 a3272.45 ± 101.46 a
CUPRAC (mM TE/g DW)22,479.77 ± 87.89 c23,270.17 ± 146.33 b24,520.28 ± 154.34 a
ABTS (mM TE/g DW)7023.99 ± 83.49 b7040.03 ± 103.22 b7241.42 ± 38.75 a
DPPH (mM TE/g DW)4531.04 ± 33.02 ab4404.50 ± 53.14 b4645.36 ± 72.92 a
Total chlorophyll content mg/g dry extract1.14 ± 0.49 b1.29 ± 0.09 a1.33 ± 0.05 a
The values in the same row with the same superscript letter indicate no significant difference among the values at the level p < 0.05.
Table 5. Antimicrobial properties of extract comparison of different extraction methods.
BacteriaInhibition Zone (mm) (n = 9)
MAEUAESWBCiprofloxacin (5 µg/disc)
15 mg/mL20 mg/mL15 mg/mL20 mg/mL15 mg/mL20 mg/mL
E. coliNDNDNDNDNDND
E. aerogenesNDNDNDNDNDND
S. lugdunensis9.42 ± 0.49 b10.42 ± 0.38 b9.25 ± 0.61 b10.58 ± 0.38 b8.83 ± 0.81 b10.17 ± 0.26 b34.92 ± 0.20 a
B. cereus8.58 ± 0.38 b9.33 ± 0.26 b8.75 ± 0.61 b9.33 ± 0.26 b8.67 ± 0.26 b9.83 ± 0.26 b26.08 ± 0.66 a
For individual bacterium and a specific sample concentration carrying the same superscript does not indicate a significant difference p > 0.05. ND = not detected.
Publisher’s Note: MDPI stays neutral with regard to jurisdictional claims in published maps and institutional affiliations.