1. Introduction
The Industry 4.0 framework brings the perfect environment in terms of process data availability for artificial intelligence (AI) applications for modelling and monitoring manufacturing systems [
1]. Therefore, various efforts to explore the applicability of such models have been developed during recent years [
2], with the objective of these approaches being to improve the efficiency of the industrial process by implementing several solutions, such as process monitoring, process fault diagnosis or process energy optimization [
3].
Among the mentioned researched topics, energy optimization is considered the basis for economic competitiveness and growth [
4,
5]. With regard to an increasing energy expenditure awareness, industrial processes, such as industrial refrigeration systems based on vapor compression, represent a big contributor to this matter. In these systems, the compressors, which consume most of the process energy, operate in parallel to supply the energy requirements. In such situations, various machines are working under its optimal capacity conditions and multiple configurations can be encountered to supply, in an optimal way, the desired demand. Hence, the selection of the optimal part load ratio (PLR) of each compressor, which is the amount of cooling capacity provided by a single machine under its nominal configuration, is a critical point to reduce consumption and increase the performance of the process [
6].
Several authors tackle the refrigeration PRL problem using different data-driven approaches: from basic techniques, such as the creation of if–then rules based on the monitored data, to optimization strategies that use complex modelling and optimization algorithms. Although the first methods mentioned have been almost fully replaced by the optimization approaches, there is still some examples of compressor management rules that are created using the historical system data. An example of that is presented by [
7], where the authors decide which chillers should be running in a predefined scenario in order to minimize the energy consumption.
On the other hand, the optimization approaches are the most common techniques found in the literature. As an illustration of the current methodologies, some examples are cited: Zheng et al. in [
8] proposed the use of invasive weed optimization algorithms to search for the best combination of chillers for a given historical data; Saeedi et al. in [
9] presented a robust optimization method for PLR based on non-linear programming. The authors remarked that modeling the cooling load demand improves the response towards uncertainties, but the forecast model is no further used; Chien et al. in [
10] proposed the use of grey-box models for developing a decision-support system for assisted PLR. A combination of the cooling load forecasting together with multivariate adaptive regression is used for PLR prediction in different process scenarios; other authors, such as in [
11], perform the optimization considering wide time ranges and assuming steady conditions among the timesteps.
Despite the efforts made in this field, several limitations can be identified in order to apply the aforementioned methodologies into a real industrial scenario. For example, the rules extracted from the operation data analysis are always constrained to expert knowledge [
12]. Even though the expert masters the subject, it is difficult to get a near-optimal PLR configuration due to the number of signals involved in an industrial environment and its dynamics, which are constantly changing. Therefore, in order to consider a vast number of process variables and a constantly changing process with different dynamics, modelling the process behavior to select an optimal PLR is recommended for the application of such methods to real industrial processes.
Regarding the optimization approaches, such algorithms can achieve a major efficiency improvement at the expense of computation time. Nevertheless, the time needed to calculate the optimal PLR remains an issue in order to maintain the stability of the controlled asset [
13]. In refrigeration systems, it is very important to maintain the product in a specific temperature range to preserve its quality and, hence, fast changes in setpoints are necessary in order to preserve the desired temperature [
14]. In this regard, many approaches are searching for the optimal PLR by considering steady operational conditions within a specific time interval, assuming that no further changes or minimal changes appear during the time lapse. Nevertheless, it has been found that varying system conditions can drastically change the suitability of the PLR [
15], so changes in the operational conditions should be considered by the methodology in order to fulfill the process requirements.
Many authors use a cooling load forecasting model to improve the response of the optimization methods, but no more information is extracted about the compressors’ switching problem [
10]. Frequent switching scenarios in powerful compressors or refrigeration equipment can lead to process instability and huge energy losses [
16]. Such modelling information can be used, apart for improving the control effectiveness, to avoid unnecessary switching actions. It is crucial to minimize the number of starts and stops of compressors in order to maximize its remaining useful life (RUL) and minimize the energy consumption.
Finally, another shortcoming found in most data-driven approaches is the inability to obtain robust and optimal setpoint suggestions in scenarios that has not been represented in historical data. The historical data available constrain the best configuration recommendation if it has not happened previously. In addition, the recommendations lose reliability under new operational conditions.
To address such limitations, a near real-time data-driven methodology for the PLR problem is proposed. The method provides robust setpoint recommendations, considering the variables that affect the operation and the uncertainties associated with the data, employing a discretization technique and a novelty model as in our previous work [
17]. Therefore, the exposed limitations of the data-driven techniques are addressed using a near real-time setpoint proposal, which reduces the modelling uncertainties, as well as a proliferation strategy [
18], in order to create new optimal PLR configurations under each operational condition. Finally, the switching problem is approached by forecasting the demand behavior trends using the multi-layer perceptron (MLP) and evaluating if its optimal to start or stop each compressor.
This paper is organized as follows: First, the description of the refrigeration system and the PLR challenge is given in
Section 2.
Section 3 describes the basis of the proposed methodology for AI based PLR management. Finally,
Section 4 presents the experimental results about the application of the methodology to the refrigeration system and the corresponding discussion is given in
Section 5.
2. System Description and Problems Addressed
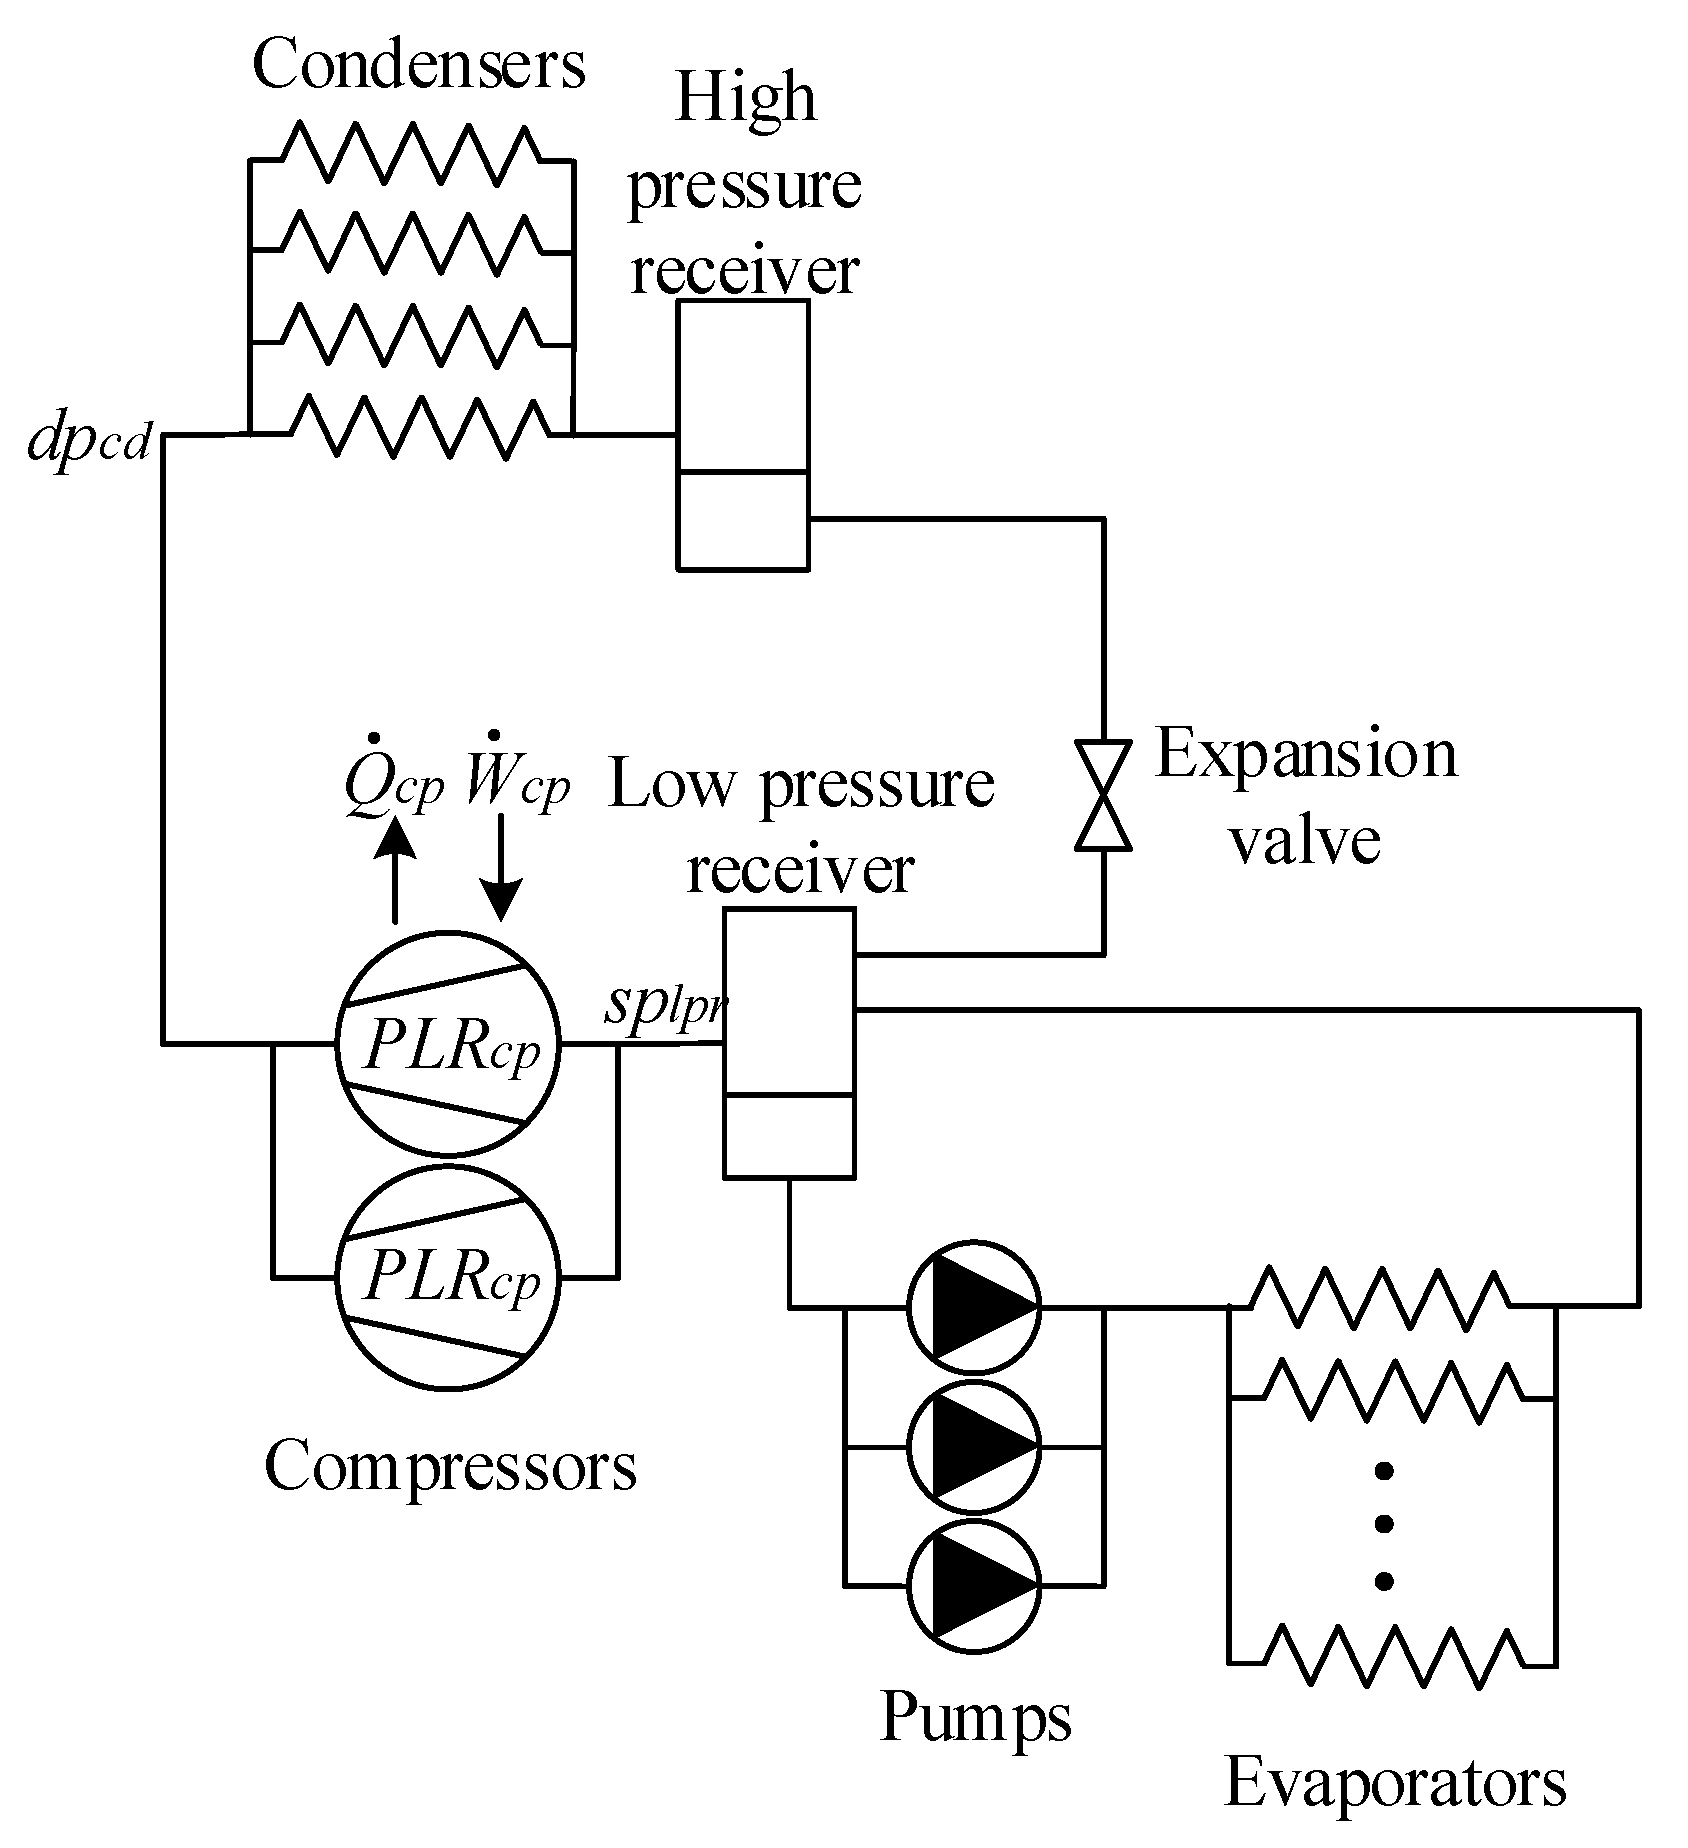
The test system is an overfeed vapor compression refrigeration cycle. The goal of these systems is to remove heat from a space. In order to accomplish such a task, a refrigerant circulates through the system depicted in
Figure 1. This system consists of two circuits: the first one is composed of four condensers, two compressors, an expansion device, a low-pressure separator receiver and a high-pressure receiver; and the second one is composed of a low-pressure separator receiver, a common element in both circuits, three pumps to force the liquid recirculation and various evaporators.
In the first circuit, the refrigerant (R717) in a vapor state is suctioned by the compressors from the low-pressure separator receiver to increase the refrigerant pressure (
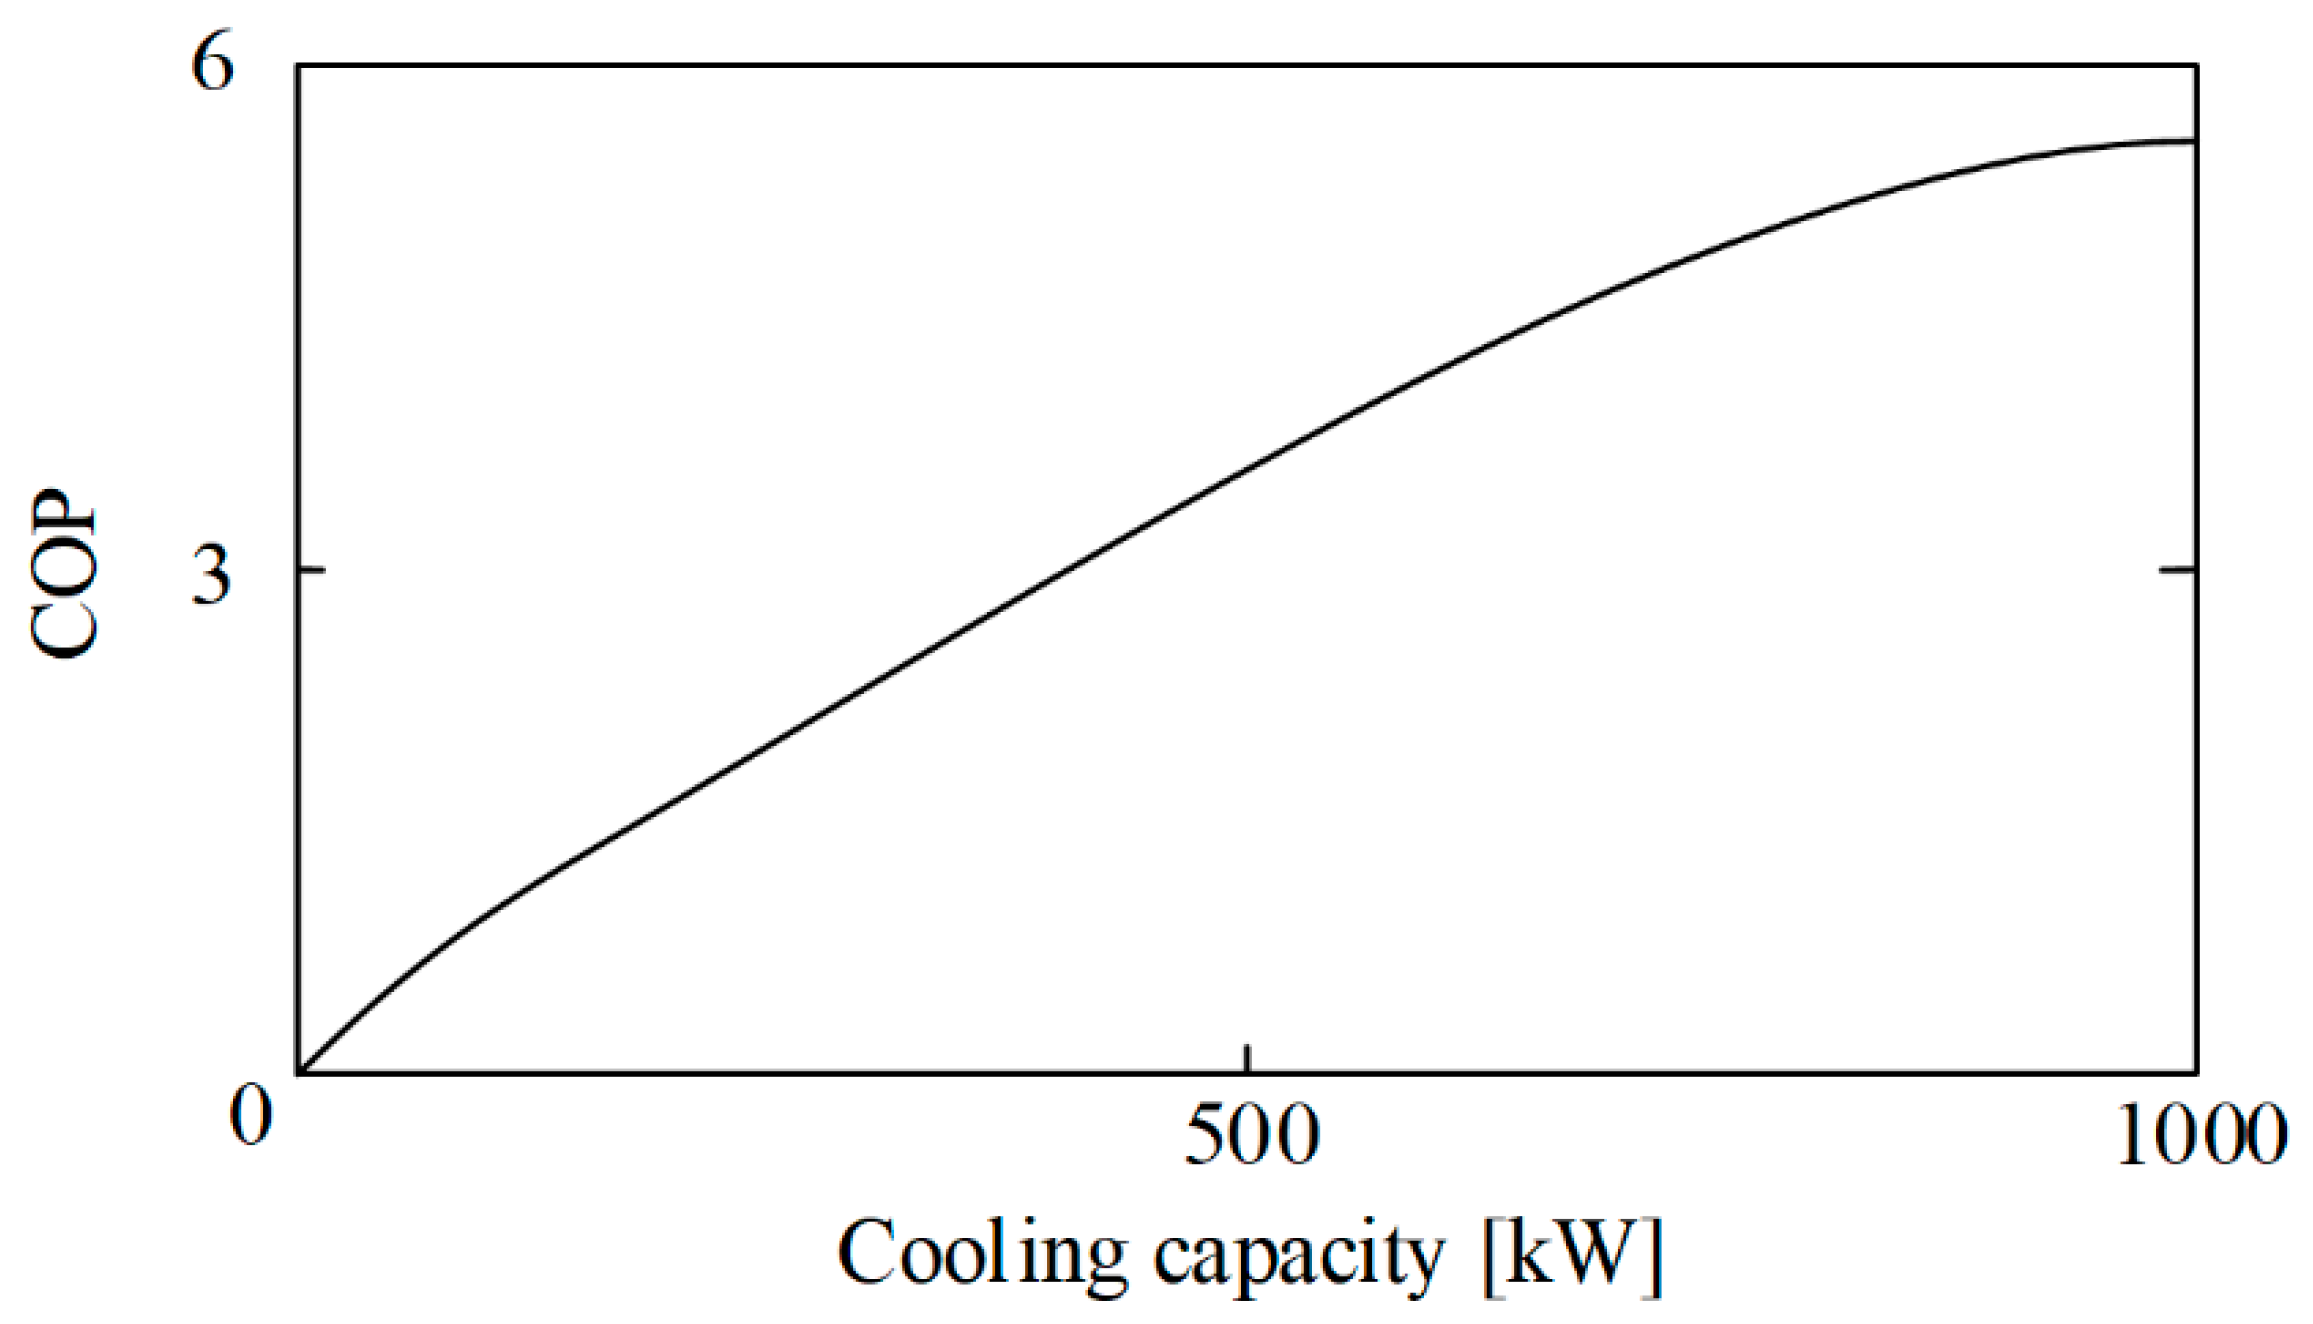
). In order to perform that job and to provide enough cooling capacity to satisfy the demand, two screw compressors are located in parallel. These compressors are the part of the system that consume the majority of the energy (
) [
19], and their performance is also highly reduced when their slide valves are below the nominal conditions (
) [
20]. Such a scenario can be appreciated in
Figure 2, where the coefficient of performance (COP), which determinates the efficiency of the compressor, is lower in the lower percentages of cooling capacity.
In the condensers, the refrigerant is cooled to change the phase from vapor to liquid and reject the heat. Finally, the low-pressure receiver, which is the common part of both circuits, contains R717 in a mixture in a vapor–liquid state. The pressure inside the receiver () is maintained by the compressors and its setpoint is stablished considering the desired evaporation temperature.
In the second circuit, the refrigerant is suctioned by the pumps and led to the evaporator. The pumps are used to guarantee the refrigerant overfeed mass flow through the evaporators distributed alongside the chambers of the facility. Afterwards, in the evaporators located at the different chambers, the refrigerant is partially evaporated and then returned to the low-pressure separator receiver [
21].
Although the whole refrigeration system contains a vast number of variables, the signals used in the paper are listed in
Table 1, and located as depicted in
Figure 1.
3. Energy Optimization Method
A data-driven energy optimization methodology is proposed to address the aforementioned challenges and propose an optimal PLR for the compressors. The methodology uses the data acquired from the refrigeration system in order to develop machine-learning algorithms for process modelling. Subsequently, such models are combined together to generate the optimal slide valve setpoints, which is the PLR, for each compressor in the refrigeration system with regard to process operation.
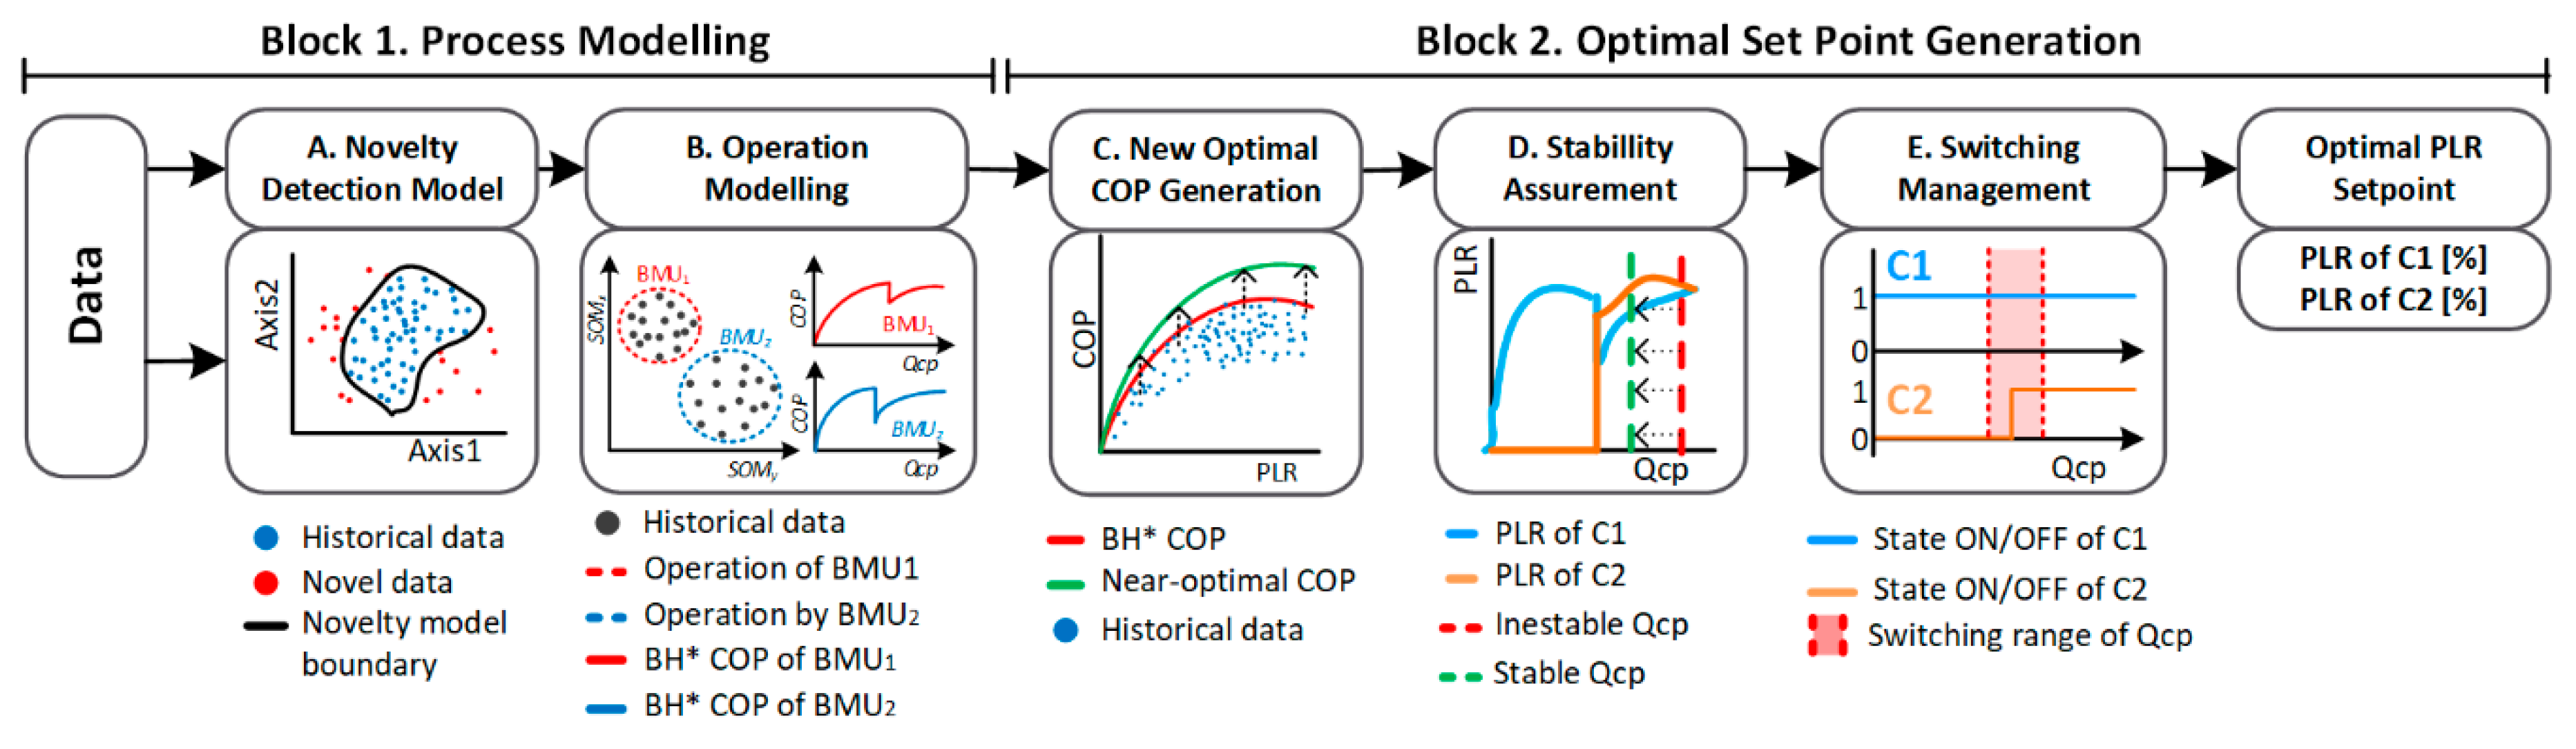
The overall description of the method is presented in
Figure 4. The method is organized in two main blocks (1 and 2) and five different steps (A–E): Block 1 covers Steps A and B, and its objective is to ensure robustness by training the data with a novelty model, and model the refrigeration system taking into account the operation conditions using a self-organizing map (SOM). On the other hand, Block 2 includes Steps C to E, and it is focused on how to use such information together with future trends in order to generate robust and optimal PLR setpoints for each compressor.
Starting from the process data, a multivariate kernel density estimation (MVKDE) novelty model is fitted to the training dataset in Step A. This is an important step in order to filter outlier samples in subsequent stages. Such outliers in the process modelling may lead to recommending non-representative operations, and hence induce uncertainty.
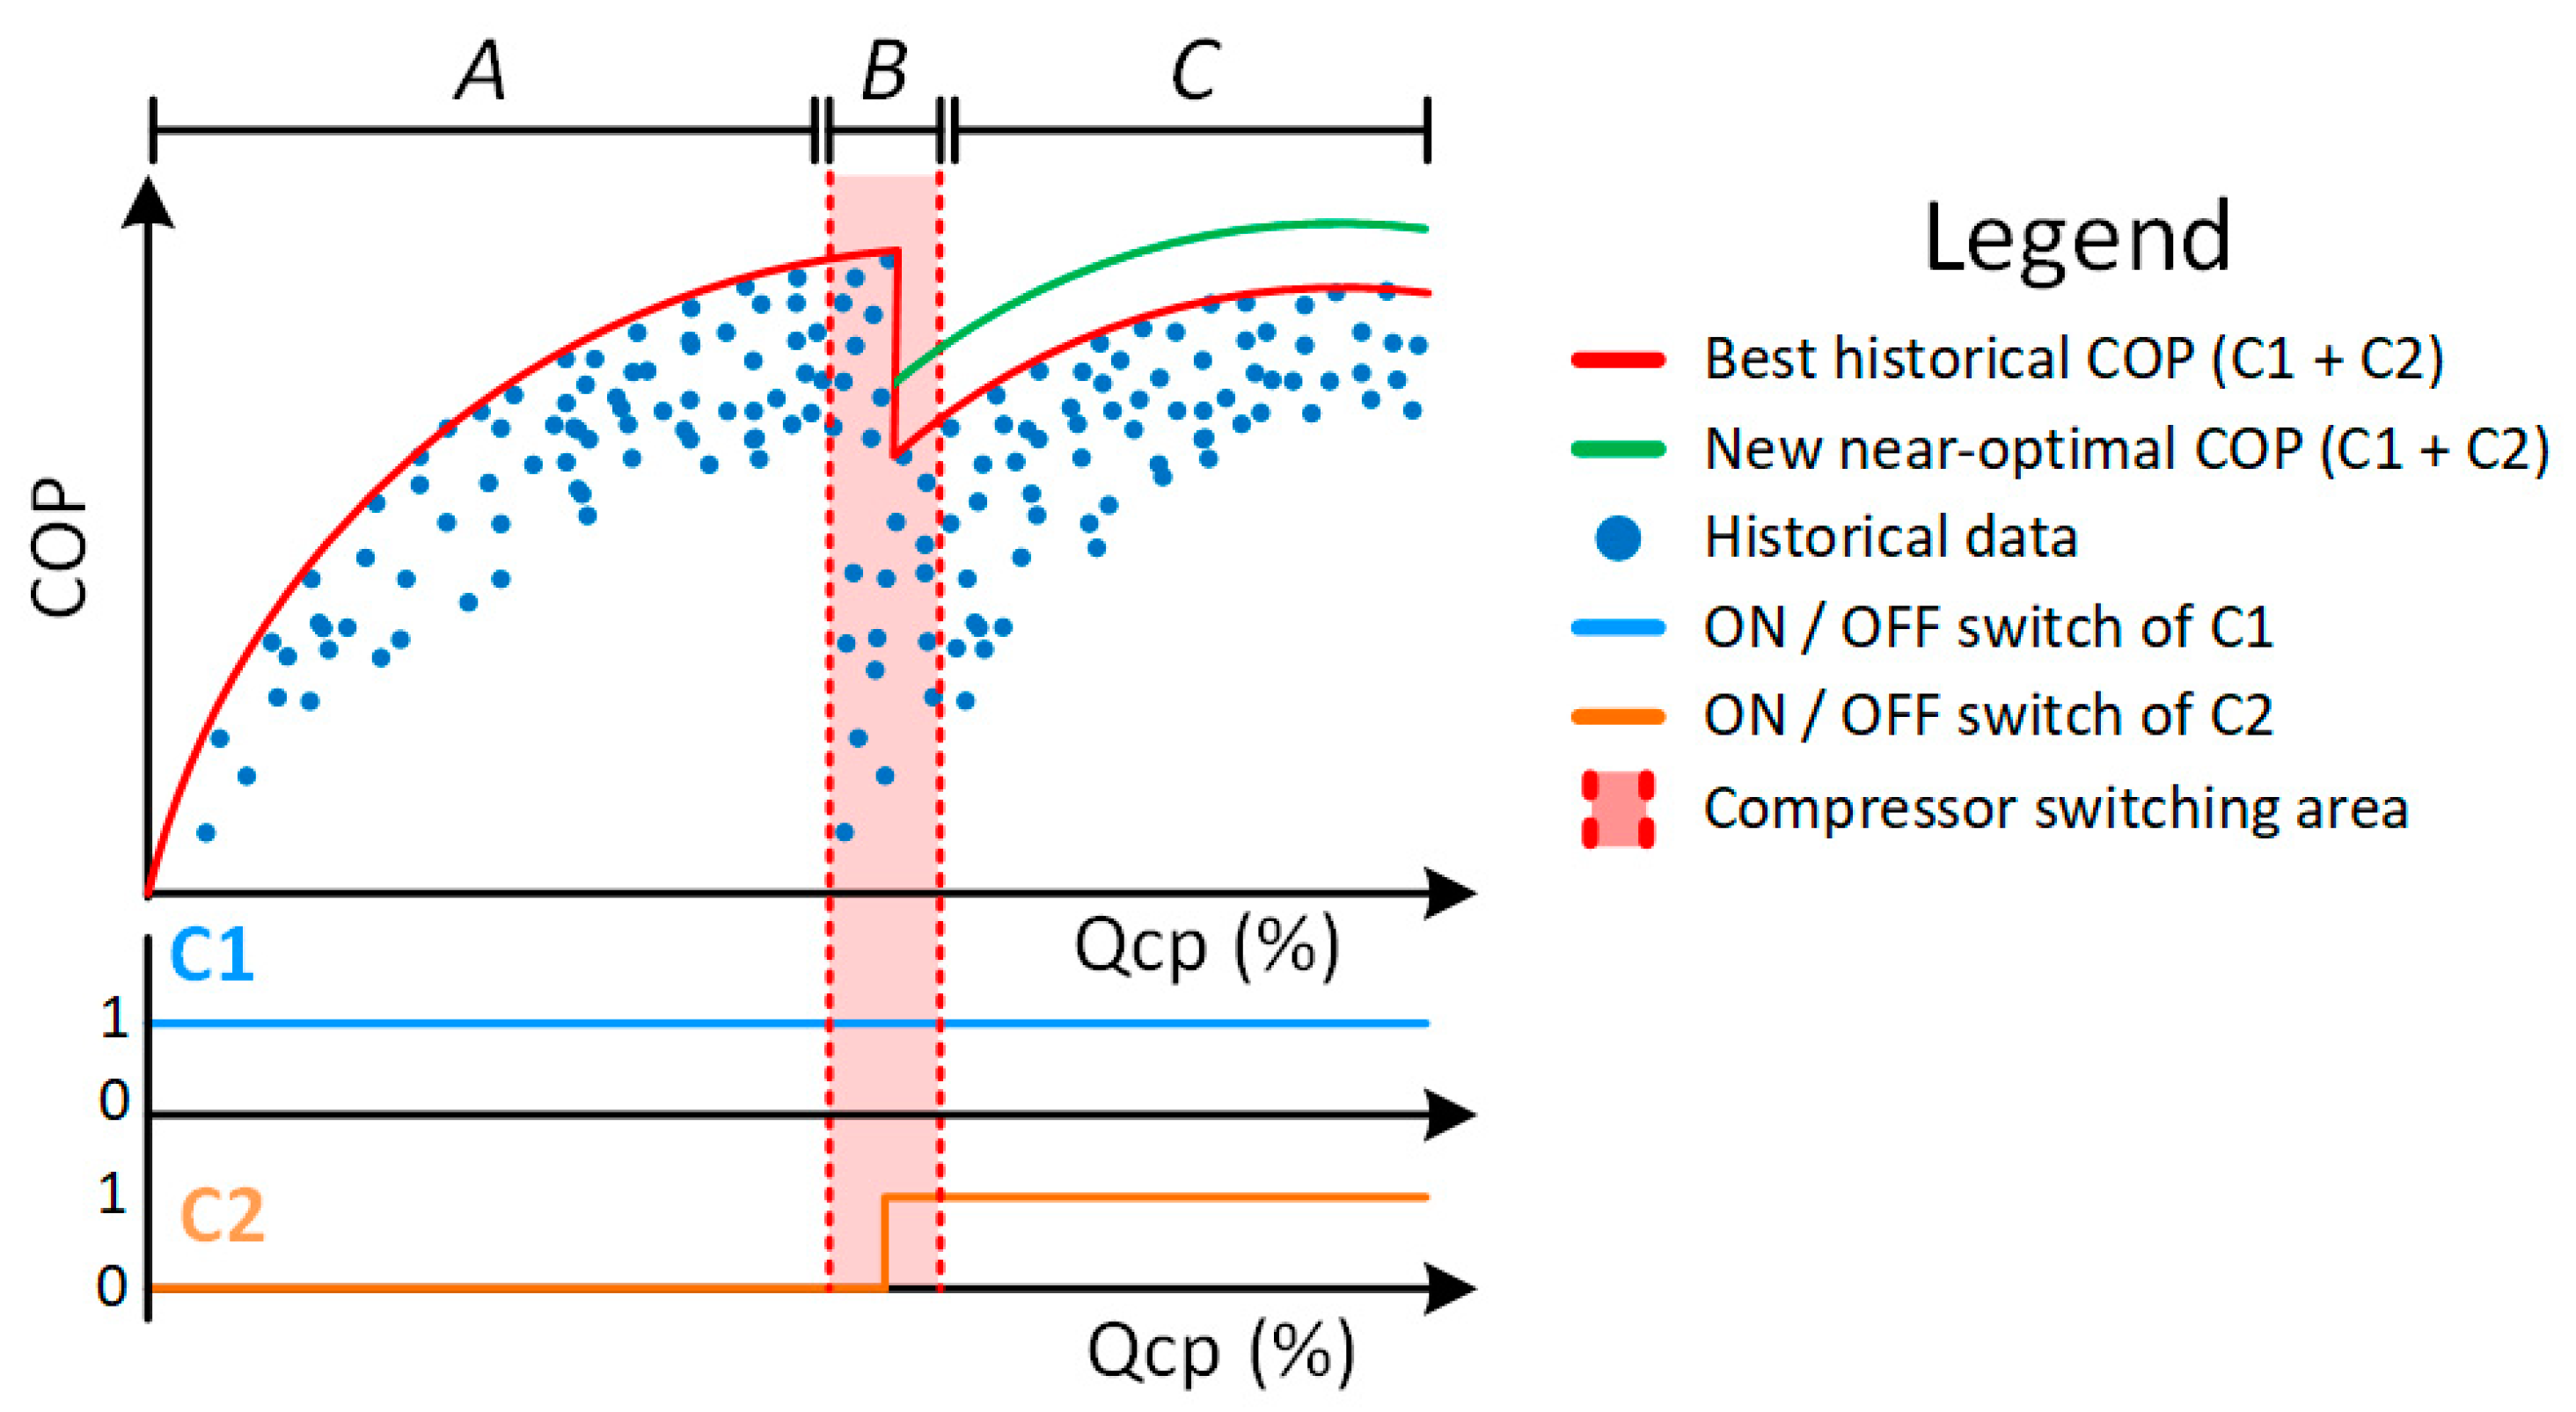
Then, in Step B, the refrigeration process operation is modelled with an SOM in order to codify the operation of the process in a concrete number of operating points (the best-matching units (BMU)). Then, for each BMU, the historical curves of the COP values and its associated PLR curves for each compressor are calculated. As a result, each BMU contains a performance curve, similar to
Figure 3, with the information regarding the best historical COP found in the database for any
and its associated PLR for each compressor.
However, the performance improvement of the system is limited to follow the best historical compressor configuration. To overcome this limitation, a COP proliferation approach is proposed in Step C to obtain a new optimal combination of compressors for each BMU of the SOM never seen in the historical database.
At this point, we are able to define optimal PLR setpoints for both compressors; however, the behavior of the refrigeration process requires the control of the suction pressure to maintain the refrigerant temperature in a safe range. In this paper, a process stability method to shift the current evaluating the PLR curves is proposed in Step D. Such shifting of the value allows the control of the desired refrigerant temperature in a certain range.
At this stage of the methodology, a near-optimal and stable setpoint is already generated. Nevertheless, the regular operation of a refrigeration system with more than one operating compressor may lead to situations in which the same demand could be supplied with one or more compressors. Therefore, Step E deals with the problem of how to avoid unnecessary switch on/off actions. This step introduces a demand forecasting method to identify future trends of the cooling capacity required in order to assure an optimal decision of switching the current number of compressors.
Finally, the output of the proposed operation optimization methodology is the selection of the near-optimal PLR setpoints of each compressor of the refrigeration process. In this regard, the following sections cover the detailed explanation of Steps A–E defined above.
3.1. Step A: Novelty Detection Model
The method needs to verify that the current evaluated data does not differ, to a great extent, from the data used to train the algorithms. Hence, in Step A, the data is evaluated with a novelty model to detect new operational conditions and avoid non-representative setpoint suggestions, which can lead the system to an unknown operational mode. To implement this outlier detection step, the statistical non-parametric anomaly detection MVKDE algorithm is used. The main benefit of the chosen algorithm is that it can be optimized for each variable of the space in comparison with other classical techniques, such as OC-SVM [
22], whose hyper parameters are unique regarding the number of variables analyzed. Furthermore, as can be seen in the exhaustive study made by Domingues et al. [
23], the selected algorithm presents high robustness against noise, high dimensionality and stability. The details of the novelty model are explained in more detail in our previous work [
17].
3.2. Step B: Process Operation Modelling
Afterwards, in Step B, the operation of the process is modelled with an SOM. The variables that represent the current behavior of the process are input in an SOM grid. In this regard, each position of the grid (BMU) models a certain range of the process variables. Therefore, the trained SOM knows for each operating condition of the refrigeration system the best curve obtained in the historical database. Thus, as a result of Step B, the process model contains the best PLRs for each compressor of the system under the specific operational conditions delimited by each BMU of the SOM grid.
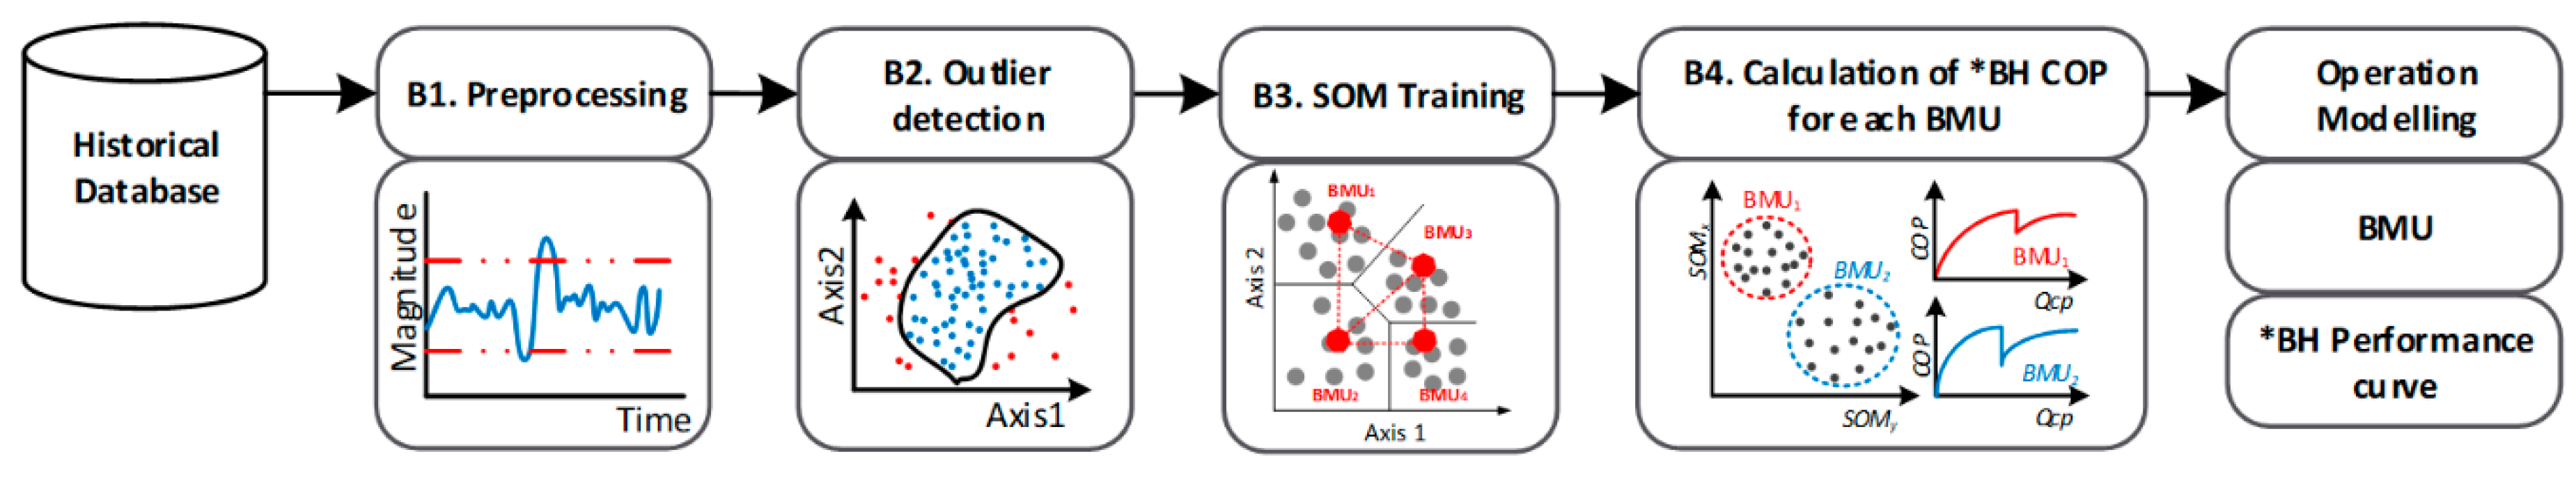
The operational grid creation is described in
Figure 5, which is one of the core steps of the presented methodology overview, shown in Step B of
Figure 4. First of all, in B1 the data is preprocessed to exclude the wrongly recorded samples. Then, in B2, the novelty model defined in Step A is evaluated in order to reject the non-representative process operation samples. Subsequently, in B3, an SOM is used to discretize, in a defined interval of best-matching units (BMU), the multivariate space formed by the considered input variables. After the training procedure, each BMU of the SOM represents a certain range of the input variables defined as an operational point. The objective of the method is to use this model of the process to search, for each BMU, the best PLRs found in the historical database for any
used. With the system operation discretized and the outliers filtered, the best historical setpoints of each neuron of the grid are selected, in B4, to obtain the best PLR recommendations that the system has ever achieved. All the phases described below are part of our previous work [
17], where they are comprehensively described.
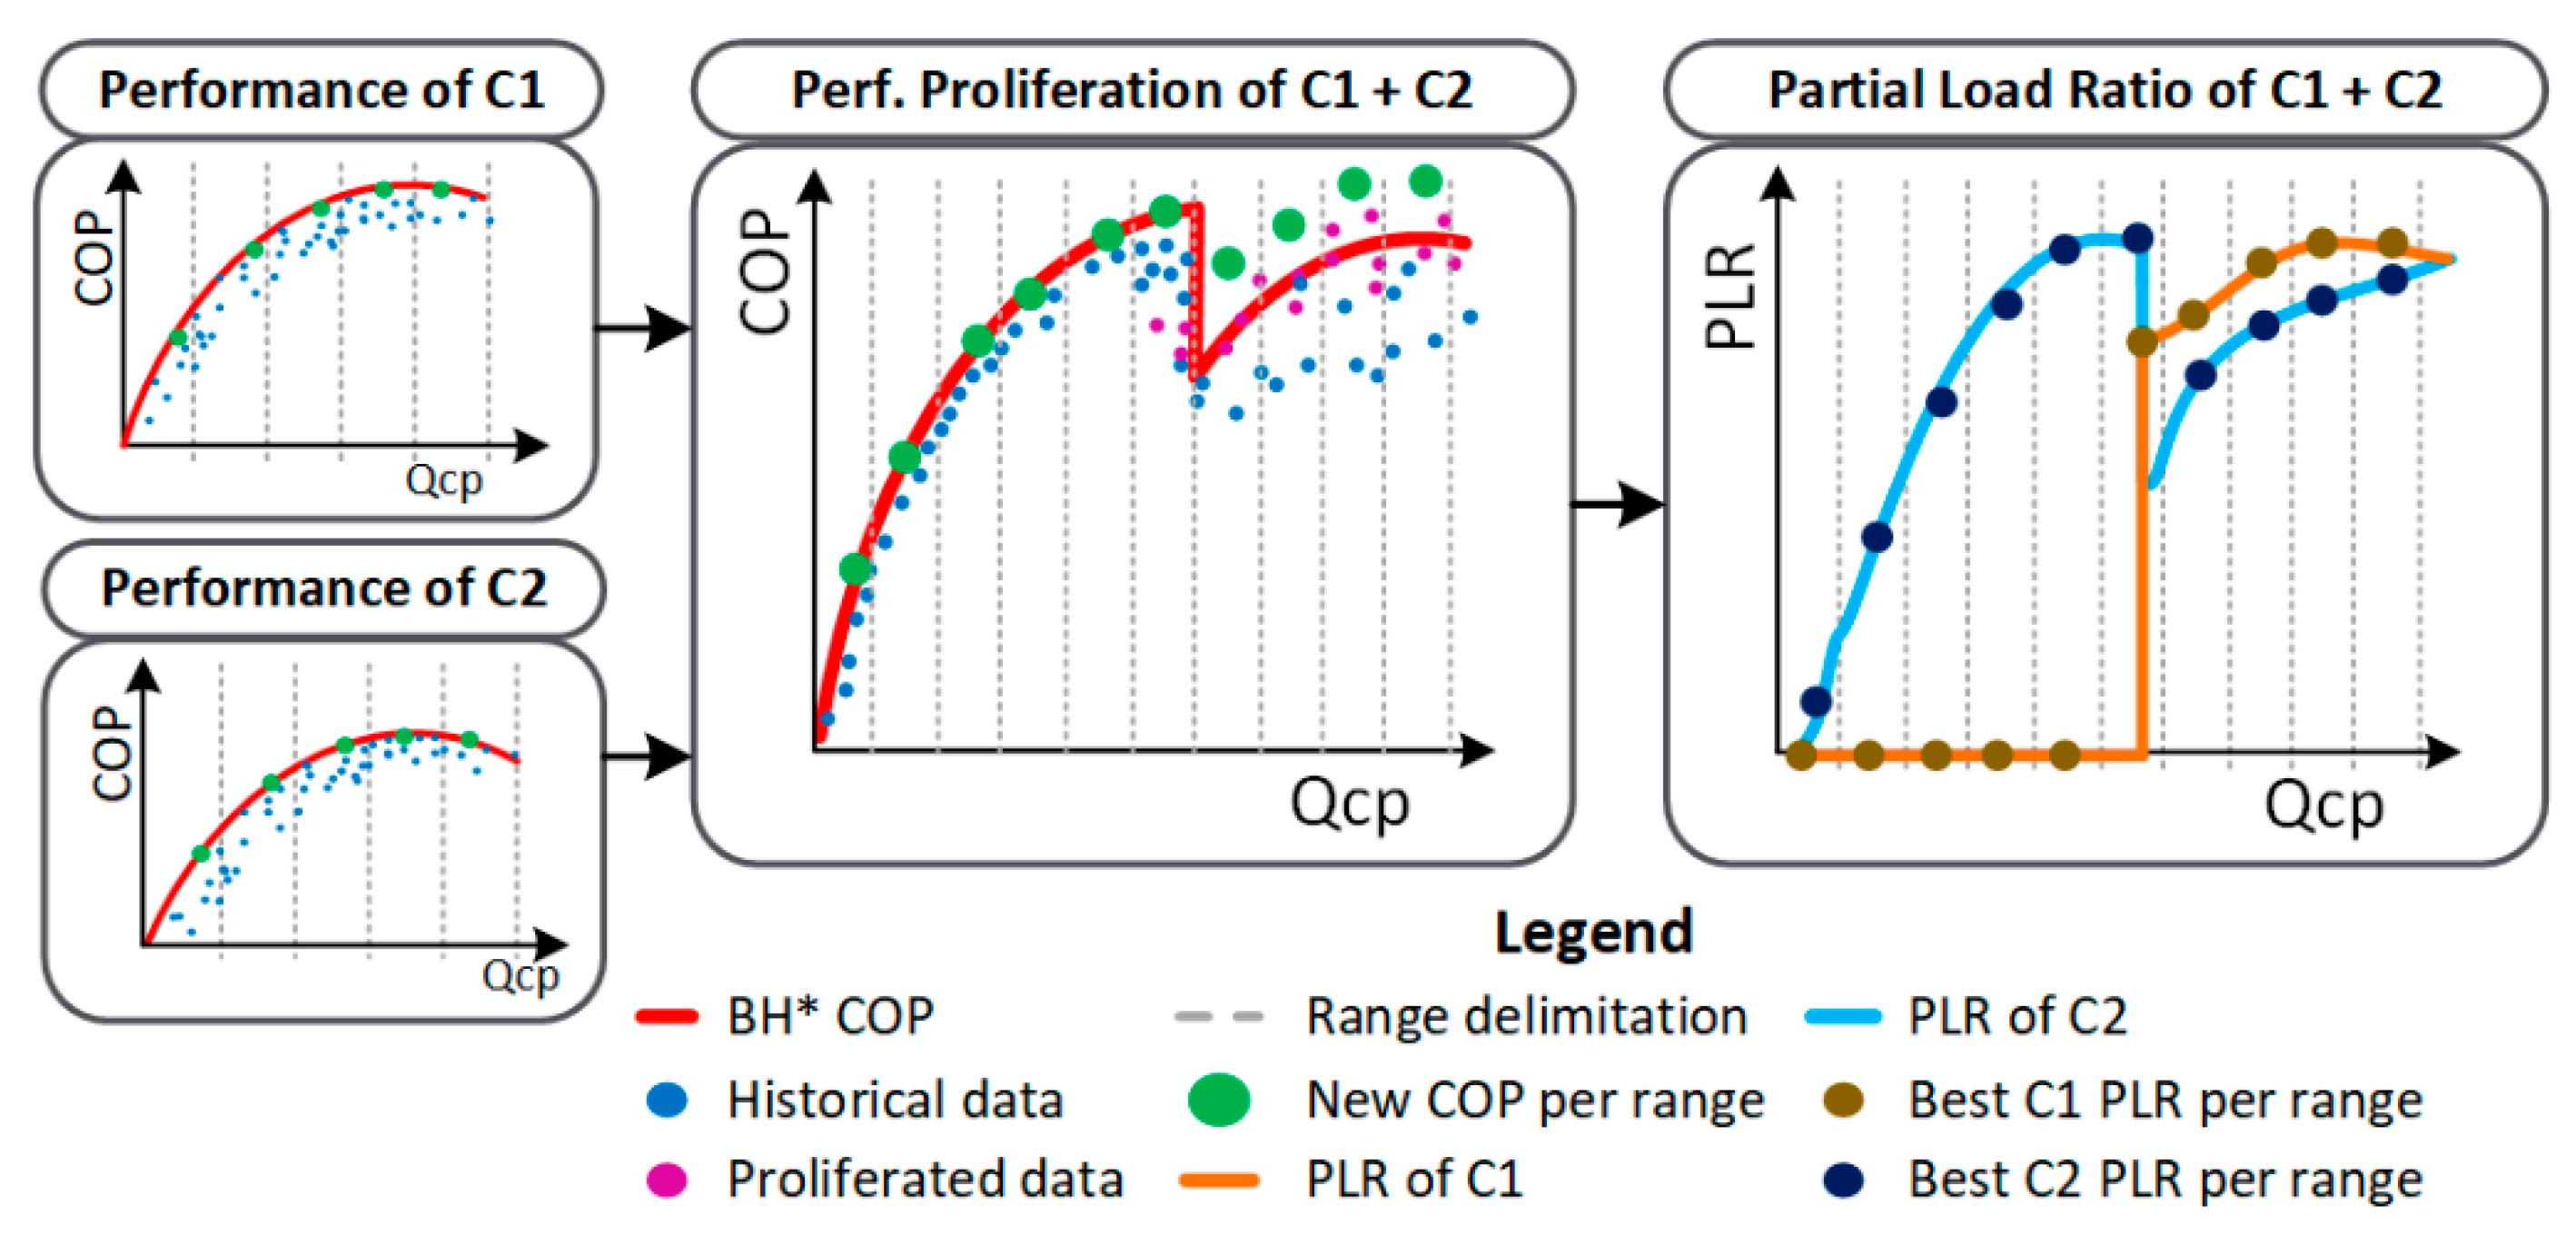
3.3. Step C: New Near-Optimal PLR Curve Calculation
Until this step, the setpoints generated by the methodology were based and limited to the historical operation of the system. To overcome this constraint, in Step C, the data proliferation strategy is applied to the SOM model in order to obtain, by means of historical data combinations of the PLR from the compressors, new and optimal operational strategies not considered in the available data.
The data proliferation technique is presented by [
18], which consists of the combination of different historical samples to create new artificial performance points. This methodology can be applied as the different compressors or chillers are discretized in areas under the same operational conditions, where they can be considered as linearly independent. Hence, the method proposes to perform a proliferation of the different machine cooling capacities, and its associated electrical consumption, for the samples in each BMU where the operating conditions are similar. The steps to obtain the near-optimal PLR of each compressor are detailed in
Figure 6, illustrated below.
First of all, with a high number of historical samples, the computational cost of the combinations increases rapidly, being non-viable in most scenarios. To overcome such a limitation, the samples under the optimal operation curve of each compressor or chiller, found in the operational modelling step, are dismissed and only the best sample of each cooling capacity range is used. To perform such a task, the cooling capacity of each machine is divided within n ranges and the samples with the best COP are maintained to perform the proliferation. Thanks to these scenarios created with the data proliferation, new near-optimal performance boundaries, never seen before in the historical dataset, can be found, overcoming the historical control rules that limited the operation situations. Finally, the refrigeration system’s cooling capacity is divided again in various ranges to detect the best COP samples, whether it be from the historical or the proliferated ones. With such samples selected, the PLRs of each compressor are identified.
Therefore, the resulting SOM model results in a multi-dimensional grid, which for a defined set of process conditions is able to recommend a near-optimal PLR. The corresponding BMU contains a near-optimal curve that relates the cooling capacity required by the system in such an operation with the new near-optimal PLR of the compressors.
3.4. Step D: Process Stabillity Assurance
Till this point, the operation modelling provides the best setpoint recommendation for the current operational conditions. However, to follow the desired suction pressure setpoint and to avoid abrupt changes in the compressors, which can lead to an undesired unstable situation, two strategies are proposed in step D of
Figure 4.
First, the behavior of the refrigeration process requires the control of the suction pressure to maintain the refrigerant temperature in a safe range. Therefore, a curve shift procedure of the demand at each iteration is carried out according to the suction pressure deviation. Shifting such values allows to change the operating point of the compressors and assure the stability of the process.
The authors propose to shift the demand according to a polynomial function that relates the allowed pressure error with the desired correction. This correction is adjusted with regard to the dynamics of the process.
Secondly, in order to smooth the setpoint recommendation among the different operational point transitions, and to avoid unstable situations, a weighted sum of the nearest operational points is made employing the Euclidean distance of each neuron. Thus, the compressors do not change the partial load recommendation abruptly from one neuron to another and the system remains stable in terms of suction pressure.
The first measure, the shifting, is performed as explained below. Under the selected operational point, the current cooling power expenditure is shifted using the equation that relates the cooling power and pressure error:
where
is the corrected cooling capacity,
Epre corresponds to the pressure error,
to the current cooling capacity required by the process and
is the correction ratio.
Regarding the transition smoothing, among the different PLR setpoints, a weighted sum of the nearest neurons of the operation grid is done according to
where
is the partial load of the
N compressor,
K is the number of the closer neurons,
is the partial load recommended by neuron
i and
is the weight associated with neuron
i. This weight parameter α is calculated using
with
presented in
where
d is the Euclidean distance from the sample to the neuron.
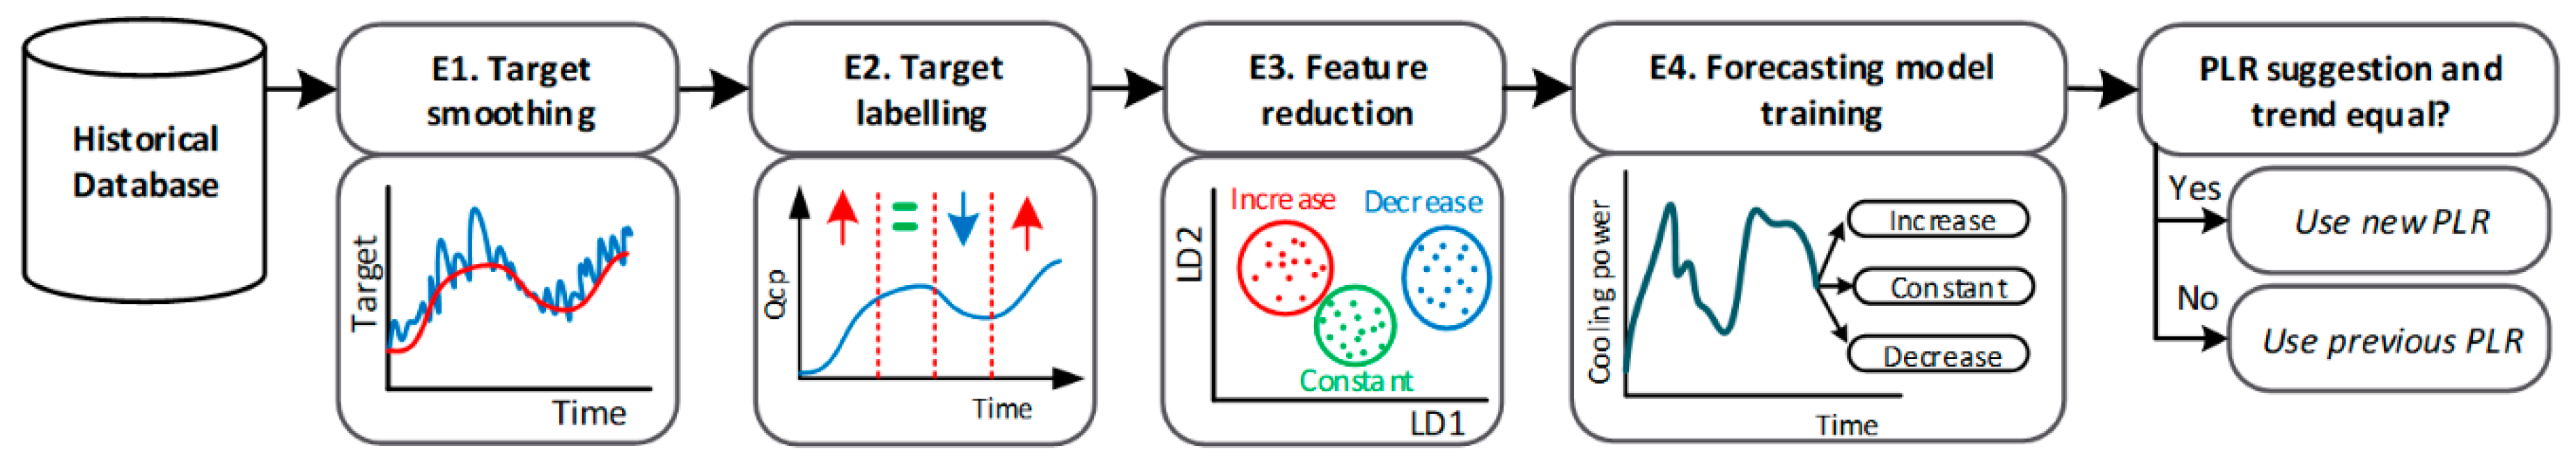
3.5. Step E: Switching Management
Finally, the last part of the method deals with the compressor switching problem exposed before. In this regard, Step E is activated when the number of running compressors proposed by the operation grid vary from the current one. To obtain a robust setpoint recommendation in this conflictive boundary decision circumstances, a trend forecasting model is trained and evaluated to ensure that the switch operation will last at least until a predefined time horizon. If the operational grid proposes to increase the number of running compressors and the forecasting trend is positive, or if the operation grid proposes to decrease the number of running compressors and the forecast trend is negative, the suggested switch is executed. Differently, if the decisions do not converge in the setpoint suggestion, the operation is maintained until the next evaluation.
The decision management in the boundaries displayed in Step E is handled with a consumption trend forecast, which is detailed in
Figure 7. As the forecasting is based in the historical data retrieved from the database, firstly, in E1, the desired target variable is smoothed to highlight the trend and avoid the high frequency noise caused by unpredictable events in the refrigeration system. Once the horizon of the forecast is set, the smoothed target variable is categorized in three classes: increase, constant or decrease, depending on the slope of the variable, as shown in E2. As the forecast problem is interpreted as a classification and to help the later model to improve its accuracy, all the inputs are passed through a feature reduction step, E3, such as linear discriminant analysis (LDA), which helps the posterior model to improve the inference of the trend patterns. Finally, to perform the trend forecasting at a defined forecasting horizon, in E4, a multilayer perceptron neural network (MLP) is used to detect the trend, with the given features from the LDA as inputs.
Therefore, the switching management method consists of comparing the expected evolution of the , provided by the MLP at a defined forecasting horizon, with the proposed PLR, resulting in the current . Such a comparison provides robustness to the decision of switching compressors with the following logic: If the PLR recommended by the methodology and the future trend specified by the MLP are consistent, the switching action can be executed and the PLR suggested by the method is used. If the future trend and the current PLR are not consistent, the current PLR is discarded and the previous one without any switching operation is preserved.
4. Experimental Results
The presented methodology is validated under the real refrigeration system described in
Section 2. The data used to train the models consists of samples acquired every minute over two years of operation, from August 2017 to 2019. The raw variables acquired from the studied system are discharge pressure, suction pressure, compressors partial load, compressors cooling power and compressors electrical power. It should be noticed that the signals that the methodology uses are currently being registered in most industrial refrigeration processes. In this regard, due to the low data acquisition requirements in terms of minutes, it does not require any specific instrumentation equipment.
4.1. Training and Configuration of the Models
First, the method starts with the training of the novelty detection model. The objective of the model is to identify new operational conditions of the refrigeration system to provide robust recommendations instead of recommendations based on uncertain conditions. To accomplish this objective, the model is trained with the whole training dataset but is configured to reject a percentage of the samples that lays outside of the distribution. The multivariate kernel density estimator (MKDE) with a Gaussian kernel was selected as a novelty model and, after some tests, 10% of the samples were identified as anomalies by the model during the training step.
Regarding the process operation modelling, the suction pressure and the discharge pressure were used to discretize the compressor operation under different pressure conditions using the SOM network. The SOM configuration consists of a rectangular grid type with a planar map type, a Gaussian neighborhood function and a 15 × 15 grid of neurons. The size of the grid has been selected together with the experts of the system to obtain the optimal discretization and variability of the main variables within its BMU. The objective was that each neuron should represents a real operation condition instead of insignificant changes of the variables. Furthermore, this result is assured to employ a trade-off between the number of operating points for each neuron and the obtained ranges of the variables in the BMUs. The configuration selected presents a good characterization resolution with a low quantization error of 0.013, which is good despite the different conditions of the process, such as seasonality.
With the trained SOM, the near-optimal PLR curves for each BMU were calculated. Initially, the full range of cooling capacities for each compressor was discretized into 25 different parts and the PLR of each discretized part that produces the best COP was selected. Thus, the computational cost of the subsequent proliferation is diminished by dismissing this large volume of historical samples and just keeping 25 samples for each compressor in each BMU. These 50 samples, 25 for each compressor, were proliferated to obtain a near-optimal COP configuration. The proliferation supposes a total of 625 artificially created samples in each BMU, which means a total of 140,625 samples in the whole SOM grid. Finally, the near-optimal COP curve regarding the cooling capacity is also discretized into 45 parts, and the best COP sample of each range is selected to acquire the PLRs of each compressor.
On the other hand, for the trend forecast training, the first preprocessing step was done in the same way as in the operation grid. To reduce the noise in the target variable, an exponential moving average was performed with a 200-sample span. Later, with a prediction horizon of 20 min, selected by the system experts, the target was divided into three different categories. As the initial inputs to do the forecasting, different lags of the smoothed target variable and the suction pressure were used. These mentioned inputs were scaled and passed through an LDA to reduce its dimensionality to two components in order to be finally used as the MLP inputs. Furthermore, the train and test sets were randomly divided into 60% and 40%, respectively, and the train classes were balanced. The MLP was configured with two hidden layers of 16 neurons, each one with a rectified linear unit (ReLU) and as many outputs as the classification classes with a softmax activation function. The optimizer used was the stochastic gradient descent (SGD) and the loss function was the categorical cross-entropy. All the parameters selected for the MLP configuration were chosen using a grid search with multiple options, and cross validation with accuracy as the performance metric. The accuracy of the model in the test set is about 70% and the confusion matrix is shown in
Table 2.
The obtained accuracy, despite not being really high, is robust in terms that the vast majority of the errors are not between the decrease and increase states, which would lead to a machinery inefficiency. Furthermore, such low performance is attributed to the lack of load data. The different processes in the industry related with the refrigeration system can vary its thermal load substantially depending on the operators’ behavior and process requirements.
To highlight the advantages of the methodology in terms of savings, two particular cases are presented: the first one, in which the new optimal partial load ratios are suggested in the scenario where high cooling capacities are demanded and two compressors are needed undoubtedly; and the second one, in which the PLRs are recommended during cooling capacities that led to the switching of one of the compressors.
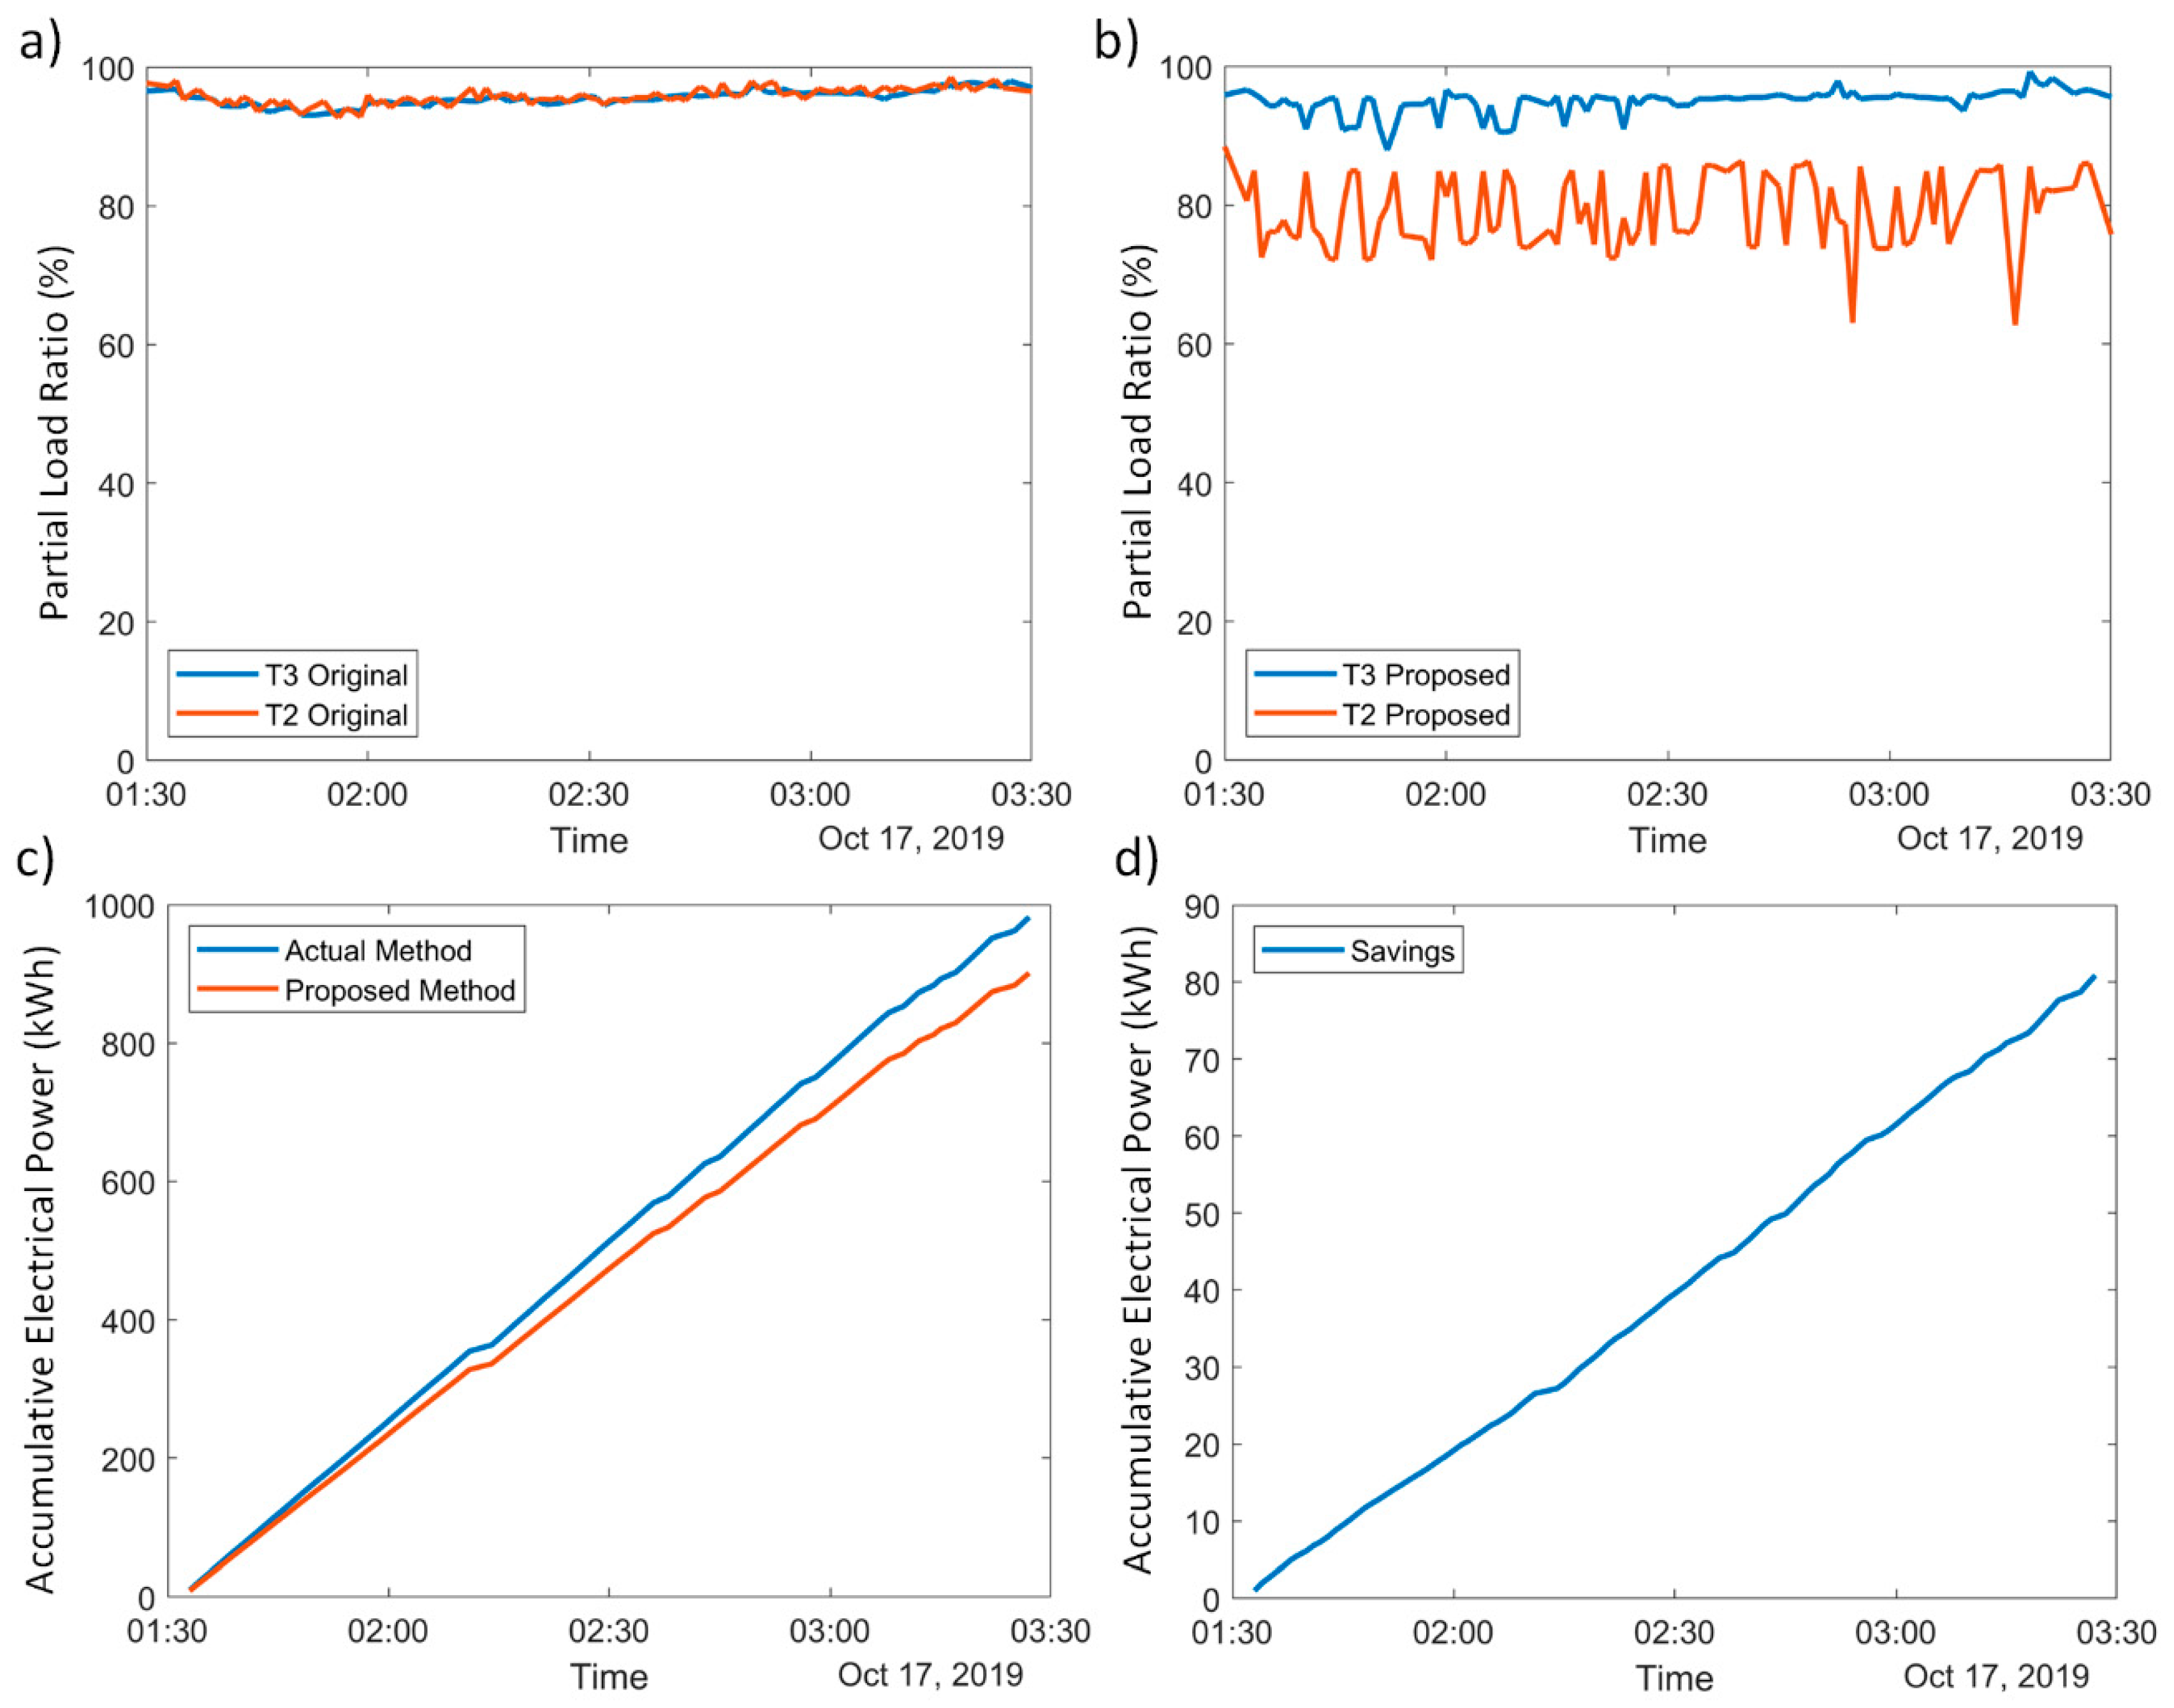
4.2. Results—Scenario 1: Two Compressors
During this first scenario of the refrigeration system’s operation, the original control scheme maintains the PLR of both compressors under a similar and constant regime, instead of customizing it to maximize the COP; such behavior can be seen in
Figure 8a. In comparison, in the same scenario, the methodology proposed analyzes the operational condition of the refrigeration system and recommend a different PLR for both compressors, obtaining the desired cooling capacity but minimizing the electrical consumption; such a difference can be seen in
Figure 8b. If the accumulative electrical power consumed by both approaches are compared over a period of time, it can be seen in
Figure 8c that the proposed method achieves a slightly lower consumption (80 kW) over the two-hour comparison; such a difference is highlighted in
Figure 8d in terms of savings, which corresponds to 7% of the average electrical consumption per hour in this scenario.
4.3. Results—Scenario 2: Compressors Switching
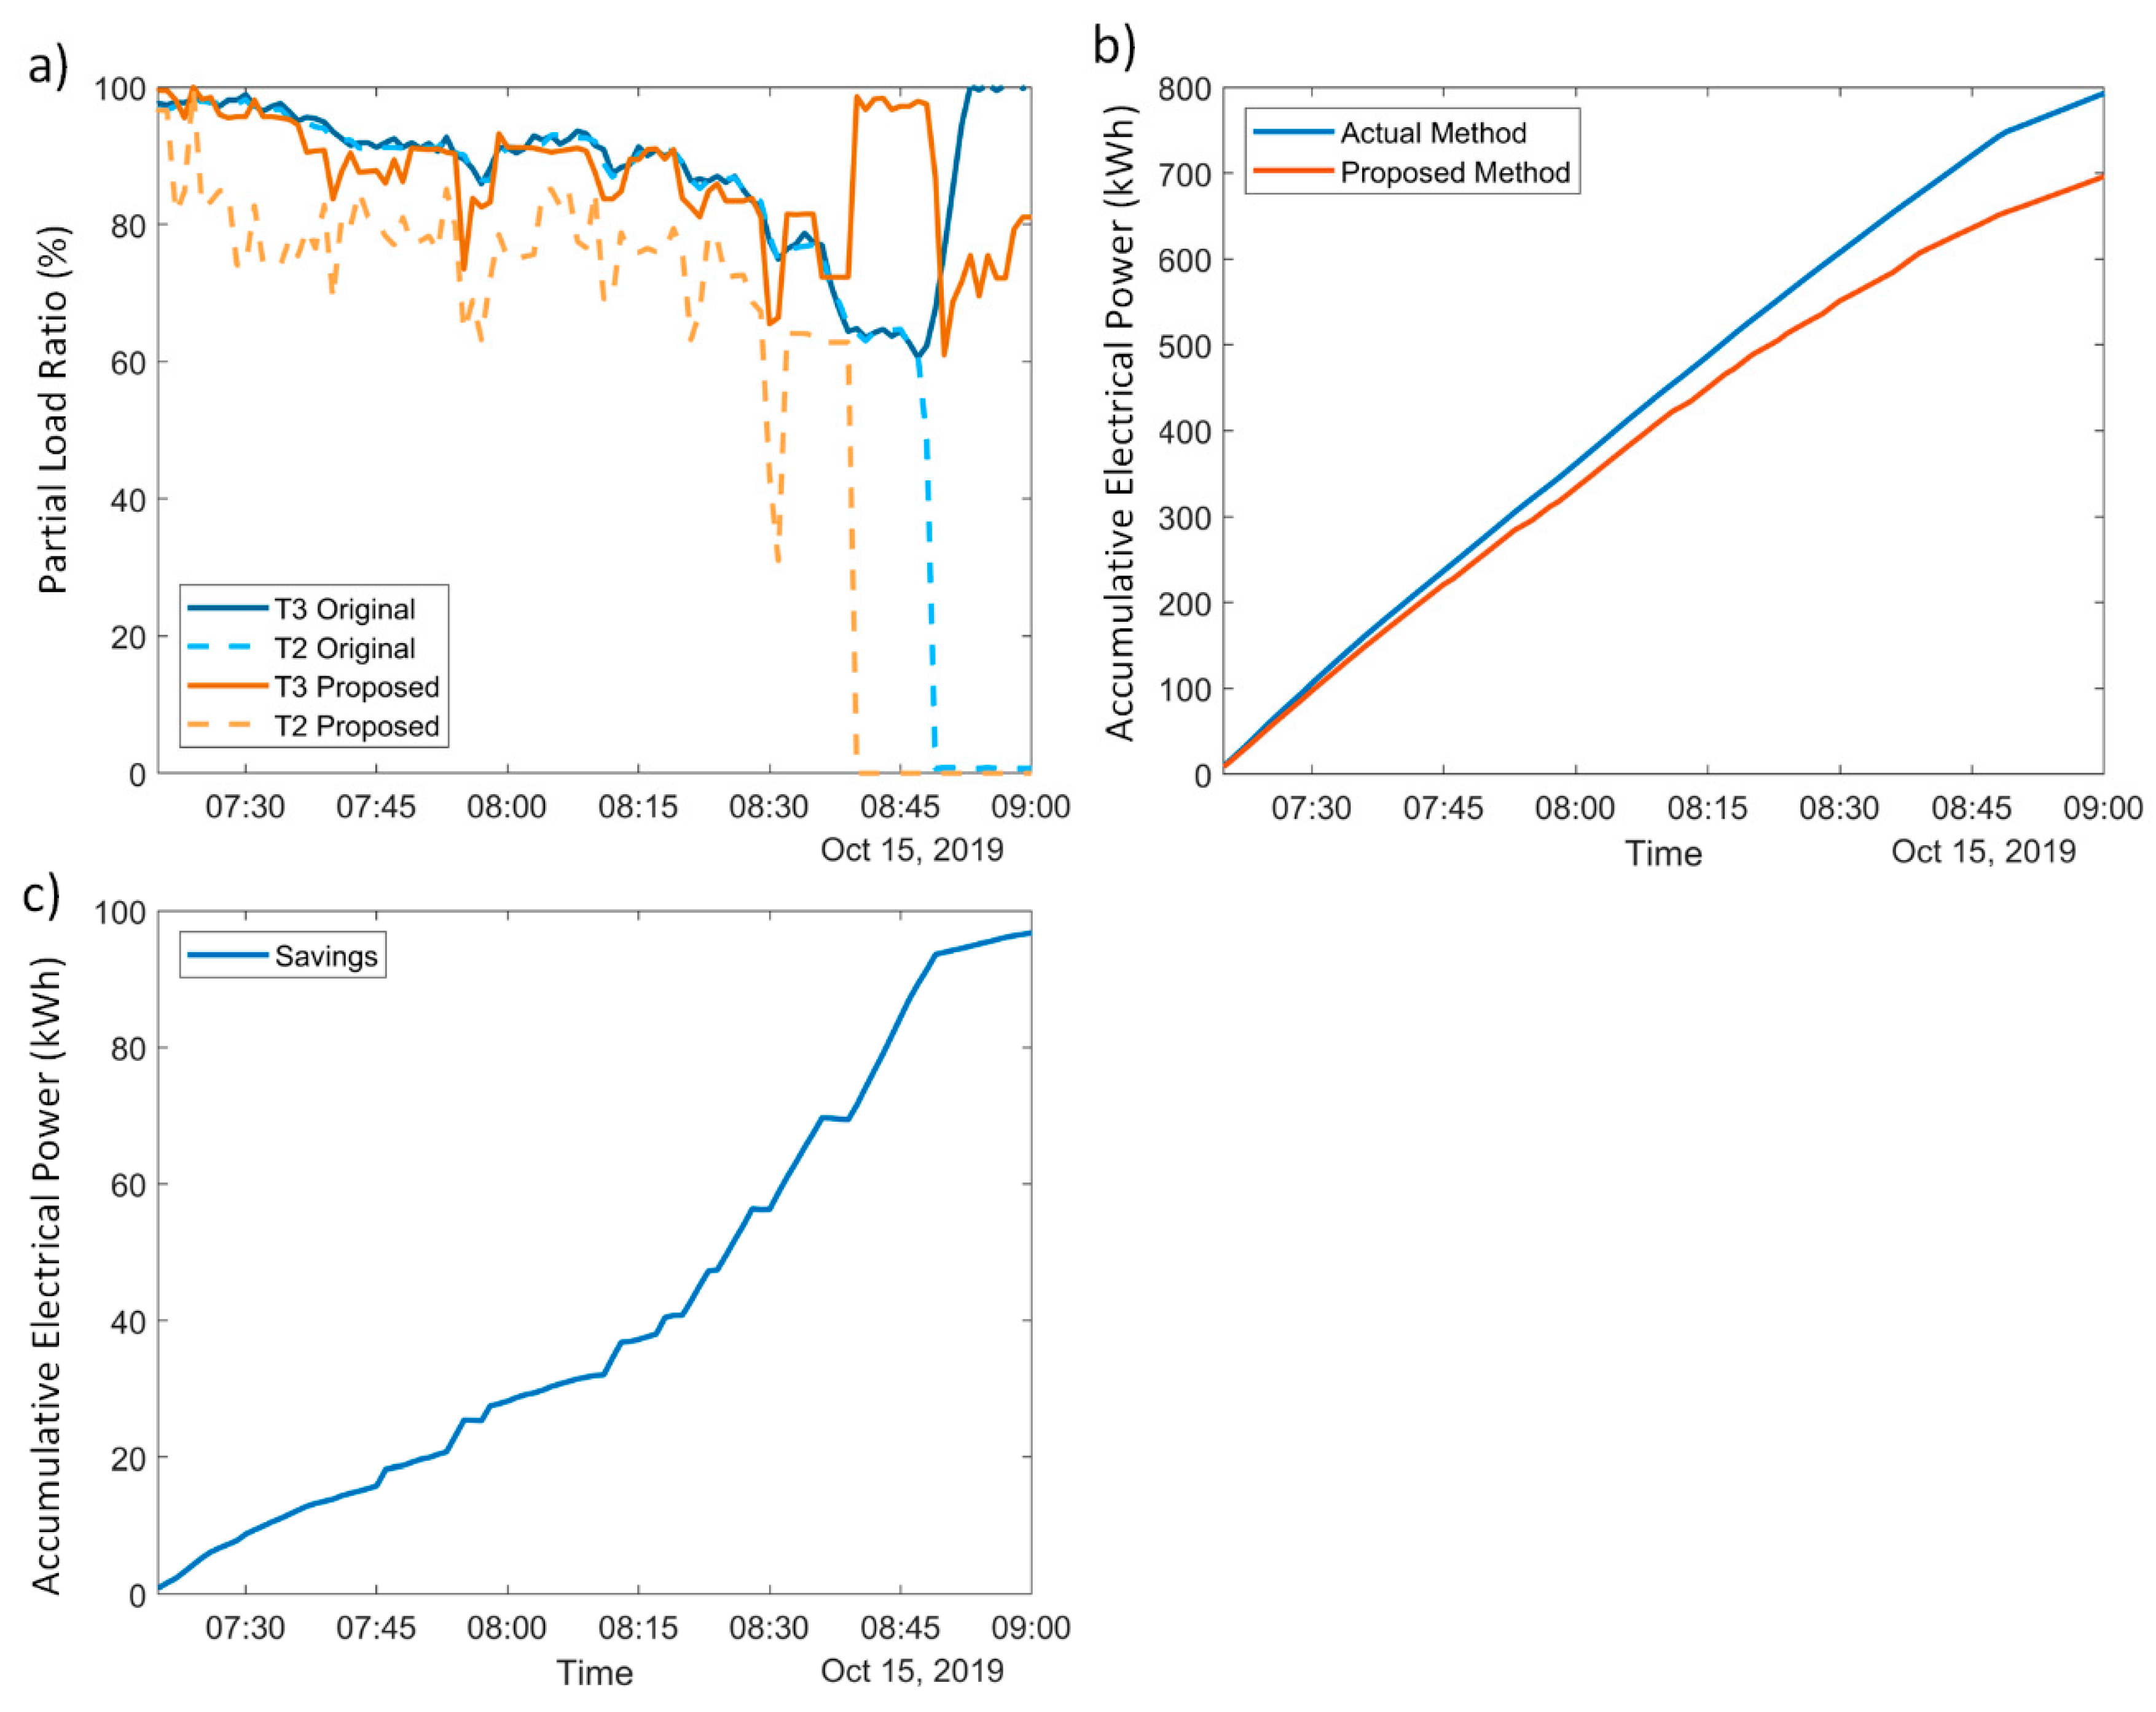
When transition of the operating compressors occurs due to the cooling capacity demand, the optimal switching time management depends on the trend of the demand, and the COP can be maximized if the PLR control of the compressors considers such a trend. A specific scenario that can reduce the electrical power consumption is when the cooling demand decrease and, therefore, a transition from two compressors to one occurs. The optimal time management of such a compressor switching is estimated by the proposed methodology and thus a reduction in electrical consumption is achieved; such an example can be seen in
Figure 9a, where the actual control strategy proposes to turn off the compressor T2 at 8:50 am, but the proposed methodology forecasts the decrease in demand and turns off the same compressor 10 min earlier. The difference in both strategies can be seen in
Figure 9b, in which a significant difference in electrical consumption can be appreciated at the switching period of time. To highlight the importance of the forecast and the difference of both methods, the accumulated savings can be seen in
Figure 9c, in which the aforementioned Scenario 1’s saving per hour of 7% can be appreciated at the beginning but an increase in the slope of the curve is seen when the transition of the compressors occurs, leading to a 15% saving per hour in electrical consumption. The combination led to an accumulative saving of 12% during the hour and a half test.
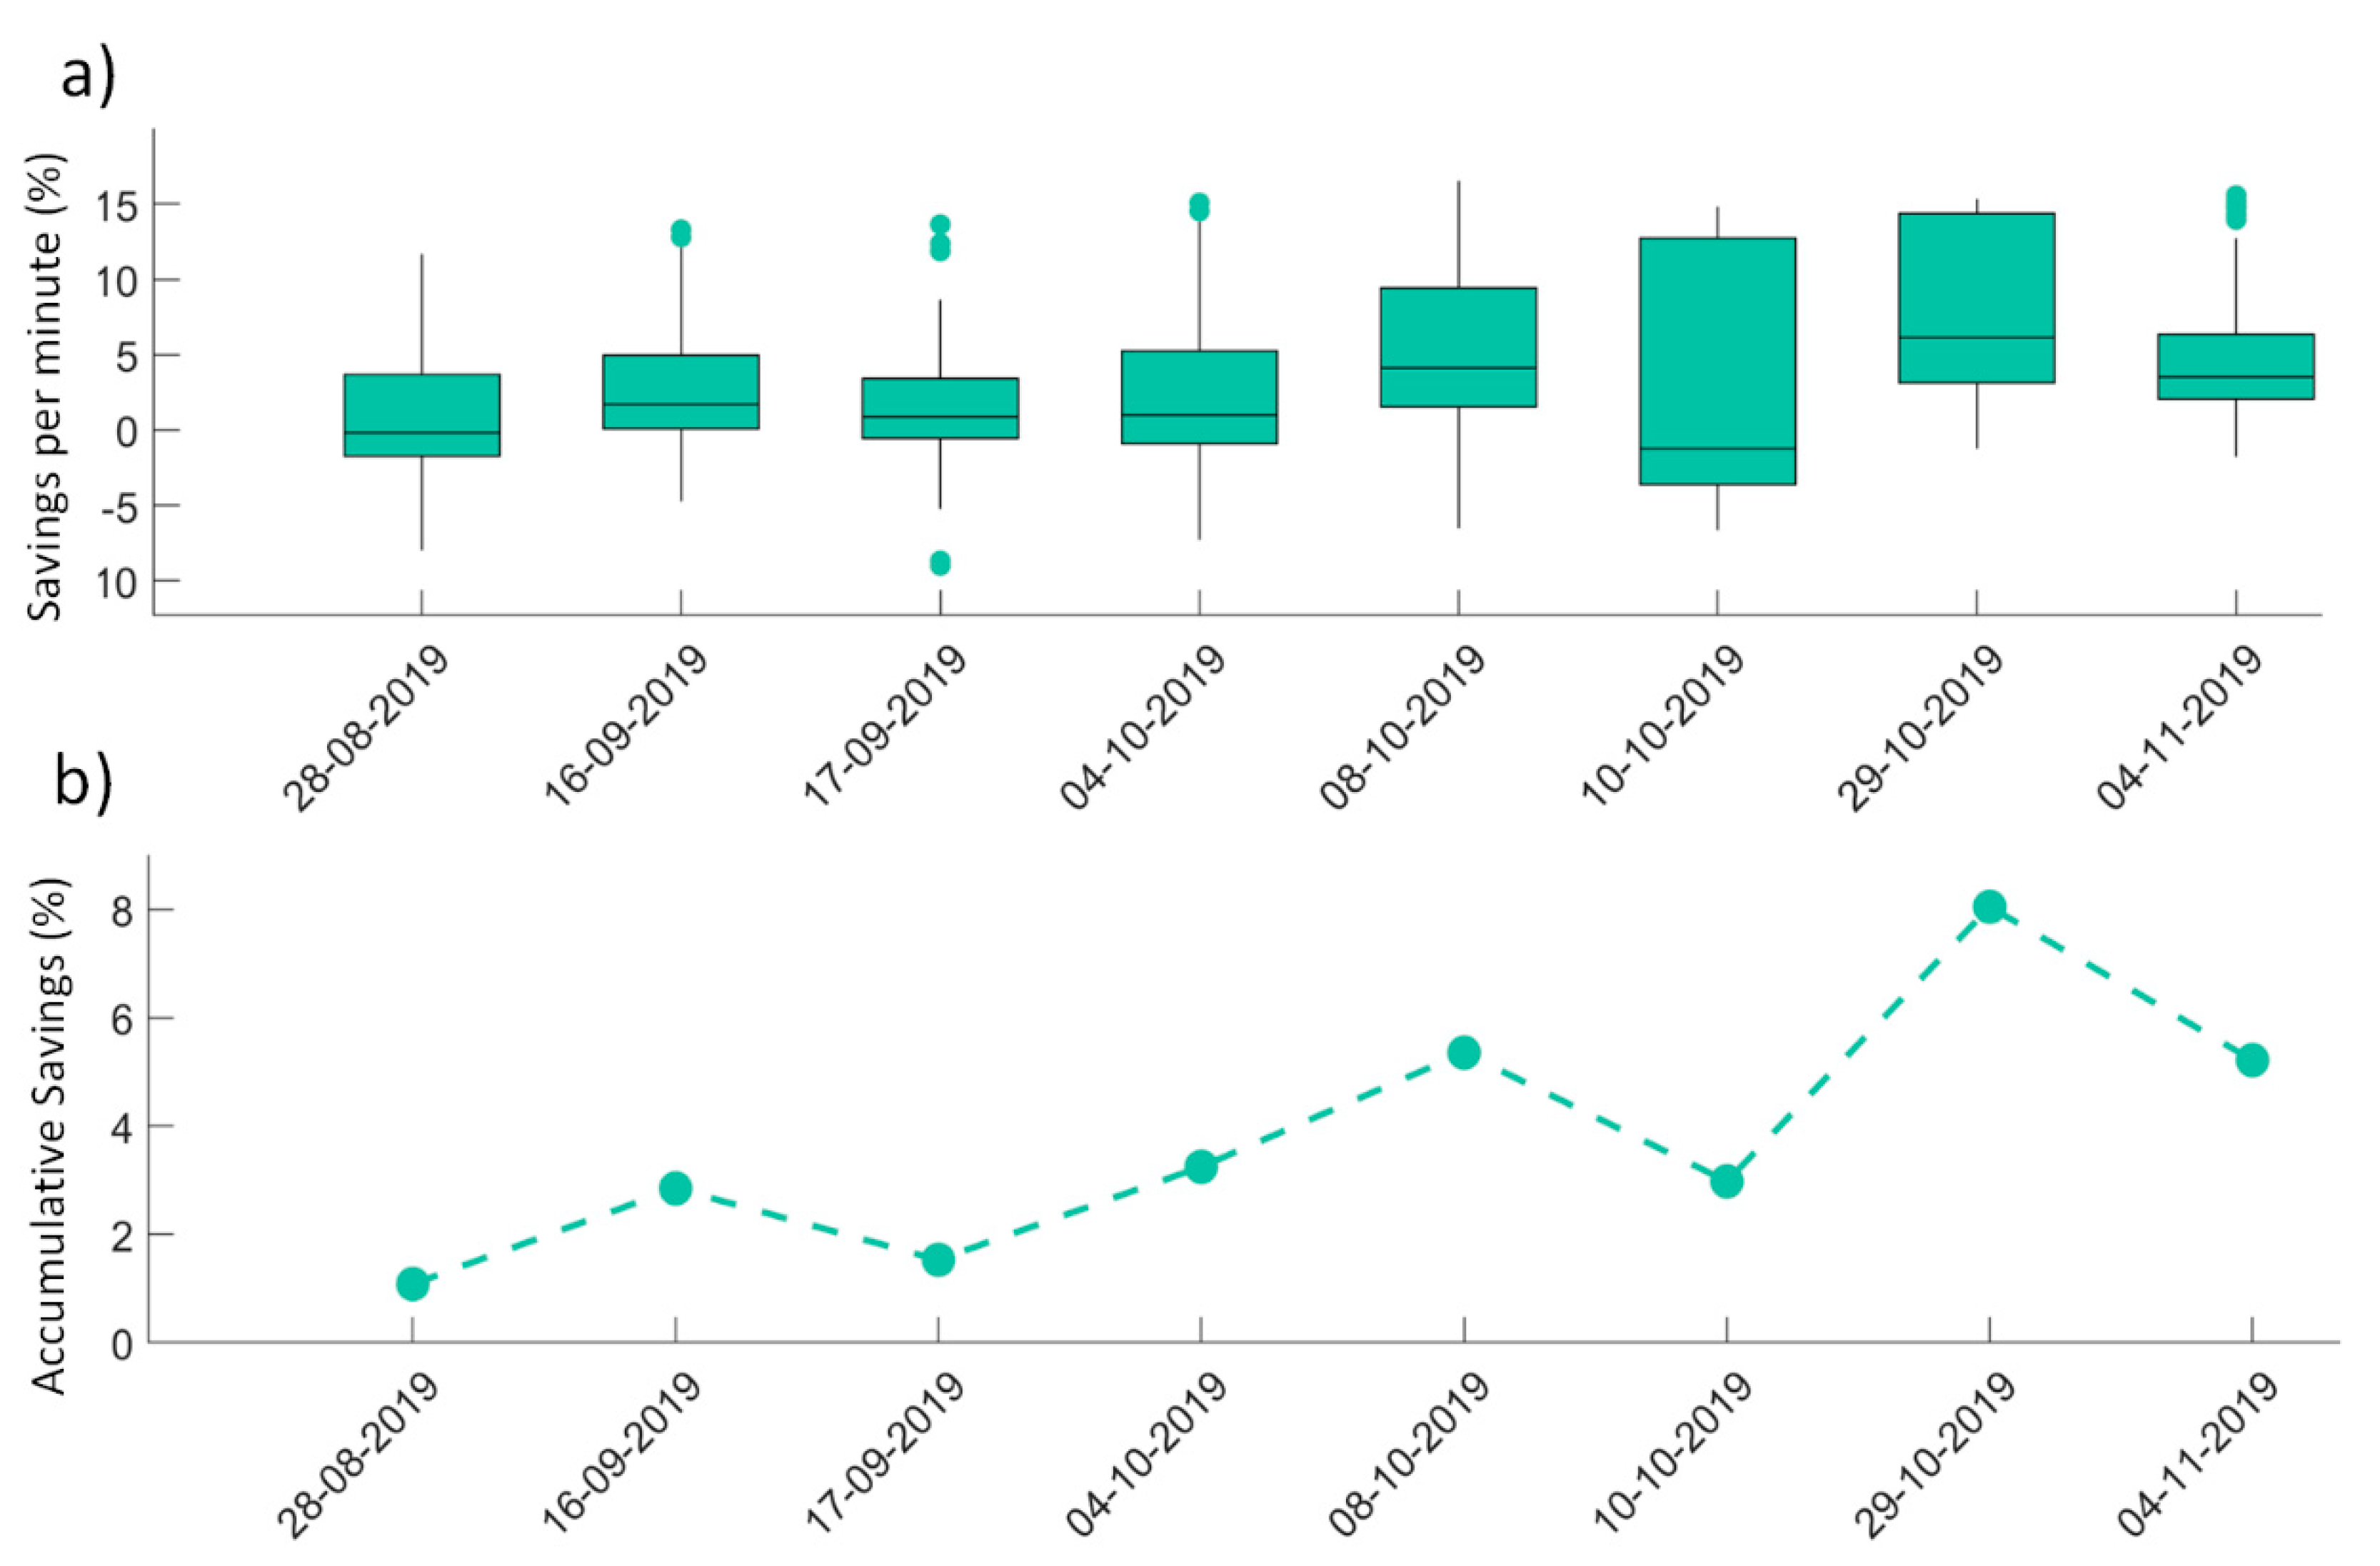
4.4. Results—Overall
To analyze the performance per day, the compressor’s control of the refrigeration system was changed to the proposed methodology during four hours for eight days in the scenarios where two compressors were needed. To obtain the savings, the electrical power consumed by the methodology was compared with the estimated consumption that the previous control PLR recommendation would cause.
The results, shown in
Figure 10, follow the expected savings of the two previous tests in which Scenario 1 and Scenario 2 were evaluated. The range of total savings during the testing days vary between 1% and 8%. This diversity in the range of savings is obtained due to the different operational modes that the system works on. Some of them provide a higher percentage of possible savings, like switching anticipation, whereas others provide a less impactful decrease in consumption, like having two compressors in operation. In terms of the proposed methodology, this can be interpreted as the possible savings that each BMU of the SOM can provide.
5. Discussion
The proposed methodology addresses two common challenges that would improve the operation of a refrigeration system, using data-driven techniques: (1) the modelling of the system under uncertain operational modes; and (2) the optimal PLR setpoint generation, considering the stability of the compressors with an appropriate switching management.
The first one is solved by the modelling of the different operational conditions with an SOM, a proliferation method for the creation of theoretical new operational modes and a novelty detection model to detect uncertain situations. The second one is solved employing a forecasting model that anticipates the cooling capacity demand and it is used to create a switching management methodology that decides the optimal PLR in terms of the forecasted demand.
The methodology was validated during four hours of testing for eight days in a real refrigeration system with two compressors running in parallel, obtaining promising performance results.
The savings obtained by the methodology can be summarized in two scenarios: the first one is when two compressors are operating in parallel and the methodology proposes optimal PLRs for the actual system operation conditions, and the second one is when there is a switching situation and the methodology forecasts the real necessity to switch a compressor.
Summarizing both scenarios, the savings achieved by the proposed methodology in comparison to the actual system control strategy varied from 2% to 8% in terms of electrical power consumption, depending on the operation of the system during the day of the test. Such results represent a significant amount for the refrigeration system, not only in terms of energy efficiency but in monetary savings.
With the proposed methodology, the generation part of the refrigeration system is covered, since we are generating near-optimal PLR setpoints for a given cooling demand with regard to the current process operation. Therefore, future work will be focused on modelling and optimizing the demand side. The different spaces to refrigerate of the refrigeration system should be modelled and optimized in order to manage the distribution of the thermal loads among the different spaces to refrigerate in an optimal way.


