Article

A Novel Process of H2/CO2 Membrane Separation of Shifted Syngas Coupled with Gasoil Hydrogenation

1
State Key Laboratory of Fine Chemicals, Engineering Laboratory for Petrochemical Energy-Efficient Separation Technology of Liaoning Province, School of Chemical Engineering, Dalian University of Technology, Dalian 116024, China
2
State Key Laboratory of Fine Chemicals, Liaoning Province Engineering Research Center for VOC Control & Reclamation, School of Petroleum and Chemical Engineering, Dalian University of Technology at Panjin, Panjin 124221, China
3
Sinopec Dalian Research Institute of Petroleum and Petrochemicals, Dalian 116024, China
*
Author to whom correspondence should be addressed.
Processes 2020, 8(5), 590; https://doi.org/10.3390/pr8050590
Submission received: 3 April 2020 / Revised: 5 May 2020 / Accepted: 9 May 2020 / Published: 15 May 2020
(This article belongs to the Special Issue Synergies in Combined Development of Processes and Models)

Abstract

:
A novel process of membrane separation for H2/CO2 of shifted syngas coupled with gasoil hydrogenation (NMGH) is proposed. First, a new process, with two-stage CO2-selective and one-stage H2-selective membranes, was developed to substitute the conventional PSA separation devices to remove CO2 and purify H2 in coal gasification refineries to reduce energy consumption and investment costs. Then, the process was coupled with gasoil hydrogenation and the recycled H2 produced by the hydrogenation reactor could be further purified by the H2-selective membrane, which increased the H2 concentration of the hydrogenation reactor inlet by about 11 mol.% compared with the conventional direct recycling process, and the total system pressure was reduced by about 2470 kPa. At the same time, this additional membrane separation and purification prevented the accumulation of CO/CO2 in the recycled H2, which ensured the activity of the catalyst in the reactor and the long-term stable operation of the devices. Further, parameters such as compressor power, PI (polyimide)/PEO (polyethylene oxide) membrane area, pressure ratio on both sides of the membrane, and purity of make-up H2 were optimized by sensitivity analysis. The results showed that, compared with the conventional method, the NMGH process simplified operations, significantly reduced the total investment cost by $17.74 million, and lowered the total annual costs by $1.50 million/year.

1. Introduction

Generally, gasoil quality worldwide is declining, as it is becoming heavier and the amount of harmful substances it contains, such as sulfur, nitrogen, olefins, and condensed aromatic hydrocarbons, is increasing [1]. Burning inferior oil increases atmospheric pollution and causes severe acid rain and haze, which threatens the survival of humans and other living things. In recent years, the need for upgrading petroleum products has resulted in higher requirements regarding the content of sulfur, nitrogen, olefins, and polycyclic aromatic hydrocarbons, while oil hydrogenation is the most effective conversion means for hazardous substances [2]. Therefore, hydrogen of greater quantity and better quality is needed in the upstream process to meet hydrogenation process requirements.
Hydrogen production from coal gasification is one of the oldest and most common methods of H2 production [3]. The composition of shifted syngas produced this way is about 40 mol.% H2 and 30 mol.% CO2 [4]. More CO2 not only affects hydrogenation, but it also exacerbates the greenhouse effect. Pressure swing adsorption (PSA) is a widely used and more developed method for H2 purification [5,6,7]. Typically, one set of PSA devices consists of 6–12 towers and hundreds of valves, covering an area of 300–500 m2 (except for other facilities, such as compressors) [8]. Its stable production is achieved by changing the pressure and switching the adsorption, desorption, and regeneration processes continuously between different columns. Its flowsheet diagram is shown in Figure 1. The major drawbacks of this method, however, include the considerable investment cost for equipment and its complicated operation [9]. Many researchers have thus turned their attention to the membrane separation process, due to its low investment cost and simple operation, to capture CO2 in the coal gasification hydrogen production process. Arias et al. [10] proposed a two-stage membrane system for hydrogen separation in refining processes, a H2 product purity of 0.90 and H2 recovery of 90% are achieved. But these literatures have rarely been simultaneously coupled with hydrogen purification [10,11,12,13]. Moreover, Chen et al. [14] established a mathematical model for a dual membrane separator, which provided a new way to separate H2/CO2 of shifted syngas. And Xiao et al. [15] designed and manufactured a hollow fiber dual membrane separation equipment, proved the dual membrane separator holds great industrial application potential for H2/CO2/CH4 ternary gas mixtures separation. Limited by the selectivity of commercial membranes, its separation effect was only similar to the cascade of a two-stage membrane, and due to packaging difficulties, this research did not extend beyond the laboratory stage.
The content of impurities, such as metal, colloid, and asphaltene, in gasoil is continuously increasing. Many companies have developed hydrotreating technologies for different production purposes, such as UOP (Universal Oil Product) ’s partially converted unicracking process [16], Akzo Nobel’s MAK medium-pressure hydrocracking and catalytic cracking combined process, and Aroshift’s (including process and special catalyst) proposed hydrogenation pretreatment of catalytic cracking feedstock [17,18].
Membrane separation can remove the reaction products, which will improve the reaction rate and conversion rate, at the same time, a more complete reaction will reduce the separation energy consumption and material consumption of the reaction products. Finally, the integration of membrane separation and reaction can increase the overall efficiency of the system [19]. For example, a polymer membrane reactor system was developed in place of a water-gas shift reaction and a Selexol process for carbon dioxide removal in production of electricity from coal. Three kinds of polymer membrane reactor processes (2-stage PSMR (permeative stage membrane reactor), 3-stage PSMR, MR (membrane reactor)) were presented and optimized [20]. However, the H2/CO2 selectivity range of the membrane used in this work is 25–75, which is higher than the separation performance of the polymer membrane in the industry. Moreover, a membrane reactor was proposed to produce propylene and ultra-pure hydrogen in the propane dehydrogenation process. The propylene production increased by 3.12% by dehydrogenation reactors coupled with membrane modules. The higher propane conversion and ultra-pure hydrogen production were achieved simultaneously [21].
In addition, current research efforts usually design and optimize H2/CO2 separation and hydrogenation as two independent systems in the petrochemical industry. For this study, a novel coupling process of H2/CO2 separation and hydrogenation was developed based on an analysis of the shortcomings of conventional PSA separation for H2/CO2 of shifted syngas and gasoil hydrogenation. Key factors such as compressor power, membrane area, and pressure ratio on both sides of the membrane were optimized. The economic evaluation results indicate that this novel process based on membrane separation has more economic benefits than the conventional method.

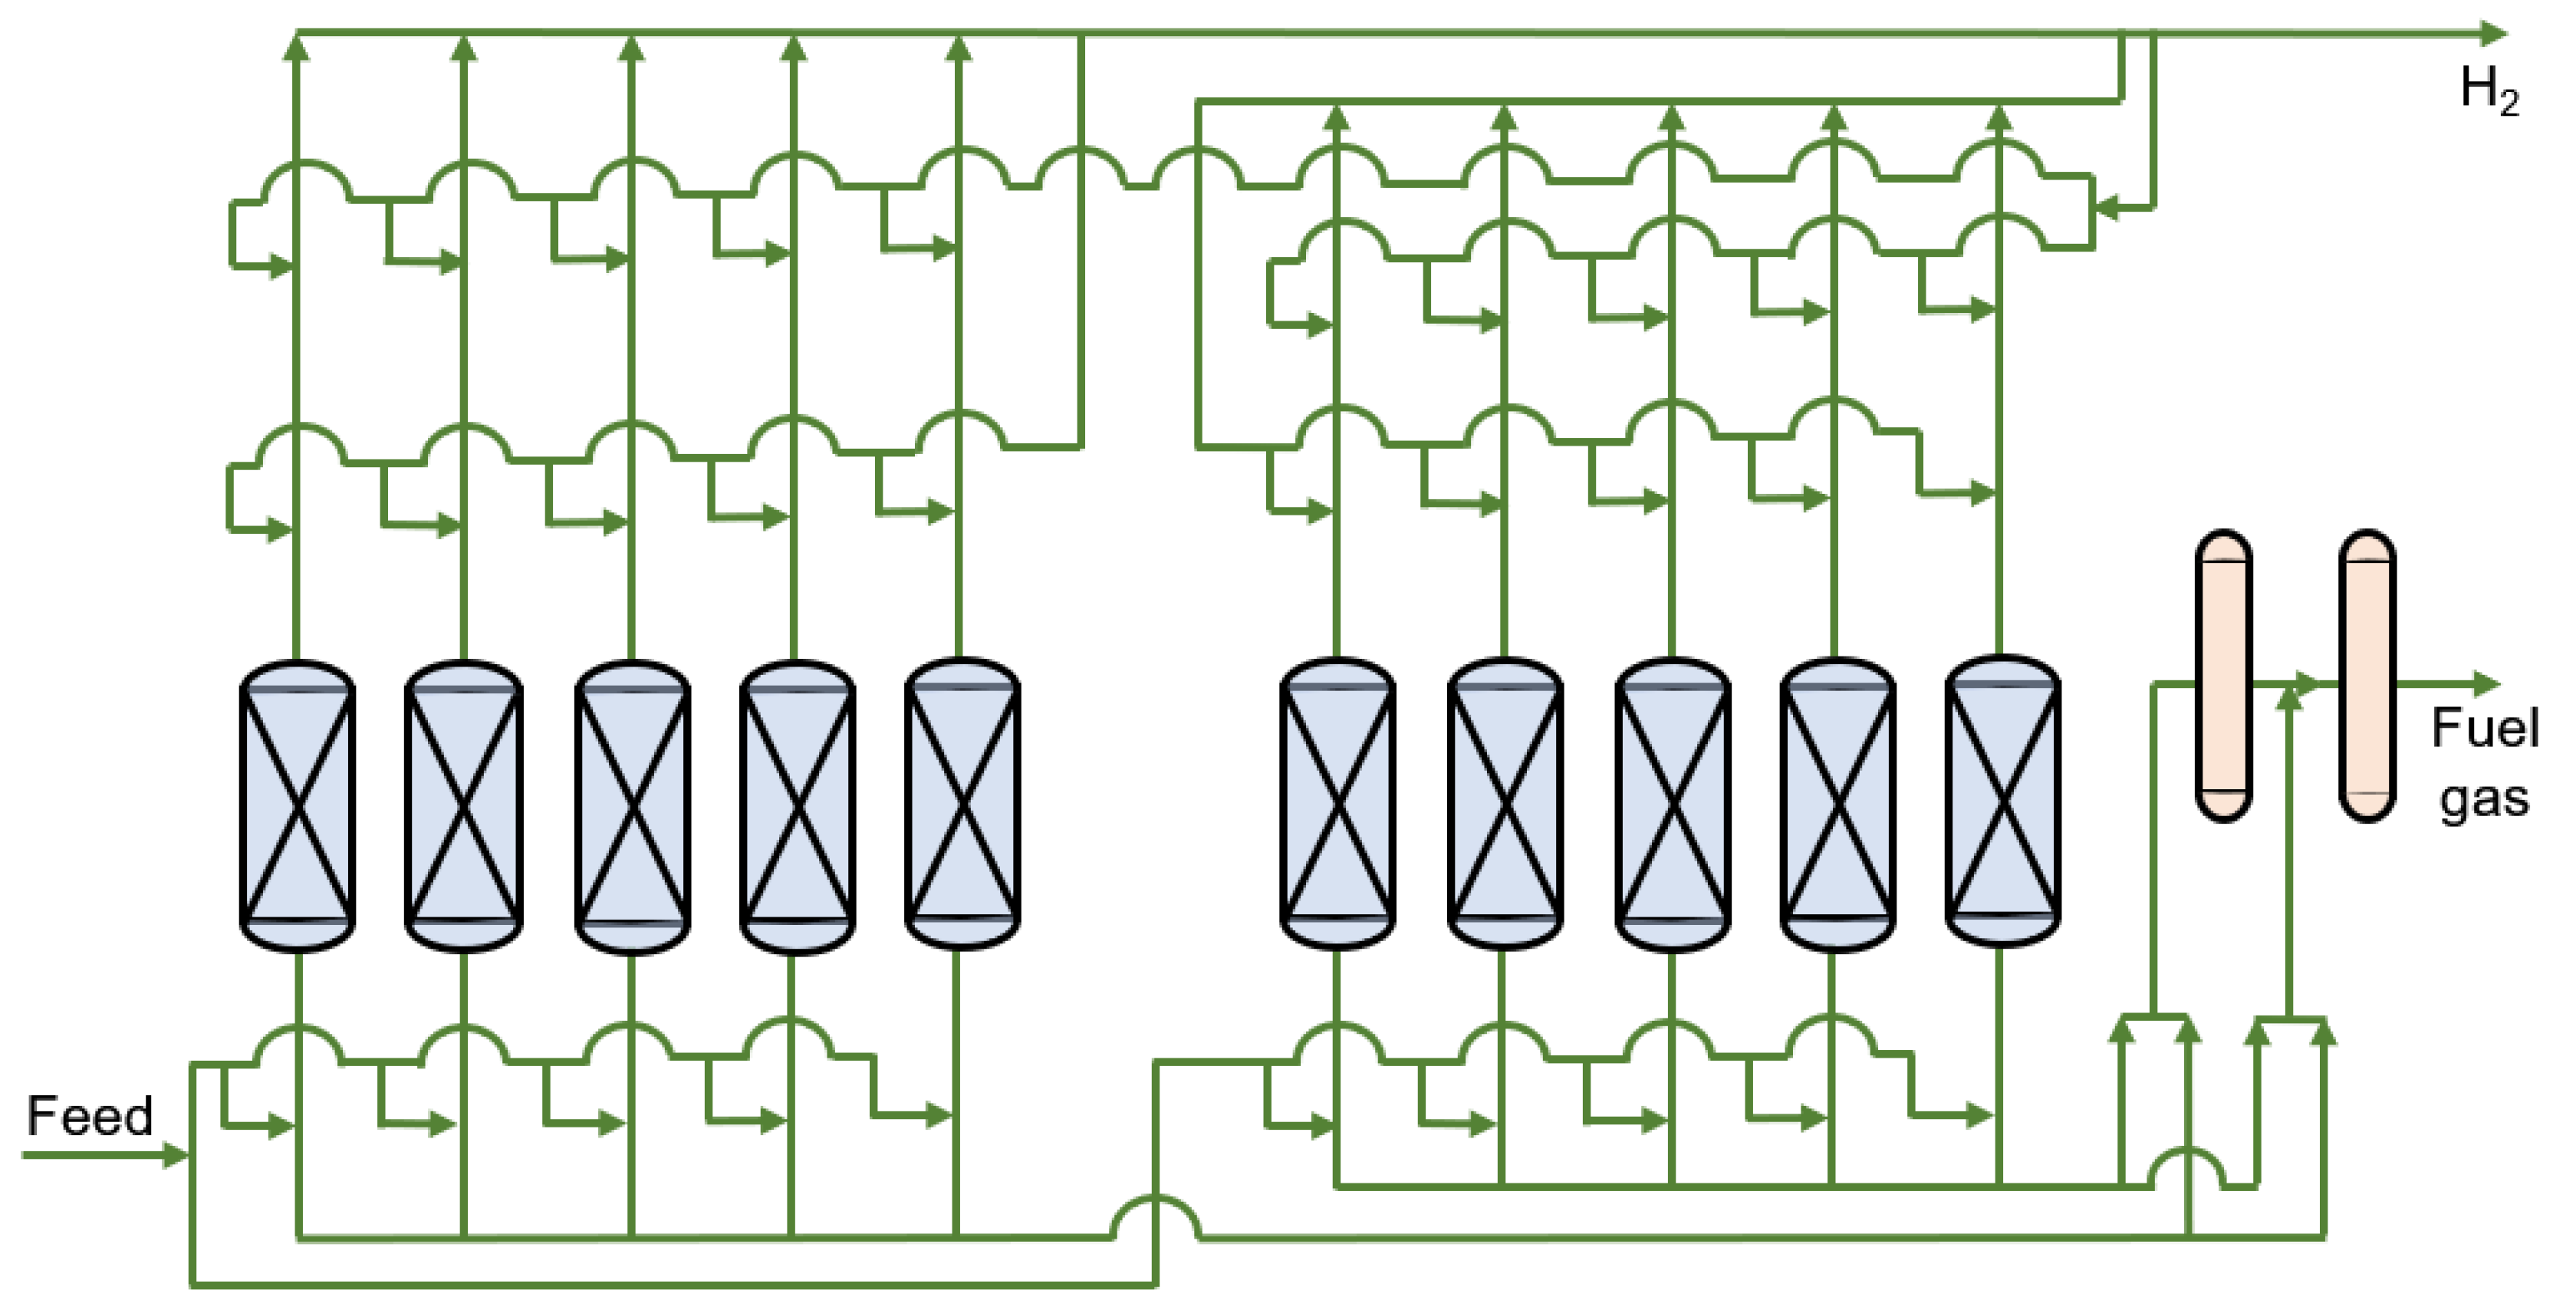
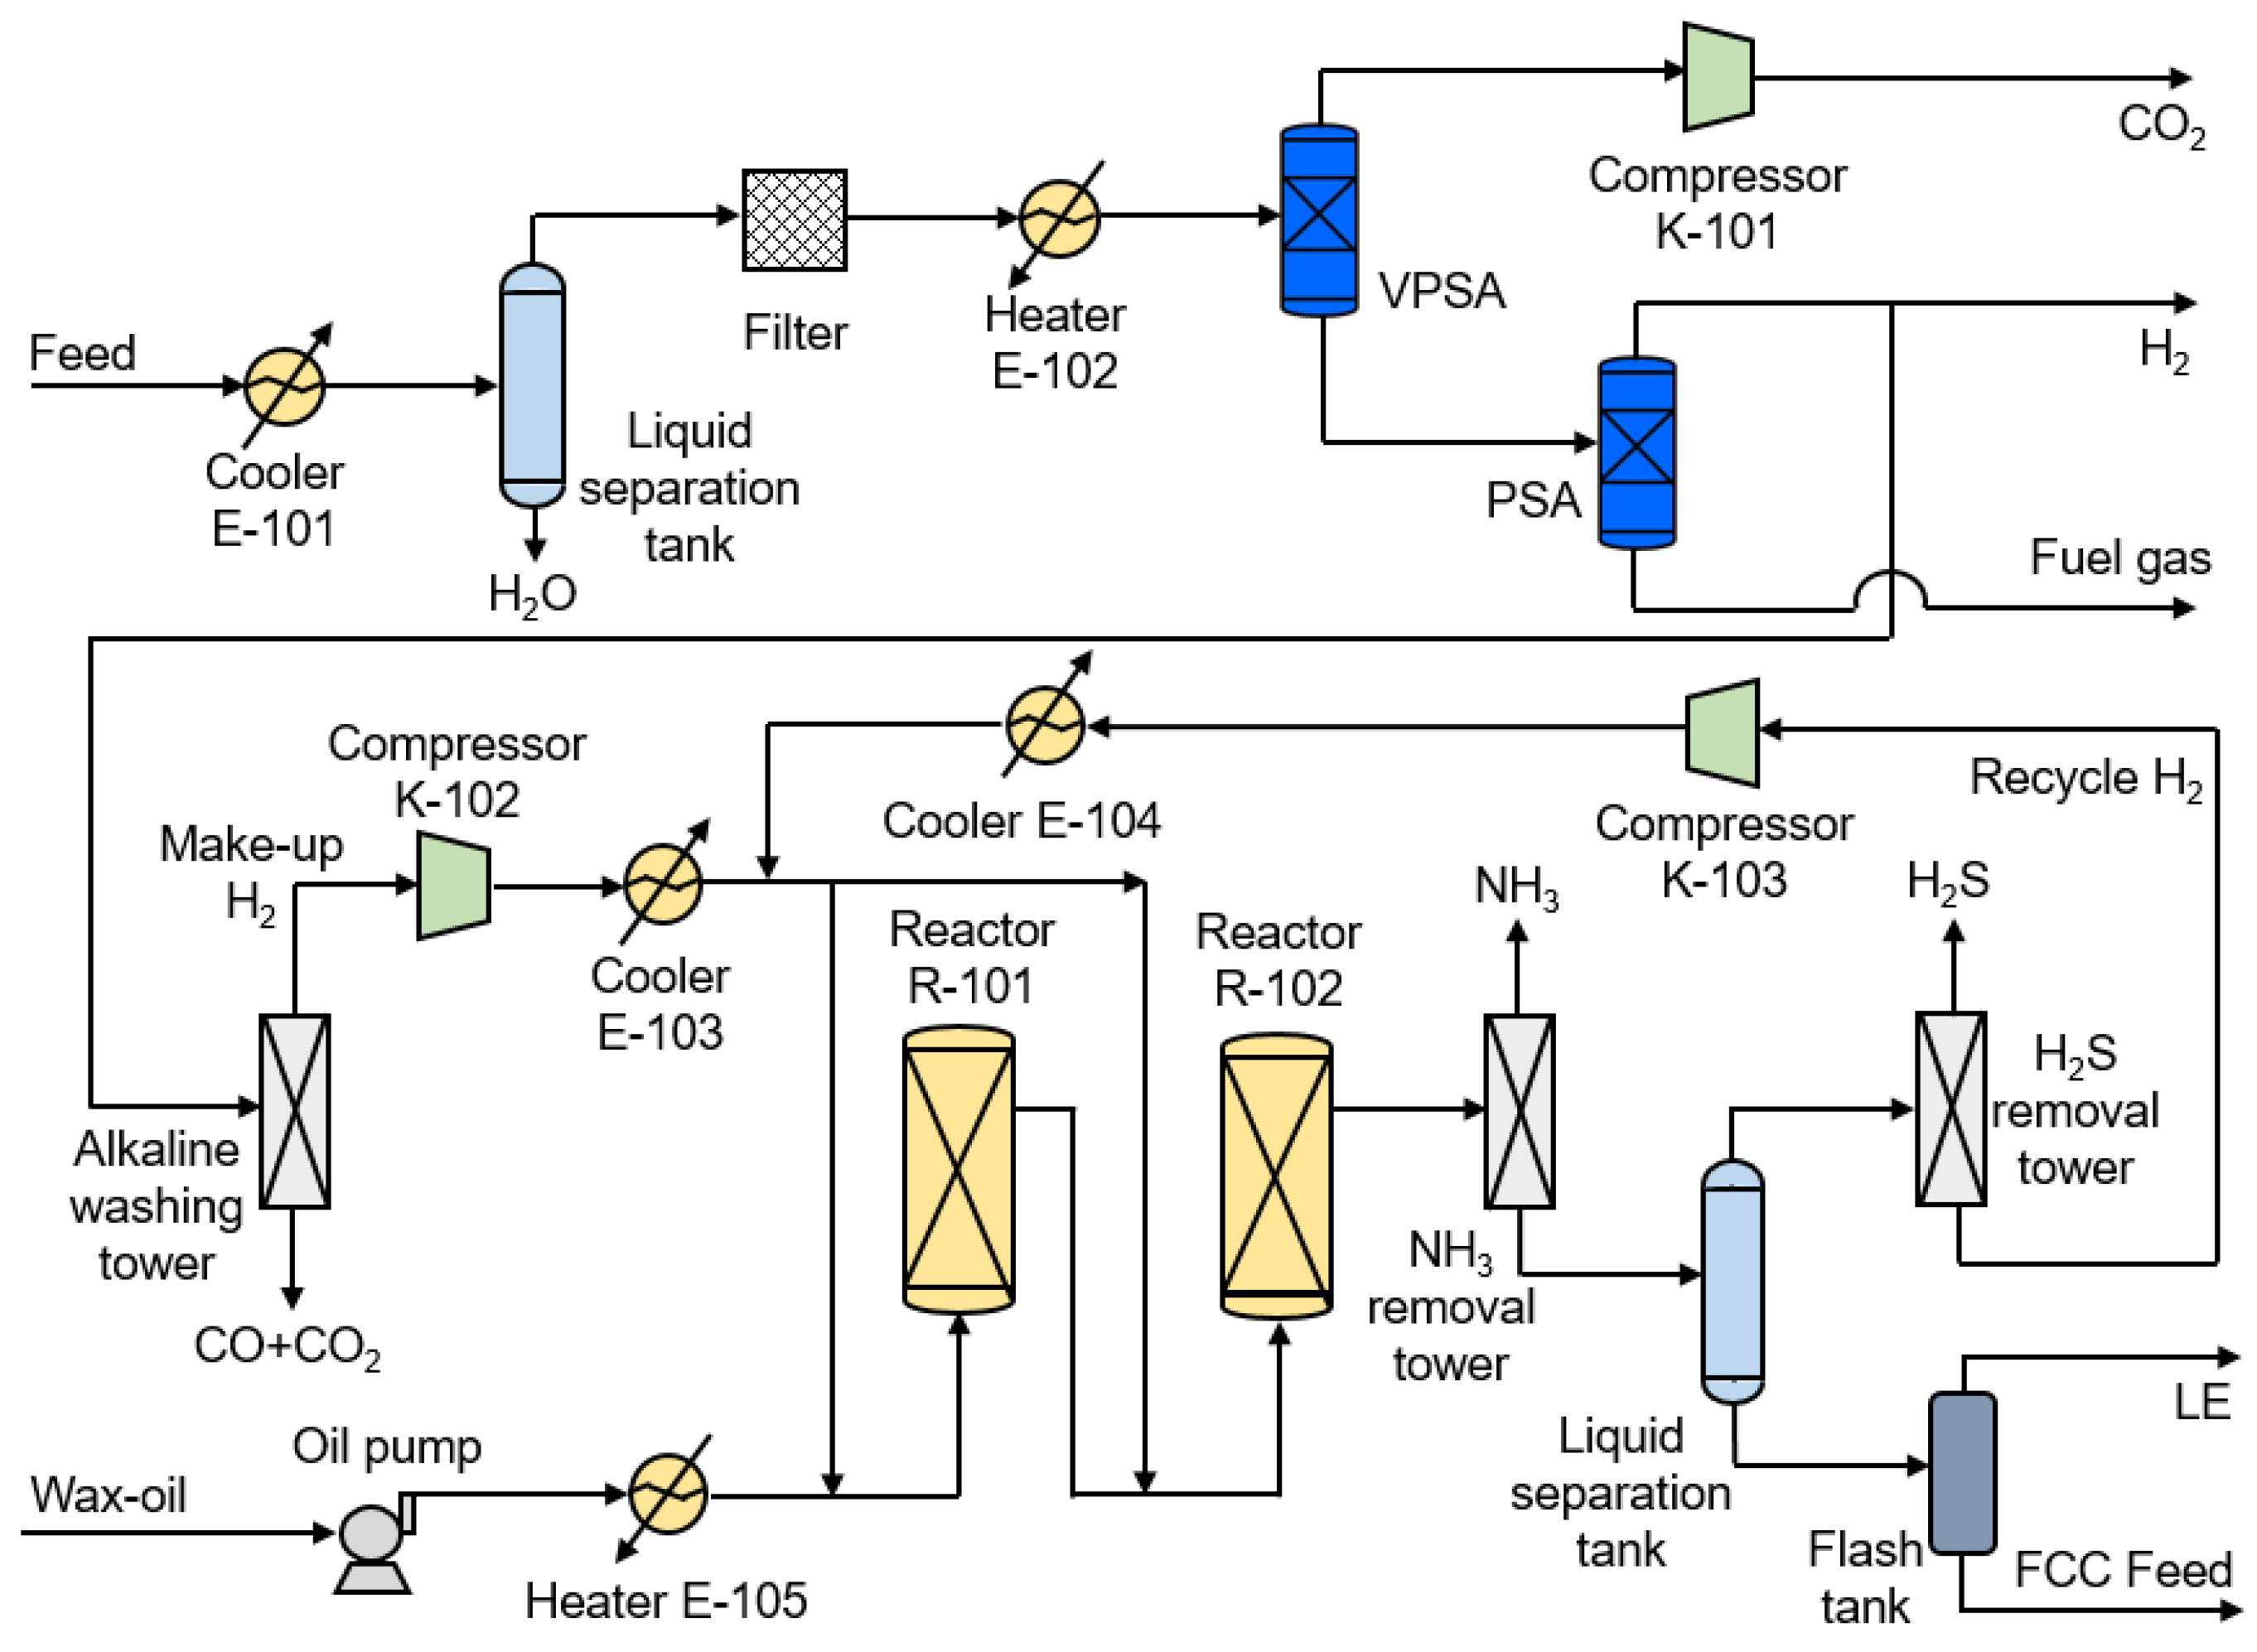
2. Conventional PSA Separation for H2/CO2 of Shifted Syngas and Gasoil Hydrogenation (CPGH) Process

The schematic diagram of the CPGH process is shown in Figure 2. The PSA separation process for H2/CO2 of shifted syngas and gasoil hydrogenation is included. First, the shifted syngas is dehydrated and preheated for vacuum pressure swing adsorption (VPSA) to remove CO2 and obtain a 90 mol.% CO2 product. After being pressurized to 15 MPa [22] by compressor K-101, it is stored or liquefied in the CO2 condensing unit. Then, the tail gas of VPSA is introduced into the PSA for hydrogen purification to obtain 90 mol.% H2, one part as H2 product and the other removed CO/CO2 through the decarbonization tower. After being compressed to the system pressure of 13 MPa by compressor K-102, it mixes with the recycle H2 (83 mol.%) and then enters reactor R-101 and R-102 to carry out the gasoil hydrogenation reaction. The hydrogenated gasoil is denitrified and then enters the flash tank for liquid separation. The gas phase contains unreacted light components such as H2 and CH4, called recycled H2, and returns to the reactor inlet after desulfurization, while the liquid phase is used as the fluid catalytic cracking (FCC) feed.
The gasoil hydrogenation unit has a higher purity requirement for make-up H2 in order to maintain catalyst activity; its purity is usually between 80 and 99.9 mol.%. To avoid deactivation of the hydrogenation catalyst, the CO/CO2 concentration must be controlled below 20 ppm [23]. The CPGH process uses VPSA and PSA to separate CO2 and purify H2, and the H2 concentration mixed with gasoil in R-101 is only 74 mol.%. When the concentration of H2 in the reactor is low, the total system pressure is increased to maintain the corresponding hydrogen partial pressure.
The CPGH process has these three drawbacks:
(1)
For the separation of the H2/CO2 system by PSA, the operation and control of the devices are complicated and the investment cost is high.
(2)
The 90 mol.% make-up H2 results in a low concentration of the mixed H2 entering the reactor, thus requiring higher system pressure.
(3)
CO2/CO is easily accumulated in the hydrogenation process, which reduces catalyst activity and increases the temperature of the reactor.
In light of the abovementioned problems, this work proposed a novel membrane separation process for H2/CO2 separation of shifted syngas and developed a new coupling process with gasoil hydrogenation. Process design requirements: CO2 concentration > 90 mol.%, CO2 removal rate > 90%, make-up H2 concentration > 90.0 mol.%, and H2 recovery rate > 90%.
This process was designed and simulated according to the actual production process as a typical conventional process, and the novel coupling process was improved and optimized based on this CPGH process.

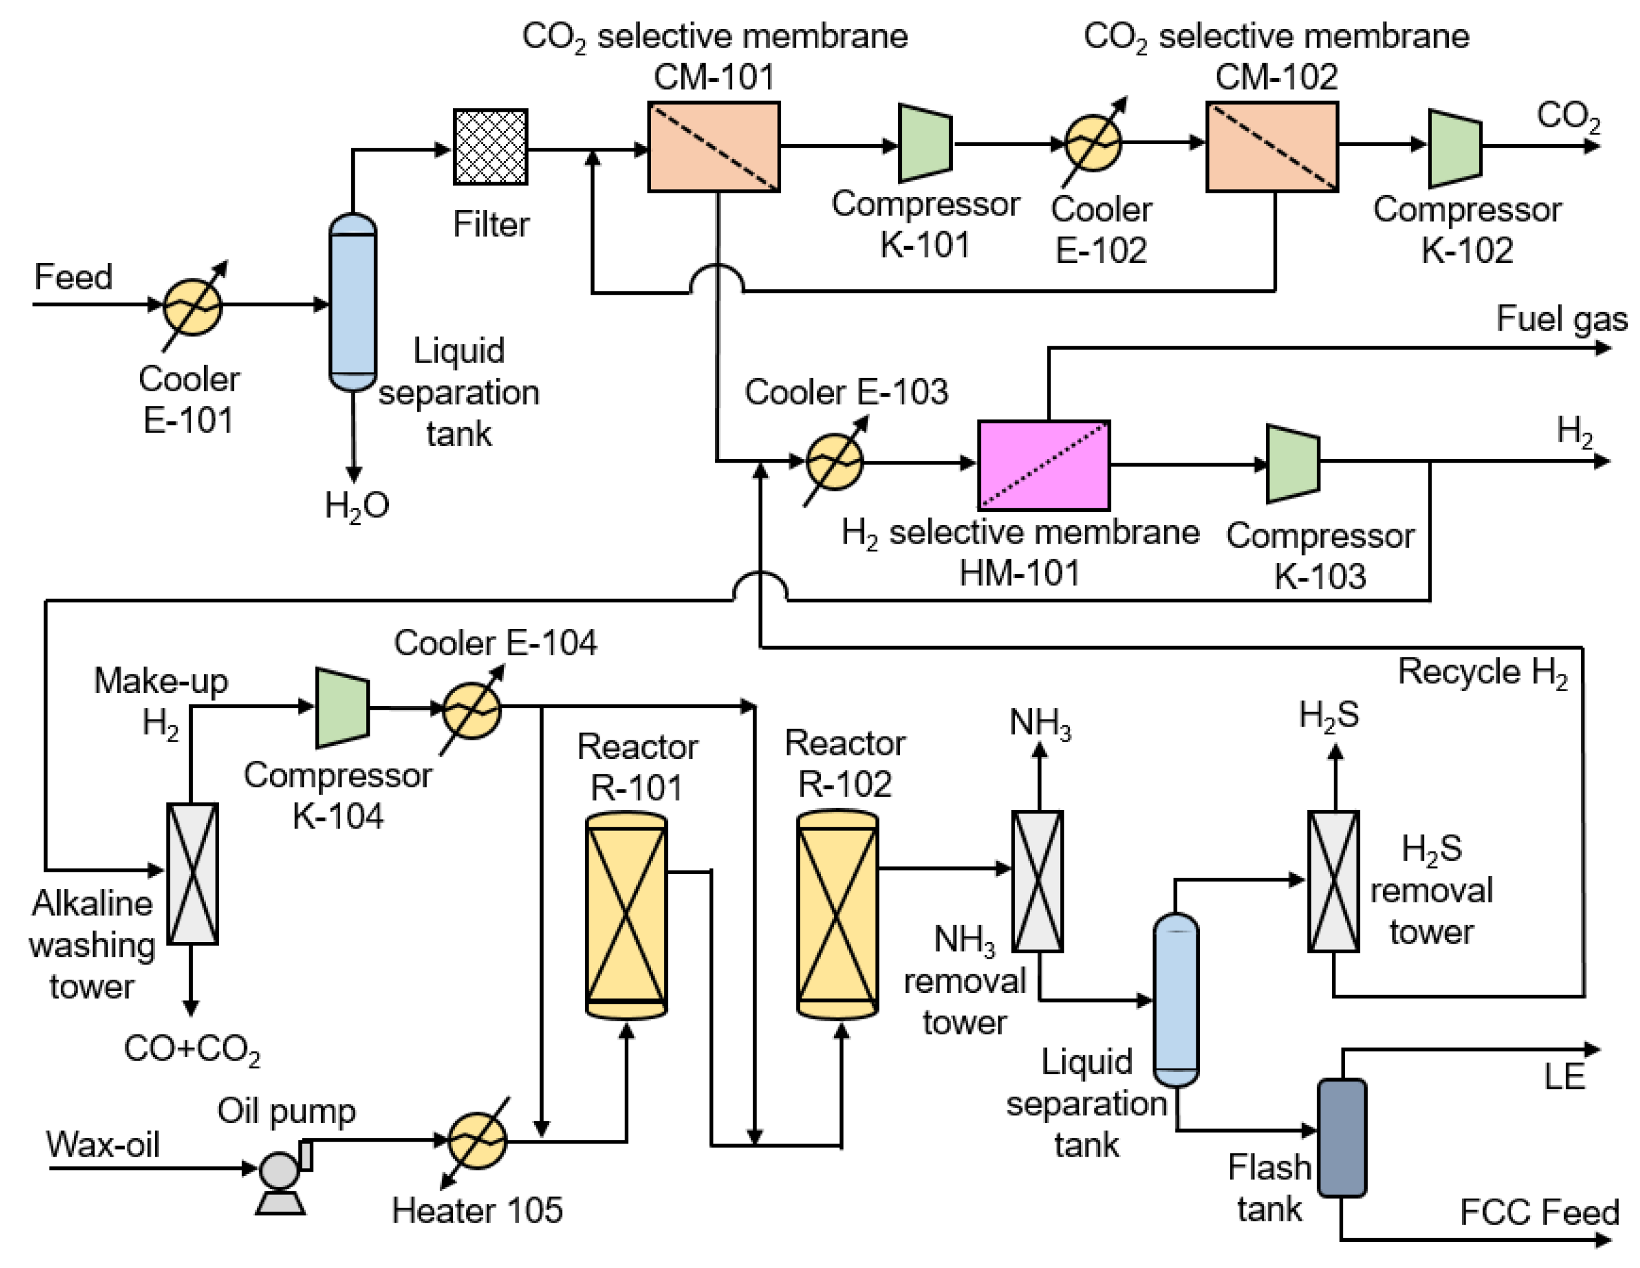
3. Novel Membrane Separation for H2/CO2 of Shifted Syngas Coupled with Gasoil Hydrogenation (NMGH) Process

The NMGH process consists of shifted syngas membrane separation and gasoil hydrogenation, as shown in Figure 3. Firstly, the raw material is cooled to 25 °C and the liquid water is removed by a liquid separation tank. Then, a trace of residual droplets and some fine dust particles are caught by the filter. The pretreated shifted syngas enters CO2 selectivity membrane CM-101 to obtain a 90 mol.% CO2 product, which is then pressurized to 3000 kPa by compressor K-101 and cooled to 25 °C, next entering CO2 selectivity membrane CM-102 for further decarburization. The stream of CM-102 residue of about 50 mol.% CO2 returns to the inlet of CM-101 and forms a cycle between CM-101 and CM-102 to increase the CO2 removal rate. The CO2-selective and H2-selective membranes have their highest selectivity at 25 and 75 °C, respectively, but the temperature of recycle H2 is high (390 °C). Therefore, the residue of CM-101 (87 mol.% H2) mixed with recycle H2 is cooled to 75 °C by cooler E-103 and then purified by H2-selective membrane HM-101 to obtain 99 mol.% H2. After pressurizing the obtained H2 to 2.4 MPa, one part of it is collected as H2 product for downstream production and the other is subjected to CO2/CO removal by a small alkaline washing tower, which finally results in 99.9 mol.% H2. Due to the increased make-up H2 purity, the H2 concentration at the inlet of reactor R-101 eventually reaches 85 mol.%, and then the total system pressure of the reactor is decreased from 13.0 to 11.57 MPa. After the hydrogenated gasoil undergoes denitrification and desulfurization, the liquid phase is used as an FCC feed for the downstream reaction, and the gas phase, as recycled H2 (95 mol.%), returns to HM-101 for further purification. This design couples the hydrogen separation and gasoil hydrogenation reaction processes and achieves an overall optimization of this system.
The NMGH process improves three shortcomings of the CPGH process:
(1)
Using the membrane separation process to substitute the conventional PSA technique for H2/CO2 separation reduces the total investment cost and simplifies the operation.
(2)
The NMGH process uses 99.9 mol.% of make-up H2 for hydrogenation, and the recycled H2 enters the membrane separator for further purification instead of going into the reactor directly, which causes the H2 concentration entering the reactor to increase from 74 to 85 mol.%, thereby reducing the total reaction pressure by about 11%.
(3)
The NMGH process utilizes H2-selective membrane to further purify and decarbonize the recycle H2, thus reducing carbon accumulation and ensuring the smooth operation of the devices over a long period of time.
Process design requirements: CO2 concentration >90 mol.%, CO2 removal rate >90%, make-up H2 concentration >99.9 mol.%, H2 recovery rate >90%.

4. Basic Parameters of Process Design and Simulation

The hydrogen membrane separation method is one of the earliest membrane separation technologies developed and applied. At present, an industrialized hydrogen-selective membrane can only be used for H2/N2 and H2/light hydrocarbon systems. However, for an H2/CO2 system, the current membrane material selectivity is seriously insufficient; the H2/CO2 selectivity of PI materials is only 2–5 [24]. Compared with H2-selective membranes, CO2-selective membranes have developed more rapidly, and membrane materials such as PEO can achieve CO2/H2 selectivity of 8–15 or more.
The existing literature shows that the mass transfer and separation performance of membrane materials can be improved by adding ionic liquids, charged groups, MOFs (metal-organic frameworks), or ZIFs (zeolitic imidazolate frameworks) to the polymer membrane, resulting in an ultrahigh selectivity and permeability coefficient for the membrane material [25,26,27]. However, these membrane materials face common problems, such as loss of functional materials, low mechanical properties, and the inability to prepare composite membranes, forcing their research and development to remain at the laboratory stage [28]. In industrial applications, composite membranes with excellent mechanical strength and solvent resistance, high permeability, and high selectivity are required. It is obvious that these modified membrane materials are not suitable for practical industrial production. As this work aimed to provide new improvements for practical industrial production, a lower membrane selectivity was chosen to ensure operational feasibility and industrialization possibilities.
The mass transport mechanism through these membranes is governed by the solution–diffusion model. Studies [29,30,31] have shown that plasticization and competitive sorption play an important role in organic polymer membranes. Organic gases (such as CH4) have a greater impact on the diffusion coefficient, while inorganic gases (such as CO2, H2S, and N2) are basically consistent with the trend of pure gases. Therefore, the error caused here by plasticization was acceptable and the permeance of each component in the mixed gas was approximately equal with the pure gas, as shown in Table 1 [32]. As for the permeance of N2/H2S/H2O, we defined the data by industrial production according to their solution–diffusion rate. The feedstock used in this work was the shifted syngas of coal gasification hydrogen production. The feed conditions and composition parameters are shown in Table 2 [4].
The parameters of the gasoil hydrogenation reaction process came from the fluid catalytic cracking (FCC) and hydrotreater process (“FCC_w_Hydrotreater.hsc” of refining cases of samples in UniSim Design R451 (Honeywell International, Charlotte, NC, USA, 2018) (also refer to the same process in Aspen HYSYS V8.4 (AspenTech, Bedford, MA, USA, 2016), as shown in the Figure S1). Only the dosage of hydrogen and the pressure in the reactor were altered in this work; other parameters were unchanged.
The simulation process in this work was implemented in UniSim Design, where basic modules, such as compressors, heat exchangers, and buffer tanks, were included. As for the membrane module, the precompiled dynamic link library (DLL) file was programmed by our former groupmate, and it included the algorithms and external definition file (EDF) defining the portable document format (PDF) icon and user interface in UniSim Design, which allowed convenient and fast simulation of membrane gas separation. Its accuracy was verified in his work [33].
Based on the design requirements of the above mentioned processes and basic parameters, the simulation process was built in UniSim Design, and the selected state equation was the Peng–Robinson equation.

5. Results and Discussion

The operating pressure ratio (R) refers to the ratio of pressure between the retentate side and the permeate side of the membrane module during the separation process, which affects the permeate side flow rate and gas composition. A lower pressure ratio will result in a small gas flow rate on the permeate side and low concentration enrichment efficiency, while a higher pressure ratio will also increase the subsequent compression operation cost. Taking into account the pressure ratio of each stage of the compressor in the actual production and the pressure of the feedstock, the minimum pressure ratio on both sides of the membrane was set to 5, the maximum value was 15, and an intermediate value of 10 was used for comparison. The NMGH process was optimized and the economic considerations were evaluated under these three different pressure ratios. Pp stands for the pressure of the permeate side of the membrane.

5.1. Power of Compressor K-101

The compressor K-101 was located between the two-stage CO2-selective membrane of the NMGH process, and its power was affected by the pressure and flow rate of the CM-101 permeate stream, which was decided by the CM-101 area. Therefore, the trend of K-101 power with CM-101 membrane area under different pressure ratios was studied, as shown in Figure 4. It can be seen that the power of K-101 increased as the membrane area of CM-101 increased, which led to an increase in the fast gas flow rate on the permeate side, thereby increasing the throughput of the compressor. The compressor power at a pressure ratio of 5 was significantly smaller than at the other two pressure ratios. Under the same membrane area, the pressure on the permeate side of CM-101 decreases with the increase of pressure ratio, that is, the inlet pressure of compressor K-101 decreases. When the outlet pressure is constant, the power of compressor K-101 will increase. It could be preliminarily determined (Figure 4) that a smaller pressure ratio of R = 5 was beneficial in reducing the compressor investment. The optimal pressure ratio needs to be determined by subsequent economic indicators.

5.2. Membrane Area

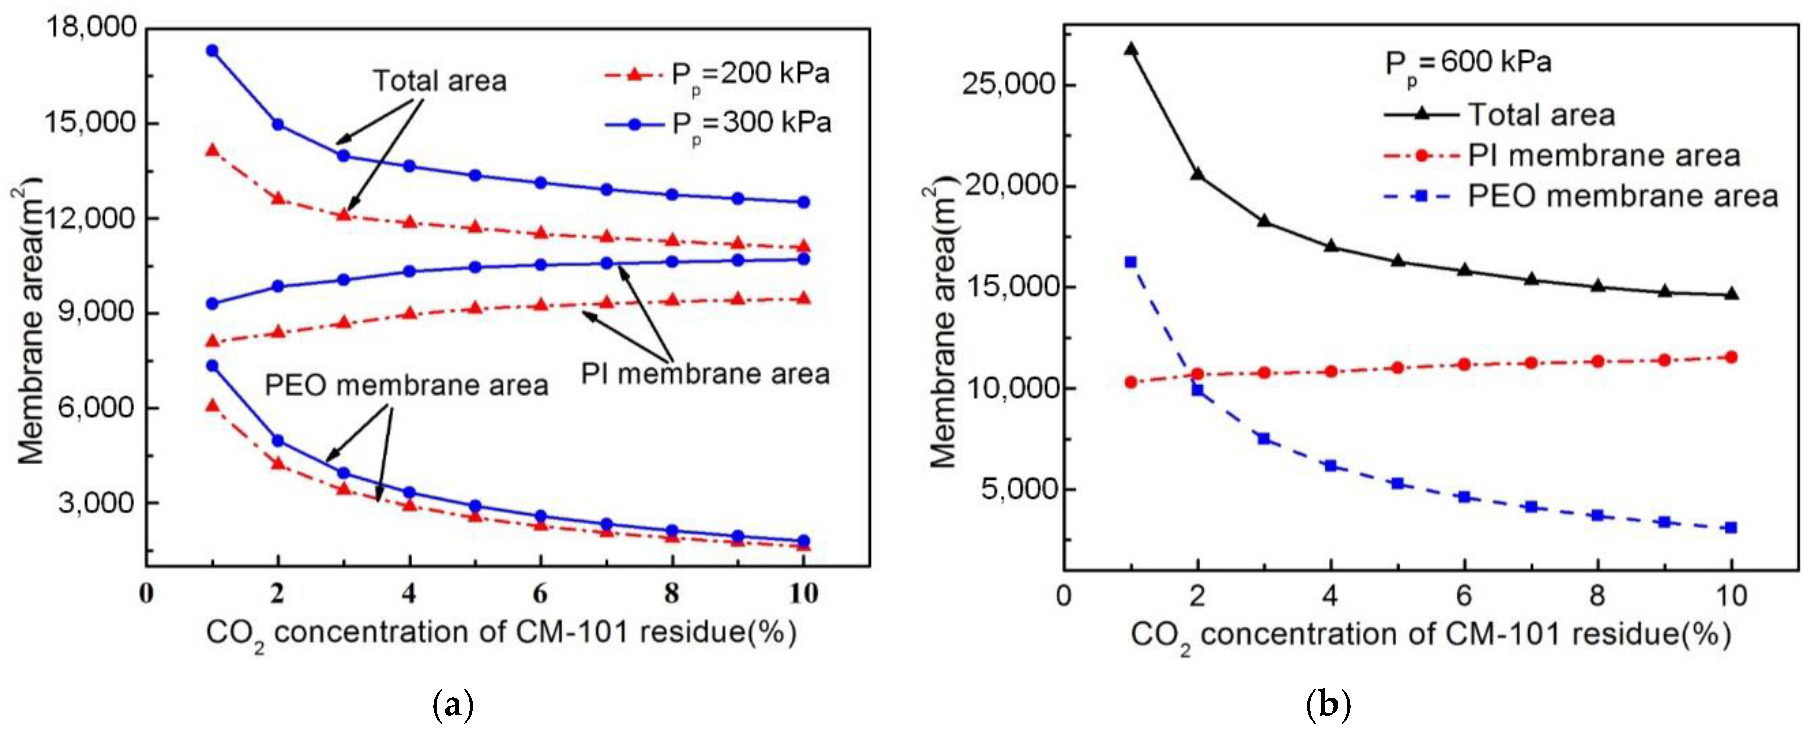
5.2.1. Effect of CO2 Concentration of CM-101 Residue on Membrane Area

The effect of CO2 concentration of CM-101 residue on total membrane area under different permeate pressures of the NMGH process is shown in Figure 5. As the bridge between the CO2 removal and H2 purification units, the CO2 concentration of CM-101 residue has a great influence on the total area of the two-stage carbon membrane and the hydrogen membrane area: a higher CO2 concentration means a great amount of CO2 will enter HM-101, which increases the H2-selective membrane area and its investment cost. However, if the CO2 concentration was too small, a larger CM-101 membrane area would be required, which would increase the total investment cost of the CO2 removal unit. As shown in Figure 5, when the CO2 concentration was reduced from 5 to 0 mol.%, the total area of the PEO membrane greatly increased; meanwhile, the PI membrane area decreased and the total area of these two membranes also increased greatly. However, when the CO2 concentration reduced from 10 to 5 mol.%, the PEO membrane area increased slowly and the PI membrane area decreased slightly, after which the total membrane area gradually increased. It is easy to conclude that the change in total area of these two membranes had the same trend as the carbon membrane area, meaning that the CO2 concentration of the CM-101 residue under different pressure ratios had a more significant influence on the PEO membrane area than on the PI membrane area.
Considering the abovementioned trends for each kind of membrane area in combination, if the CO2 concentration of the CM-101 residue were less than 5 mol.%, a great increase of carbon membrane area would be needed to achieve a lower carbon concentration. Therefore, in order to avoid the CO2-selective membrane area being too large due to the smaller CO2 concentration, as well as the addition of the H2-selective membrane area and its investment cost caused by the excessive CO2 concentration, a 5 mol.% CO2 of CM-101 residue was selected for this work.

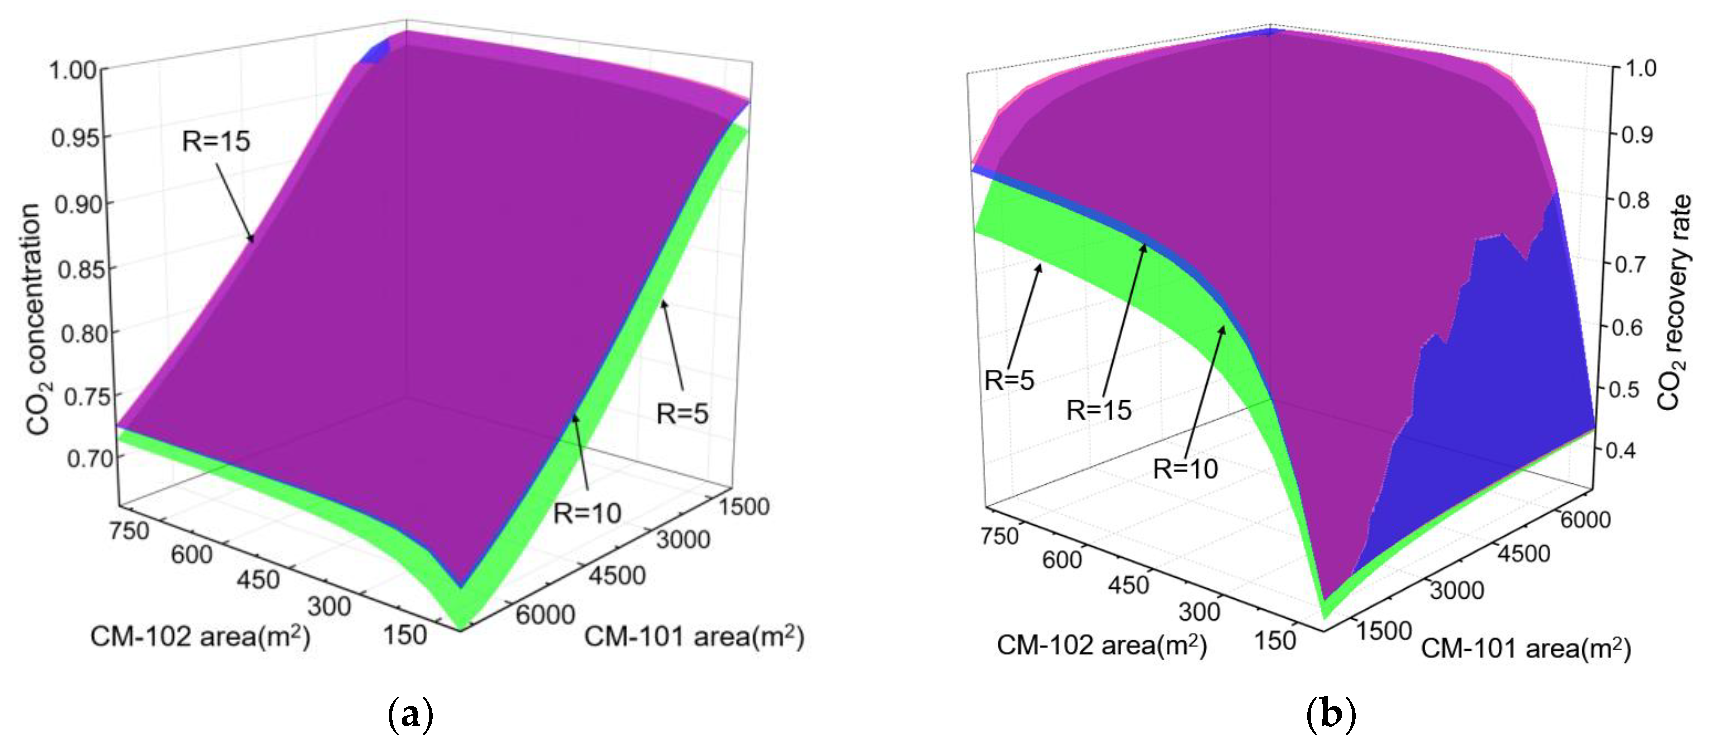
5.2.2. Effect of CM-101 and CM-102 Area on CO2 Product

The area of the membrane determines the total investment for the membrane separator and product quality, so we studied the effect of CM-101 and CM-102 area on CO2 concentration and removal rate in the NMGH process to determine the appropriate carbon membrane area, the result of which is shown in Figure 6. According to this graph, we can see that the purity of the CO2 product increased with the increasing CM-101 area when the CM-102 area was fixed, while the removal rate was basically unchanged. When fixing the area of CM-101 and changing the area of CM-102, the concentration of the CO2 product was basically unchanged, while the removal rate increased with the increasing CM-102 area, and the removal rate remained at 98 mol.% when the area of CM-102 was greater than 450 m2.
Thus, when the two-stage carbon membrane formed an internal cycle, different ratios of membrane areas resulted in different CO2 removal rates and product purity. In addition, the product concentration was mainly affected by the first-stage membrane (CM-101) area, while the removal rate was chiefly determined by the second membrane (CM-102) area, and when it reached a certain value, the removal rate was constant. In line with Figure 6, the membrane area of CM-101 and CM-102 was respectively defined under different pressure ratios: R = 5, ACM-101 = 6800 m2, ACM-102 = 377 m2.

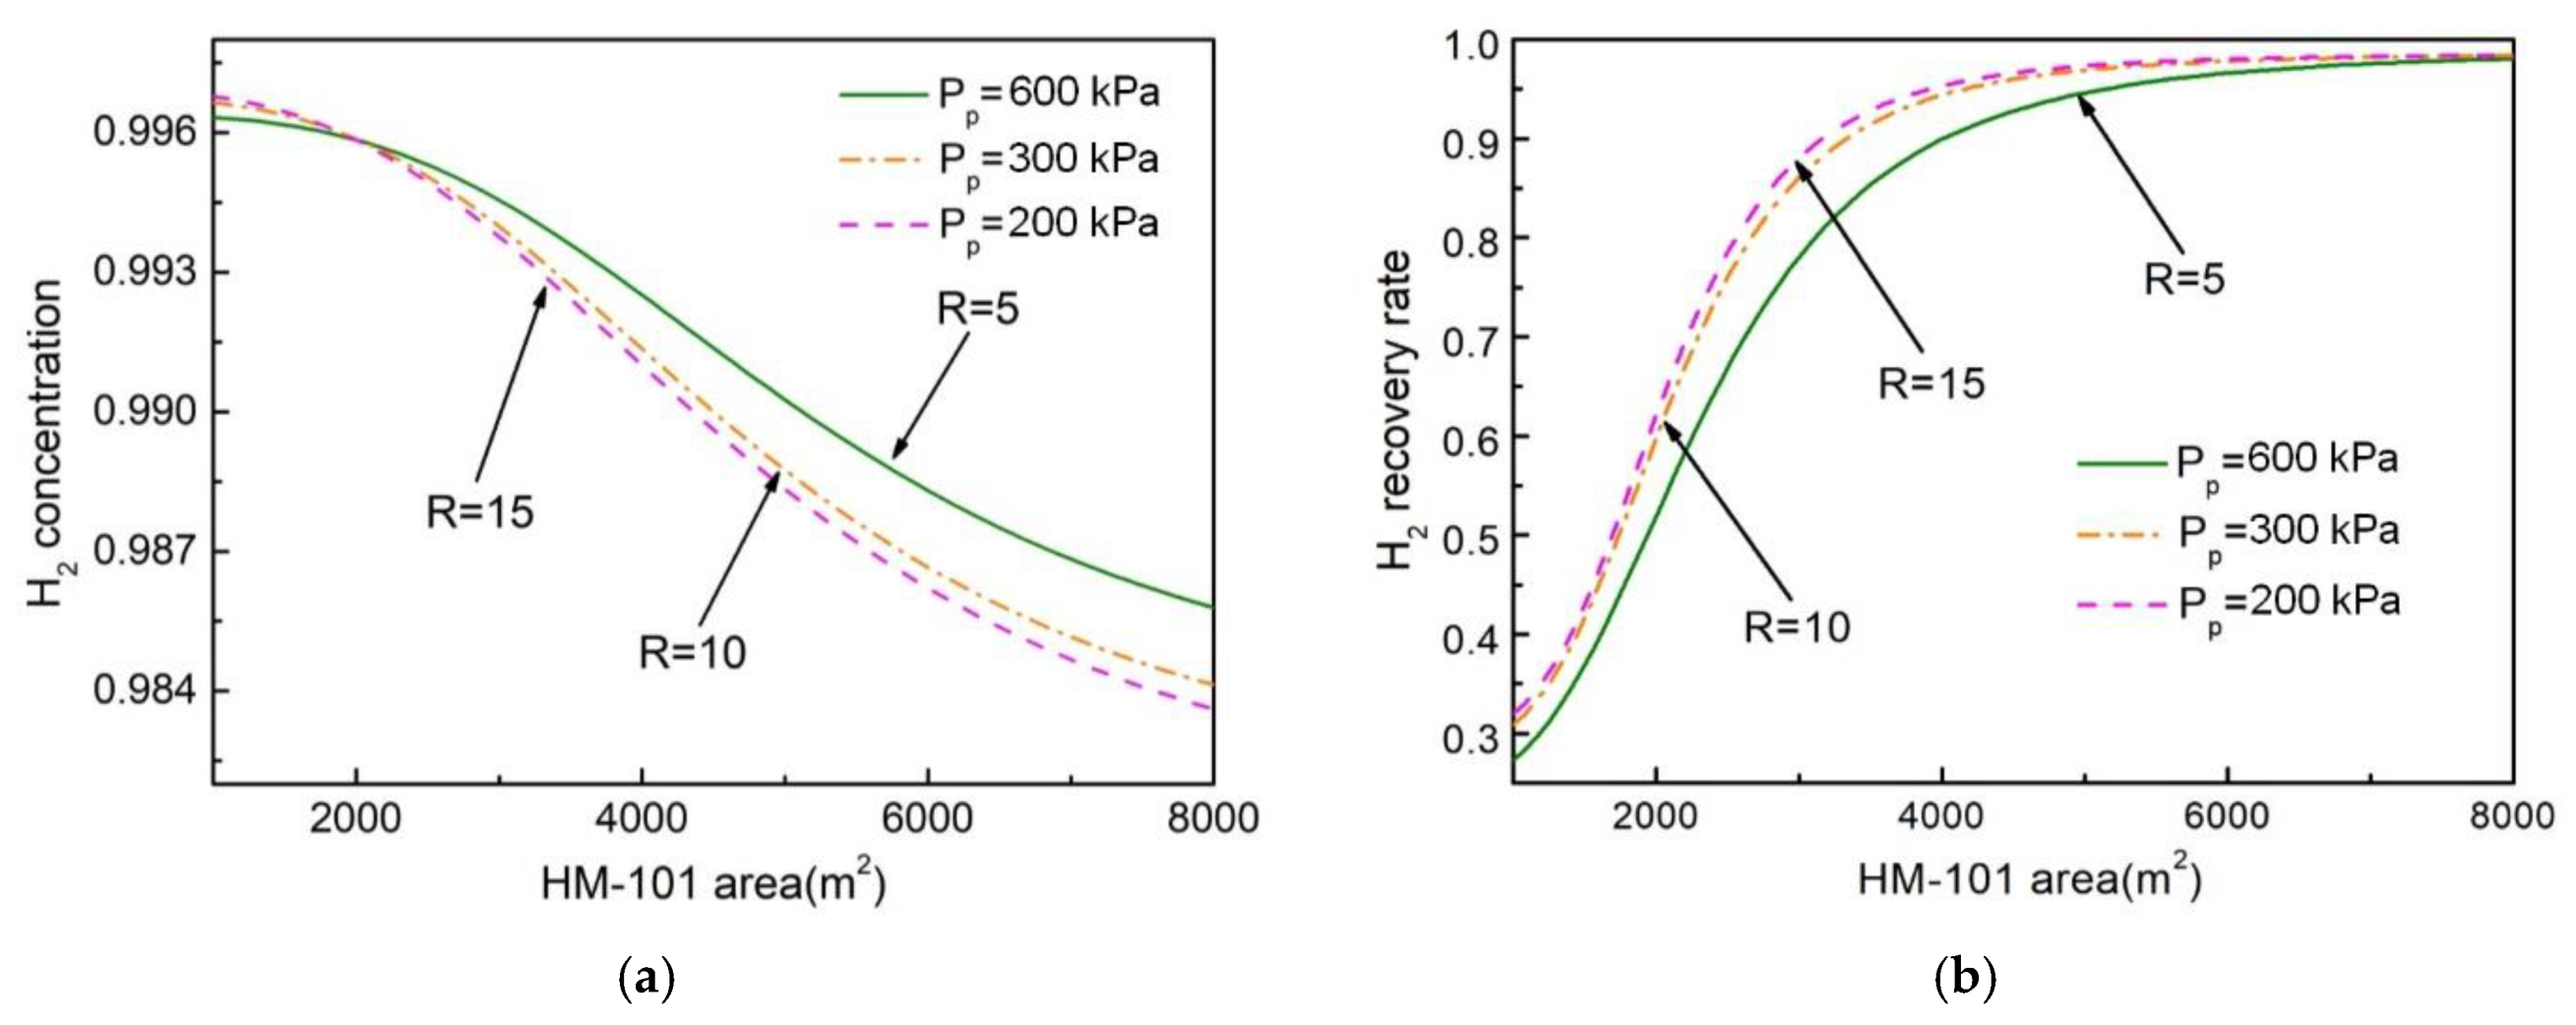
5.2.3. Effect of HM-101 Area on H2 Product

Figure 7 shows the effect of HM-101 area on H2 concentration and recovery rate in the NMGH process under different pressure ratios. It indicates that an increase in membrane area was accompanied by a decrease in hydrogen concentration along with an increase in the hydrogen recovery rate. Under the same membrane area condition, the H2 purity was higher and the recovery rate was lower when the pressure ratio was low. When the H2-selective membrane area was more than 5500 m2, the H2 recovery rate remained at a constant value (98 mol.%) as the membrane area increased. At this point, continuing to increase the membrane area of HM-101 would result in a rate of decline in hydrogen purity that would be much higher than the increased recovery rate. This is due to the increased membrane area increasing the permeation amount of the fast gas component, which would inevitably lead to an increase in the permeation amount of the slow gas component, thereby lowering the purity of H2. When the membrane area is large enough, the recovery will no longer vary with membrane area. On the basis of Figure 7 and the separation requirements, HM-101 areas were determined, respectively, as: R = 5, AHM-101 = 5400 m2; R = 10, AHM-101 = 4700 m2; R = 15, AHM-101 = 4400 m2.
The effect of the membrane area, as shown in Figure 6 and Figure 7, on product purity and recovery was different. Figure 6 shows that the two-stage carbon membrane formed a cycle inside, and the larger the pressure ratio, the greater the purity and recovery rate of H2, which showed a consistent trend. Figure 7 demonstrates that, with only a one-stage hydrogen membrane, the greater the pressure ratio, the higher the recovery rate and the lower the purity of H2. This indicates that, for a one-stage membrane system, increasing product concentration is based on the premise of sacrificing the recovery rate, while the two-stage membrane process can increase the recovery rate on the basis of reaching the product concentration, and the recovery rate is mainly influenced by the second-stage membrane area.

5.3. Economic Analysis

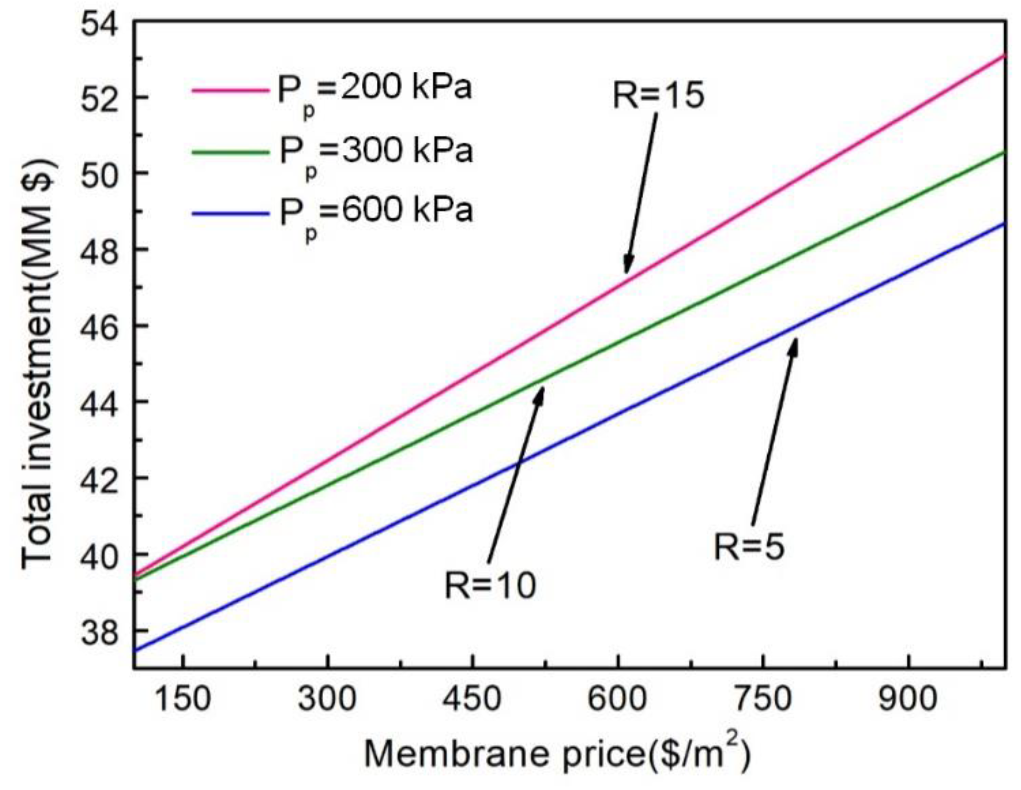
5.3.1. Impact of Membrane Price on Total Investment Cost

The price of the membrane is an important factor in the total investment cost and total annual cost of the NMGH process, and as the membrane preparation technology improves, the membrane price will continue to decrease. Therefore, using the inherent selectivity of membranes in the NMGH process, the effect of membrane prices on total investment cost under different pressure ratios was investigated, as shown in Figure 8. Since two kinds of membranes were involved in this process, the membrane price here was the average price of these two membrane materials.
It can be seen from the figure that the total investment cost has a linear upward trend in the growth of the average membrane price, and the larger the pressure ratio, the larger the total investment. According to previous research, under the same product purity, a large pressure ratio means higher driving force on both sides of the membrane; thus, a smaller membrane area will be required, but the compressor power will increase. The larger the pressure ratio in the figure, the larger the total investment, which indicates that the total investment cost increases with the increase in compressor investment. So, the compressor cost determines the total investment of the process to some extent.

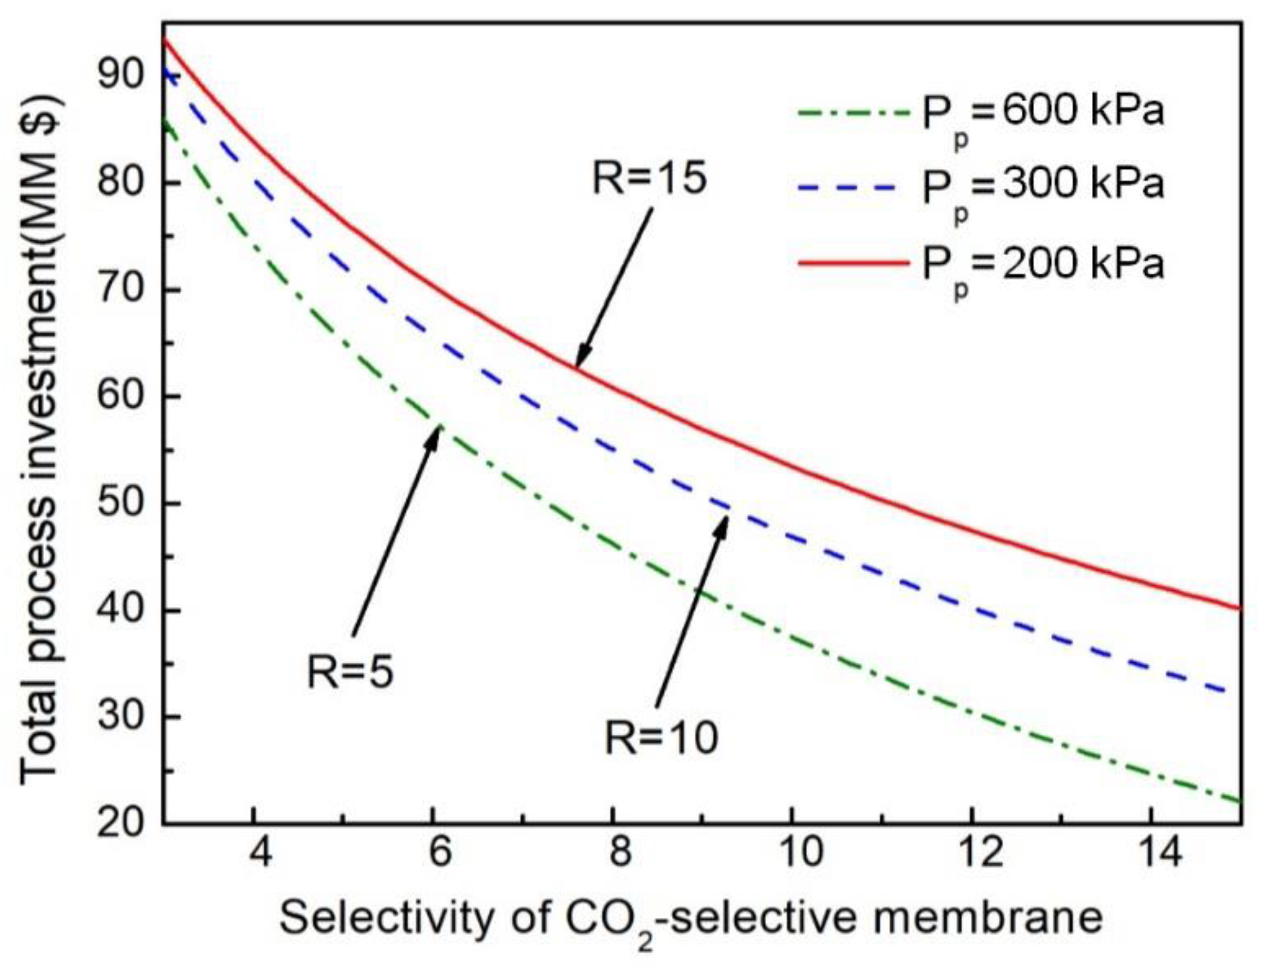
5.3.2. Impact of Membrane Selectivity on Total Investment Cost

The improved separation performance of the membrane will greatly reduce the membrane area and the power of the compressor, thereby reducing investment and operation costs. There are two kinds of membranes with only a one-stage hydrogen membrane, so we fixed the selectivity of HM-101 and studied the effect of the CO2-selective membrane on the total investment cost of the NMGH process under different pressure ratios by changing the selectivity of the two-stage carbon membrane. The results, shown in Figure 9, demonstrate that the increase in the selectivity of the membrane material will greatly reduce the total investment cost of the process when the pressure ratio is constant, which mainly depends on the huge economic benefits brought by the advancement of membrane preparation technology for actual production. At the same time, the total investment under different pressure ratios is reduced with the decrease of the pressure ratio. Reducing the pressure ratio means increasing the pressure on the permeate side, which decreases the amount of investment in the postmembrane compressor, thus reducing the total investment cost of the process.
On the basis of Figure 8 and Figure 9, the total process investment was always lowest when the pressure ratio was 5, regardless of changes in membrane price and selectivity. So R = 5 was selected as the coupling process operating pressure ratio in this work. Under the conditions of R = 5 and the selectivity of the CO2-selective membrane being higher than 13, the total investment cost would be less than $30 million, which is almost half as much as the current cost.

5.4. Economic Assessment

Since membrane prices vary widely across different regions, we took a higher value for the purpose of covering almost all the conditions. Other data based on the literature and industrial data, including equipment and utility economic parameters, are shown in Table 3. The annual operating time is 8400 h.
The total investment cost and total annual cost of the NMGH process are shown in Table 4 (excluding the reactor part). According to these data, in the H2/CO2 separation process, the investment cost of the compressor accounts for more than 75% of the total investment, which is 4.5 times the total investment in the membrane module. Among total annual costs, compressor operation cost accounted for more than 55%. The membrane separation process requires pressure difference as the driving force, while in the permeation process, there is a large pressure loss. Only by further increasing the membrane selectivity and gas permeation unit can the premembrane pressure be lowered in order to achieve the same separation target. Accordingly, the compressor investment cost and operation cost will be reduced.

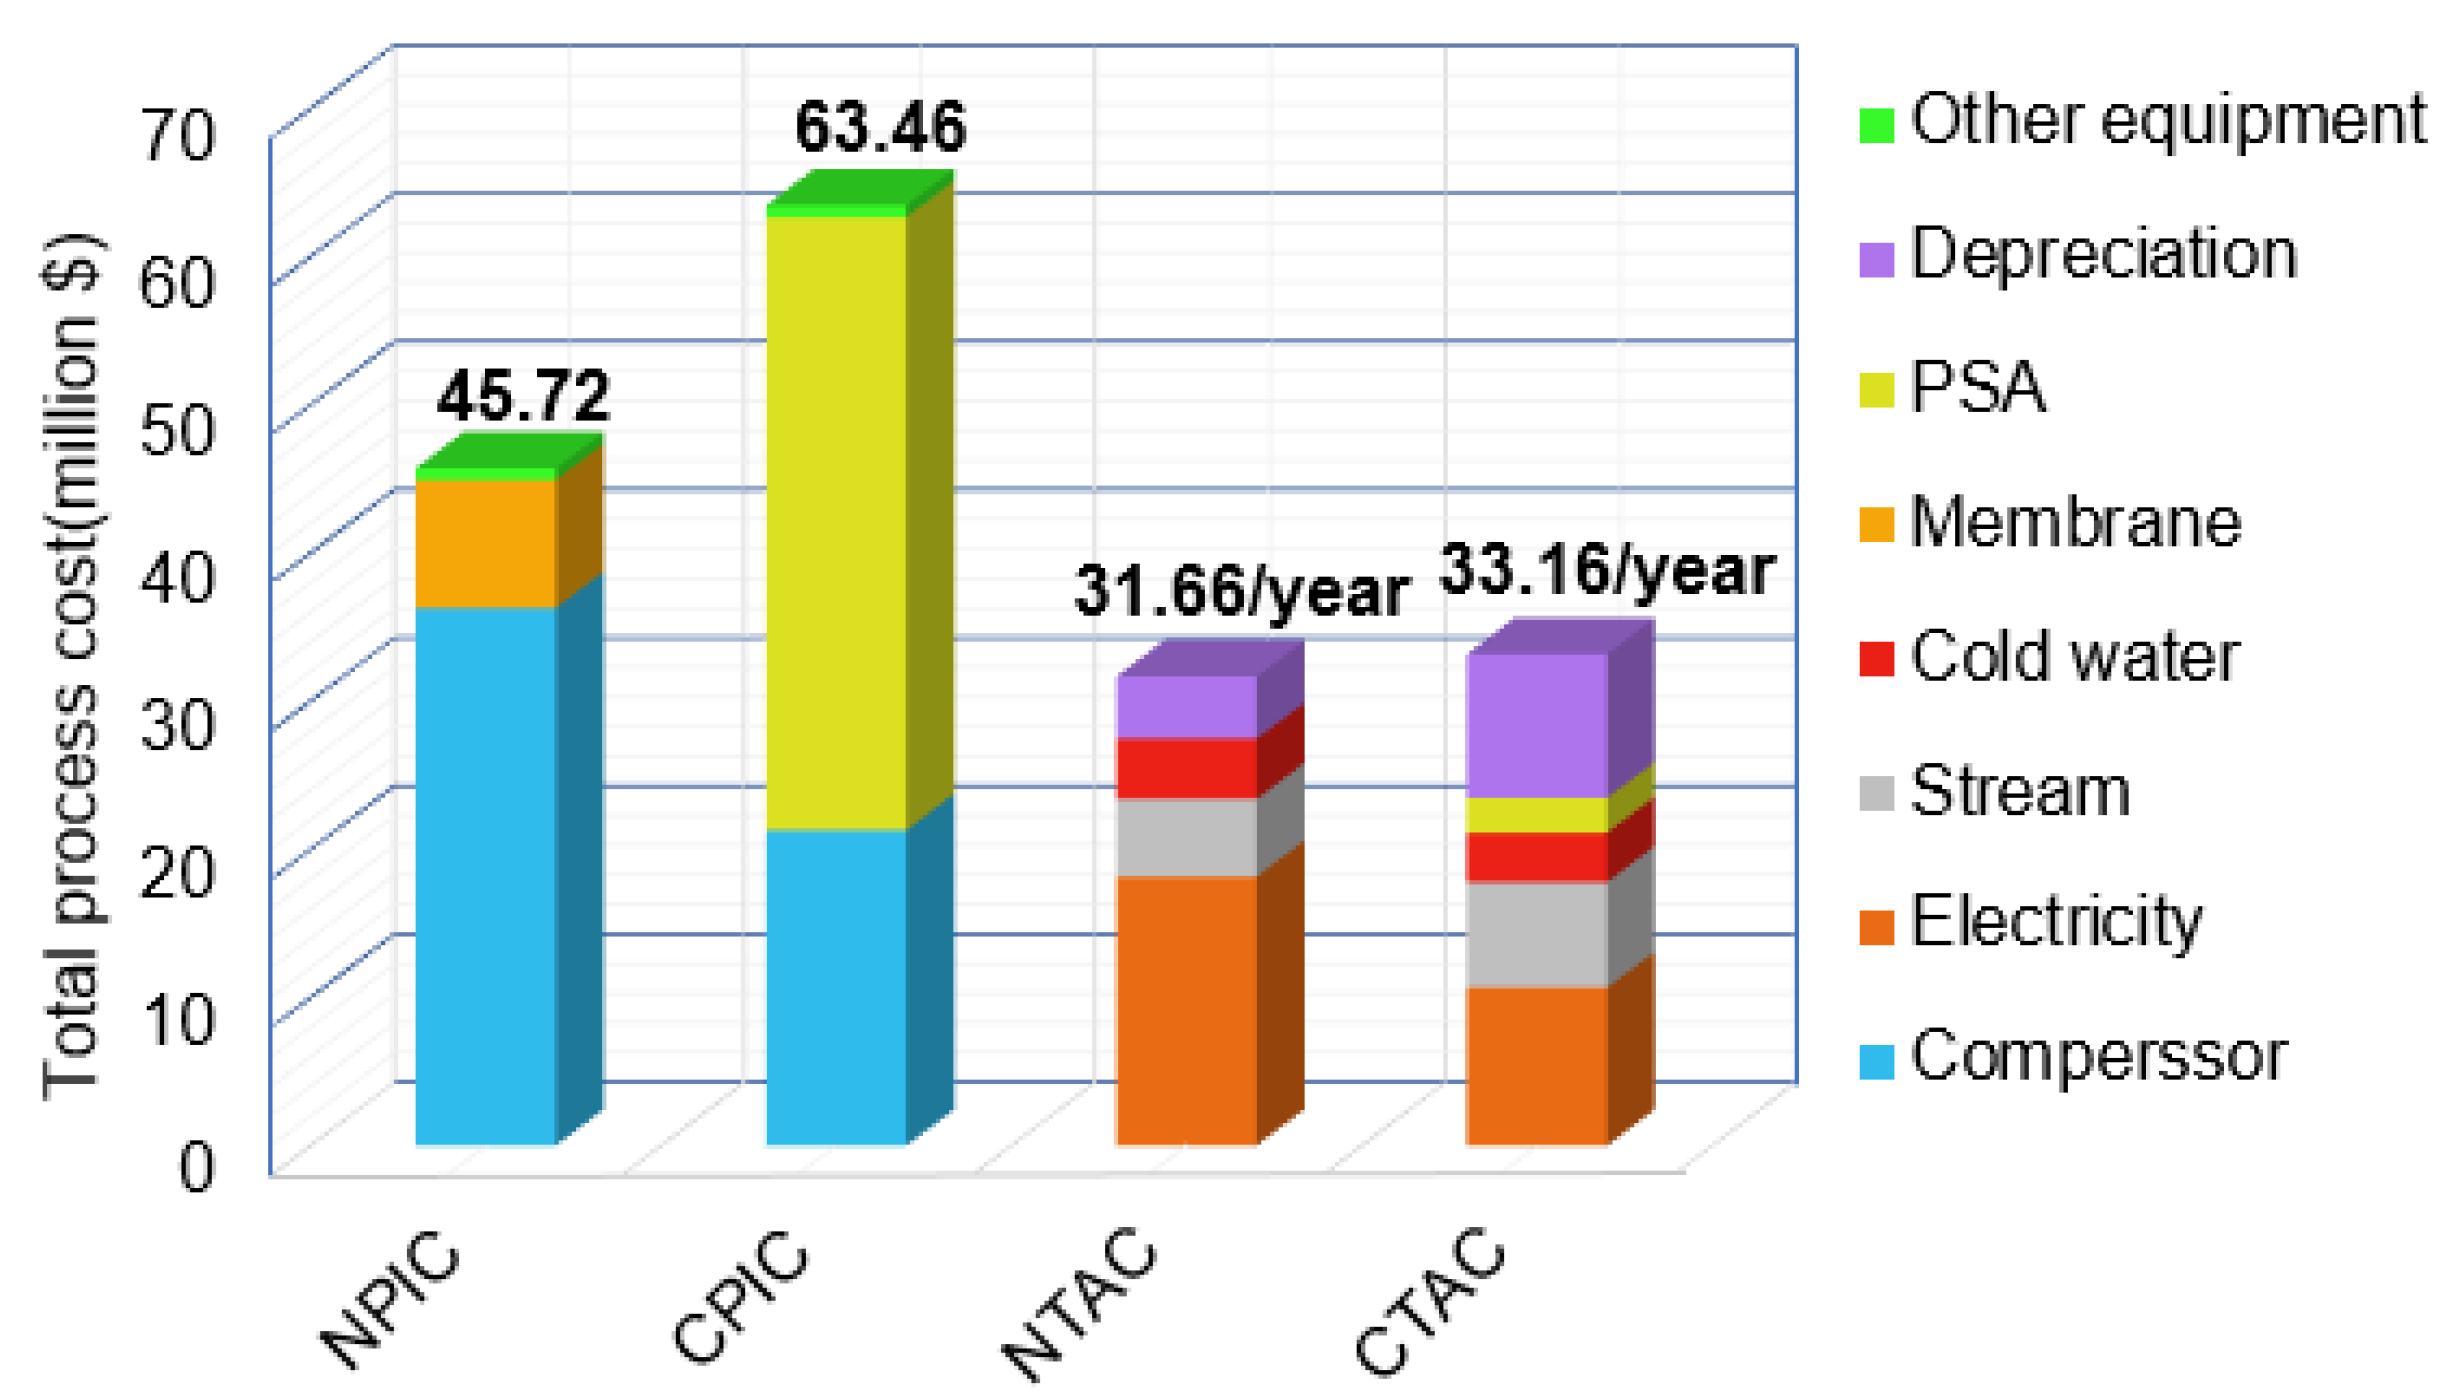
5.5. Economic Comparison

Figure 10 is a comparison of the total investment cost and total annual cost of the CPGH (the capital cost and operation cost of the CPGH process can be found in Table S1) and NMGH processes. From the total investment point of view, investment in the NMGH process compressor is nearly double that of the CPGH process (detailed operational consumptions of the CPGH and NMGH processes can be found in Tables S2 and S3). However, due to the large investment in the PSA unit ($41.36 million) and the small membrane module investment cost ($8.63 million), the total investment in the NMGH process is $17.74 million less than that of the CPGH process (Appendix A). Comparing total annual costs, the annual operation cost of the NMGH process is $4.00 million/year higher than that of the CPGH process, but because of the membrane separation process, the equipment investment depreciation expense is $5.50 million/year lower than the CPGH process, which makes the total annual cost of the NMGH process $1.50 million/year lower than the CPGH process. This demonstrates the economic superiority of the NMGH process.

6. Conclusions

A novel membrane separation process of H2/CO2 for shifted syngas produced by coal gasification coupled with the gasoil hydrogenation process was proposed in this work, which improved the CPGH process. Subsequently, the parameters of membrane area, compressor power, operating pressure, etc., were optimized. Finally, the economic assessment results proved the economic feasibility of the NMGH process.
The research results of the factors affecting the compressor power showed that the pressure of the permeate side of the first-stage membrane and its flow rate both determined the power of the compressor. The research on the purity and recovery of H2/CO2 products helped us define the appropriate operating parameters, and it was found that the two-stage membrane cascade could improve the recovery rate based on reaching the purity of the product. In addition, the purity of the product was mainly affected by the first-stage membrane area, while the recovery rate was mainly affected by the second-stage membrane area. The study of PEO membrane selectivity showed that increasing the selectivity of existing membrane materials will improve the separation effect significantly. Moreover, when R = 5 and the selectivity of the PEO membrane is higher than 13, the total investment cost of the NMGH process will hopefully be less than half of the current cost.
The economic comparison between these two processes showed that the total investment cost and total annual cost of the NMGH process are lower than the CPGH process. This indicates that the NMGH process can feasibly improve the conventional PSA separation and hydrogenation process. Especially, with advances in membrane preparation, membrane separation technology is likely to demonstrate greater advantages and potential compared with conventional PSA-based separation processes. Additionally, as the pressure of the NMGH process reactor is reduced by 11%, the new process is more economical if the reactor investment cost reduction is considered.

Supplementary Materials

The following are available online at https://www.mdpi.com/2227-9717/8/5/590/s1, Figure S1: The file path of the gasoil hydrogenation process used in this work; Table S1: The capital cost and operation cost of the CPGH process (Excluding reactor part); Table S2: Operational consumption of the CPGH process (Excluding reactor part); Table S3: Operational consumption of the NMGH process (Excluding reactor part).

Author Contributions

Conceptualization, W.H. and W.X.; methodology, X.J. and W.H.; software, B.C. and X.R.; validation, X.W. and A.K.N.; formal analysis, W.H.; investigation, B.C.; resources, X.L.; data curation, W.X.; writing—original draft preparation, W.H.; writing—review and editing, W.H. and A.K.N.; visualization, W.H.; supervision, W.X.; project administration, G.H.; funding acquisition, G.H. All authors have read and agreed to the published version of the manuscript.

Funding

National Natural Science Foundation of China (U1663223, 21676043, 21527812, 21606035); Program for Changjiang Scholars (T2012049); Fundamental Research Funds for the Central Universities (DUT17JC33, DUT17ZD203, DUT16TD19, DUT17ZD217); MOST innovation team in key area (No. 2016RA4053), Education Department of the Liaoning Province of China (LT2015007).

Acknowledgments

The authors are grateful to the foundations and the education department for their support.

Conflicts of Interest

The authors declare no conflict of interest.

Appendix A

The investment cost of PSA was converted by:
I 2 = I 1 × ( Q 2 Q 1 ) n ,
while, n = 0.75 [35], I1 and Q1 stands for the inherent investment and processing capacity of the PSA device respectively. I2 and Q2 represent the investment and processing capacity after transformation. The original data, I1 = $7.2 MM and Q1 = 14,000 Nm3/h for a set of PSA device, came from a design institute in China [36].

References

  1. Martínez, J.; Sánchez, J.L.; Ancheyta, J.; Ruiz, R.S. A Review of Process Aspects and Modeling of Ebullated Bed Reactors for Hydrocracking of Heavy Oils. Catal. Rev. 2010, 52, 60–105. [Google Scholar] [CrossRef]
  2. Jabbari, N.; Akhavan, A.N. Feasibility Study of Upgrading Nowruz Heavy Oil in Iran. Pet. Sci. Technol. 2014, 32, 1957–1966. [Google Scholar] [CrossRef]
  3. Dincer, I.; Acar, C. Review and evaluation of hydrogen production methods for better sustainability. Int. J. Hydrog. Energy 2015, 40, 11094–11111. [Google Scholar] [CrossRef]
  4. Cormos, C.-C. Evaluation of energy integration aspects for IGCC-based hydrogen and electricity co-production with CO2 capture and storage. Int. J. Hydrog. Energy 2010, 35, 7485–7497. [Google Scholar] [CrossRef]
  5. Song, C.; Liu, Q.; Ji, N.; Kansha, Y.; Tsutsumi, A. Optimization of steam methane reforming coupled with pressure swing adsorption hydrogen production process by heat integration. Appl. Energy 2015, 154, 392–401. [Google Scholar] [CrossRef]
  6. Riboldi, L.; Bolland, O. Evaluating Pressure Swing Adsorption as a CO 2 separation technique in coal-fired power plants. Int. J. Greenh. Gas Control 2015, 39, 1–16. [Google Scholar] [CrossRef] [Green Version]
  7. Li, B.; He, G.; Jiang, X.; Dai, Y.; Ruan, X. Pressure swing adsorption/membrane hybrid processes for hydrogen purification with a high recovery. Front. Chem. Sci. Eng. 2016, 10, 255–264. [Google Scholar] [CrossRef]
  8. Lopes, F.V.S.; Grande, C.A.; Rodrigues, A.E. Activated carbon for hydrogen purification by pressure swing adsorption: Multicomponent breakthrough curves and PSA performance. Chem. Eng. Sci. 2011, 66, 303–317. [Google Scholar] [CrossRef]
  9. Marcoberardino, G.D.; Vitali, D.; Spinelli, F.; Binotti, M.; Manzolini, G. Green Hydrogen Production from Raw Biogas: A Techno-Economic Investigation of Conventional Processes Using Pressure Swing Adsorption Unit. Processes 2018, 6, 19. [Google Scholar] [CrossRef] [Green Version]
  10. Arias, A.M.; Mores, P.L.; Scenna, N.J.; Caballero, J.A.; Mussati, S.F.; Mussati, M.C. Optimal Design of a Two-Stage Membrane System for Hydrogen Separation in Refining Processes. Processes 2018, 6, 208. [Google Scholar] [CrossRef] [Green Version]
  11. Merkel, T.C.; Zhou, M.; Baker, R.W. Carbon dioxide capture with membranes at an IGCC power plant. J. Membr. Sci. 2012, 389, 441–450. [Google Scholar] [CrossRef]
  12. Riboldi, L.; Bolland, O. Flexible Operation of an IGCC Plant Coproducing Power and H2 with CO2 Capture through Novel PSA-based Process Configurations. Energy Procedia 2017, 114, 2156–2165. [Google Scholar] [CrossRef]
  13. Shoko, E.; McLellan, B.; Dicks, A.L.; da Costa, J.C.D. Hydrogen from coal: Production and utilisation technologies. Int. J. Coal Geol. 2006, 65, 213–222. [Google Scholar] [CrossRef]
  14. Chen, B.; Ruan, X.; Jiang, X.; Xiao, W.; He, G. Dual-Membrane Module and Its Optimal Flow Pattern for H2/CO2 Separation. Ind. Eng. Chem. Res. 2016, 55, 1064–1075. [Google Scholar] [CrossRef]
  15. Xiao, W.; Gao, P.; Dai, Y.; Ruan, X.; Jiang, X.; Wu, X.; Fang, Y.; He, G. Efficiency Separation Process of H2/CO2/CH4 Mixtures by a Hollow Fiber Dual Membrane Separator. Processes 2020, 8, 560. [Google Scholar] [CrossRef]
  16. Bisht, D.; Petri, J. Considerations for Upgrading Light Cycle Oil with Hydroprocessing Technologies. Indian Chem. Eng. 2014, 56, 321–335. [Google Scholar] [CrossRef]
  17. Magomedov, R.N.; Popova, A.Z.; Maryutina, T.A.; Kadiev, K.M.; Khadzhiev, S.N. Current status and prospects of demetallization of heavy petroleum feedstock (Review). Pet. Chem. 2015, 55, 423–443. [Google Scholar] [CrossRef]
  18. Ali, M.F.; Ahmed, S.; Qureshi, M.S. Catalytic coprocessing of coal and petroleum residues with waste plastics to produce transportation fuels. Fuel Process. Technol. 2011, 92, 1109–1120. [Google Scholar] [CrossRef]
  19. Cruellas, A.; Heezius, J.; Spallina, V.; van Sint Annaland, M.; Medrano, J.A.; Gallucci, F. Oxidative Coupling of Methane in Membrane Reactors; A Techno-Economic Assessment. Processes 2020, 8, 274. [Google Scholar] [CrossRef] [Green Version]
  20. Radcliffe, A.J.; Singh, R.P.; Berchtold, K.A. Modeling and optimization of high-performance polymer membrane reactor systems for water-gas shift reaction applications. Processes 2016, 4, 8. [Google Scholar] [CrossRef] [Green Version]
  21. Jowkary, H.; Farsi, M.; Rahimpour, M.R. Supporting the propane dehydrogenation reactors by hydrogen permselective membrane modules to produce ultra-pure hydrogen and increasing propane conversion: Process modeling and optimization. Int. J. Hydrog. Energy 2020, 45, 7364–7373. [Google Scholar] [CrossRef]
  22. Chen, B.; Jiang, X.; Xiao, W.; Dong, Y.; El Hamouti, I.; He, G. Dual-membrane natural gas pretreatment process as CO2 source for enhanced gas recovery with synergy hydrocarbon recovery. J. Nat. Gas Sci. Eng. 2016, 34, 563–574. [Google Scholar] [CrossRef]
  23. Angeles, M.J.; Leyva, C.; Ancheyta, J.; Ramírez, S. A review of experimental procedures for heavy oil hydrocracking with dispersed catalyst. Catal. Today 2014, 220–222, 274–294. [Google Scholar] [CrossRef]
  24. Harlacher, T.; Scholz, M.; Melin, T.; Wessling, M. Optimizing Argon Recovery: Membrane Separation of Carbon Monoxide at High Concentrations via the Water Gas Shift. Ind. Eng. Chem. Res. 2012, 51, 12463–12470. [Google Scholar] [CrossRef]
  25. Wang, Z.; Wang, D.; Zhang, S.; Hu, L.; Jin, J. Interfacial Design of Mixed Matrix Membranes for Improved Gas Separation Performance. Adv. Mater. 2016, 28, 3399–3405. [Google Scholar] [CrossRef]
  26. Zarshenas, K.; Raisi, A.; Aroujalian, A. Mixed matrix membrane of nano-zeolite NaX/poly (ether-block-amide) for gas separation applications. J. Membr. Sci. 2016, 510, 270–283. [Google Scholar] [CrossRef]
  27. Dai, Z.; Loining, V.; Deng, J.; Ansaloni, L.; Deng, L. Poly(1-trimethylsilyl-1-propyne)-Based Hybrid Membranes: Effects of Various Nanofillers and Feed Gas Humidity on CO2 Permeation. Membranes 2018, 8. [Google Scholar] [CrossRef] [Green Version]
  28. Baker, R.W.; Low, B.T. Gas Separation Membrane Materials: A Perspective. Macromolecules 2014, 47, 6999–7013. [Google Scholar] [CrossRef]
  29. Suleman, M.S.; Lau, K.K.; Yeong, Y.F. Characterization and Performance Evaluation of PDMS/PSF Membrane for CO2/CH4 Separation under the Effect of Swelling. Procedia Eng. 2016, 148, 176–183. [Google Scholar] [CrossRef] [Green Version]
  30. Genduso, G.; Ghanem, B.S.; Pinnau, I. Experimental Mixed-Gas Permeability, Sorption and Diffusion of CO2-CH4 Mixtures in 6FDA-mPDA Polyimide Membrane: Unveiling the Effect of Competitive Sorption on Permeability Selectivity. Membranes 2019, 9. [Google Scholar] [CrossRef] [Green Version]
  31. Scholes, C.A.; Stevens, G.W.; Kentish, S.E. The effect of hydrogen sulfide, carbon monoxide and water on the performance of a PDMS membrane in carbon dioxide/nitrogen separation. J. Membr. Sci. 2010, 350, 189–199. [Google Scholar] [CrossRef]
  32. Harlacher, T.; Melin, T.; Wessling, M. Techno-economic Analysis of Membrane-Based Argon Recovery in a Silicon Carbide Process. Ind. Eng. Chem. Res. 2013, 52, 10460–10466. [Google Scholar] [CrossRef]
  33. Chen, B.; Ruan, X.; Xiao, W.; Jiang, X.; He, G. Synergy of CO2 removal and light hydrocarbon recovery from oil-field associated gas by dual-membrane process. J. Nat. Gas Sci. Eng. 2015, 26, 1254–1263. [Google Scholar] [CrossRef]
  34. Lin, H.; He, Z.; Sun, Z.; Kniep, J.; Ng, A.; Baker, R.W.; Merkel, T.C. CO2-selective membranes for hydrogen production and CO2 capture—Part II: Techno-economic analysis. J. Membr. Sci. 2015, 493, 794–806. [Google Scholar] [CrossRef] [Green Version]
  35. Seider, W.D.; Seader, J.D.; Lewin, D.R. Product and process Design Principles--Synthesis, Analysis, and Evaluation, 3rd ed.; John Wiley and Sons (Asia) Pte Ltd.: Hoboken, NJ, USA, 2010; pp. 204–247. ISBN 978-0-470-41441-5. [Google Scholar]
  36. Ding, Y.; Yan, Z.; Liu, G.L. Hydrogen system integration optimization and device equipment layout. Chem. Eng. (China) 2018, 45, 73–78. [Google Scholar] [CrossRef]
Figure 1. Flowsheet diagram of the multibed PSA (Pressure swing adsorption) process.
Processes 08 00590 g001
Figure 2. The schematic diagram of the CPGH (Conventional PSA Separation for H2/CO2 of Shifted Syngas and Gasoil Hydrogenation) process.
Processes 08 00590 g002
Figure 3. The schematic diagram of the NMGH (Novel Membrane Separation for H2/CO2 of Shifted Syngas Coupled with Gasoil Hydrogenation) process.
Processes 08 00590 g003
Figure 4. Impacts of CM-101 area on compressor K-101 power under different pressure ratios.
Processes 08 00590 g004
Figure 5. Effect of CO2 concentration of CM-101 residue on membrane area under different permeate pressures. (a) Diagram under 200 and 300 kPa; (b) diagram under 600 kPa.
Processes 08 00590 g005
Figure 6. Effect of CM-101 and CM-102 area on CO2 concentration and recovery rate under different pressure ratios. (a) Effect of CO2-selective membrane area on CO2 molar concentration; (b) effect of CO2-selective membrane area on CO2 recovery rate.
Processes 08 00590 g006
Figure 7. Effect of HM-101 area on H2 concentration and recovery rate under different pressure ratios. (a) Effect of HM-101 area on H2 molar concentration; (b) effect of HM-101 area on H2 recovery rate.
Processes 08 00590 g007
Figure 8. Impact of membrane price on total investment cost under different pressure ratios.
Processes 08 00590 g008
Figure 9. Impact of CO2/H2 selectivity of the CO2-selective membrane on total investment cost under different pressure ratios.
Processes 08 00590 g009
Figure 10. Economic comparison between the traditional process and the novel one. CTAC: Conventional process total annual cost; CPIC: conventional process investment cost; NTAC: novel process total annual cost; NPIC: novel process investment cost. The bright yellow in CTAC represents the annual operation cost of PSA.
Processes 08 00590 g010
Table 1. Membrane permeance [32].
Membrane MaterialTemperature (°C) Gas Permeance (GPU 1)
H2COCO2N2H2SH2O
Hydrogen membrane PI757202620060 2300 21500 2
Carbon membrane PEO2519565158022 21500 23000 2
1 GPU = 10−6 cm3(STP)/(cm2 × s × cmHg); 2 Data from industrial production.
Table 2. Feed condition and composition.
NameValue
Temperature (°C) 300
Pressure (kPa) 3000
Flow (Nm3/h) 80,000
Composition (mol.%)
H241.03
CO1.01
CO229.92
N22.50
H2S0.10
H2O25.54
Table 3. Cost parameters for economic assessment.
ItemUnitPriceReference
Membrane$/m 2600/800
Compressor$/kW1000[34]
Other equipment 1$/year50,000
Total investment cost$Membrane + Compression + Other equipment 1
Electricity$/kWh0.07[22]
Steam$/t14.50[22]
Cold water$/t0.08
Depreciation timeyear5 for PSA 2, 5 for membrane, 15 for others
Total annual cost$/yearOperation cost + Depreciation
1 Other equipment includes heat exchangers, vessels, alkaline washing towers, and mixers in process. 2 According to the characteristics of water content in shifted syngas and replacement period of adsorbent, the depreciation life of PSA in this study is set as 5 years.
Table 4. The capital cost and operation cost of the NMGH process (excluding the reactor part).
ItemUnitValue
Compressor equipment costmillion $36.29
Membrane equipment costmillion $8.63
Other equipment costmillion $0.80
Total investment costmillion $45.72
Depreciation costmillion $/year4.20
Electricity operation costmillion $/year18.14
Cold water operation costmillion $/year4.07
Steam operation costmillion $/year5.25
Total annual costmillion $/year31.66

