Article

Selecting the Optimal Configuration for a Solar Air Heater Using the Grey–Taguchi Method

1
Department of Mechanical Engineering, Istanbul Aydin University, Florya, Istanbul 34295, Turkey
2
Department of Industrial Engineering, Istanbul Aydin University, Florya, Istanbul 34295, Turkey
3
Department of Energy and Petroleum Engineering, Faculty of Science and Technology, University of Stavanger, 4036 Stavanger, Norway
*
Author to whom correspondence should be addressed.
Processes 2020, 8(3), 317; https://doi.org/10.3390/pr8030317
Submission received: 11 February 2020 / Revised: 27 February 2020 / Accepted: 5 March 2020 / Published: 9 March 2020
(This article belongs to the Special Issue Clean Energy Conversion Processes)

Abstract

:
In this study, a typical Grey–Taguchi method has been applied in order to select the optimal configuration of a solar air heater to achieve optimum performance. The analysis is performed for different system configurations in terms of collector type, mass flow rate, and cover type. The Grey–Taguchi method, which requires the minimum possible numbers of the demanded experiments for accomplishing a robust statistical decision for a given experimental problem, has been employed, and temperature difference and thermal performance have been used as the two main criteria. It is found that by considering the temperature difference criterion, at a mass flow rate of 0.011 kg/s, the best configuration is the double-pass solar collector owning a one-fourth pierced Plexiglas cover with a distance of 60 mm between the centers of the holes. On the other hand, by considering the thermal performance as the criterion, the best configuration at a mass flow rate of 0.032 kg/s is found to be the double-pass solar collector holding a half-pierced Plexiglas cover and a distance of 60 mm distance between the centers of the holes. Finally, once both factors are taken into consideration, the optimal configuration suggested by the method is the double-pass collector with a one-quarter pierced Plexiglas cover. The method also suggests keeping a 30 mm distance between the centers of the holes and applying 0.032 kg/s of the mass flow rate to achieve the highest performance.

1. Introduction

A solar collector has great importance in various industrial applications. Due to its simple design, low maintenance cost, and economic feasibility, a solar air heater is more widely used compared to other solar systems [1]. A common type of solar air heaters is the flat-plate solar air heater that utilizes solar energy to heat air [2]. In general, these types of solar air heaters are used for drying or curing concrete and clay in the construction industry [3,4], or drying fruits and vegetables within the food industry [5]. The conventional solar air heaters consist of an absorber plate and a glass cover on top of it that forms a narrow channel wherein the air stream is heated in and directed through it [6]. Since different factors, such as mass flow rate, plate sheet material, cover type, collector dimensions, etc., affect the solar air heater performance, researchers have adopted different techniques to increase the performance of solar collectors by changing the configuration of the system [7,8,9]. However, the optimization of the thermal performance of solar air heaters is still a major challenge. Some researchers have proposed the use of porous materials instead of a metal sheet for the latter mentioned aim [10]. In another study, a perforated Plexiglas was used instead of a normal cover to improve the cooling process of the cover and to enhance the performance of the collector [2]. Yang et al. designed a solar air heater including offset trip fins and developed a numerical model to optimize the system [11]. A similar study was performed by El-Khawajah et al. [12]. A combination of artificial neural networks and genetic algorithms were applied to maximize the economic feasibility of the system in [13,14]. In another research, the thermal performance of a flat-plate solar air heater was optimized by taking advantage of the genetic algorithm and considering different operating parameters [6].
Reviewing numerous literature shows that various optimization techniques were proposed for finding the optimal or semi-optimal configurations of solar air heaters. The current study aims to find the optimal configuration of a solar air heater under certain conditions. Single- and double-pass configurations of a solar air heater possessing four different pierced Plexiglas covers were examined at two different air mass flow rates by employing the Grey–Taguchi method. The goal was to find the optimal setup and to carry out a robust statistical analysis. Two criteria, temperature difference (∆T) and system performance, were taken into consideration and three factors affecting these criteria, i.e., solar collector type, mass flow rate, and cover type were also investigated. To the best of the authors’ knowledge, this issue has not been previously studied and it is obvious that the optimal condition leads to the maximum thermal performance of the system.

2. Performed Experimental Research

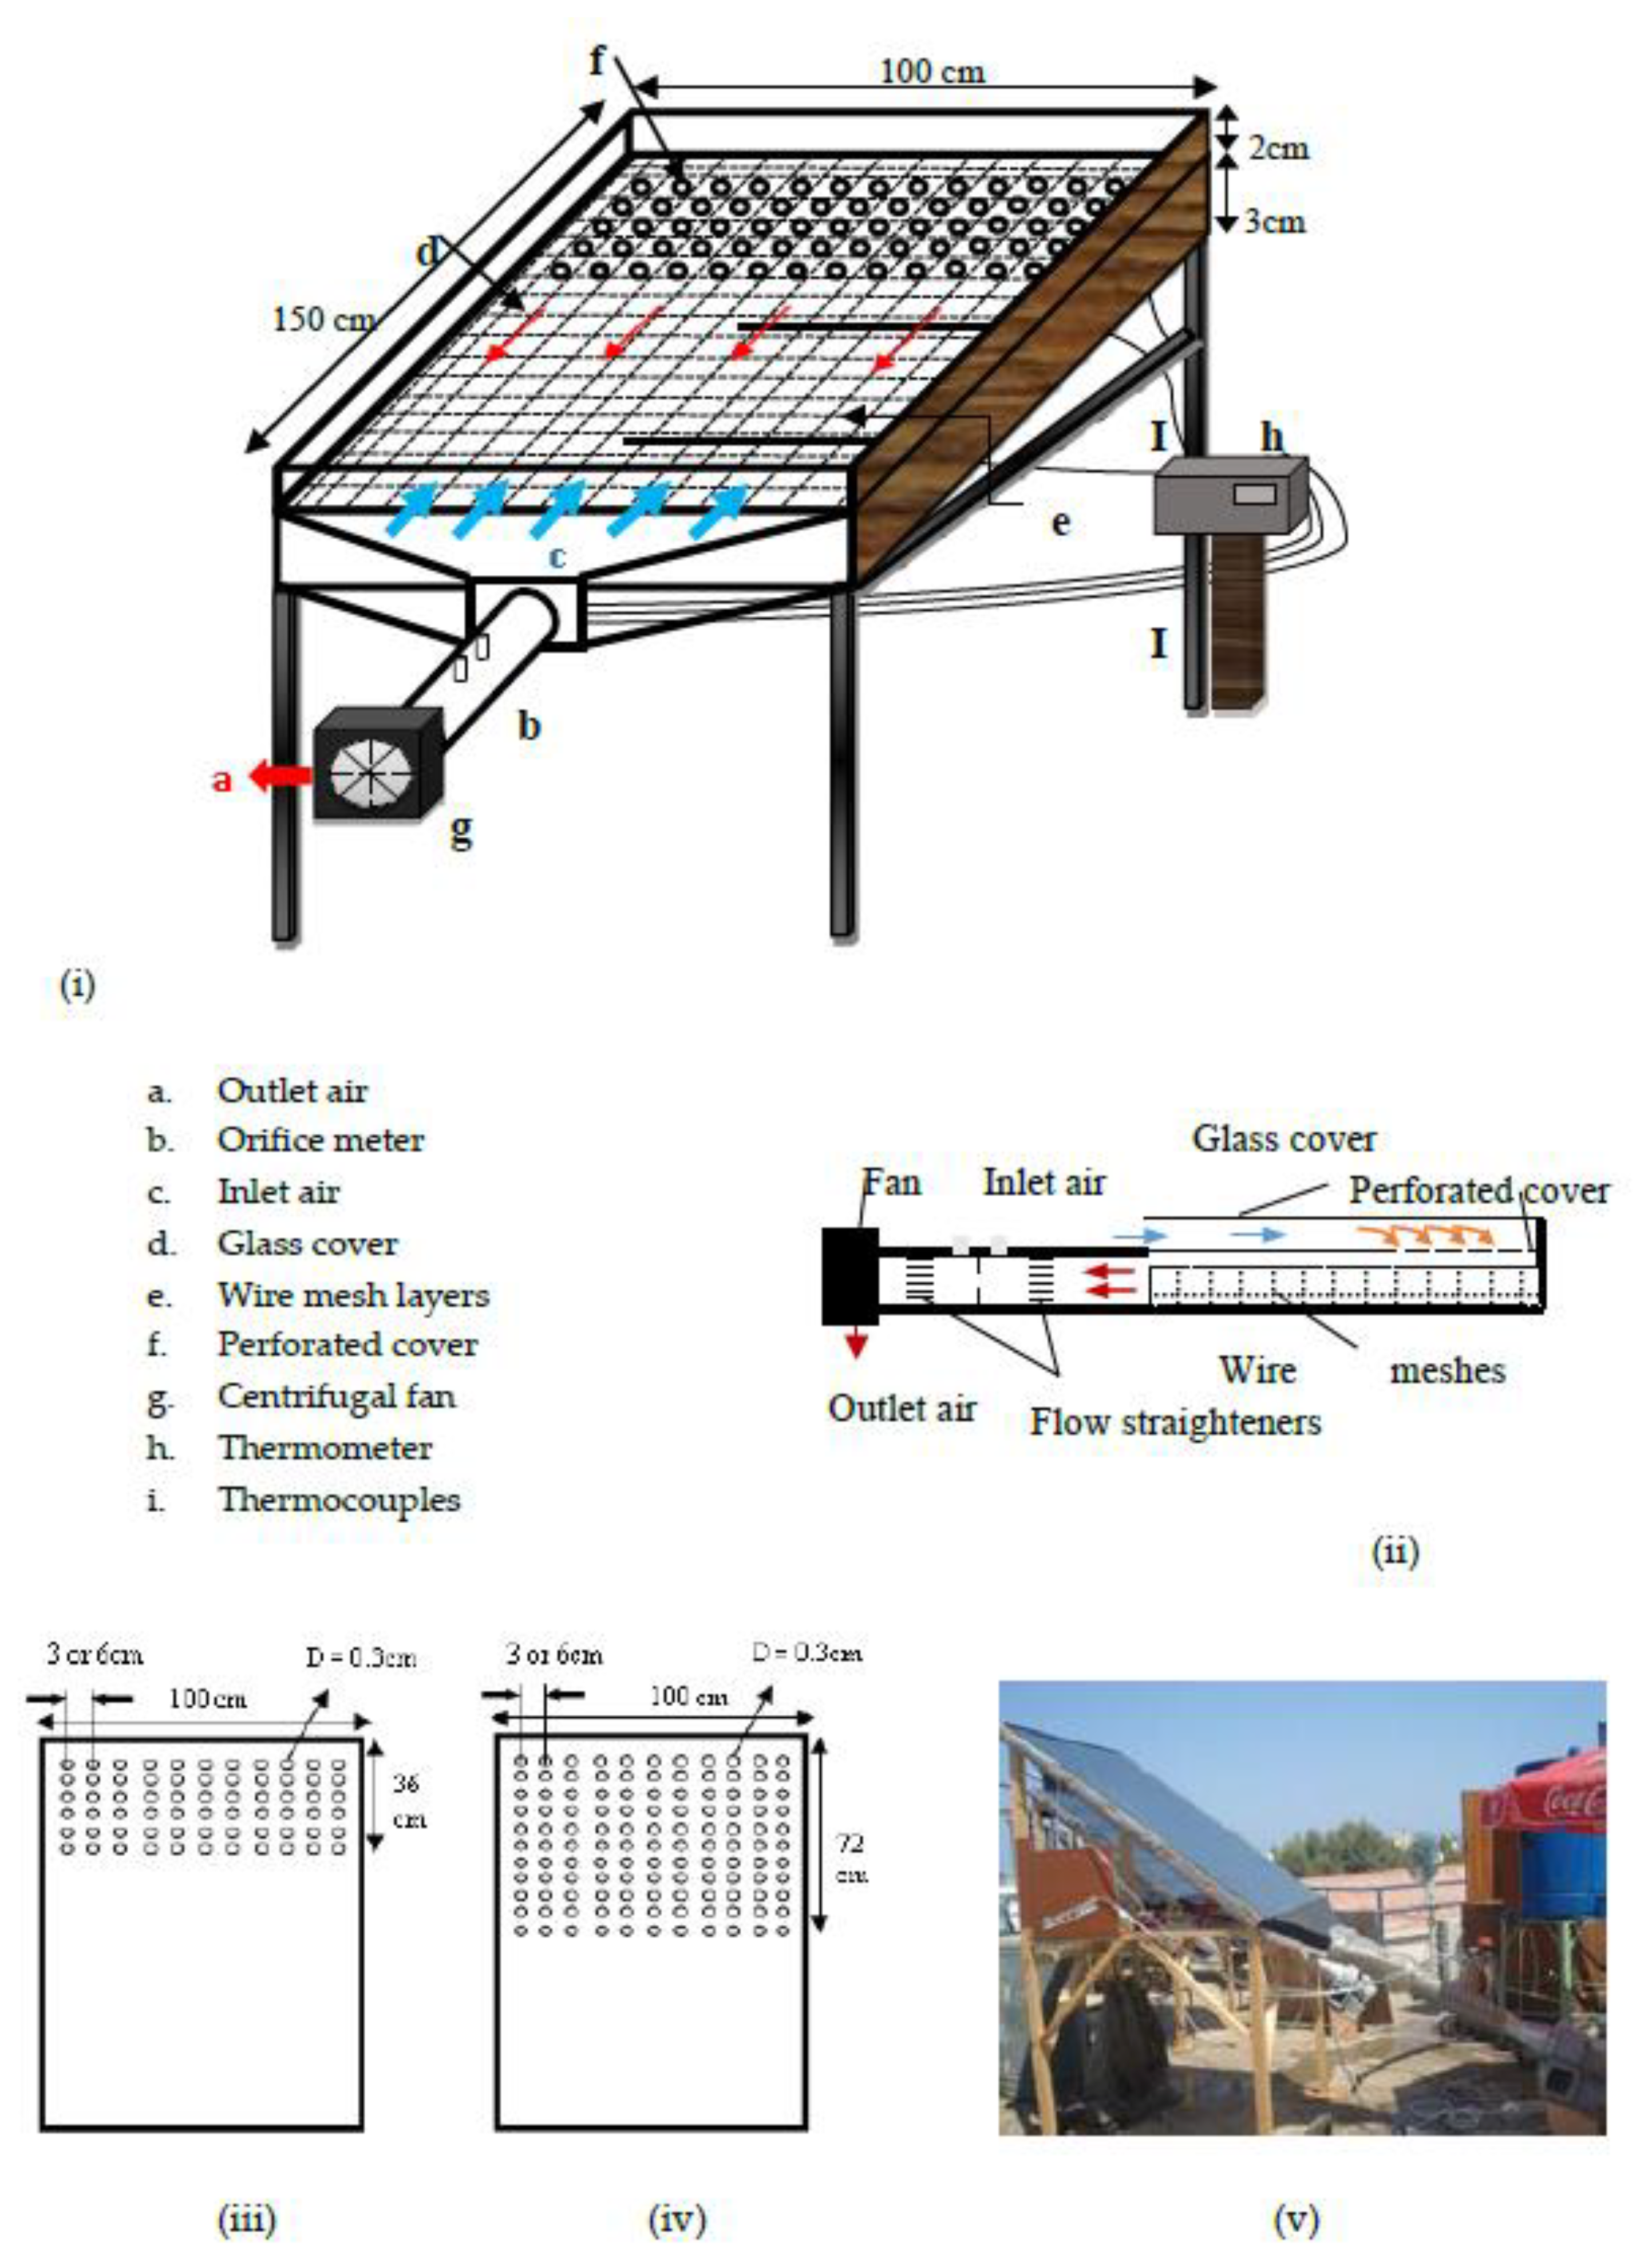
The experiment was conducted at Famagusta City in North Cyprus. The schematic and pictorial views of the manufactured solar air heater and the pierced covers are shown in Figure 1. Different perforated Plexiglas covers with a thickness of 4 mm were used as the cover of the collector (length: 1500 mm and width: 1000 mm). Plywood with a thickness of 18 mm was used to make the frame of the solar collector. The frame was painted in a black color and was insulated with 30 mm thick Styrofoam to decrease heat loss from the system. The collector bed height was 30 mm and the distance between the first and second cover was 20 mm in the counter flow collector.
Inside the collector duct, 14 wire mesh layers were used instead of an absorber sheet and they were fixed in three separate sets with a distance of 5 mm between each set. Each mesh layer was painted in a black color to increase absorptivity. The wire meshes used in this collector were similar to the ones used by other researchers [12,15,16].
The construction cost of the solar air collector was reduced because the mesh layers were much cheaper than an absorber plate. Moreover, by using wire mesh layers the pressure drop was decreased through the collector. As it is mentioned in the literature, the major heat loss is through the cover of the air heaters. In this experimental research, pierced transparent Plexiglas was used as cover instead of a normal glass cover to minimize the heat loss through the cover. Four types of pierced Plexiglas were employed. To determine the effect of the pierced cover on the performance of the solar air heater, the number of holes and the distance between their centers were different on various covers. The types of pierced Plexiglas covers were as follows:
I.
One-fourth pierced Plexiglas cover: holes at the upper side of the cover in an area of 1000 × 360 mm2, holes center to center distance: 30 mm;
II.
One-fourth pierced Plexiglas cover: holes at the upper side of the cover in an area of 1000 × 360 mm2, holes center to center distance: 60 mm;
III.
One-half pierced Plexiglas cover: holes at the upper side of the cover in an area of 1000 × 720 mm2, holes center to center distance: 30 mm;
IV.
One-half pierced Plexiglas cover: holes at the upper side of the cover in an area of 1000 × 720 mm2, holes center to center distance: 60 mm.
The diameter of the holes in all four types of covers was 3 mm. In order to create uniform airflow through the galvanized pipe, flow straighteners were fixed before and after the orifice meter.
For comparison purposes, the same solar collector was tested with a normal Plexiglas as its glazing. The opening area was 100 cm2.
The fan used in the system was a OBR 200 M-2K type. An inclined tube manometer was used to measure the pressure difference through the orifice and collector. The speed controller was connected to the fan to allow the user to adjust the speed.
The air temperature at different places was measured by T-type thermocouples. The temperature readings were recorded by a digital thermometer (±0.5 °C accuracy). The solar intensity was measured with a Pyranometer (resolution of ±0.5%). The solar collector was faced toward the south and its tilt angle was 39.5°. The experiments started at 8:00 and finished at 17:00 each day.

3. Grey–Taguchi Design

To set the experimental procedure to design the solar air heater, a combination of two methods, the Taguchi method and Grey Rational Analysis (GRA) are used in this study.
The Taguchi method [17,18,19,20] is a useful method in the design of experiments, which decreases the number of required experiments based on the given control factors. Each experiment is composed of a level of each control factor. The combination of the levels of control factors for each experiment is obtained by the predetermined orthogonal arrays. Then, each experiment is performed for several replications and an outcome is introduced by any replication which is named process response. The responses obtained from each experiment are converted to a signal-to-noise (S/N) ratio in order to be comparable. The experiment with the highest S/N value introduces the best level of control factors [21,22,23].
As mentioned earlier, the solar air heater has the following control factors, and the levels of each factor that are considered to be optimized in the design of the solar air heater are mentioned in Table 1.
  • Solar collector (noted by A);
  • Mass flow rate (noted by B);
  • Cover type (noted by C).
Based on the explanations in Section 2, the following process responses are considered for the solar air heater:
  • Δ T (the higher the ∆T, the better the characteristic);
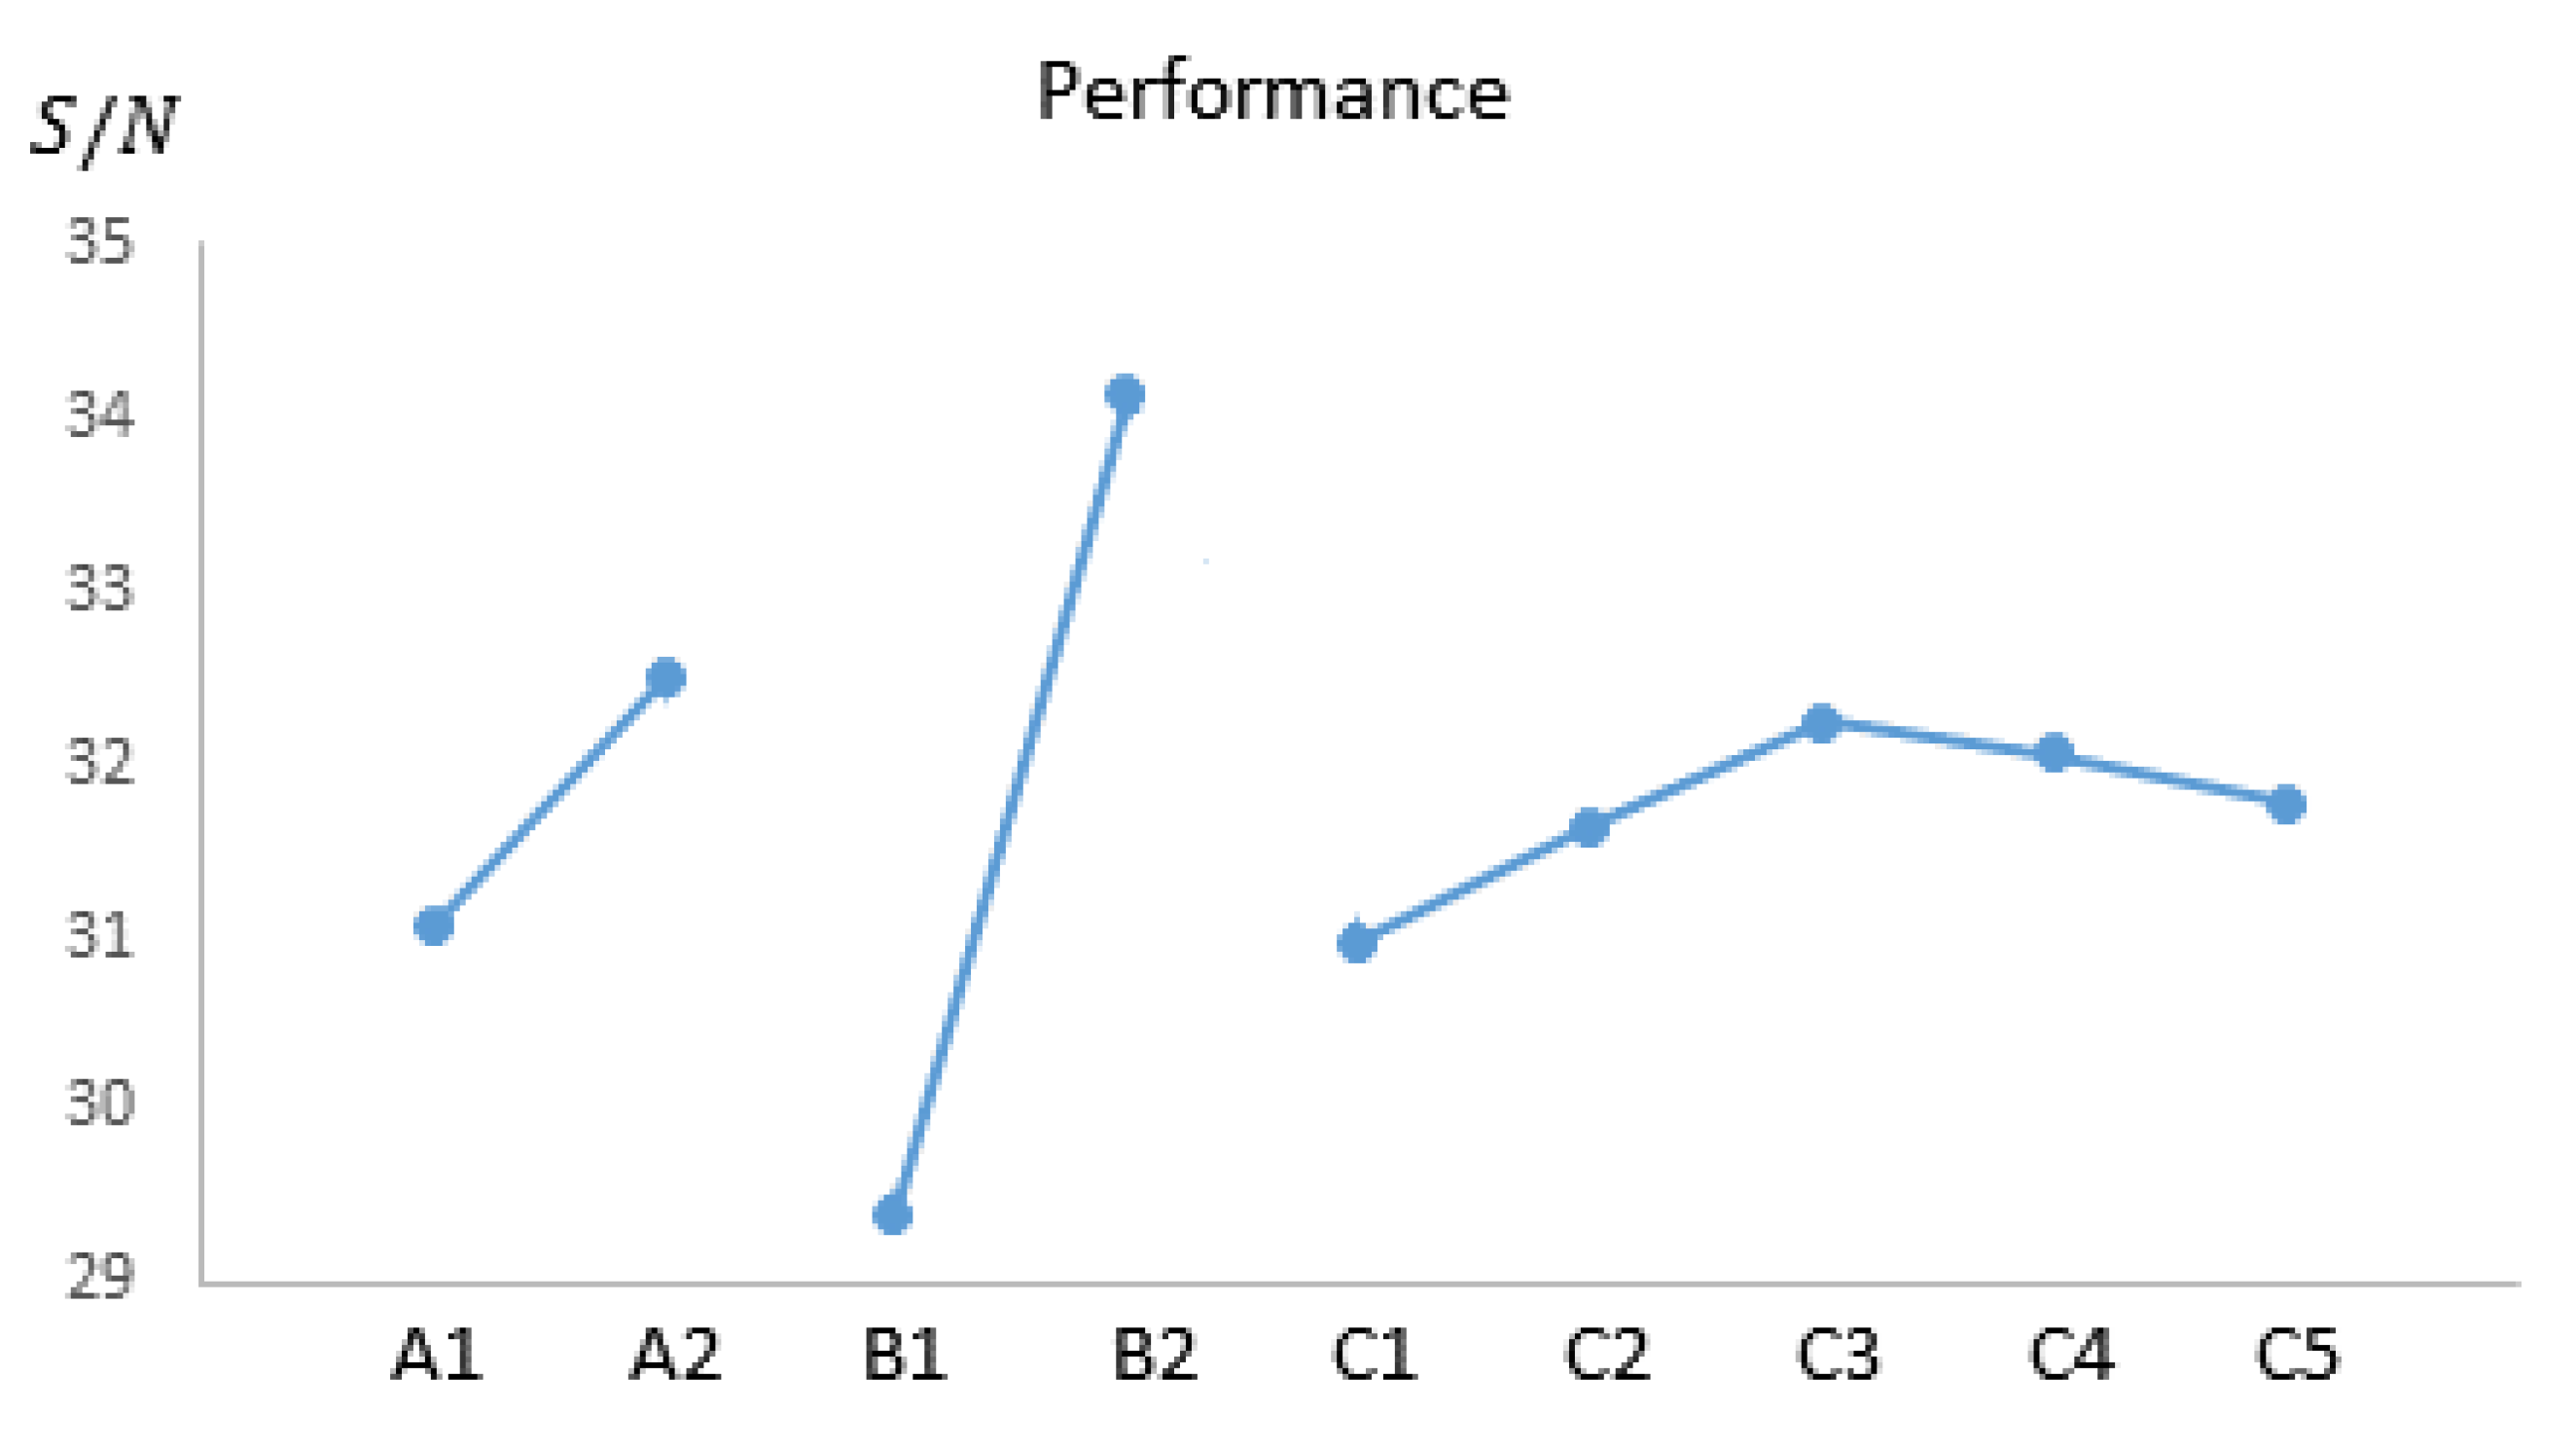
  • Performance (the higher the performance, the better the characteristic).
T defines the temperature difference between the air entering the collector and the outlet air temperature (∆T = Outlet air temperature − inlet air temperature). T-type thermocouples located at the inlet and outlet of the collector were used to measure the air temperatures during the experiment (see Figure 1). The recorded temperatures were then used to calculate the thermal efficiency (Performance) of the system. The following equation is applied to calculate the thermal performance (ηth) of the solar air heater at each experiment,
η t h = m ˙ c P Δ T I A ,
where m ˙ is the air mass flow rate (kg/s), cp is the air specific heat (J/kg K), ∆T is the temperature difference, I is the solar radiation (W/m2) and A is the absorber area (m2). A Pyranometer is used to measure the incident solar radiation at each hour of the experiment. For each system configuration, the performance is calculated and these data are used in the Grey–Taguchi design.
As two control factors have two levels and one control factor has five levels, one degree of freedom is considered for each level control factor and four degrees of freedom are considered for the factor with five levels. The total degree of freedom for the Taguchi method is calculated as ( 2 × 2 ) + 4 + 1 = 9 . Therefore, the orthogonal array of the Taguchi design of the solar air heater must have at least nine rows (experiments). Therefore, an L12 orthogonal array is suited for this Taguchi design which contains 12 experiments. The experiments of the Taguchi design obtained from the levels of control factors of Table 1 are shown in Table 2. For instance, the first experiment was performed with a single-pass solar collector, a mass flow rate of 0.011 kg/s, and a normal Plexiglas cover.
All the experiments were carried out in almost the same environmental conditions. For each experiment, the outcomes ( Δ T and performance) are reported and used as the process responses of the Taguchi design. Then, for each experiment, the following formula was used to calculate the S/N values:
( S N ) S = 10 log 1 n i = 1 n [ y i ( k ) ] 2   for   the   smaller   the   better   process   responses ,
( S N ) L = 10 log 1 n i = 1 n 1 [ y i ( k ) ] 2   for   the   larger   the   better   process   responses ,
where n is the number of replications in each experiment and y i ( k ) is the value of process response k at replication i. In the Taguchi design of the solar air heater, the number of replications in all the experiments was set to be 1. The results of the process response values and related S/N ratios are reported in Table 3.
Then, the marginal average of S/N ratios of each level of the control factors for each process response value was calculated and is shown in Table 4.
In Section 4, the results presented in Table 3 and Table 4 are utilized to design the solar air heater using the best level of control parameters.
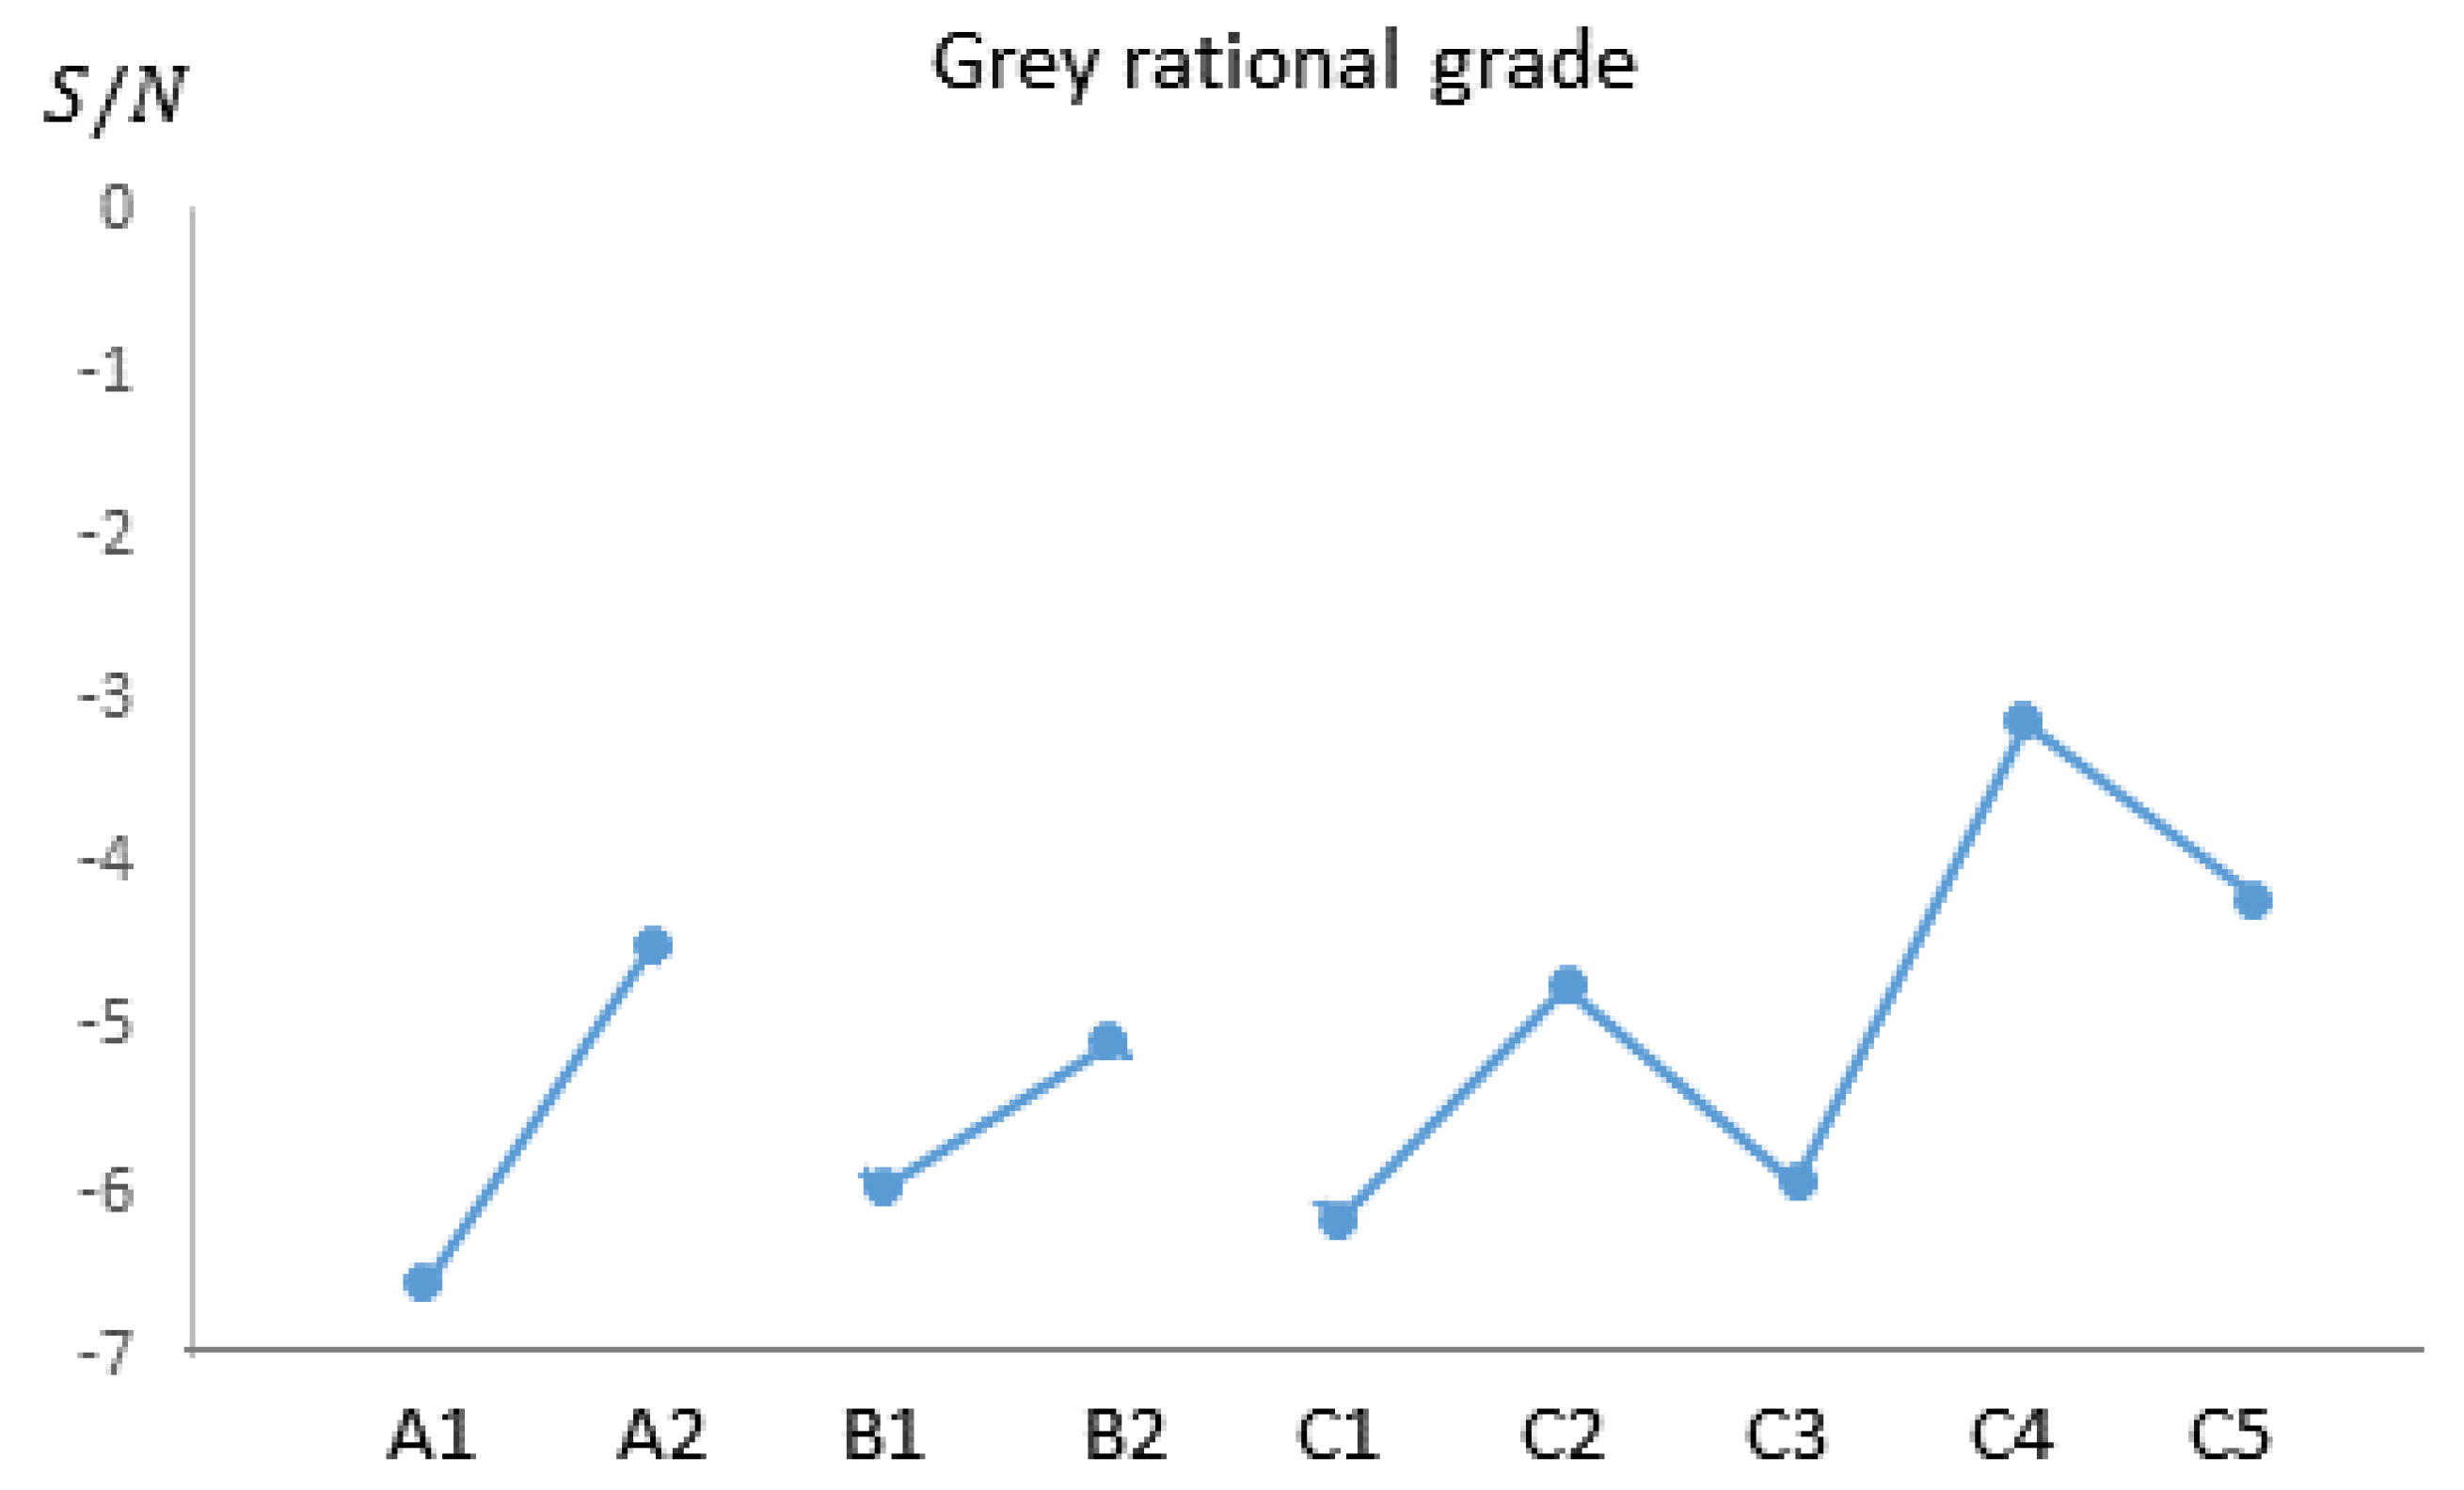
As in the design of the solar air heater, more than one process response (e.g., Δ T and performance) is to be maximized. Grey Rational Analysis (GRA) can provide good results in finding the most important levels of the control factors. GRA combines the observations of the process responses obtained by the experiments to a single value named grey rational grade. Then, the experiment having the highest grey rational grade introduces the best levels of the control factors.
Here, the GRA was hybridized by the Taguchi method to obtain a more economic experimental design compared with classic GRA. To reduce the number of experiments in GRA, the orthogonal array used for the Taguchi design was used. Based on the selected experiments obtained by the orthogonal array, the grey rational grades were computed. Then, the grey rational grades were converted to a S/N ratio for the comparison of the experiments. The process of the Grey–Taguchi method is explained in the following steps.
Step 1: The value of each process response is normalized by the following equations:
x i ( k ) = max i { y i ( k ) } y i ( k ) max i { y i ( k ) } min i { y i ( k ) } i , k | k   { the   smaller ,   the   better   the   process   responses } ,
x i ( k ) = y i ( k ) min i { y i ( k ) } max i { y i ( k ) } min i { y i ( k ) } i , k | k   { the   larger ,   the   better   the   process   responses } .
Step 2: Grey rational coefficient ( ξ i ( k ) ) of each response factor is calculated by the following formula:
ξ i ( k ) = Δ min + ψ Δ max Δ 0 i ( k ) + ψ Δ max i , k ,
where Δ 0 i ( k ) = | x 0 ( k ) x i ( k ) | (absolute value) and x 0 ( k ) is a reference value which is defined as the best-normalized value of process response k among all its experiments, meaning that x 0 ( k ) = max i { x i ( k ) } . Δ min and Δ max are calculated as min i   min k { Δ 0 i } and max i   max k { Δ 0 i } , respectively. Finally, ψ is a distinguishing coefficient selected from the interval of zero and one. It controls the effect of Δ max when its value is too large. In this study, the value ψ is set to be 0.5.
Step 3: Grey rational grade of each experiment is found by the following formula:
γ i = 1 n k = 1 n ξ i ( k )   i ,
where γ i is the grey rational grade of experiment i.
Step 4: Same as the Taguchi method, for each experiment an S/N ratio is calculated from its grey rational grade using Equation (3). Consequently, the average of S/N ratios of each level of the control factors from the S/N ratios of the grey rational grades is computed. All the results obtained from Steps 1 to 4 for the Grey–Taguchi design of the solar air heater are summarized in Table 5. Table 6 shows a marginal average of S/N ratios for different levels of each control factor. Analysis of the results and selection of the best level of each control factor are discussed in Section 4.

4. Analysis of Results and Discussion

The results obtained in Section 3 were analyzed from two points of view. First, the level of each factor that positively affects the process responses was determined. Along with this decision, the most effective factor or, more precisely, the order of the factors from an effective point of view was introduced. This analysis was done to design the solar air heater when the following criteria (process responses) were to be maximized:
  • Δ T ;
  • Performance;
  • Grey rational grade, which is a combination of performance and Δ T .
To do this, the most effective factor and the best level of each factor were found from the obtained results from the experiments.

4.1. Identifying the Most Effective Factor

In order to find the most effective factor in the design of the solar air heater, the S/N ratios reported in Table 4 and Table 6 were used. These S/N ratios can be analyzed in two ways to determine the most effective factor.
In the first way, the difference between the maximum and minimum marginal means of the levels of each factor is calculated. This value was calculated for each factor in Table 4 and Table 6 for Δ T , performance, and grey rational grade, separately. The highest Max Min value in the tables for each criterion shows the most effective factor in the design of the solar air heater when that criterion is considered. Therefore, the following results are concluded:
  • When the solar air heater is designed based on the Δ T criterion, the most effective factor is factor B, which is the mass flow rate;
  • When the solar air heater is designed based on the performance criterion, the most effective factor is again factor B, which is the mass flow rate;
  • When the solar air heater is designed based on both Δ T and performance criteria, the most effective factor is factor C, which is the cover type.
In the second way, the most effective factor can be identified by the Analysis of Variance (ANOVA) method. ANOVA is done for S/N ratios of Taguchi and Grey–Taguchi designs for each criterion in Table 3 and Table 5, separately. The factor with the highest contribution is selected as the most important factor. The results of the ANOVA are reported in Table 7. Based on the results, when considering each criterion, the most contributing factor is the same as what was obtained by the first method as mentioned earlier.

4.2. Identifying the Best Level of Each Factor

The best level of each factor can be obtained from the marginal S/N ratios of Table 4 and Table 6, which were calculated for Δ T , performance, and grey rational grade, separately. Due to these S/N ratio values, the most effective level of each factor is the level with the largest S/N ratio. These marginal S/N ratios are plotted for all levels of the parameters separately for different criteria in Figure 2, Figure 3 and Figure 4.
To design the solar air heater based on each criterion, the factor level having the largest S/N ratio is selected. Finally, the solar air heater is optimally designed based on Δ T , performance, and grey rational grade, separately, as reported in Table 8.

5. Conclusions

Different configurations of the solar air heater were investigated by the Grey–Taguchi method to find the optimal configuration. The two criteria which were taken into consideration were temperature differences ( Δ T ) and system performance. The three factors that affect these criteria were solar collector type, mass flow rate, and cover types. Any combination of these factors can be effective to increase or decrease the temperature difference and performance of the solar air heater.
The Grey–Taguchi method decreased the number of required combinations to a possible minimum value to make a robust statistical analysis. The experiment was performed with two types of solar collectors which were single-pass and double-pass systems, and at two different mass flow rates (0.011 kg/s and 0.032 kg/s). Four different pierced Plexiglas covers were used in the tests and this has made this experiment unique compared with other similar studies. The obtained results from both theoretical and experimental studies, as the temperature difference is considered, show that the optimal configuration is a double-pass solar collector with a one-fourth pierced Plexiglas cover that has a 60 mm distance between the centers of the holes, and a mass flow rate of 0.011 kg/s. As performance is considered, the optimal configuration is a double-pass solar collector with a one-half pierced Plexiglas cover that has a 60 mm distance between the centers of the holes, and a mass flow rate of 0.032 kg/s. Finally, when both factors are considered, the optimal configuration suggested by the method is a double-pass solar collector with a one-quarter pierced Plexiglas cover that has a 30 mm distance between the centers of the holes, and a mass flow rate of 0.032 kg/s.

Author Contributions

Conceptualization, R.N., N.M. and K.P.; methodology, R.N.; software, N.M.; validation, R.N. and K.P.; formal analysis, N.M.; investigation, K.P.; resources, R.N.; data curation, R.N.; writing—original draft preparation, R.N., N.M. and K.P.; writing—review and editing, R.N., N.M. and K.P. All authors have read and approved the manuscript for publication.

Funding

This research received no external funding.

Conflicts of Interest

The authors declare no conflict of interest.

References

  1. Bhagoria, J.; Saini, J.; Solanki, S. Heat transfer coefficient and friction factor correlations for rectangular solar air heater duct having transverse wedge shaped rib roughness on the absorber plate. Renew. Energy 2002, 25, 341–369. [Google Scholar] [CrossRef]
  2. Nowzari, R.; Mirzaei, N.; Aldabbagh, L. Finding the best configuration for a solar air heater by design and analysis of experiment. Energy Convers. Manag. 2015, 100, 131–137. [Google Scholar] [CrossRef]
  3. Diao, Y.; Kato, S.; Hiyama, K. Development of an optimal design aid system based on building information modeling. Build. Simul. 2011, 4, 315–320. [Google Scholar] [CrossRef]
  4. Fontanella, G.; Basciotti, D.; Dubisch, F.; Judex, F.; Preisler, A.; Hettfleisch, C.; Vukovic, V.; Selke, T. Calibration and validation of a solar thermal system model in Modelica. Build. Simul. 2012, 5, 293–300. [Google Scholar] [CrossRef]
  5. Jairaj, K.; Singh, S.P.; Srikant, K. A review of solar dryers developed for grape drying. Sol. Energy 2009, 83, 1698–1712. [Google Scholar] [CrossRef]
  6. Siddhartha, V. Thermal performance optimization of a flat plate solar air heater using genetic algorithm. Appl. Energy 2010, 87, 1793–1799. [Google Scholar]
  7. Ho, C.-D.; Hsiao, C.-F.; Chang, H.; Tien, Y.-E.; Hong, Z.-S. Efficiency of Recycling Double-Pass V-Corrugated Solar Air Collectors. Energies 2017, 10, 875. [Google Scholar]
  8. Zheng, W.; Zhang, H.; You, S.; Fu, Y. Experimental Investigation of the Transpired Solar Air Collectors and Metal Corrugated Packing Solar Air Collectors. Energies 2017, 10, 302. [Google Scholar] [CrossRef] [Green Version]
  9. Yeh, H.-M.; Ho, C.-D. Collector Efficiency in Downward-Type Double-Pass Solar Air Heaters with Attached Fins and Operated by External Recycle. Energies 2012, 5, 2692–2707. [Google Scholar] [CrossRef]
  10. Lin, W.; Gao, W.; Liu, T. A parametric study on the thermal performance of cross-corrugated solar air collectors. Appl. Therm. Eng. 2006, 26, 1043–1053. [Google Scholar] [CrossRef]
  11. Yang, M.; Yang, X.; Li, X.; Wang, Z.; Wang, P. Design and optimization of a solar air heater with offset strip fin absorber plate. Appl. Energy 2014, 113, 1349–1362. [Google Scholar] [CrossRef]
  12. El-Khawajah, M.; Aldabbagh, L.; Egelioglu, F. The effect of using transverse fins on a double pass flow solar air heater using wire mesh as an absorber. Sol. Energy 2011, 85, 1479–1487. [Google Scholar] [CrossRef]
  13. Gholap, A.; Khan, J. Design and multi-objective optimization of heat exchangers for refrigerators. Appl. Energy 2007, 84, 1226–1239. [Google Scholar] [CrossRef]
  14. Hedayatizadeh, M.; Sarhaddi, F.; Safavinejad, A.; Ranjbar, F.; Chaji, H. Energy loss-based efficiency optimization of a double-pass/glazed v-corrugated plate solar air heater. Energy 2016, 94, 799–810. [Google Scholar] [CrossRef]
  15. Nowzari, R.; Aldabbagh, L.B.Y. Experimental study on a solar air heater with various perforated covers. Sadhana 2017, 42, 1585–1593. [Google Scholar] [CrossRef] [Green Version]
  16. Nowzari, R.; Aldabbagh, L.; Egelioglu, F. Single and double pass solar air heaters with partially perforated cover and packed mesh. Energy 2014, 73, 694–702. [Google Scholar] [CrossRef]
  17. Taguchi, G. Quality engineering in japan. Commun. Stat. Theory Methods 1985, 14, 2785–2801. [Google Scholar] [CrossRef]
  18. Taguchi, G.; Elsayed, E.A.; Hsiang, T. Quality Engineering in Production Systems; McGraw-Hill: New York, NY, USA, 1989. [Google Scholar]
  19. Abbasi, M.; Ghafarinazari, A.; Reddy, S.; Fard, M. A new approach for optimizing automotive crashworthiness: Concurrent usage of ANFIS and Taguchi method. Struct. Multidiscip. Optim. 2013, 49, 485–499. [Google Scholar] [CrossRef]
  20. Tanyildizi, H.; Şahin, M. Taguchi optimization approach for the polypropylene fiber reinforced concrete strengthening with polymer after high temperature. Struct. Multidiscip. Optim. 2016, 55, 529–534. [Google Scholar] [CrossRef]
  21. Mahmoodi-Rad, A.; Molla-Alizadeh-Zavardehi, S.; Dehghan, R.; Sanei, M.; Niroomand, S. Genetic and differential evolution algorithms for the allocation of customers to potential distribution centers in a fuzzy environment. Int. J. Adv. Manuf. Technol. 2013, 70, 1939–1954. [Google Scholar] [CrossRef]
  22. Niroomand, S.; Hadi-Vencheh, A.; Şahin, R.; Vizvari, B. Modified migrating birds optimization algorithm for closed loop layout with exact distances in flexible manufacturing systems. Expert Syst. Appl. 2015, 42, 6586–6597. [Google Scholar] [CrossRef]
  23. Niroomand, S.; Hadi-Vencheh, A.; Mirzaei, N.; Molla-Alizadeh-Zavardehi, S. Hybrid greedy algorithms for fuzzy tardiness/earliness minimization in a special single machine scheduling problem: Case study and generalization. Int. J. Comput. Integ. Manuf. 2016, 29, 870–888. [Google Scholar] [CrossRef]
Figure 1. (i) Schematic view of the novel solar air heater, (ii) side view of the collector, (iii) one-fourth pierced Plexiglas cover, (iv) one-half pierced Plexiglas cover, (v) pictorial view of the experimental setup.
Processes 08 00317 g001
Figure 2. The graph of marginal S/N ratio for all levels of the factors when the Δ T criterion is considered.
Processes 08 00317 g002
Figure 3. The graph of marginal S/N ratio for all levels of the factors when the performance criterion is considered.
Processes 08 00317 g003
Figure 4. The graph of marginal S/N ratio for all levels of the factors when both Δ T and performance (grey rational grade) criteria are considered.
Processes 08 00317 g004
Table 1. The levels of control factors considered in the design of the solar air heater.
Control FactorNumber of LevelsLevels
Solar collector (A)2Single-pass (A1)
Double-pass (A2)
Mass flow rate (B)20.011 kg/s (B1)
0.032 kg/s (B2)
Cover type (C)5Normal Plexiglas (C1)
One-fourth pierced Plexiglas with 60 mm distance between the holes (C2)
One-half pierced Plexiglas with 60 mm distance between the holes (C3)
One-fourth pierced Plexiglas with 30 mm distance between the holes (C4)
One-half pierced Plexiglas with 30 mm distance between the holes (C5)
Table 2. The experiments and their combination of control factors in the L12 orthogonal array.
ExperimentFactor Level
ABC
1A1B1C1
2A1B1C2
3A1B1C3
4A1B2C4
5A1B2C5
6A1B2C3
7A2B1C4
8A2B1C5
9A2B1C2
10A2B2C1
11A2B2C2
12A2B2C3
Table 3. The process response and signal-to-noise (S/N) values for the Taguchi design of the solar air heater.
ExperimentFactor Level Δ T Performance
ABCResponse ValueS/NResponse ValueS/N
1A1B1C135.1030.90623.45727.405
2A1B1C242.9032.64930.99029.824
3A1B1C335.4030.98026.00828.302
4A1B2C422.6527.10145.66533.191
5A1B2C520.7526.34048.03933.631
6A1B2C322.3026.96650.09033.995
7A2B1C452.3034.37035.25130.943
8A2B1C539.2531.87631.39929.938
9A2B1C245.7033.19831.83330.057
10A2B2C124.1527.65853.32334.538
11A2B2C226.8528.57856.62035.059
12A2B2C323.1027.27252.65934.429
Table 4. Average of the S/N ratios of each level of the control factors for each process response.
Process ResponseControl FactorFactor Level Max Min
12345
Δ T A29.15730.492 1.335
B32.33027.3195.011
C29.28231.47528.40630.73529.1083.069
PerformanceA31.05832.494 1.436
B29.41134.1404.729
C30.97131.64732.24232.06731.7851.271
Table 5. The grey rational grades for the solar air heater design.
Exp.Factor Level Δ T Performance γ i S/N
ABC y i ( k ) x i ( k ) Δ 0 i ( k ) ξ i ( k ) y i ( k ) x i ( k ) Δ 0 i ( k ) ξ i ( k )
1A1B1C135.100.4540.5450.47823.457010.3330.405−7.832
2A1B1C242.900.7020.2970.62630.9900.2270.7720.3920.509−5.853
3A1B1C335.400.4640.5350.48226.0080.0760.9230.3510.417−7.595
4A1B2C422.650.0600.9390.34745.6650.6690.3300.6020.474−6.471
5A1B2C520.75010.33348.0390.7410.2580.6580.496−6.087
6A1B2C322.300.0490.9500.34450.0900.8030.1960.7170.531−5.497
7A2B1C452.3010135.2510.3550.6440.4360.718−2.871
8A2B1C539.250.5860.4130.54731.3990.2390.7600.3960.471−6.521
9A2B1C245.700.7900.2090.70531.8330.2520.7470.4000.552−5.146
10A2B2C124.150.1070.8920.35953.3230.9000.0990.8340.596−4.485
11A2B2C226.850.1930.8060.38256.6201010.691−3.206
12A2B2C323.100.0740.9250.35052.6590.8800.1190.8070.578−4.746
Table 6. Average of the S/N ratios of each level of the control factors for the grey rational grades.
Process ResponseControl FactorFactor Level Max Min
12345
Grey rational gradeA−6.556−4.496 2.06
B−5.970−5.082 0.888
C−6.159−4.735−5.946−3.114−4.2033.045
Table 7. The results of ANOVA conducted on S/N ratios of Table 3 and Table 5.
Δ T :
FactorDegree of FreedomSum of SquareVarianceContribution ( P % )
A10.1830.1830.763135947
B118.63618.63677.7147623
C45.1611.2902521.52210175
Total623.98 100
Performance:
FactorDegree of FreedomSum of SquareVarianceContribution ( P % )
A10.1110.1110.360541787
B128.59628.59692.88335986
C42.0800.526.756098353
Total630.787 100
Grey Rational Grade:
FactorDegree of FreedomSum of SquareVarianceContribution ( P % )
A10.5310.5315.203841631
B14.0764.07639.94511956
C45.5971.3992554.85103881
Total610.204 100
Table 8. Optimal design of the solar air heater considering different criteria.
CriterionOptimal DesignDescription
When Δ T is considered.A2In the optimal design, double-pass solar collector is used.
B1In the optimal design, 0.011 kg/s mass flow rate is used.
C2One-fourth pierced Plexiglas with a 60 mm distance between the holes.
When performance is considered.A2In the optimal design, double-pass solar collector is used.
B2In the optimal design, 0.032 kg/s mass flow rate is used.
C3One-half pierced Plexiglas with a 60 mm distance between the holes.
When both Δ T and performance (grey rational grade) are considered.A2In the optimal design, double-pass solar collector is used.
B2In the optimal design, 0.032 mass flow rate is used.
C4One-fourth pierced Plexiglas with a 30 mm distance between the holes.

