1. Introduction
The use of a cool air blanket to shield a solid surface from high temperature gases is considered an effective way to protect the solid surface from a harsh environment. Such a technique is considered a very common and an effective thermal management technique that is used in gas turbine engines to guard the high pressure turbine blades from the hot combusted gases. Current gas turbine engines operate at elevated temperatures that exceed 1200 °C [
1,
2]. These high temperatures cause hot spot formation and increased wall thermal stresses on turbine’s blade, which reduce the turbine blade life. To assure realistic turbine blade life, the variation on the blade wall temperature must be limited [
3]. Remarkable work has been done in the field of material science and cooling techniques to increase the turbine maximum allowed inlet gas temperature while achieving realistic durability goals. Since the introduction of aircraft gas turbine in 1941, the average rate of increasing the maximum allowable inlet temperature using cooling techniques is around 20 degree per year which is more than double the rate achieved by material scientist [
4]. Most of today’s advanced gas turbines utilize cooling techniques in their gas turbine blades. Cooling techniques are classified into internal cooling methods such as internal jet impingement [
5,
6,
7,
8,
9], and external methods such as transpiration cooling [
10,
11] and film cooling [
12,
13,
14]. Film cooling protects the blade by forming air blankets, which reduces the heat transfer between the hot mainstream gas and the turbine blade wall. This allows a higher mainstream gas temperature to enter the turbine without negatively affecting the turbine durability [
13].
The cool air blanket is mainly used to cut convective heat transfer to the blade surface. The effectiveness of the air blanket mainly depends on three main parameters, which are flow blowing ratio, jet angle and density ratio. These parameters are interrelated and they affect the film cooling in divergent ways. Different studies have investigated the effect of these parameters on film cooling, but limited studies are available on how these parameters are interrelated. Radial basis function neural network and genetic algorithms has been implemented to optimize a fan-shaped hole to improve film cooling performance [
15]. The current study is implementing the RSM to optimize a confined jet flow that forms a cool air blanket film over a flat plate.
Blowing ratio represents the ratio of velocity and density of coolant flow to mainstream flow. A numerical study by Nijo et al. [
16], showed that as the blowing ratio increases to
, the adiabatic film cooling effectiveness (AFCE) improves. However, operating at blowing ratios above
reduces the AFCE directly after the hole and later increases the AFCE at a distance greater than
. This effect is due to the detachment of coolant film from the wall that causes wakes and vortices formation within the film cooling boundary layer [
17]. Plesniak and Cusano [
18] presented a flow regime map to describe the relation between the blowing ratio, injection angle and the development length of the film cooling. They showed that for any injection angle, increasing the blowing ratio will always increase the jet penetration to the mainstream flow. This changes the behavior of the coolant jet from a wall attached jet to a free jet, which reduces AFCE significantly [
17]. The same conclusion has been found in the experimental work of Yuen and Martinez-Botas [
19], where they have studied a wide range of both injection angles and blowing ratios at a low turbulence intensity (1.7%). They reported that for every injection angle there is a specific blowing ratio at which separation of coolant jet occurs. Mayhew et al. [
20] have explored the effect of turbulence intensity on previous studies and found that low turbulence intensity experiments agreed with the previous results. However, at the same blowing ratio, high turbulence intensities (more than 10%) required a higher injection angle to cause detachment of the coolant fluid [
19]. This result has been confirmed independently by the experimental work of Mouzon et al. [
21]. It has been reported that inclined jet (hole) angle influences the effectiveness of cooling uniformity [
22]. The effect of different hole shape has been explored in literature [
23] and it is reported that fan-shaped hole shows improved film cooling effectiveness when compared to a cylindrical hole. To sum up, the main outcome from the previous studies [
15,
16,
17,
18,
19,
20,
21,
22] is that for a specific turbulent intensity value at a specific angle, increasing the blowing ratio increases the film cooling effectiveness (FCE) up to a critical blowing ratio. When this critical value is reached, the coolant jet fails to stay attached to the wall and it will penetrate to the mainstream causing the FCE to fall drastically. On the other hand, increasing the turbulent intensity increases the tendency of the coolant jet to stay attached to the plate wall, which allows the use of a higher blowing ratio. This leads to better shielding of the blade from the hot mainstream which means a higher value of film cooling effectiveness.
Density ratio (
) represents the ratio of density of coolant flow to mainstream flow. The density ratio of the hot gas to the cool gas is a significant parameter that affects the effectiveness of film cooling which has been investigated by different research groups [
24,
25,
26,
27,
28,
29,
30]. The experimental work of Johnson et al. [
29] has shown that at a fixed blowing ratio, increasing the density ratio increases the wall area averaged AFCE in the range of
between 0.97 and 1.53. This is mainly due to the decrease of velocity ratio, which gives the jet relatively lower momentum to escape wall boundary layer. Singh et al. [
30] has numerically studied the effect of
by varying
DR values from 1 to 12. For the investigated range, a critical density ratio has been found. Singh et al. [
30] has reported that increasing the
beyond this critical density ratio value reduces the span-wise area-averaged AFCE. The study [
30] has reported that as the injection angle increases, for a fixed blowing ratio, the critical density ratio decreases. However, as the blowing ratio increases, for a specific injection angle, the critical density ratio increases. In general, gas turbines operational regions are at
values between 1 and 3, blowing ratios less than 3, and an injection angle lower than
[
19,
31,
32]. In this specified region, the overall trend is that as the
increases the averaged AFCE decreases.
The injection angle represents the angle between the cool air inlet velocity vector and the surface tangent vector (the mainstream velocity vector). Multiple geometrical parameters affect the AFCE; namely film injection angle (), hole shape, number of holes, jet delivery channel length and hole to hole spacing. In this study, to narrow these geometric parameters and to properly investigate the effect of other parameters, a two-dimensional single jet has been selected.
Jia et al. [
33] carried out a very extensive experimental and numerical work for angles ranging between
and
degree, and a wide range of blowing ratio ranging between 0.5 and 9. They concluded that at different values of blowing ratios, an injection angle of
degree achieves the highest FCE. The same conclusion has also been found at low blowing ratios and at different ratio of transverse pitch to injection angle [
23]. Numerical studies on film cooling technique are mostly focused on selecting the best turbulence model to effectively estimate film-cooling performance. Most of the published work employs Reynolds-Averaged Navier-Stokes equations in predicting FCE. Flat-plate configuration is a very efficient approximation to investigate the effect of different flow and geometrical parameters on film cooling performance. A very challenging task is to model film cooling boundary layer which is needed to predict the film cooling efficiency. Ferguson et al. [
34] investigated the standard
and Reynold stress models with standard wall formulation, the non-equilibrium wall modelling with two-layer wall treatment, and the RNG
with standard wall function. They reported that the standard
with the two-layer wall treatment has shown the most accurate approximation of film cooling performance in comparison to the other combinations. Later work by York and Leylek [
35] showed that RNG
with two layers wall treatment has successfully predicated the production of turbulent kinetic energy which leads to a good agreement between experimental and numerical film cooling effectiveness. The RNG
with the two-layer wall treatment has been proven to show a good agreement with experimental data under different conditions and geometries by many researchers [
30,
31,
36].
Finally, at fixed velocity ratio (
) and increasing the mainstream and cool air velocities to achieve higher values of Reynolds number are studied experimentally [
37,
38,
39] and numerically [
30]. It has been found that for all the blowing ratios at different flow configurations, as the Reynolds number increases, the film cooling effectiveness increases. This trend between Reynolds number and FCE is expected since as Reynolds number increases, the film cooling layer will have higher momentum which keep the coolant air attached to the wall.
In this study, a numerical ANSYS-fluent simulation is used to study a confined slot jet configuration using a 2D model. There are four main advantages of using slot shaped jet in analyzing film-cooling effect. First, it reduces number of geometrical parameters and magnifies the impact of the jet angle. Second, it reduces the problem size since 2D mesh requires less computation power. Third, it allows reducing the impact of geometrical parameters on other important parameters such as blowing ratio, density ratio, etc. Finally, it is much easier to experimentally validate such geometry, which explains the availability of such published experimental work. The need for more studies on film cooling rise from the interrelated parameters that affect film cooling [
40,
41]. In this regard, the main objective of this study is to utilize the statistical method to analyze the relation between AFCE and the interrelated parameter (mainly blowing ratio (
), injection angle (
) and density ratio (
)). The statistical method used in this study is known as response surface methodology (RSM) [
42,
43,
44]. A parametric study is also carried out to assess the significance of these parameters. The RSM is implemented on a group of CFD runs to attain an optimal AFCE response.
3. Simulation and Analysis
The performance of film cooling is assessed using film cooling effectiveness (FCE), adiabatic film cooling effectiveness (AFCE) and averaged film cooling effectiveness (AFCE) which are defined as follow,
The parameters affecting FCE can be classified into two main groups; (1) flow parameters and (2) geometrical parameters. The flow parameters are generally reported in terms of blowing ratio (), density ratio () and turbulence intensity (), while geometrical parameters are reported in terms of injection angle (), hole shape, number of holes, jet delivery channel length and hole to hole spacing. All these parameters are interrelated which requires a careful analysis to understand their effects on film cooling which usually reported using the FCE.
Blowing ratio represents the ratio of velocity and density of coolant flow to mainstream flow (). The relatively cool air that is used to form a protective blanket around the flat plate is called the coolant flow while the hot gas running over the flat plate is known as the mainstream flow. The blowing ratio can also be expressed as . The term is known as density ratio and the term is known as velocity ratio. The represents the density ratio between the coolant jet and the mainstream gas, which allows us to study the effect of jet coolant on the mainstream fluid temperatures by means of fixing the blowing ratio and varying the velocity ratio.
In this study, air is assumed as the working fluid for the mainstream and the coolant jet. Air is treated as an incompressible ideal gas; hence density is calculated using the ideal gas equation of state. On the other hand, the specific heat capacity, the thermal conductivity and the dynamic viscosity of the air are considered as function of temperature as reported by Turns [
46].
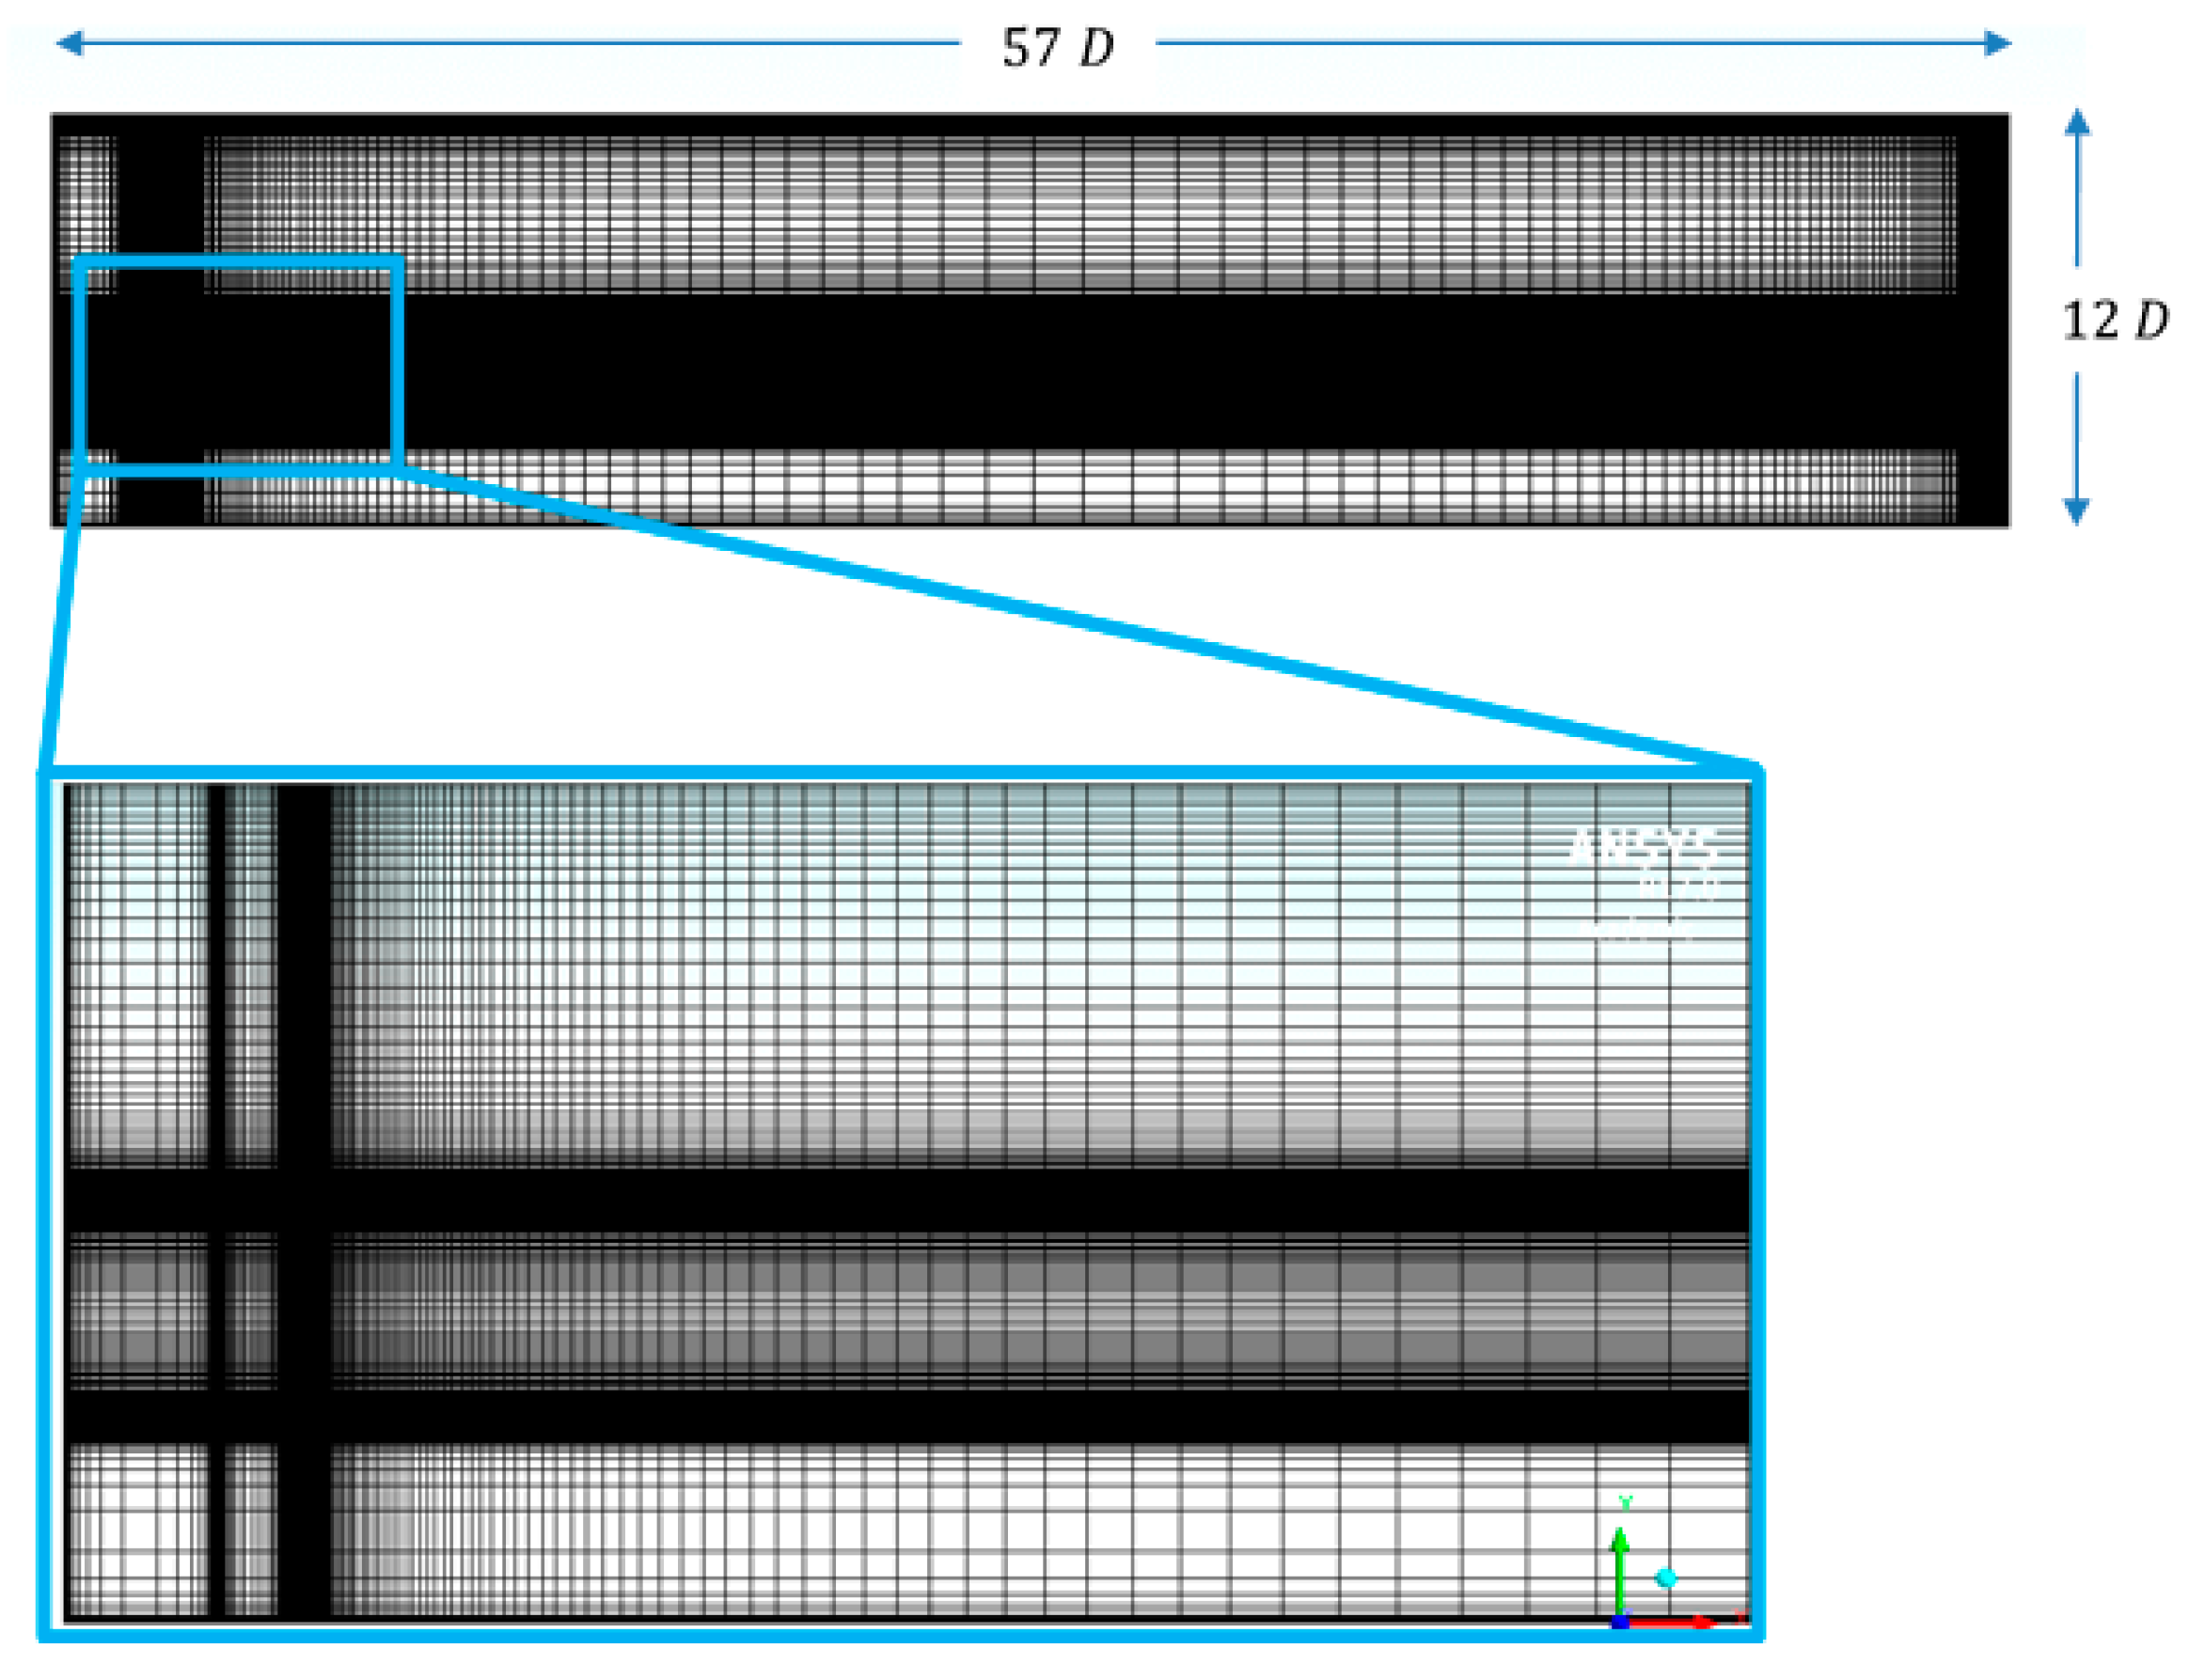
Figure 2 shows a structured non-uniform mesh with a jet angle of 90 degree that has been used in this investigation. To assure
near the wall, a fine gradual boundary layer mesh near the wall with starting cell size of
of jet inlet width has been constructed. Using index notation, the governed equations of the steady state flow are shown below,
where,
,
and
are the mean velocity, temperature and pressure, respectively. The
and
represent the fluctuations in the velocity and temperature. The closure relationships of the turbulent Reynolds stresses
is assumed from the chosen turbulence model.
In this study, the governing equations are discretized using second-order upwind scheme and solved iteratively using the semi-implicit method for pressure linked equations corrected (SIMPLEC). The coupled nonlinear governing equations are solved iteratively, and convergence is realized by setting temperature and velocity residuals to and , respectively.
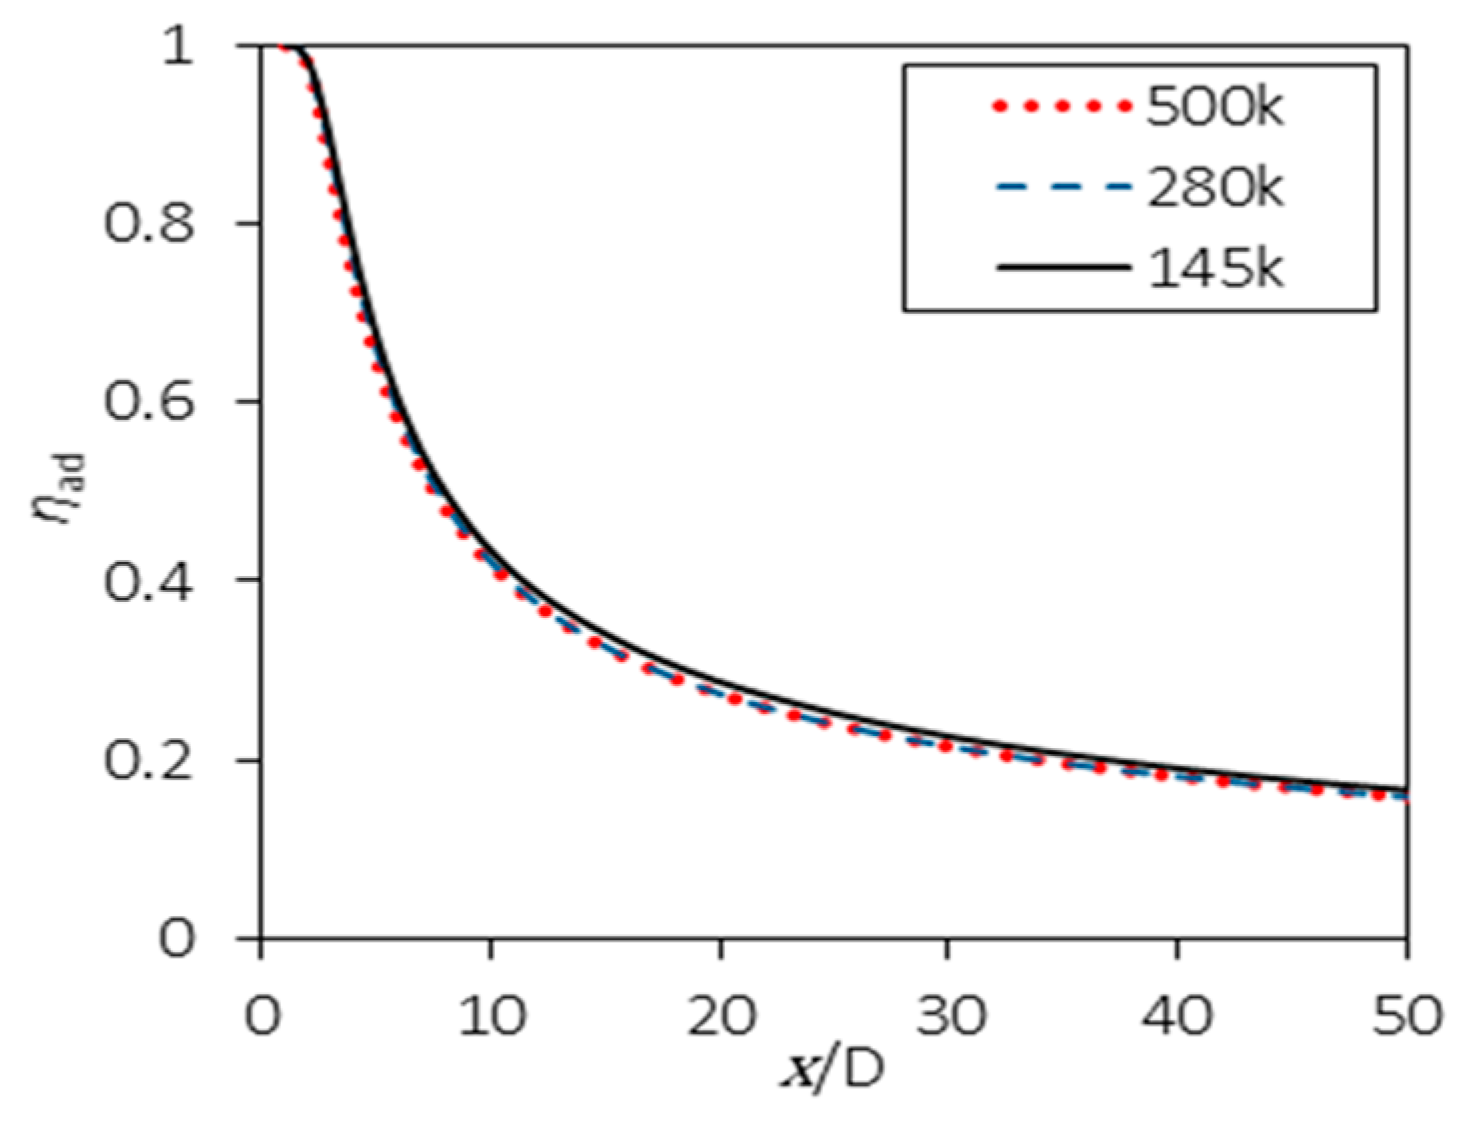
A mesh refinement has been performed via numerical experimentations to assure the grid independence. As shown in
Figure 3, a mesh independence study is carried out by testing three different mesh sizes and monitoring the AFCE value. The mesh independence study has been carried out using RNG
turbulence model with enhanced wall function (EWF) and it redeemed that a mesh with 280,000 nodes is appropriate for this problem.
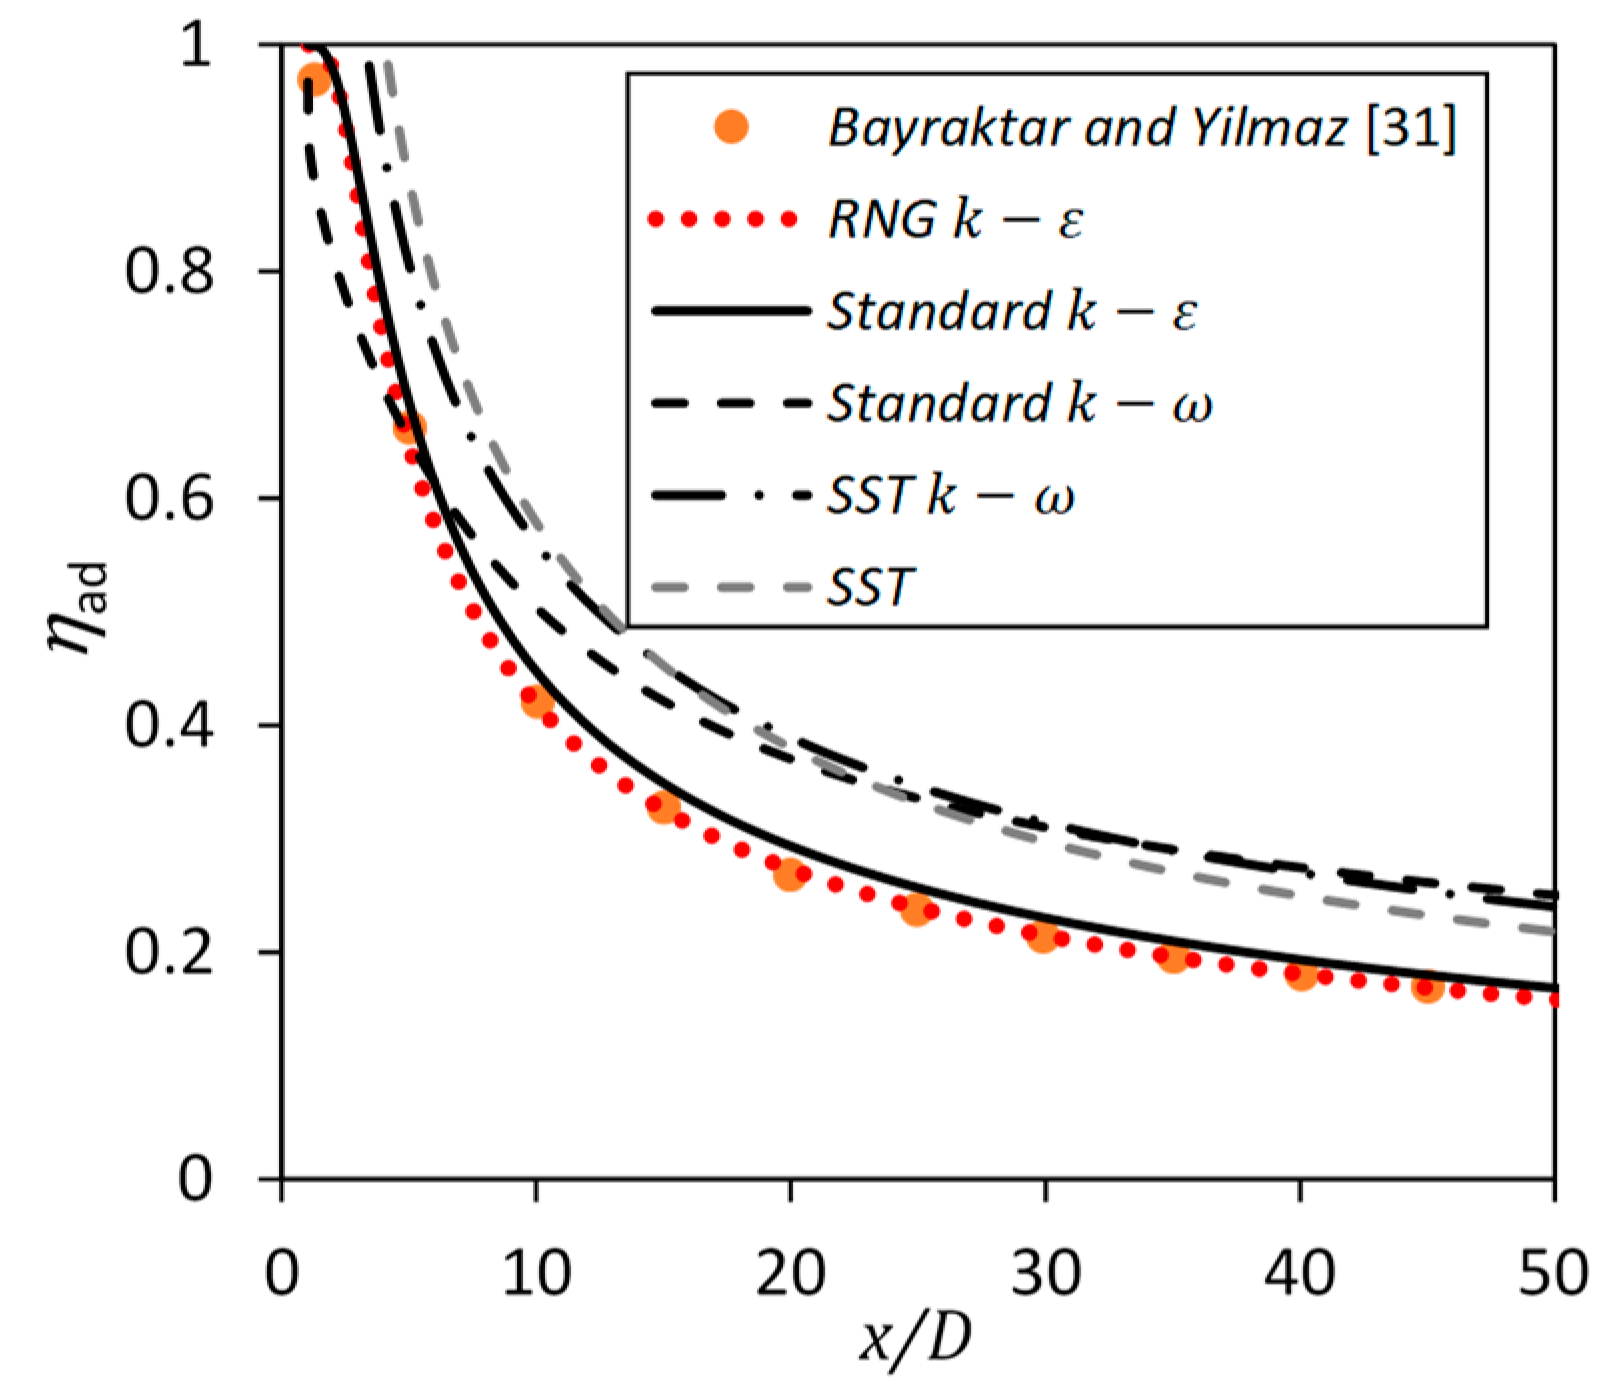
Using the parameters shown in
Table 1 for the validation case, five different turbulence models have been assessed as shown in
Figure 4. Out of the five models, the RNG
model with EWF has shown the best match compared to the published work in [
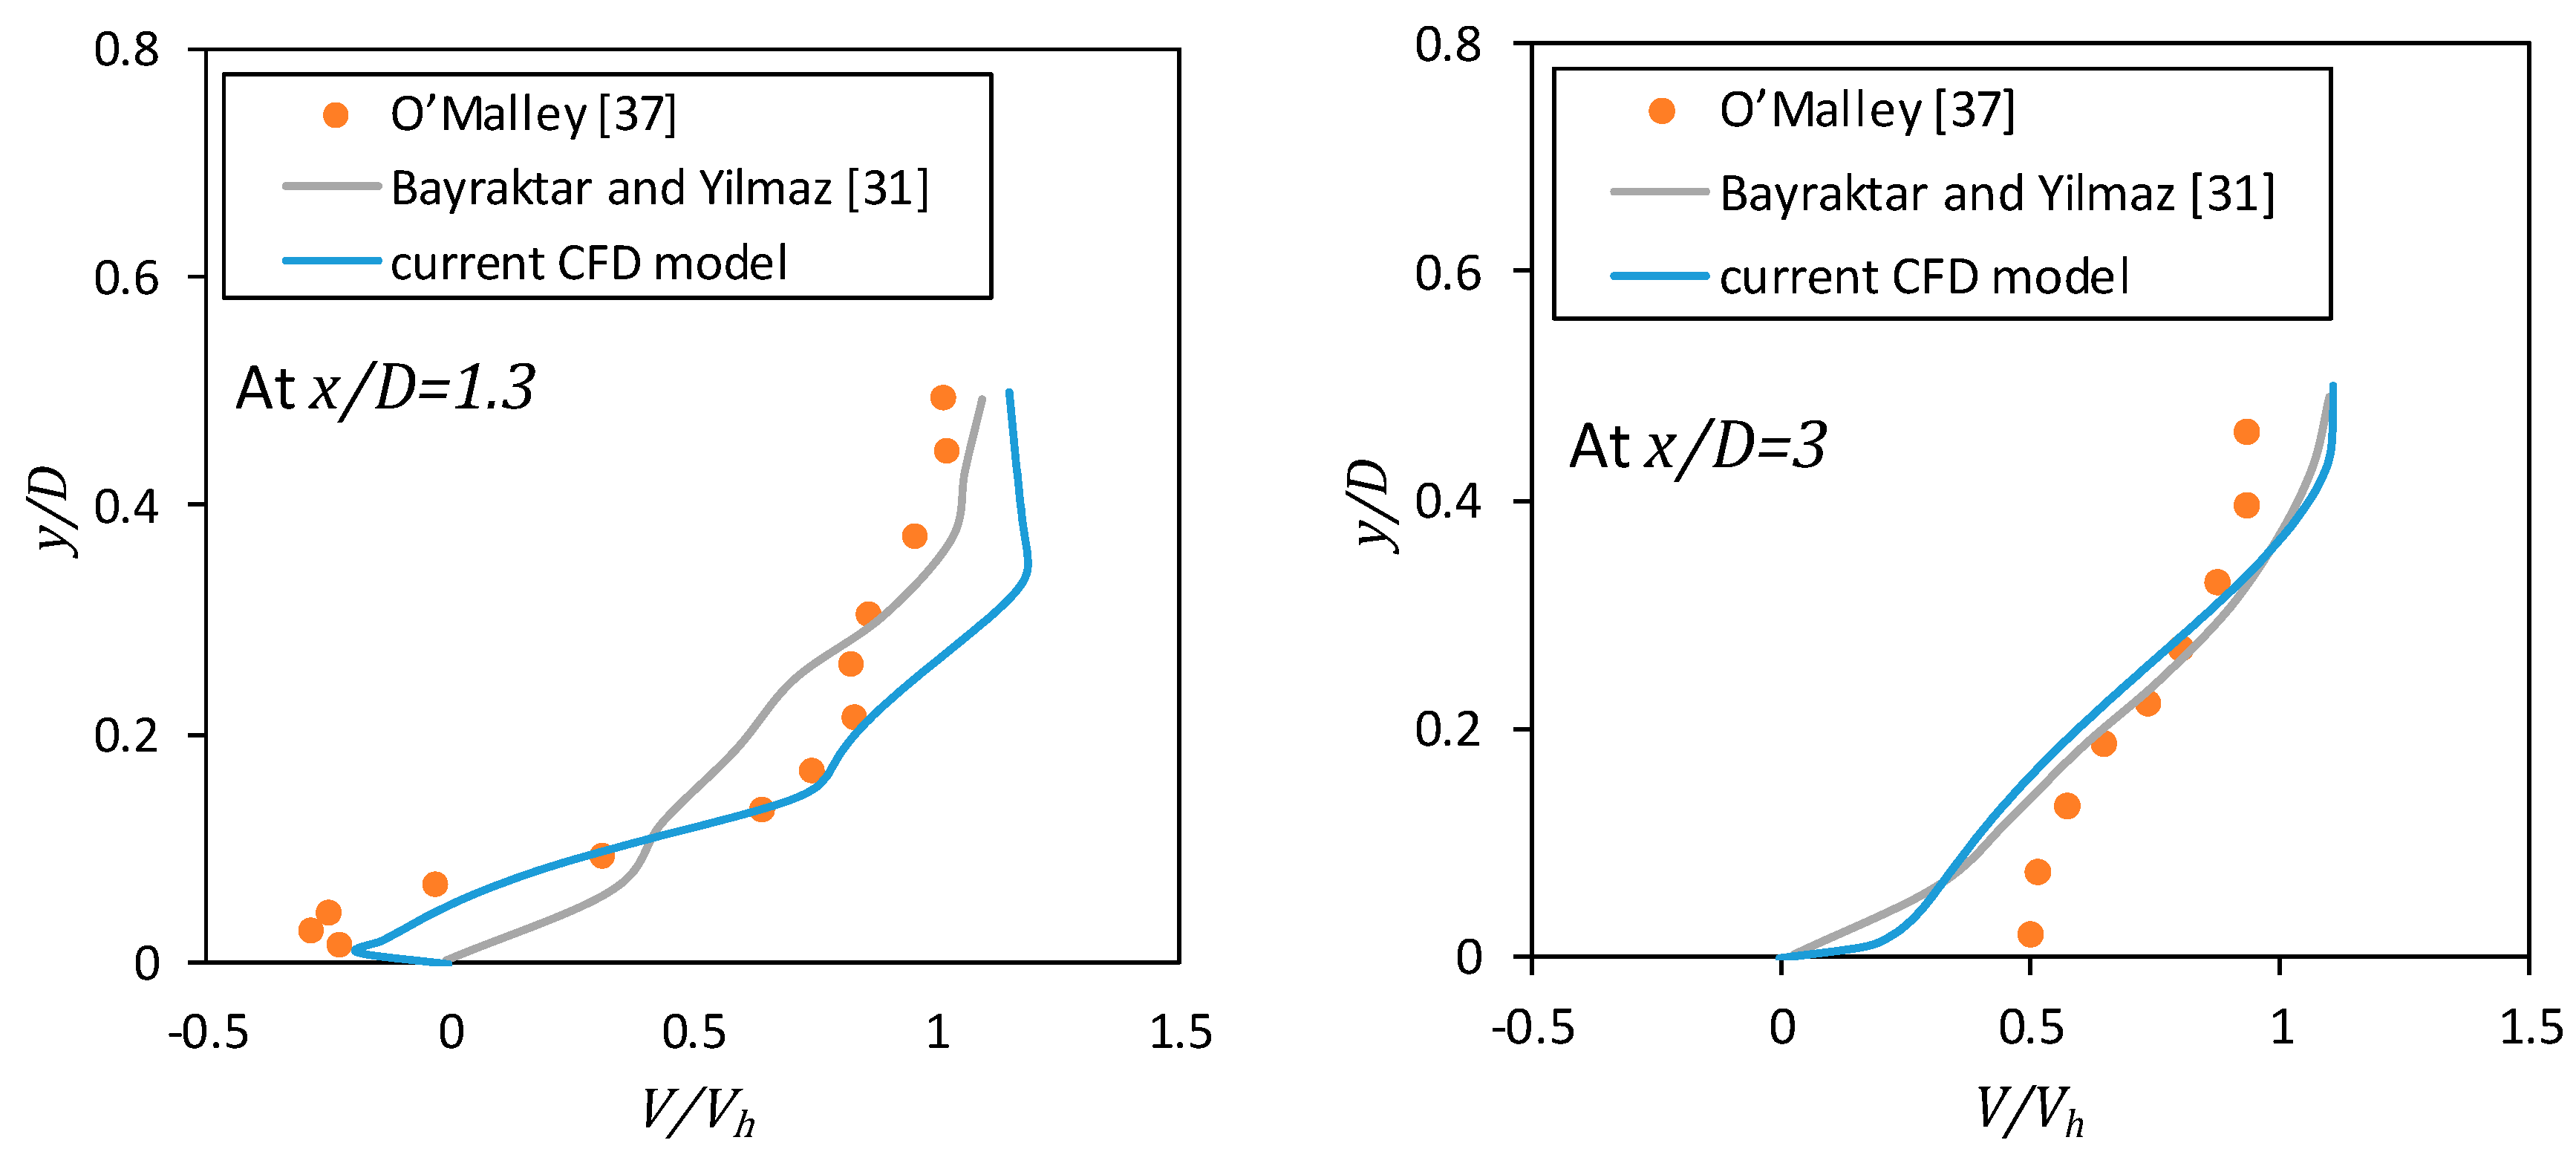
31] with an overall deviation of 1.7% in calculating the AFCE. Under the same conditions, velocity profile is validated with O’Malley [
37] and Bayraktar and Yilmaz [
31] as shown in
Figure 5.
The suitability of the RNG
model with EWF to current problem, mainly when compared to other four models comes from the way turbulence model is resolved using these models. The
model is more suitable when studying free-shear layers and wake region while the standard
model is more suitable in the near wall boundary regions. Since current problem is mainly dominated by the free shear layer, the
model showed best match with the published work. The RNG
model combines a statistical technique called renormalization group (RNG) theory with the
turbulence model. Applying the RNG to the
model produces a modified
equation which improves the prediction of different scales of flow motion. The EWF blends the linear (laminar) and logarithmic (turbulent) laws-of-the-wall using a function suggested by Kader [
47].
4. Results and Discussion
The effect of different interrelated parameters on AFCE is presented in this section. The main three interrelated parameters tested in this study are flow blowing ratio (
), fluid density ratio (
) and film injection angle (α). Combinations of these interrelated parameters have been formed into 54 runs as listed in
Table 2. A wide range of blowing ratio value has been explored ranging from 0.1 to 2. Also, the density ratio has been explored for three different values of 1.2, 2, and 3. Furthermore, the film injection angle (
) is tested for three angles of
,
and
degree.
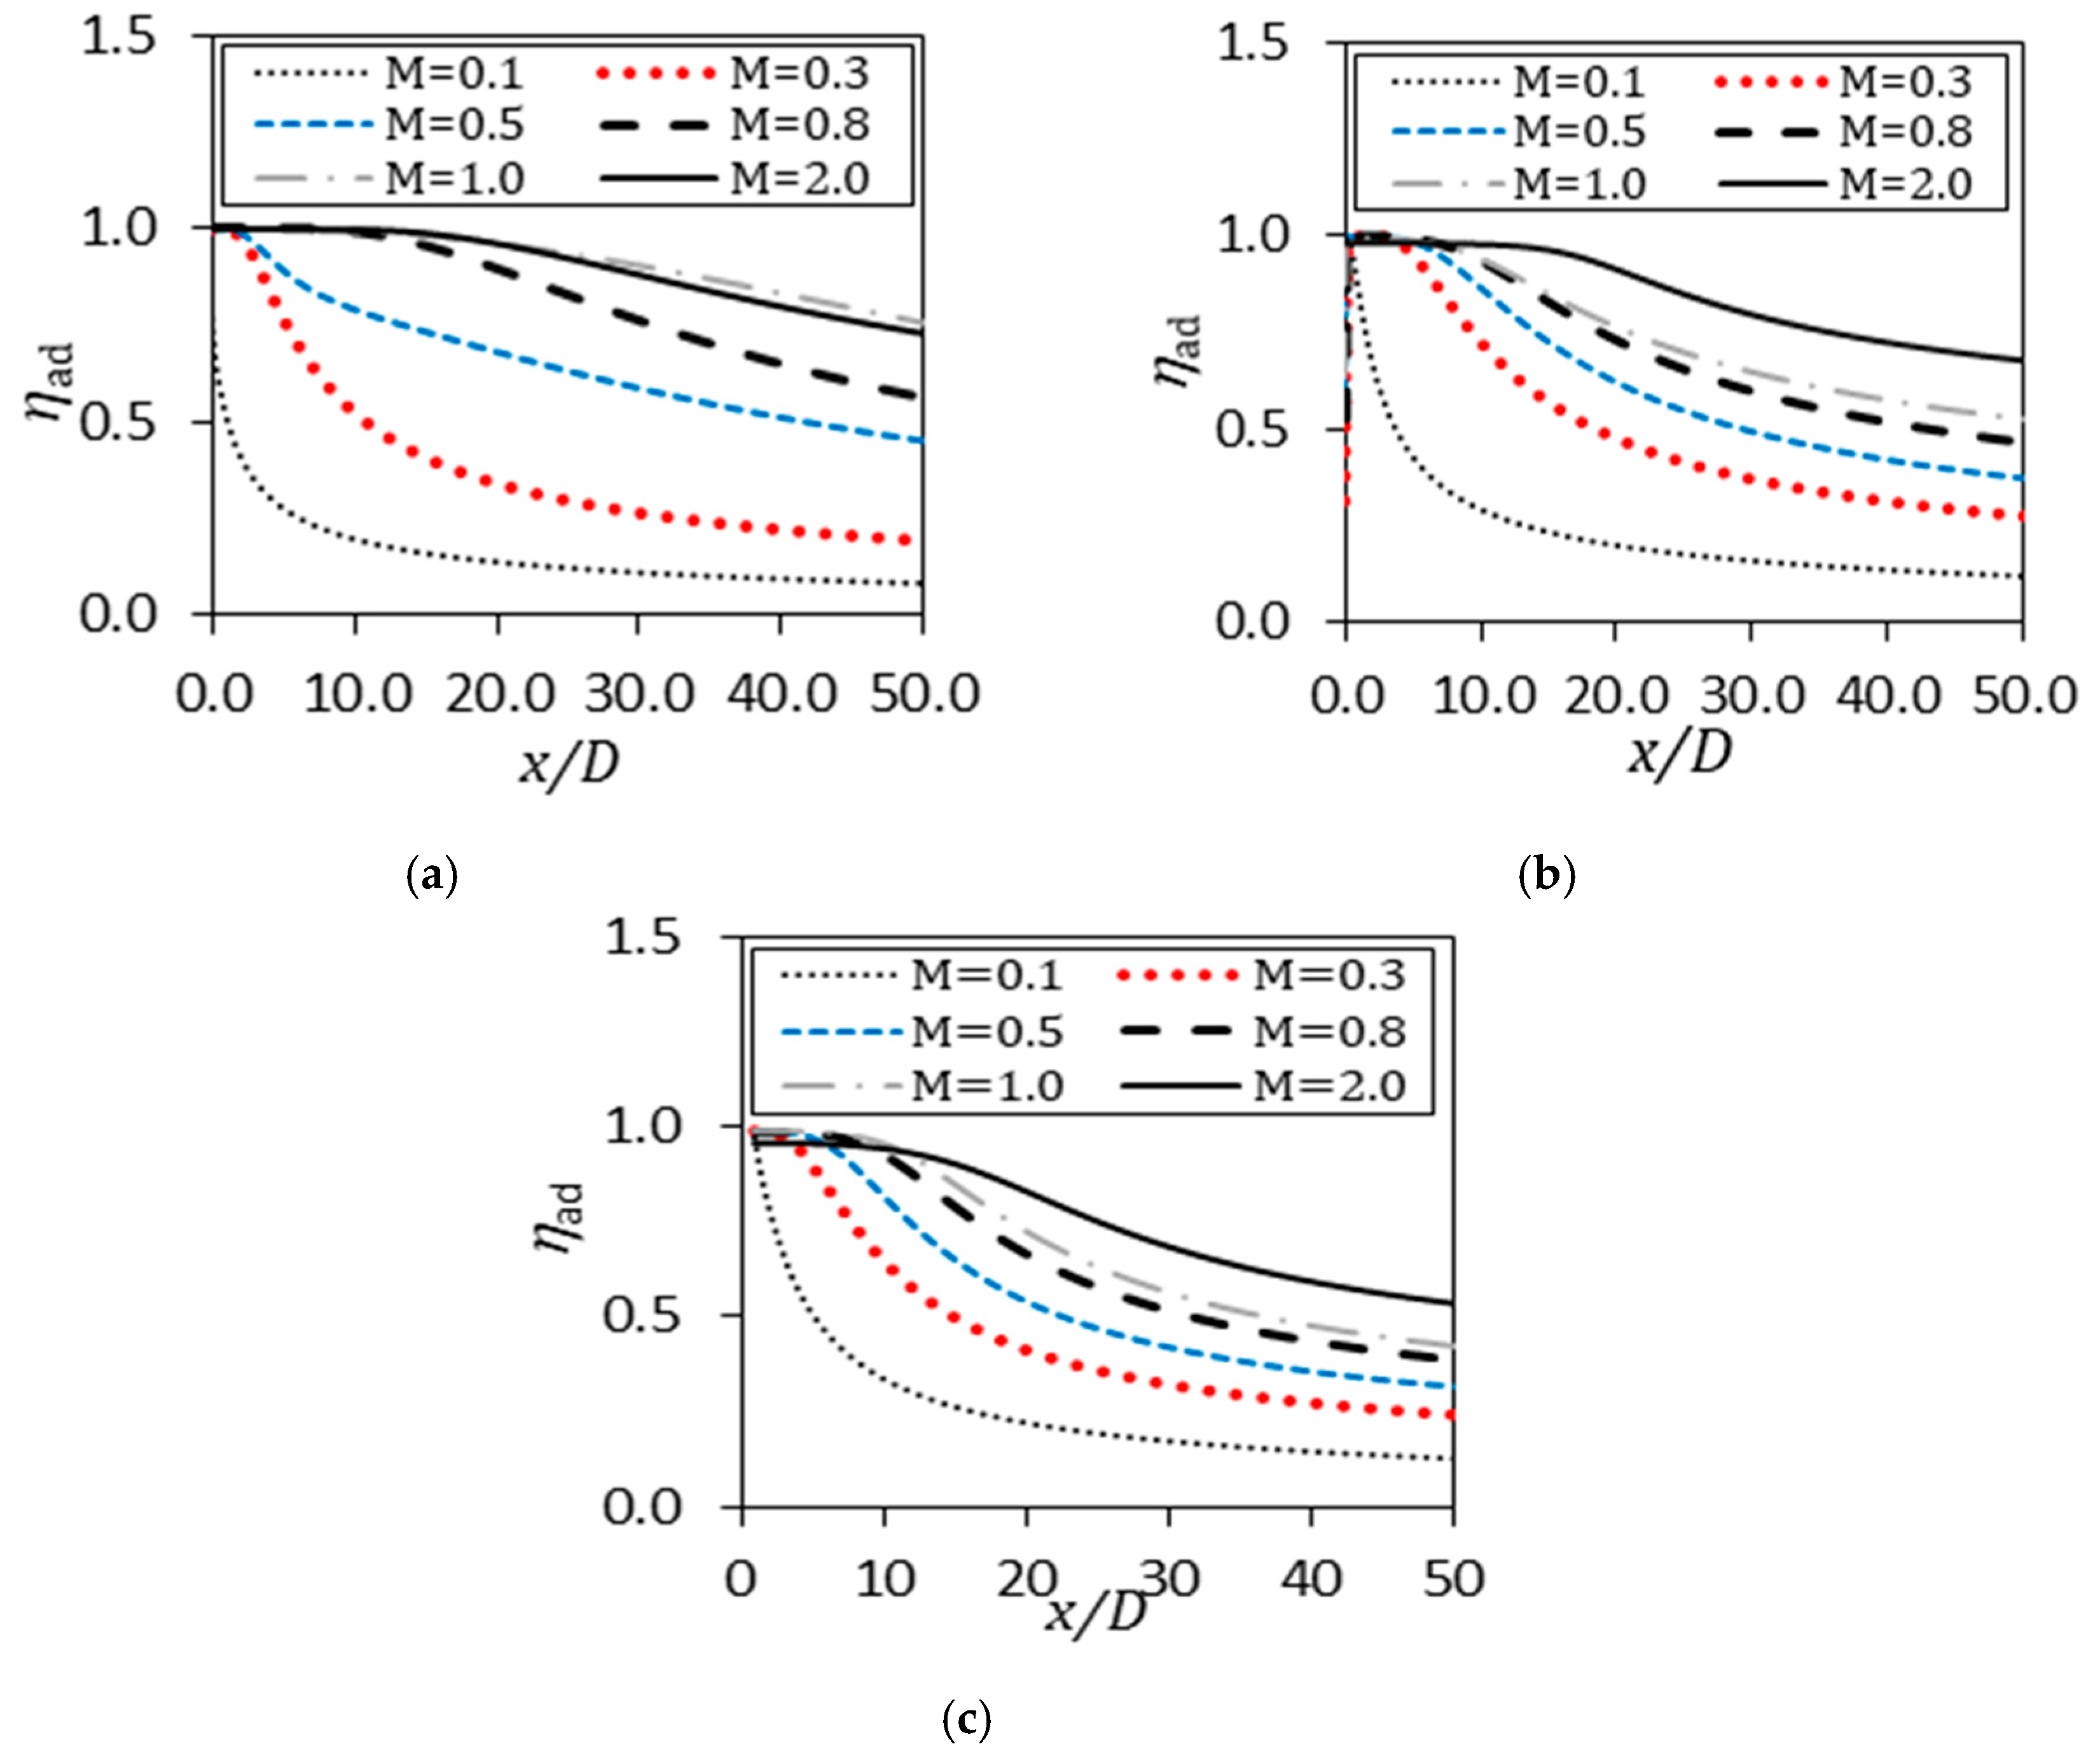
At steady state condition, as hot mainstream moves over a flat plate, the flat wall temperature will approach the mainstream high temperature which is not desired. Hence, cool air is injected from a confined 2D slot to form a cooling film that shields the flat wall from the hot mainstream. However, as fluid marches in the
-direction, cold and hot streams mix together causing the wall temperature to rise which eventually will approach asymptotic value equal to the hot mainstream temperature. Temperature of the cooler film increases due to the heat transfer and mixing of the hot mainstream flow and cool film flow. As wall temperature approaches the mainstream temperature, the adiabatic film cooling effectiveness deteriorates as shown in
Figure 6. The rate of deterioration in AFCE along the
-direction is high at the beginning which starts to decrease as the flow moves in the
-direction. The main reason for such high rate of deterioration in AFCE near the slot is the thin boundary layer formed by the cool fluid, which starts to grow as flow moves in
-direction. Even then, the AFCE still keeps dropping since the heat transfer between the mainstream and flat wall is more pronounced compared to the boundary layer shielding effect. For film cooling with an injection angle of
degree,
Figure 6a shows that the adiabatic film cooling effectiveness has non-monotonic relation with the blowing ratio (
), while a monotonic relation is found with
and
degree injection angles (as shown in
Figure 6b,c, respectively). An increase in the AFCE with higher blowing ratio is expected since more fluid discharges from the film hole and thus, a bigger blanket of cool air is formed between the hot mainstream flow and the flat wall, which provides an enhanced wall shield. However, this trend is not indefinite since as film discharge increases beyond
(for a blowing angel of
degree), the chance of film detachment from the walls increases causing less shielding on the flat wall. The blowing ratio at which the AFCE starts to fall afterwards is identified, in this study, as the critical blowing ratio. For
and
degree, the critical blowing ratio is around
as shown in
Figure 6. From the figure, there is no critical blowing ratio observed for angles
and
degree with
. The effect of film cooling detachment can clearly be seen in
Figure 6c (with a film injection angle of
degree). As shown in the figure, directly after the hole, the local AFCE is lower at the
degree angle in comparison to the
degree case. More details of the injection angle effect are discussed below.
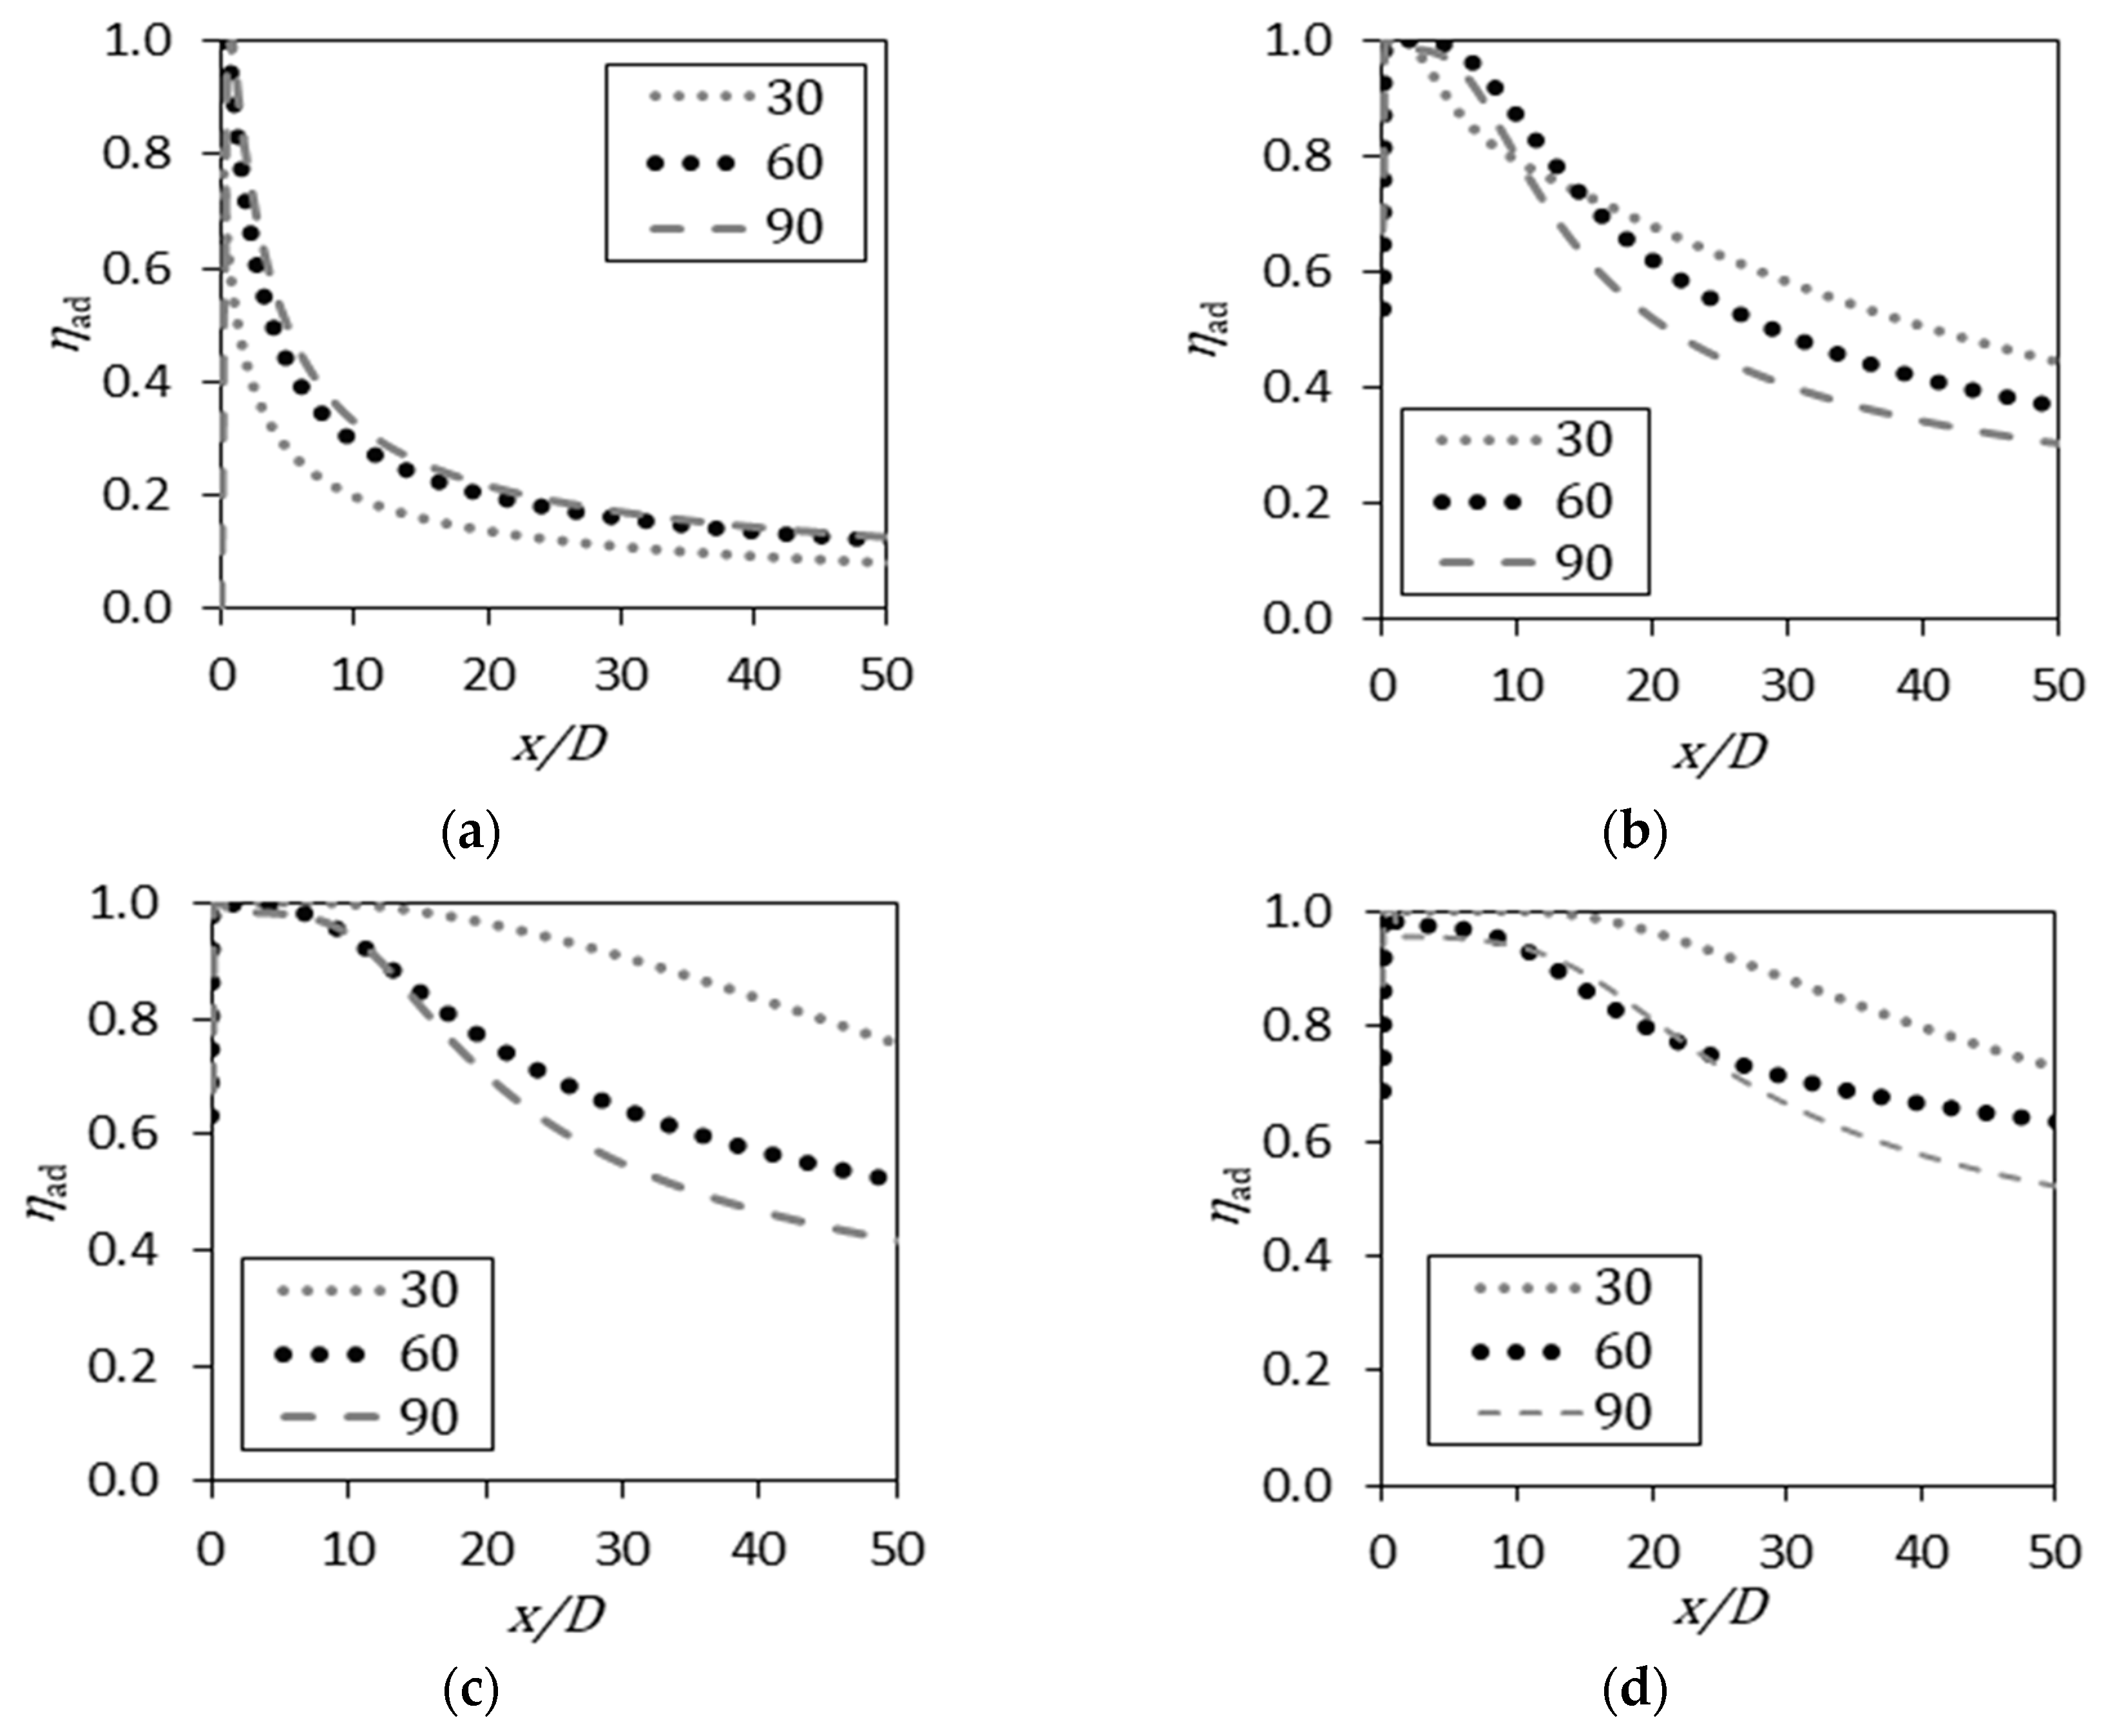
Figure 7a shows that the effect of injection angle is small at a low blowing ratio of
with very similar AFCE trends for all angles. The averaged AFCE is also relatively lower at low blowing ratios, which can be seen in
Figure 7a compared to
Figure 7b–d. A low blowing ratio means less cooling fluid is being injected to the mainstream, which explains the lower wall protection and hence a lower averaged AFCE. At low blowing ratios, the injection angle has a weak effect on the AFCE. A low blowing ratio means the flow has low momentum to affect the mainstream flow field, which reduces the effect of injection angle. However once blowing ratio increases beyond
, the injection angle becomes an important factor that can alter the flow field. The effect of blowing ratio is intricate since it relates quantitatively the effect of flow linear momentum of two streams without counting the effect of direction of these quantities. Linear momentum is a vector parameter and its impact on the flow field is determined by the quantitative value and the flow vector direction. For blowing ratios equal to 0.5 or higher, as shown in
Figure 7b–d, the AFCE increases as the blowing angel decreases. Smaller angles indicate a higher chance of the flow remaining in contact with the flat wall to form a cool blanket and properly shielding the wall from the hot mainstream. However, at low blowing ratio of
, as shown in
Figure 7a, the angle effect becomes less important and in the contrary to the previous relation, as angle decreases the AFCE decreases.
Figure 7a shows that the AFCE is the highest for a blowing angel of
degree. At low blowing ratio, injecting air at
degree allows thicker protection film which provides better shielding and a higher AFCE. In general, for a wide blowing ratio range of
, decreasing the injection angle causes an increase in the AFCE which means film attachment is dominating the wall shielding. On the other hand, at a low blowing ratio of
, higher angles form a thicker cooling film and dictates the heat transfer rate. In conclusion, the injection angle has two conflicting effects on the AFCE. A small injection angle provides a low chance of fluid detachment but a thin blanket of cool fluid. Also, a high blowing angle results in a high chance of detachment but a thicker blanket of cool fluid. Note that, these contradicting effects interrelates to blowing ratio as well.
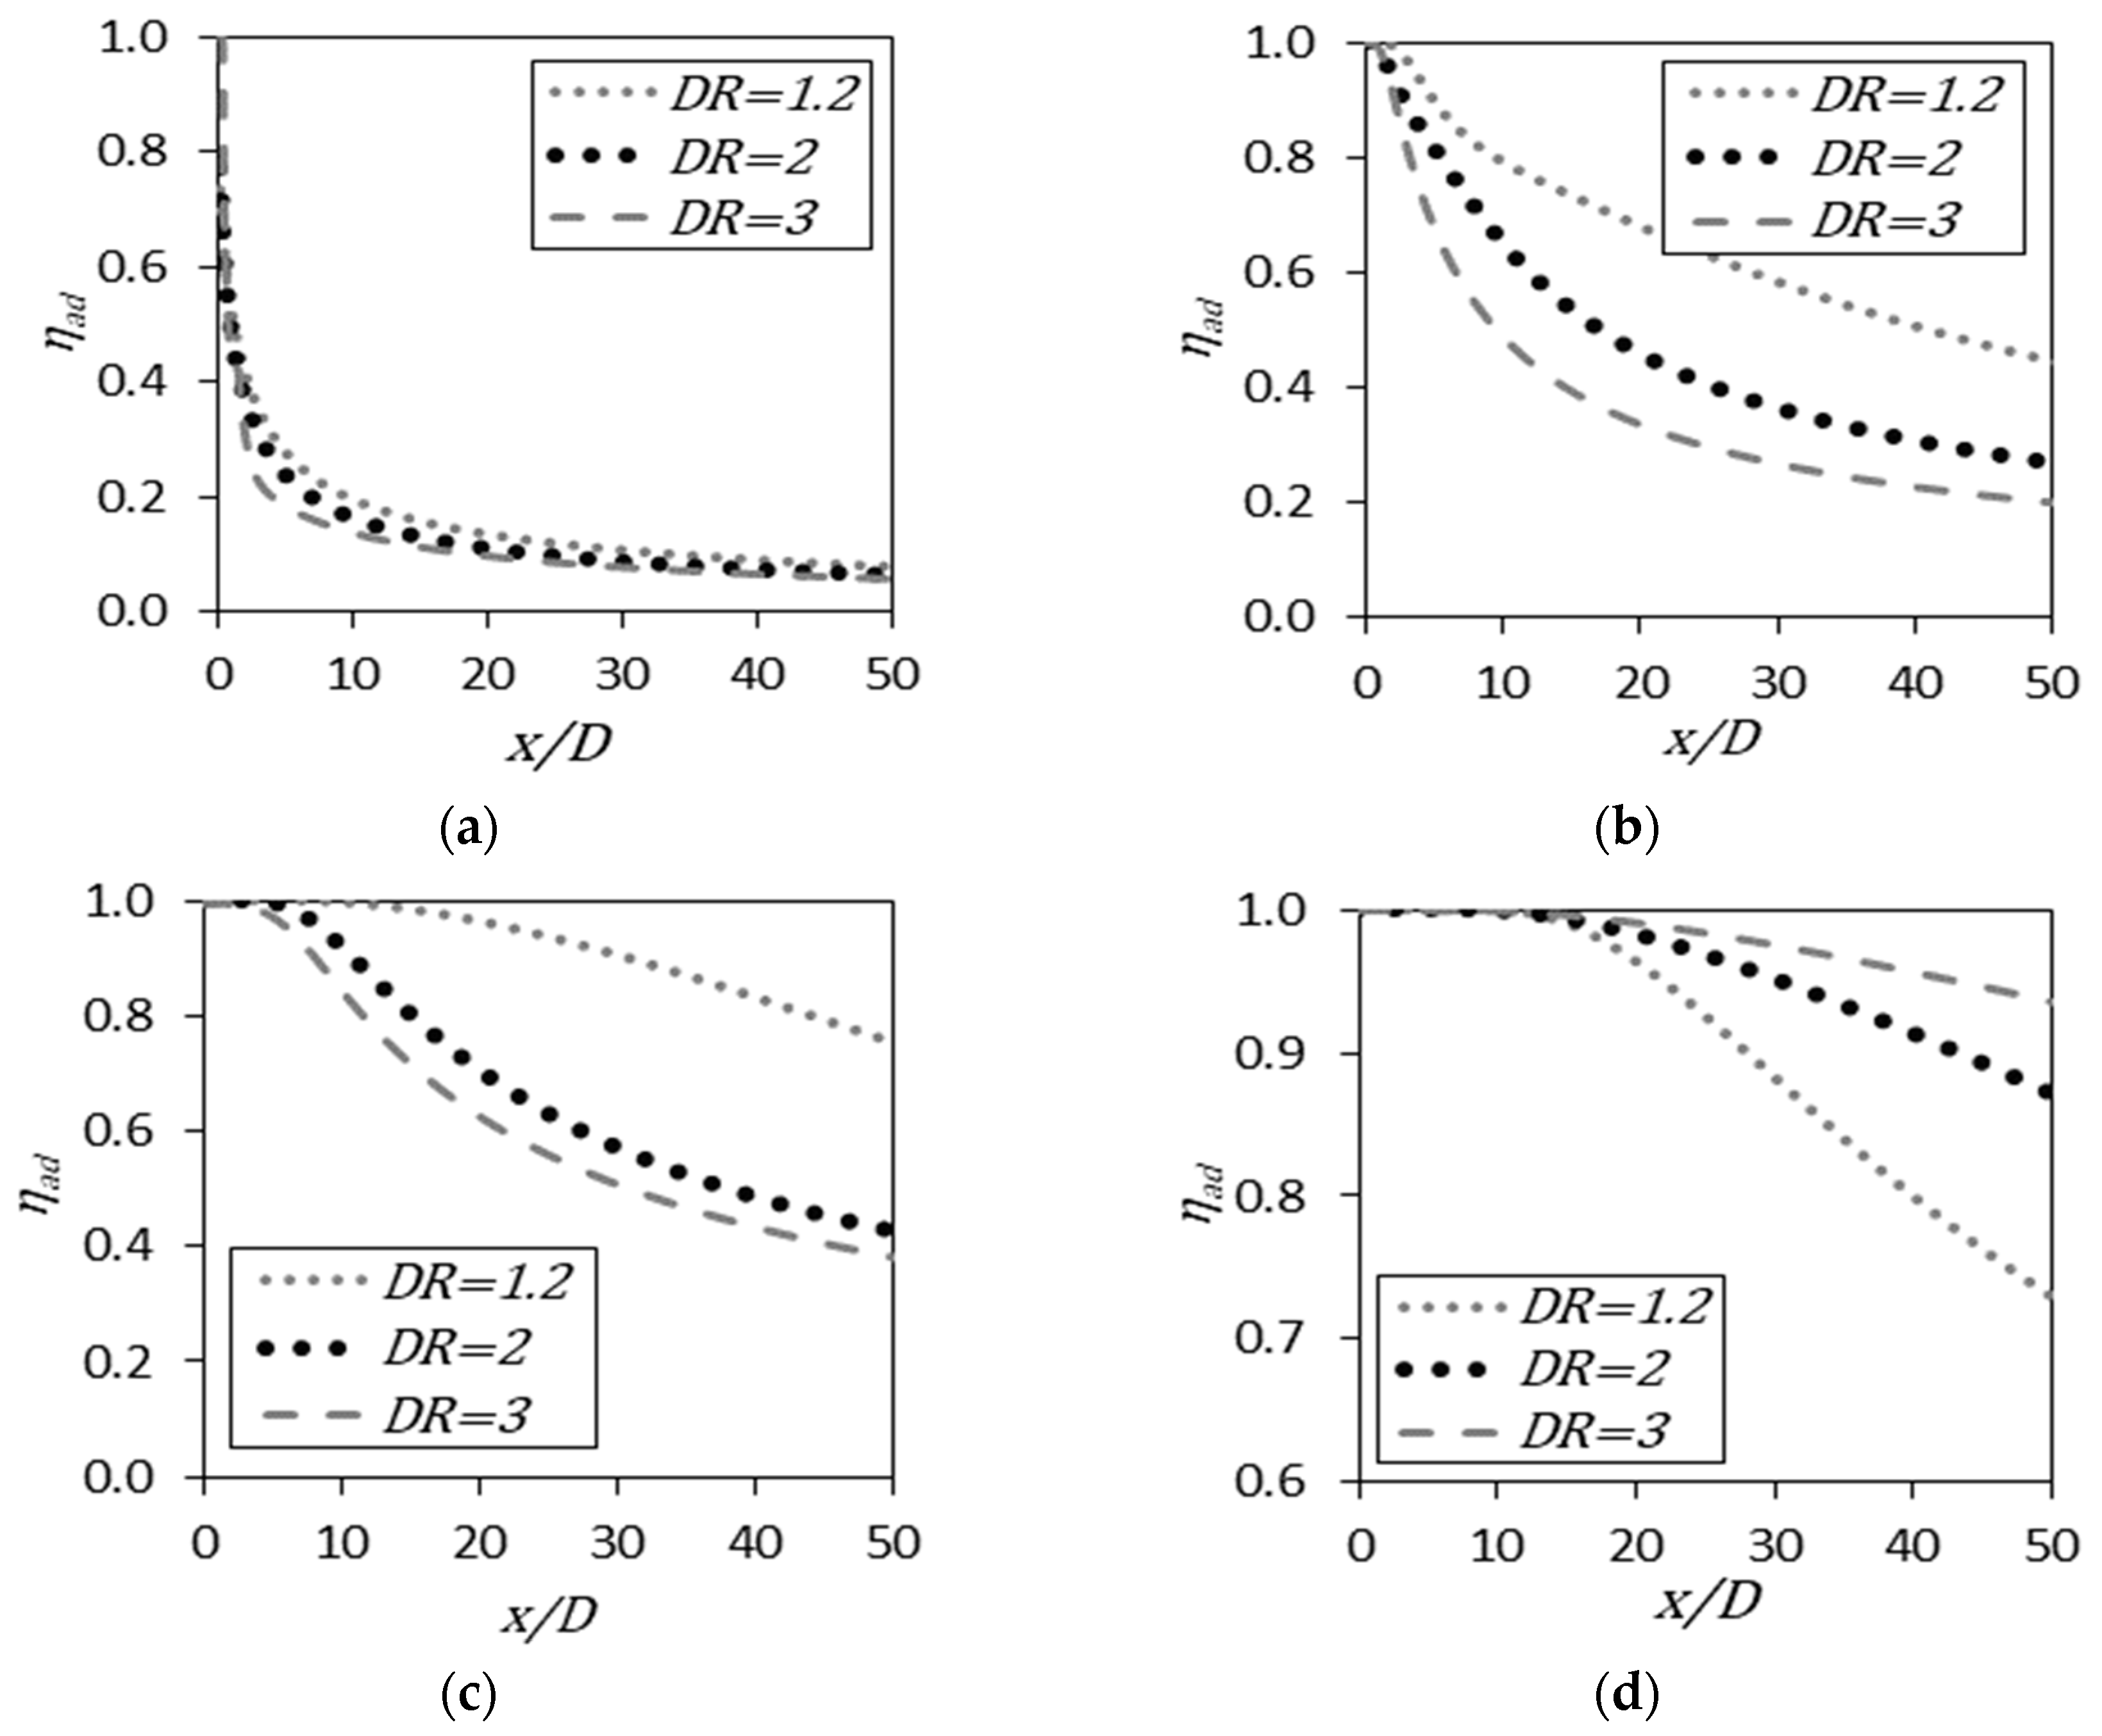
Using
, the effect of density ratio (
) is studied while keeping the injection angle at a constant value of
degree for two blowing ratios as shown in
Figure 8. The density ratio (
) represents the density ratio between the relatively cool fluid and the hot mainstream fluid. At low blowing ratios,
as shown in
Figure 8a,
has minimum effect on the AFCE since the flow is mainly dominated by the hot mainstream and cool film has little momentum to shield the flat wall. At
of 0.5 and higher, the effect of
on the AFCE is more pronounced as shown in
Figure 8b–d. The
has two conflicting effects on heat transfer between hot mainstream fluid and cool film fluid. The first effect, while using fixed value of
, as
increases the velocity ratio (
) decreases causing a lower momentum of the injected cooling fluid, which decreases the size of the film cooling blanket covering the flat wall. Hence, increasing
means less protection on the flat wall. The second effect is that as
increases the thermal capacity of the cooling fluid increases, which allows it to carry more thermal energy and prevents such energy transfer to the flat wall. The increase in the thermal capacity of the cooling fluid shields the wall from additional heat transfer and boosts the AFCE.
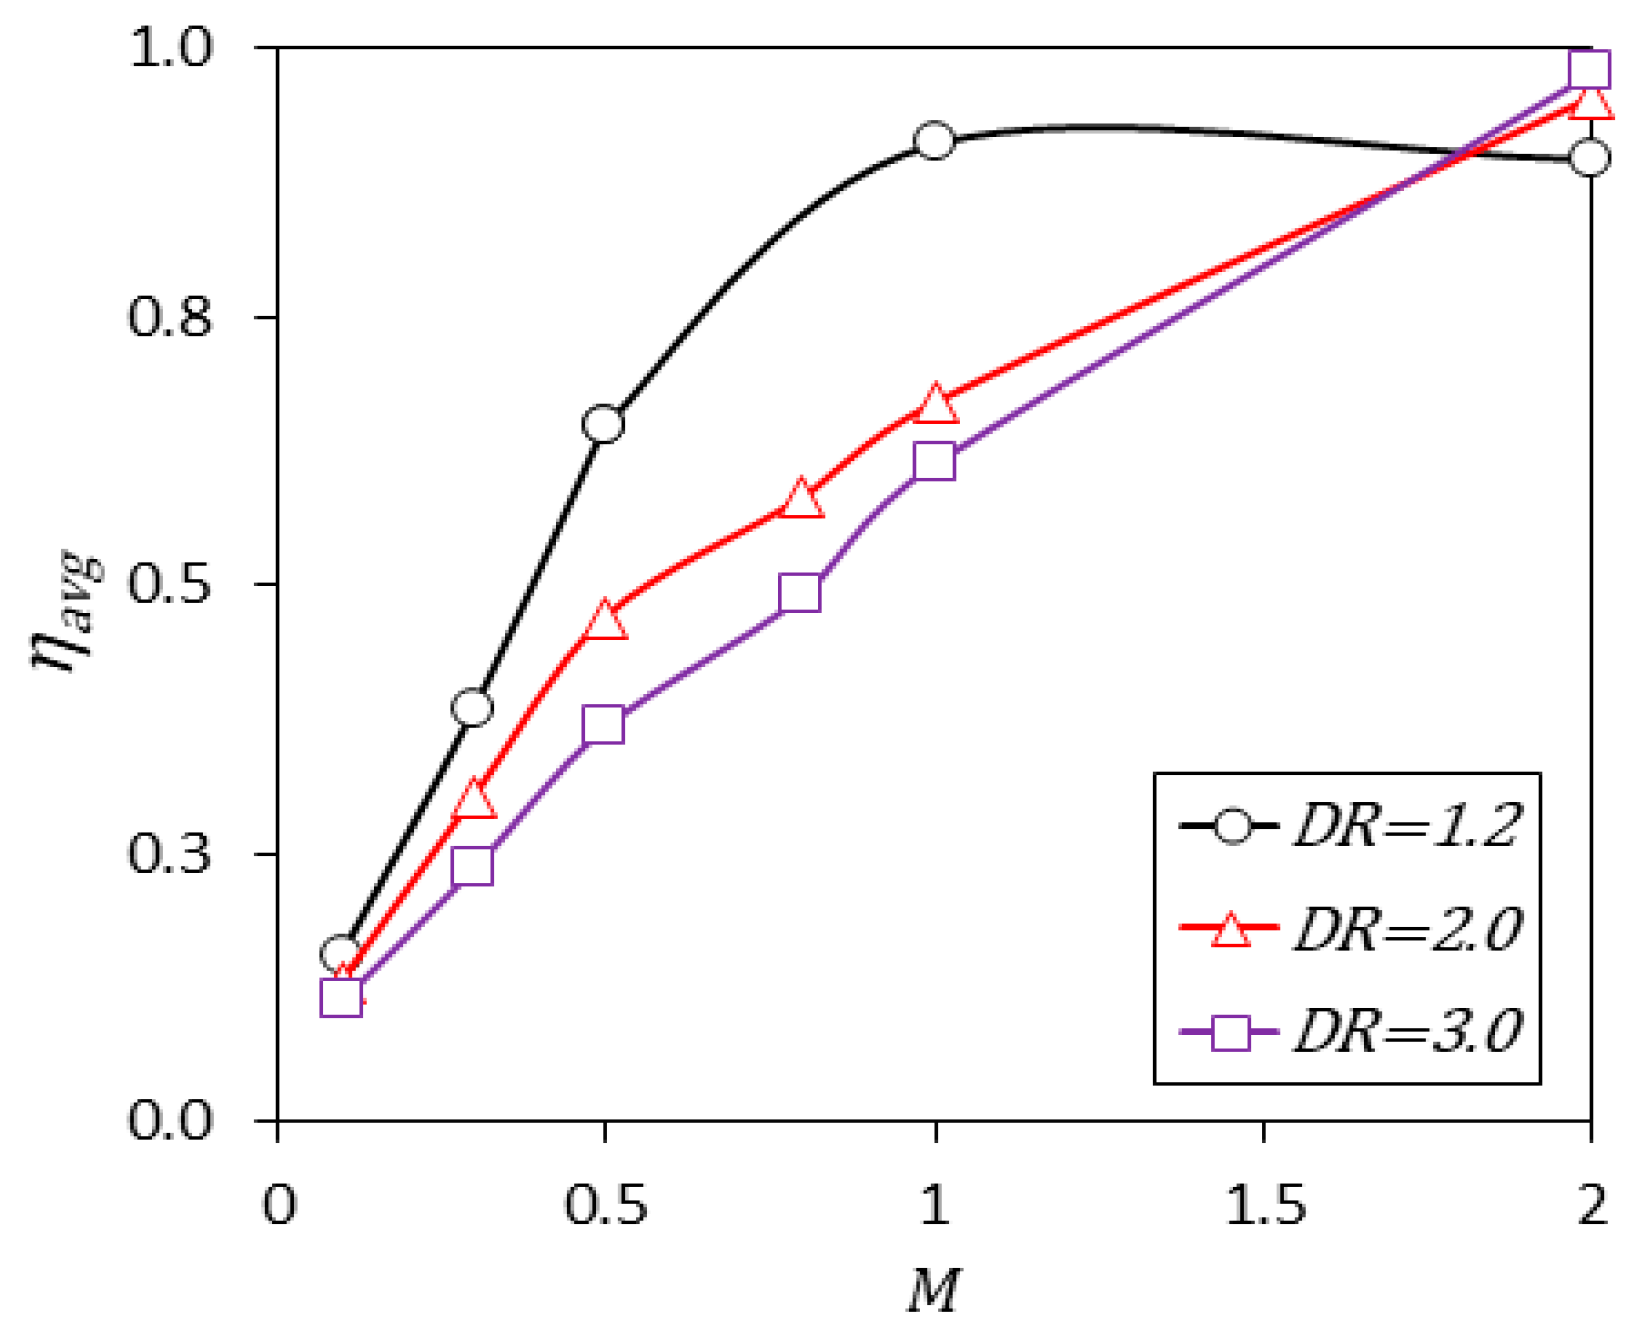
Figure 9 shows that as
increases the AFCE decreases for
values less than 1, due to the formation of thick film of coolant fluid. However, at high value of
, as
increases, the effect of thermal capacity of cooling fluid increases, which causes a better shielding against the heat transfer from the hot mainstream fluid and improves the AFCE. As show in
Figure 9, at injection angle of
degree and
the critical
is around 1, while no critical
is observed at
and
.
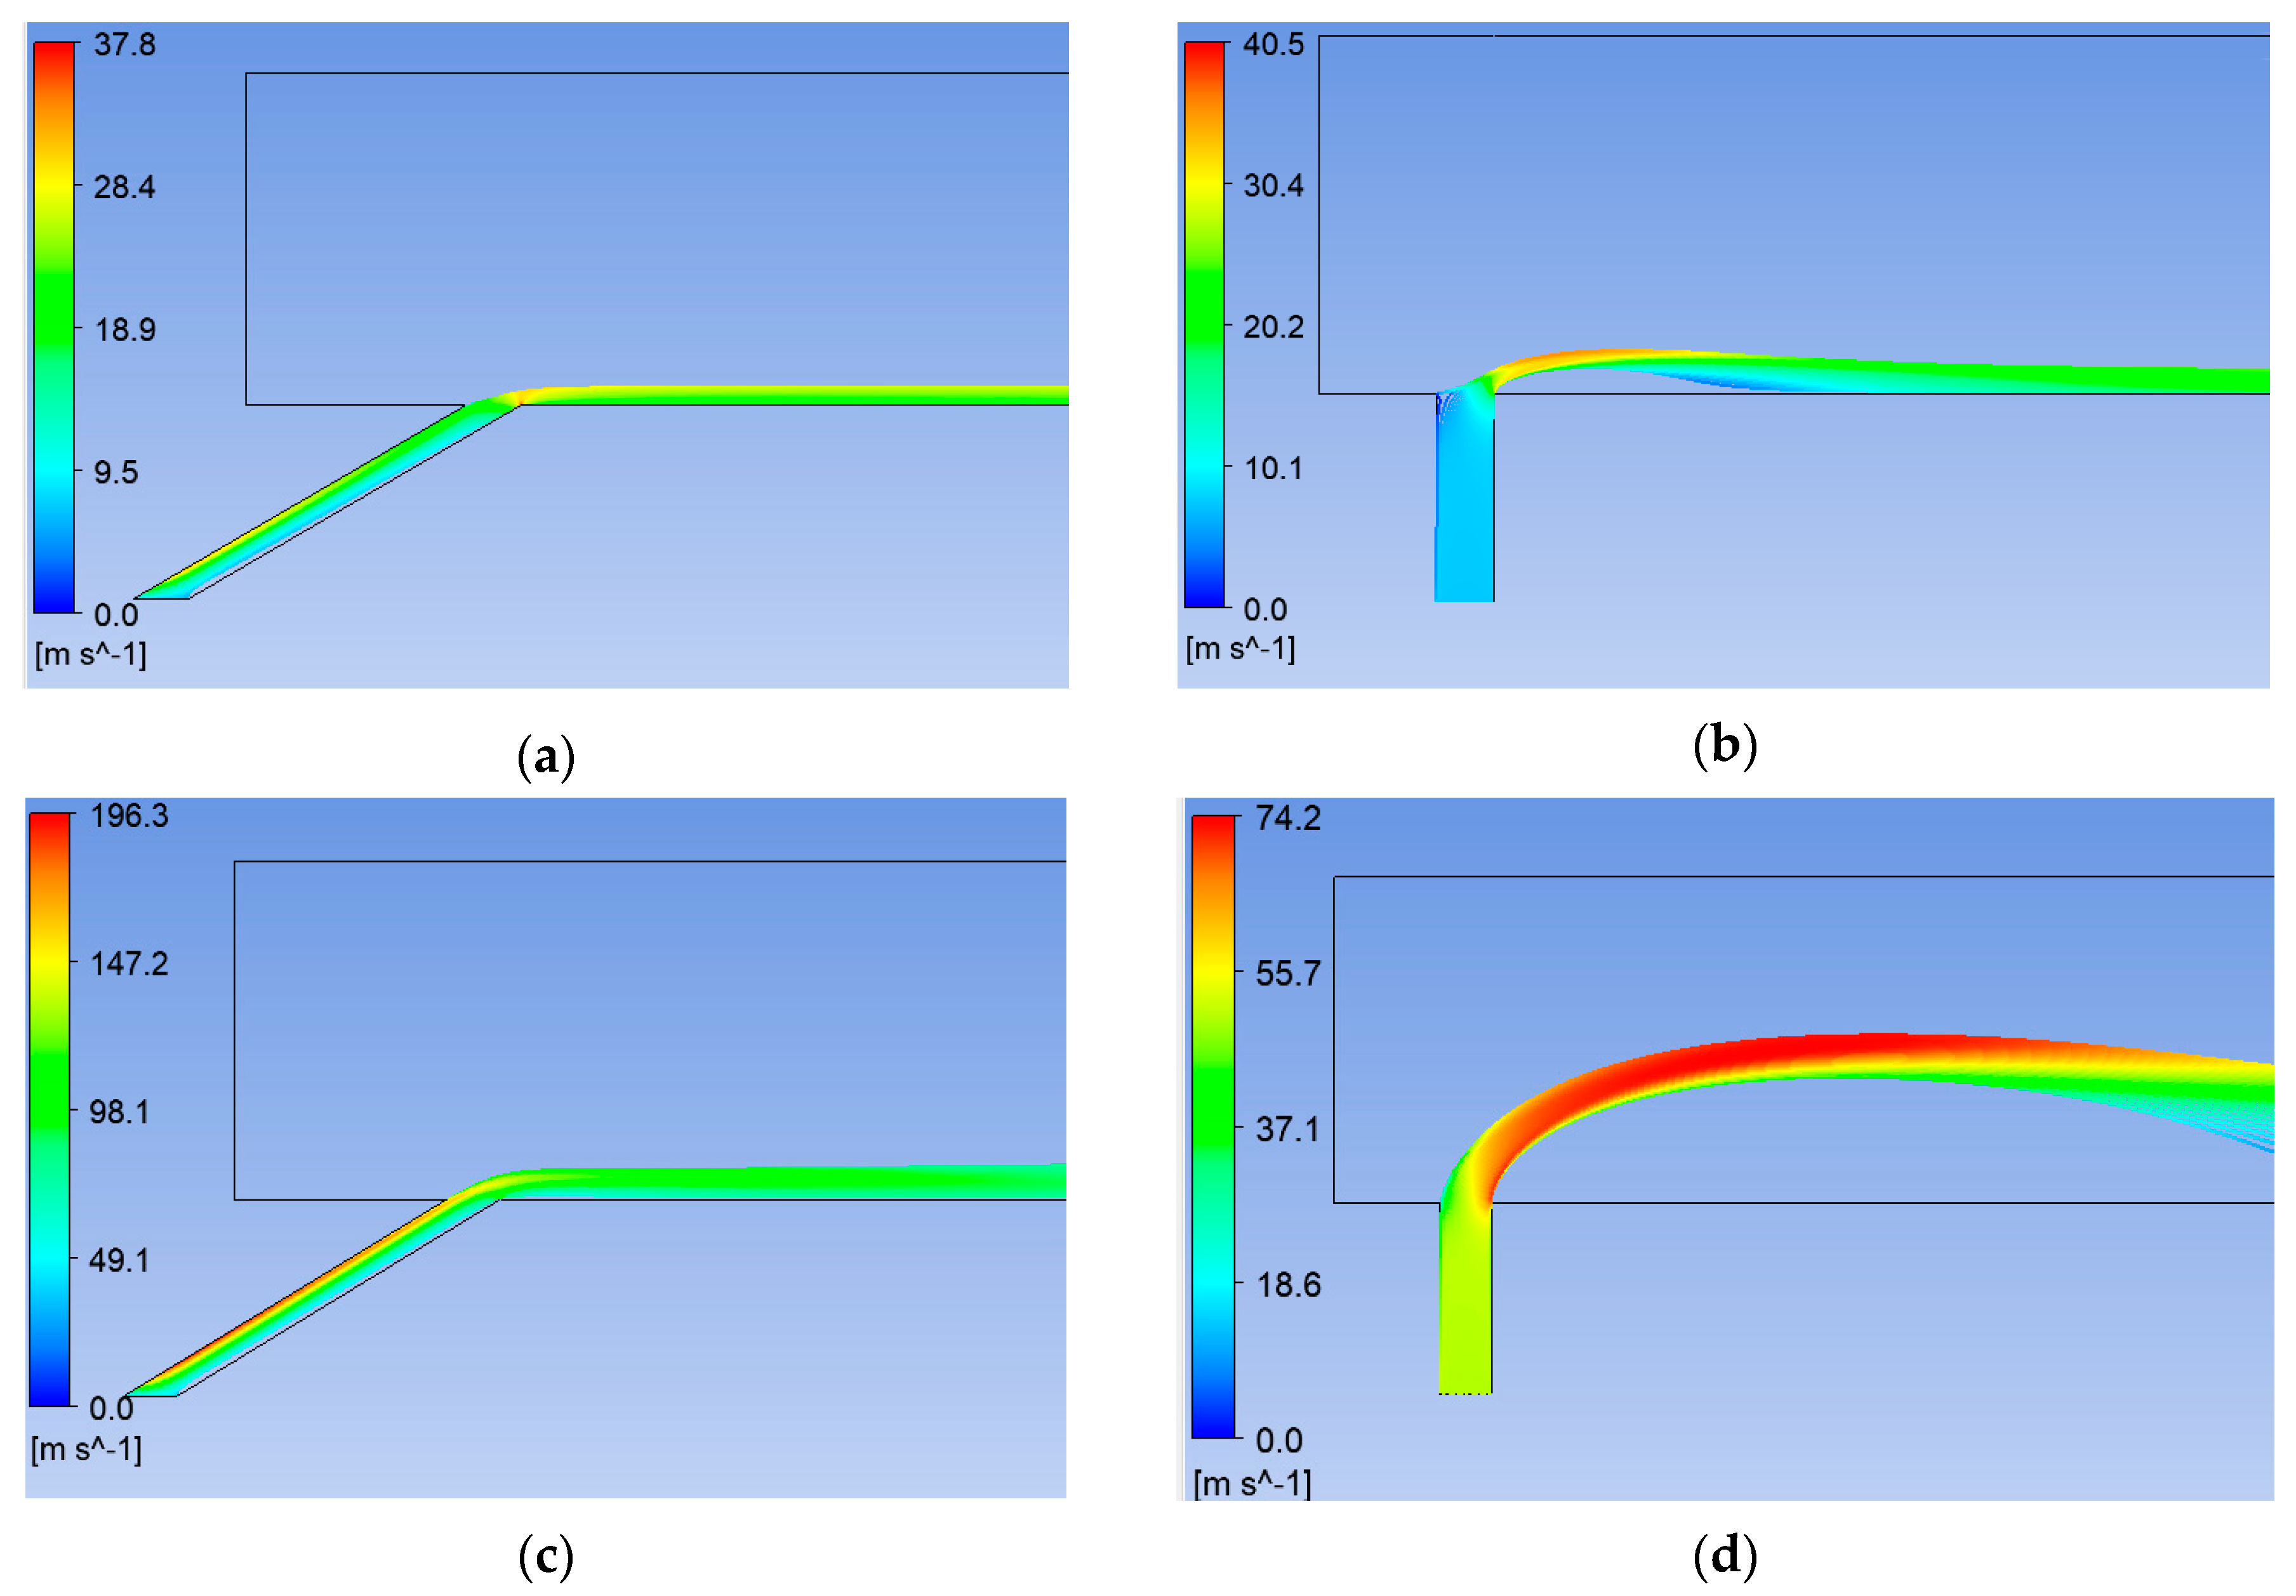
The coolant jet velocity streamlines at various film cooling configurations are shown in
Figure 10. The coolant jet streamlines starting from jet entrance are used to describe the effect of the interrelated parameters on the AFCE.
Figure 10 shows the effect of coolant injection angle and blowing ratio on the coolant jet velocity streamlines. Blowing ratios effect on the film cooling blanket are shown in
Figure 10a,c. Higher blowing ratios often cause a higher thickness of the film cooling blanket, which affects the AFCE positively or negatively as discussed earlier. The effect of coolant injection angle on the film cooling thickness is shown in
Figure 10b,d. A higher coolant injection angle shows a bigger film cooling thickness. However, a higher coolant injection angle promotes injecting the coolant away from the flat wall, which reduces the wall protection and reduces the averaged AFCE.
To explore a relationship between several interrelated parameters affecting the AFCE, response surface methodology (RSM) is used. RSM is a group of statistical and mathematical models that are used to explore the relationship between numerous independent variables and response variables [
44]. The averaged AFCE is define as in Equation (3), which represents the area weighted average of the AFCE. In RSM analysis, all factors must be reported for at least three different levels. In this work, four levels of the blowing ratio, three levels of the injection angles and three levels of the density ratio are considered in the RSM analysis as shown in
Table 3. This combination of parameters results in 36 reported averaged AFCE. More levels are taken for the blowing ratio to increase the resolution of the RSM model in capturing the blowing ratio effect. RSM statistically measures the contribution of all the variables on the area weighted average AFCE. It reports the solely effect of a parameter, known as the main parameter effect, and how the different parameters are interacting with each other. These models are generally performed using a statistical software. In this study, a commercial software named MINITAB is used to develop the RSM model and to determine the effect of the variables in
Table 3 on the averaged AFCE. The significance of a term is identified by its corresponding
p-value and
T-value.
T-value is the calculated difference represented in units of standard error. Lower
p-value and greater
T-value is a characteristic of a significant term that has a big influence on the reported response value.
Table 4 shows the summary of the RSM model generated by MINITAB. The table shows that the terms
,
,
,
and
have the highest effect on the averaged AFCE.
The RSM generated regression model used to describe the averaged AFCE is shown in Equations (7) and (8). Equation (7) correlates the effect of all the terms on the averaged AFCE. While Equation (8) is generated using the terms in
Table 4 that have a
p-value of 0.1 and below. The relative error in estimating the AFCE is 7.90% and 7.97% for Equations (7) and (8), respectively. Therefore, Equation (8) can be used to accurately estimate the average AFCE within the minimum and maximum levels of the three different parameters in
Table 4.
The blowing ratio has two terms (, ) in the generated regression model, which have conflicting effect on the overall averaged AFCE. Increasing the blowing ratio (M) will increase the AFCE until the squared term () starts to affect the AFCE negatively. The model also shows that increasing the injection angle will decrease the AFCE. The density ratio can contribute positively to the AFCE at higher values of the blowing ratio. These results agree with the results discussed previously.
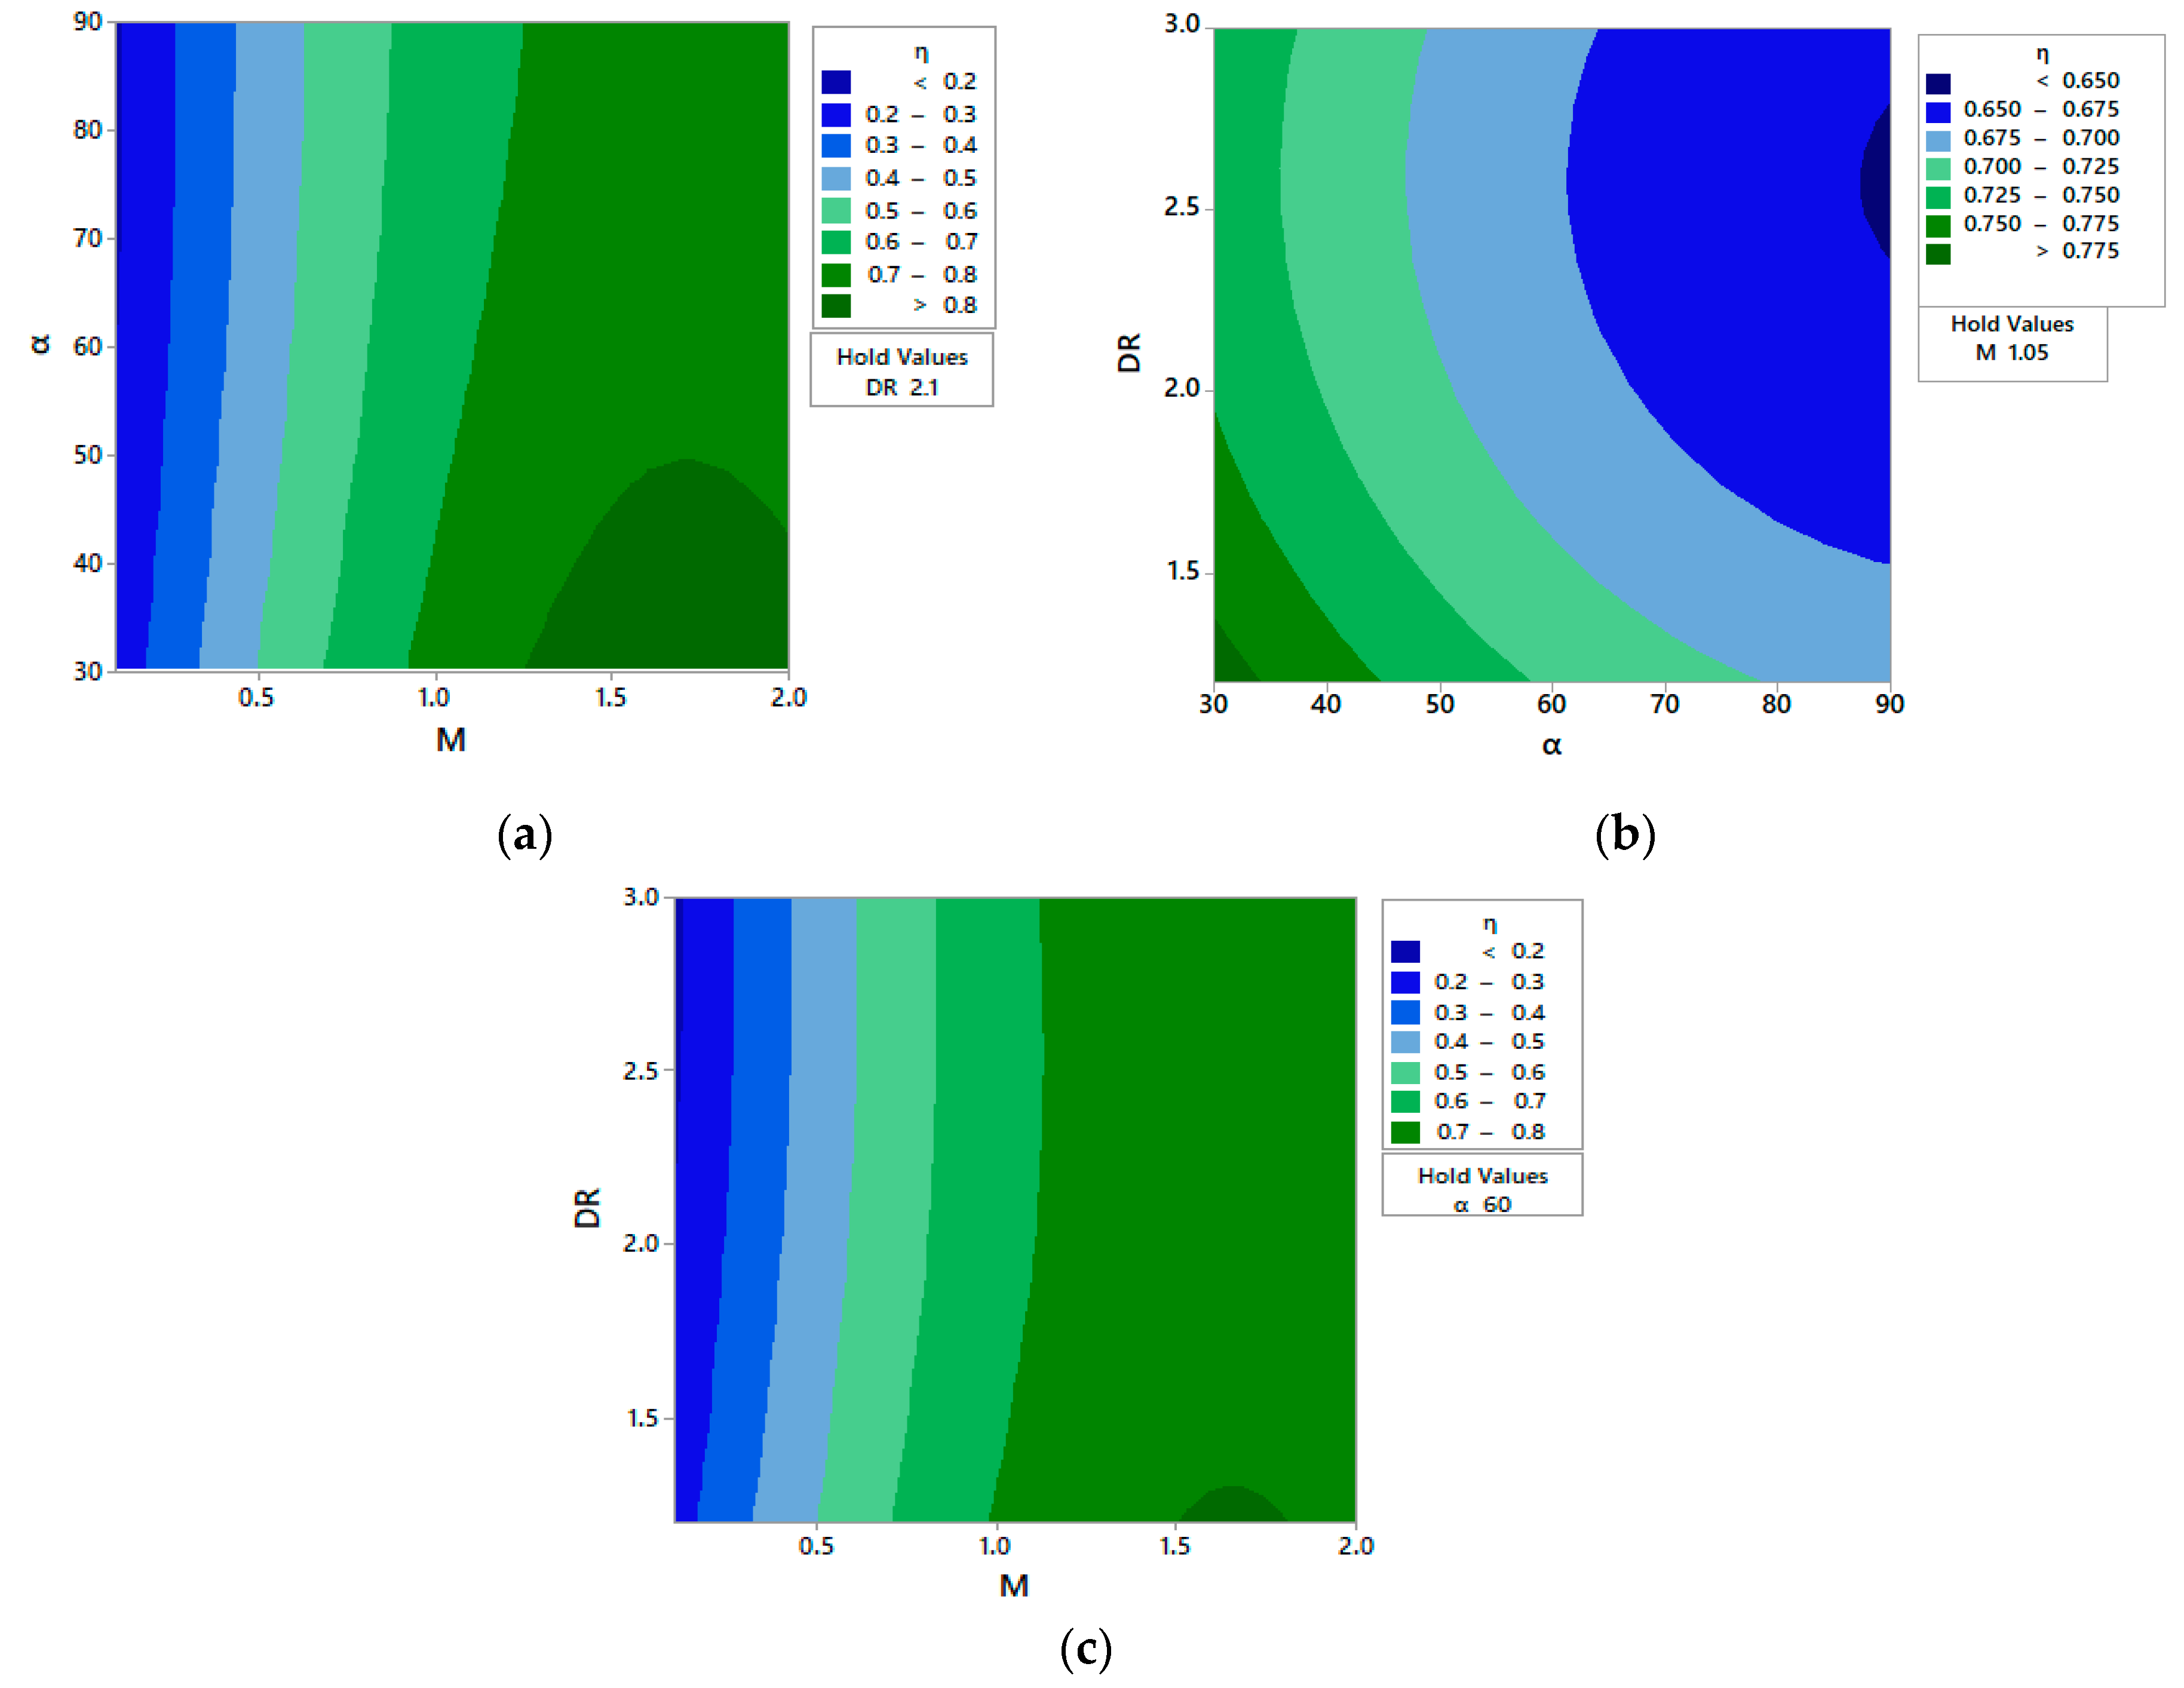
Figure 11 shows the interaction of three different variables.
Figure 11a,b suggest that the highest value of AFCE is achievable by working at lower values of injection angles and density ratios.
Figure 11c shows that working at high values of blowing ratio achieve high AFCE regardless of the
value. The quadratic effect of the blowing ratio given by Equation (8) can be seen in
Figure 11a, where a negative effect on the AFCE is observed.
Equation (8) is optimized using generalized reduced gradient (GRG) nonlinear solver using MS Excel solver. This solver method uses the gradient of the objective function (AFCE) and keep changing input values (, and ) until reaching an optimum solution when the partial derivatives equal zero. Using the GRD solver on selected range, the optimum point will be for at injection angle of , and .


