Article

Acid and Enzymatic Fractionation of Olive Stones for Ethanol Production Using Pachysolen tannophilus

by
Manuel Cuevas
1,2,*,
Marwa Saleh
1,
Juan F. García-Martín
2,3,* and
Sebastián Sánchez
1,2
1
Department of Chemical, Environmental and Materials Engineering, University of Jaén, Campus ‘Las Lagunillas’, 23071 Jaén, Spain
2
Center for Advanced Studies in Olive Grove and Olive Oils, Science and Technology Park GEOLIT, 23620 Mengibar, Spain
3
Departamento de Ingeniería Química, Facultad de Química, Universidad de Sevilla, C/Profesor García González, 1, 41012 Seville, Spain
*
Authors to whom correspondence should be addressed.
Processes 2020, 8(2), 195; https://doi.org/10.3390/pr8020195
Submission received: 29 December 2019 / Revised: 30 January 2020 / Accepted: 31 January 2020 / Published: 6 February 2020

Abstract

:
Olive stones are an abundant lignocellulose material in the countries of the Mediterranean basin that could be transformed to bioethanol by biochemical pathways. In this work, olive stones were subjected to fractionation by means of a high-temperature dilute-acid pretreatment followed by enzymatic hydrolysis of the pretreated solids. The hydrolysates obtained in these steps were separately subjected to fermentation with the yeast Pachysolen tannophilus ATCC 32691. Response surface methodology with two independent variables (temperature and reaction time) was applied for optimizing D-xylose production from the raw material by dilute acid pretreatment with 0.01 M sulfuric acid. The highest D-xylose yield in the liquid fraction was obtained in the pretreatment at 201 °C for 5.2 min. The inclusion of a detoxification step of the acid prehydrolysate, by vacuum distillation, allowed the fermentation of the sugars into ethanol and xylitol. The enzymatic hydrolysis of the pretreated solids was solely effective when using high enzyme loadings, thus leading to easily fermentable hydrolysates into ethanol. The mass macroscopic balances of the overall process illustrated that the amount of inoculum used in the fermentation of the acid prehydrolysates strongly affected the ethanol and xylitol yields.

1. Introduction

Global warming is a problem that could be mitigated by replacing fossil energy sources by renewable energy sources, such as green biomass. [1]. In recent decades numerous research papers have addressed the use of lignocellulose materials to obtain ethanol through biochemical routes [2,3,4], describing bioprocesses that are mainly composed of three major stages: Biomass pretreatment, cellulose hydrolysis, and sugars fermentation. Acid prehydrolysis at high temperature (around 200 °C) is one of the most efficient pretreatments to remove hemicelluloses and extracts present in lignocellulose materials, obtaining a cellulose and lignin-rich pretreated solid [5,6]. This type of pretreatment can be carried out with low concentrations of acid and short reaction times (few minutes), being able to generate liquid prehydrolysates with high concentrations of hemicellulose sugars, provided that suitable operating conditions are used. Thus, for a fixed acid concentration, there will be optimal temperature and reaction time conditions that will lead to complete hydrolysis of the hemicellulose and will maximize the concentration of hemicellulose sugars in the liquid prehydrolysate. The search for these conditions could be approached using response surface methodology as previously described elsewhere [7,8]. In relation to the type of acid used, sulfuric acid is generally used instead of hydrochloric acid due to its low volatility, lesser equipment corrosion and lower cost per mole of protons [9], so it is frequently used at this stage of the bioprocess.
To improve the biomass fractionation, pretreated solids could be subjected to enzymatic hydrolysis with cellulases, which would allow a selective conversion of cellulose into D-glucose under mild operating conditions (pH 4.8, 50 °C temperature). It is of great importance to assess the effect of enzyme loading in the enzymatic hydrolysis, since a low concentration of the same would lead to low monosaccharide yields, while a high concentration would excessively increase the operating costs.
Concerning sugars fermentation, the use of non-traditional yeasts, such as Pachysolen tannophilus, would allow converting both hexoses and pentoses into ethanol [10], provided that fermentative inhibitors concentrations are cut down. In this sense, the levels of furfural and acetic acid in the acid prehydrolysates could be reduced by vacuum distillation because of the higher vapor pressures of these compounds with respect to those of monosaccharides. A variable of great interest in the fermentative stage is the inoculum concentration since this is responsible, among other factors, for the bioprocess rate.
Olive stones are a lignocellulose material that is obtained in great quantities in the olive oil mills [11]. Therefore, this biomass is a potential source of biofuels in countries with large olive production, such as Spain, Italy, Greece, or Portugal. The biochemical conversion of olive stones into ethanol, using hydrothermal or acid pretreatments, has been partially studied by different authors. Thus, Miranda et al. [12] applied a hydrothermal pretreatment to olive stones (130 °C, 30 min) achieving a good enzymatic digestibility of the cellulose fraction. However, the further use of liquid prehydrolysates is usually not addressed. The liquid prehydrolysates are rich in D-xylose and xylooligosaccharides as described in other works in which water was used as a hydrolytic agent [13,14]. On the other hand, Romero-García et al. [15] applied 2% (wt.) sulfuric acid (130 °C, 60 min) to olive stones, achieving a high production of hemicellulose sugars (mainly D-xylose) that were fermented to ethanol after undergoing detoxification by overliming. Notwithstanding, this work did not address the use of the pretreated solids, thus remaining as waste. Saleh et al. [16] applied dilute sulfuric acid (0.025 M H2SO4) to olive stones (195 °C, 5 min) to hydrolyze the hemicellulose and obtain a D-xylose-rich prehydrolysate, which was subsequently detoxified and fermented. The pretreated solids were subjected to enzymatic hydrolysis, but the obtained hydrolysates were not fermented despite their high sugars content.
The present study aims to develop a complete scheme of ethanol production from olive stones by applying two consecutive hydrolytic stages (acidic and enzymatic) followed by the subsequent stage of sugars fermentation. The acid pretreatment was optimized to maximize the recovery of hemicellulose sugars, while the effect of enzyme loading on D-glucose production in the subsequent stage of enzymatic hydrolysis was studied. The non-traditional yeast Pachysolen tannophilus was used for the fermentation of both the acid prehydrolysates and the enzymatic hydrolysates, and the effect of inoculum concentration on the fermentation performance was assessed. The fractionation applied to the biomass was envisaged by determining the mass macroscopic balances at the different stages of the process. In this way, a rapid description of the conversion of olive stones into ethanol and other bioproducts was achieved.

2. Materials and Methods

2.1. Raw Material

Olive stones (fragmented endocarps) were supplied by the olive mill S.C.A. San Juan (Jaén, Spain, UTM coordinates: 37°47′58.52″ N, 3°47′09.42″ W). Once at laboratory, the raw material was washed and then dried at room temperature for three weeks. Afterwards, the olive stones were screened using a vibratory screen (Restch, Mod. Vibro). The solids used in this research had diameters lower than 3 mm while those of diameter lower than 0.85 mm represented less than 3% of the total sample weight. Finally, the dry solids were stored in sealed plastic bags at room temperature until used.

2.2. Dilute Acid Pretreatment

Dilute acid hydrolysis was carried out in a 2 dm3 Parr reactor, Series 4522 (Moline, IL, USA). For experiments, this reactor was loaded with 50 g of dry solids and 300 cm3 of 0.010 M sulfuric-acid solution. The chosen H2SO4 concentration was significantly lower than that used in a previous work published by us (0.025 M, [16]) to reduce the corrosion that the acid causes on the reactor. The mixture was stirred at 250 rpm and quickly heated up to work temperature, which was maintained over the selected reaction time (see Section 2.3). Subsequently, the reactor was cooled to room temperature (in less than 10 min) by circulating cold water through an internal coil. The liquid prehydrolysate was separated from the pretreated solid by vacuum filtration. The latter one was water-washed and dried at room temperature. The water used for washing the pretreated solid was added to the prehydrolysate until reaching a final volume of 2 dm3. The two separate phases were stored for later characterization and used in the following stages of the scheme.

2.3. Response Surface Methodology (RSM)

Response surface methodology (RSM) was applied to data to optimize the acid pretreatment conditions by multiple regression analysis. To do this, the Modde 7.0 (Umetrics AB, Umeå, Sweden) software was used. The 22 central composite circumscribed design (CCCD) with two independent variables (temperature and time) at two different levels, four star (axial) points and three central points (total 11 runs, Table 1) was assayed to find linear, quadratic and interaction effects of the independent variables (operational parameters) on the experimental responses (experimental results). The temperature (180–220 °C) and time (2–8 min) ranges were selected from the results obtained in preliminary experiments (data not shown) with the aim of achieving as D-xylose recovery as possible in the liquid prehydrolysates. The statistical validation was carried out by one-way ANOVA test (95% confidence), and the optimal conditions values were determined from the response surfaces using the SIMPLEX method.

2.4. Detoxification and Fermentation of Acid Prehydrolysates

The acid prehydrolysates were detoxified using a Buchi R-114 rotary evaporator (BÜCHI Labortechnik AG, Flawil, Switzerland) at 40 °C, thus removing inhibitor compounds (acetic acid, furfural, and 5-hydroxymethylfurfural) and achieving a D-xylose concentration close to 15 g/dm3.
Fermentations of acid prehydrolysates were carried out using the yeast P. tannophilus ATCC 32,691, supplied by the American Type Culture Collection. The microorganism was stored in a cold room (5–10 °C) in 100-cm3 test tubes on a sterilized solid culture medium with the following composition: 3 g/dm3 yeast extract (Becton Dickinson Co), 3 g/dm3 malt extract (Merck), 5 g/dm3 peptone from casein (Merck), 10 g/dm3 D-xylose (≥99% purity, Panreac), and 20 g/dm3 agar–agar (Panreac). For pre-inocula, cells were transferred to a sterile medium with the same aforementioned composition and kept in an incubator at 30 °C for 60 h in order to obtain cells at the same growth stage at the beginning of each fermentation. Afterwards, the pre-inocula were transferred to 250-cm3 Erlenmeyer flasks along with 100 cm3 of sterile liquid culture made of 4 g/dm3 yeast extract (Becton Dickinson Co), 3.6 g/dm3 peptone from casein (Merck), 3 g/dm3 (NH4)2SO4 (99% purity, Panreac), 2 g/dm3 MgSO4·7H2O (99,5% purity, Carlo Erba), 2 g/dm3 KH2PO4 (99% purity, Panreac), and 25 g/dm3 D-xylose (≥99% purity, Panreac). Cultures were incubated at 30 °C for 24 h in an orbital shaker (150 rpm). Then, yeast cells were recovered by centrifugation at 7000 rpm for 10 min, washed with a dilute NaCl solution, and suspended in the fermentation medium to obtain initial inoculum concentrations of 0.5, 1.0, 2.0, and 4.0 g/dm3. These concentrations (x, kg/m3) were calculated from the absorbances of the cultures at 620 nm using a previously obtained absorbance versus dry-weight calibration line [10].
Fermentations were carried out with 30 cm3 of prehydrolysate inside 100 cm3 Erlenmeyer flasks. The prehydrolysates were supplemented with 2 g/dm3 yeast extract (Becton Dickinson Co), 1.8 g/dm3 peptone from casein (Merck), 1.5 g/dm3 (NH4)2SO4 (99% purity, Panreac), 1 g/dm3 MgSO4·7H2O (99,5% purity, Carlo Erba), and 1 g/dm3 KH2PO4 (99% purity, Panreac). The resulting cultures were sterilized using a glasswool pre-filter and a 0.2-µm pore-size cellulose nitrate filter. Temperature (30 °C) and pH (4.5) were chosen according to previous works [10,17] and kept constant over fermentations. The aeration was only supplied by the stirring vortex (microaerobic conditions). The cultures were sampled at fixed intervals to analyze the biomass, D-glucose, D-xylose, acetic acid, ethanol, and xylitol concentrations. Two replicas of each fermentation were performed.

2.5. Enzymatic Hydrolysis

The washed and dried water-insoluble solids obtained in the dilute acid hydrolysis of olive stones were submitted to enzymatic hydrolysis in order to obtain D-glucose from the cellulose. To do this, 3 g of dry solids were suspended in 30 cm3 of 0.05 M citrate buffer solution (pH 4.8) inside 125 cm3 Erlenmeyer flasks. Enzymatic hydrolyses were carried out at 50 °C for 72 h on an orbital shaker (150 rpm). A commercial preparation of Trichoderma reesei cellulases (Celluclast 1.5L, Novo Nordisk Bioindustrial, Madrid, Spain) was used throughout this research. Enzyme loadings of 10, 20, 40 and 60 FPU per g dried solid were added to the Erlenmeyer flasks. 1-cm3 samples were withdrawn from the reaction media at 4, 10, 24, 48, 72, and 120 h to analyse the D-glucose concentration. The D-glucose yield was calculated as g of D-glucose per 100 g of initial pretreated solid. All the enzymatic hydrolyses were performed in duplicate.

2.6. Fermentation of Enzymatic Hydrolysates

The fermentation of the enzymatic hydrolysates was performed with the yeast P. tannophilus ATCC 32691 following the procedure described in Section 2.4 but with two modifications: Enzymatic hydrolysates were not detoxified, and the initial inoculum concentrations assayed were 0.5, 1.0, 1.5, and 3.0 g/dm3. The cultures were sampled at fixed intervals to analyse the biomass, D-glucose and ethanol concentrations. Two replicas of each fermentation were performed.

2.7. Analytical Methods

The raw material as well as the solids resulting from the acid treatments and from enzymatic hydrolyses were characterized according their contents in moisture (TAPPI T257 standard), hemicellulose and cellulose [18], and insoluble acid lignin (TAPPI T222 os-74 standard). Besides, ash (TAPPI T211 standard), extractives (ASTM D 1107 84 standard), and soluble acid lignin [19] were additionally analyzed in the raw material.
The Puls method [20], with a modification described elsewhere [16], was used to determine the percentage of xylans and acetyl groups in the raw material. The concentrations of D-glucose, D-xylose, L-arabinose, D-galactose and 5-hydroxymethyl-furfural in prehydrolysates, enzymatic hydrolysates and cultures were analyzed by high-performance liquid ionic chromatography (HPLIC). The HPLIC system (Dionex ICS 3000, Sunnyvale, CA, USA) was equipped with a CARBOPAD PA20 analytical column (3 mm × 150 mm) combined with a CARBOPAD PA20 guard column (3 mm × 30 mm), and a pulsed amperometer detector (gold electrode). Elution took place at 30 °C, the eluent being 1 cm3/min 0.002 M NaOH. After dilution, the samples were filtered through a 0.2 µm nylon membrane (Sartorius). Finally, ethanol, xylitol and acetic acid concentrations in liquid samples were quantified using enzymatic methods [21,22,23], using test-combination kits purchased from R-Biopharm AG (Darmstadt, Germany). All the analytical determinations were performed in duplicate.

3. Results

3.1. Dilute Acid Pretreatment: Experimental Results

Table 2 shows the characterization of the raw material as well as the pretreated solids and the liquid prehydrolysates obtained by dilute acid hydrolysis of the olive stones. The increase in temperature and reaction time led to a continuous decrease in the total gravimetric recovery of pretreated solid (TGR), a parameter that reached values between 56.54% and 86.53% for the most and less severe pretreatment conditions, respectively (228 °C—5 min and 172 °C—5 min). The loss of solid is due to the hydrolysis of different components of the raw material. Thus, hemicellulose began to depolymerize from the lowest temperature tested (172 °C) and practically was removed from the pretreated solids at 200 °C—5 min. Under these conditions, extractives (6.0% of the raw material) and the soluble acid lignin (2.1% of the raw material) were removed along with the hemicellulose (28.1% of the raw material), so the sum of the three fractions led to a TGR of 63.8%, theoretical value close to the average experimental value of TGR (62.78 ± 0.67%) obtained in experiments 5, 6, and 7 (Table 2). The loss of hemicellulose, extractives and acid insoluble lignin (AIL) caused the increase in the percentage of cellulose in the acid-pretreated solid, reaching a maximum of 38.62% for the experiment carried out at 200 °C—9.24 min, while the highest temperatures assayed (220 °C and 228 °C) led to the decrease of this percentage, which would indicate a partial hydrolysis of cellulose. In relation to the AIL percentage in acid-pretreated solids, this continuously increased, from 32.01% to 48.64%, with the increase of the temperature and pretreatment time (Table 2).
In relation to liquid prehydrolysates, product yields were strongly influenced by reaction conditions. D-xylose was the most abundant monosaccharide in the liquid phase, reaching a maximum experimental yield of 20.04 ± 1.56 g/100 g dry raw material under the conditions of 200 °C—5 min (Table 2), which represents 85.6% of the potential D-xylose in the biomass. The decrease in performance for more severe conditions would be explained by the thermal degradation of the monosaccharide. The maximum recoveries of L-arabinose (1.11 g/100 g dry raw material) and D-galactose (0.537 ± 0.072 g/100 g dry raw material) were achieved at low severities, while the maximum yield of D-glucose (1.63 g/100 g dry raw material) was reached at the maximum temperature assayed (228 °C, run 11), in which there was an intense hydrolysis of the cellulosic fraction. Apart from carbohydrates, certain compounds that can act as inhibitors in fermentation processes, such as acetic acid and HMF, were found in the liquid prehydrolysates. The maximum yields of acetic acid (5.77 g/100 g dry raw material) and 5-HMF (1.07 g/100 g dry raw material) were achieved in the experiments carried out at the highest temperatures; in the first case, from the hydrolysis of acetyl groups of the hemicellulose and, in the second one, as a consequence of the thermal degradation of D-glucose.

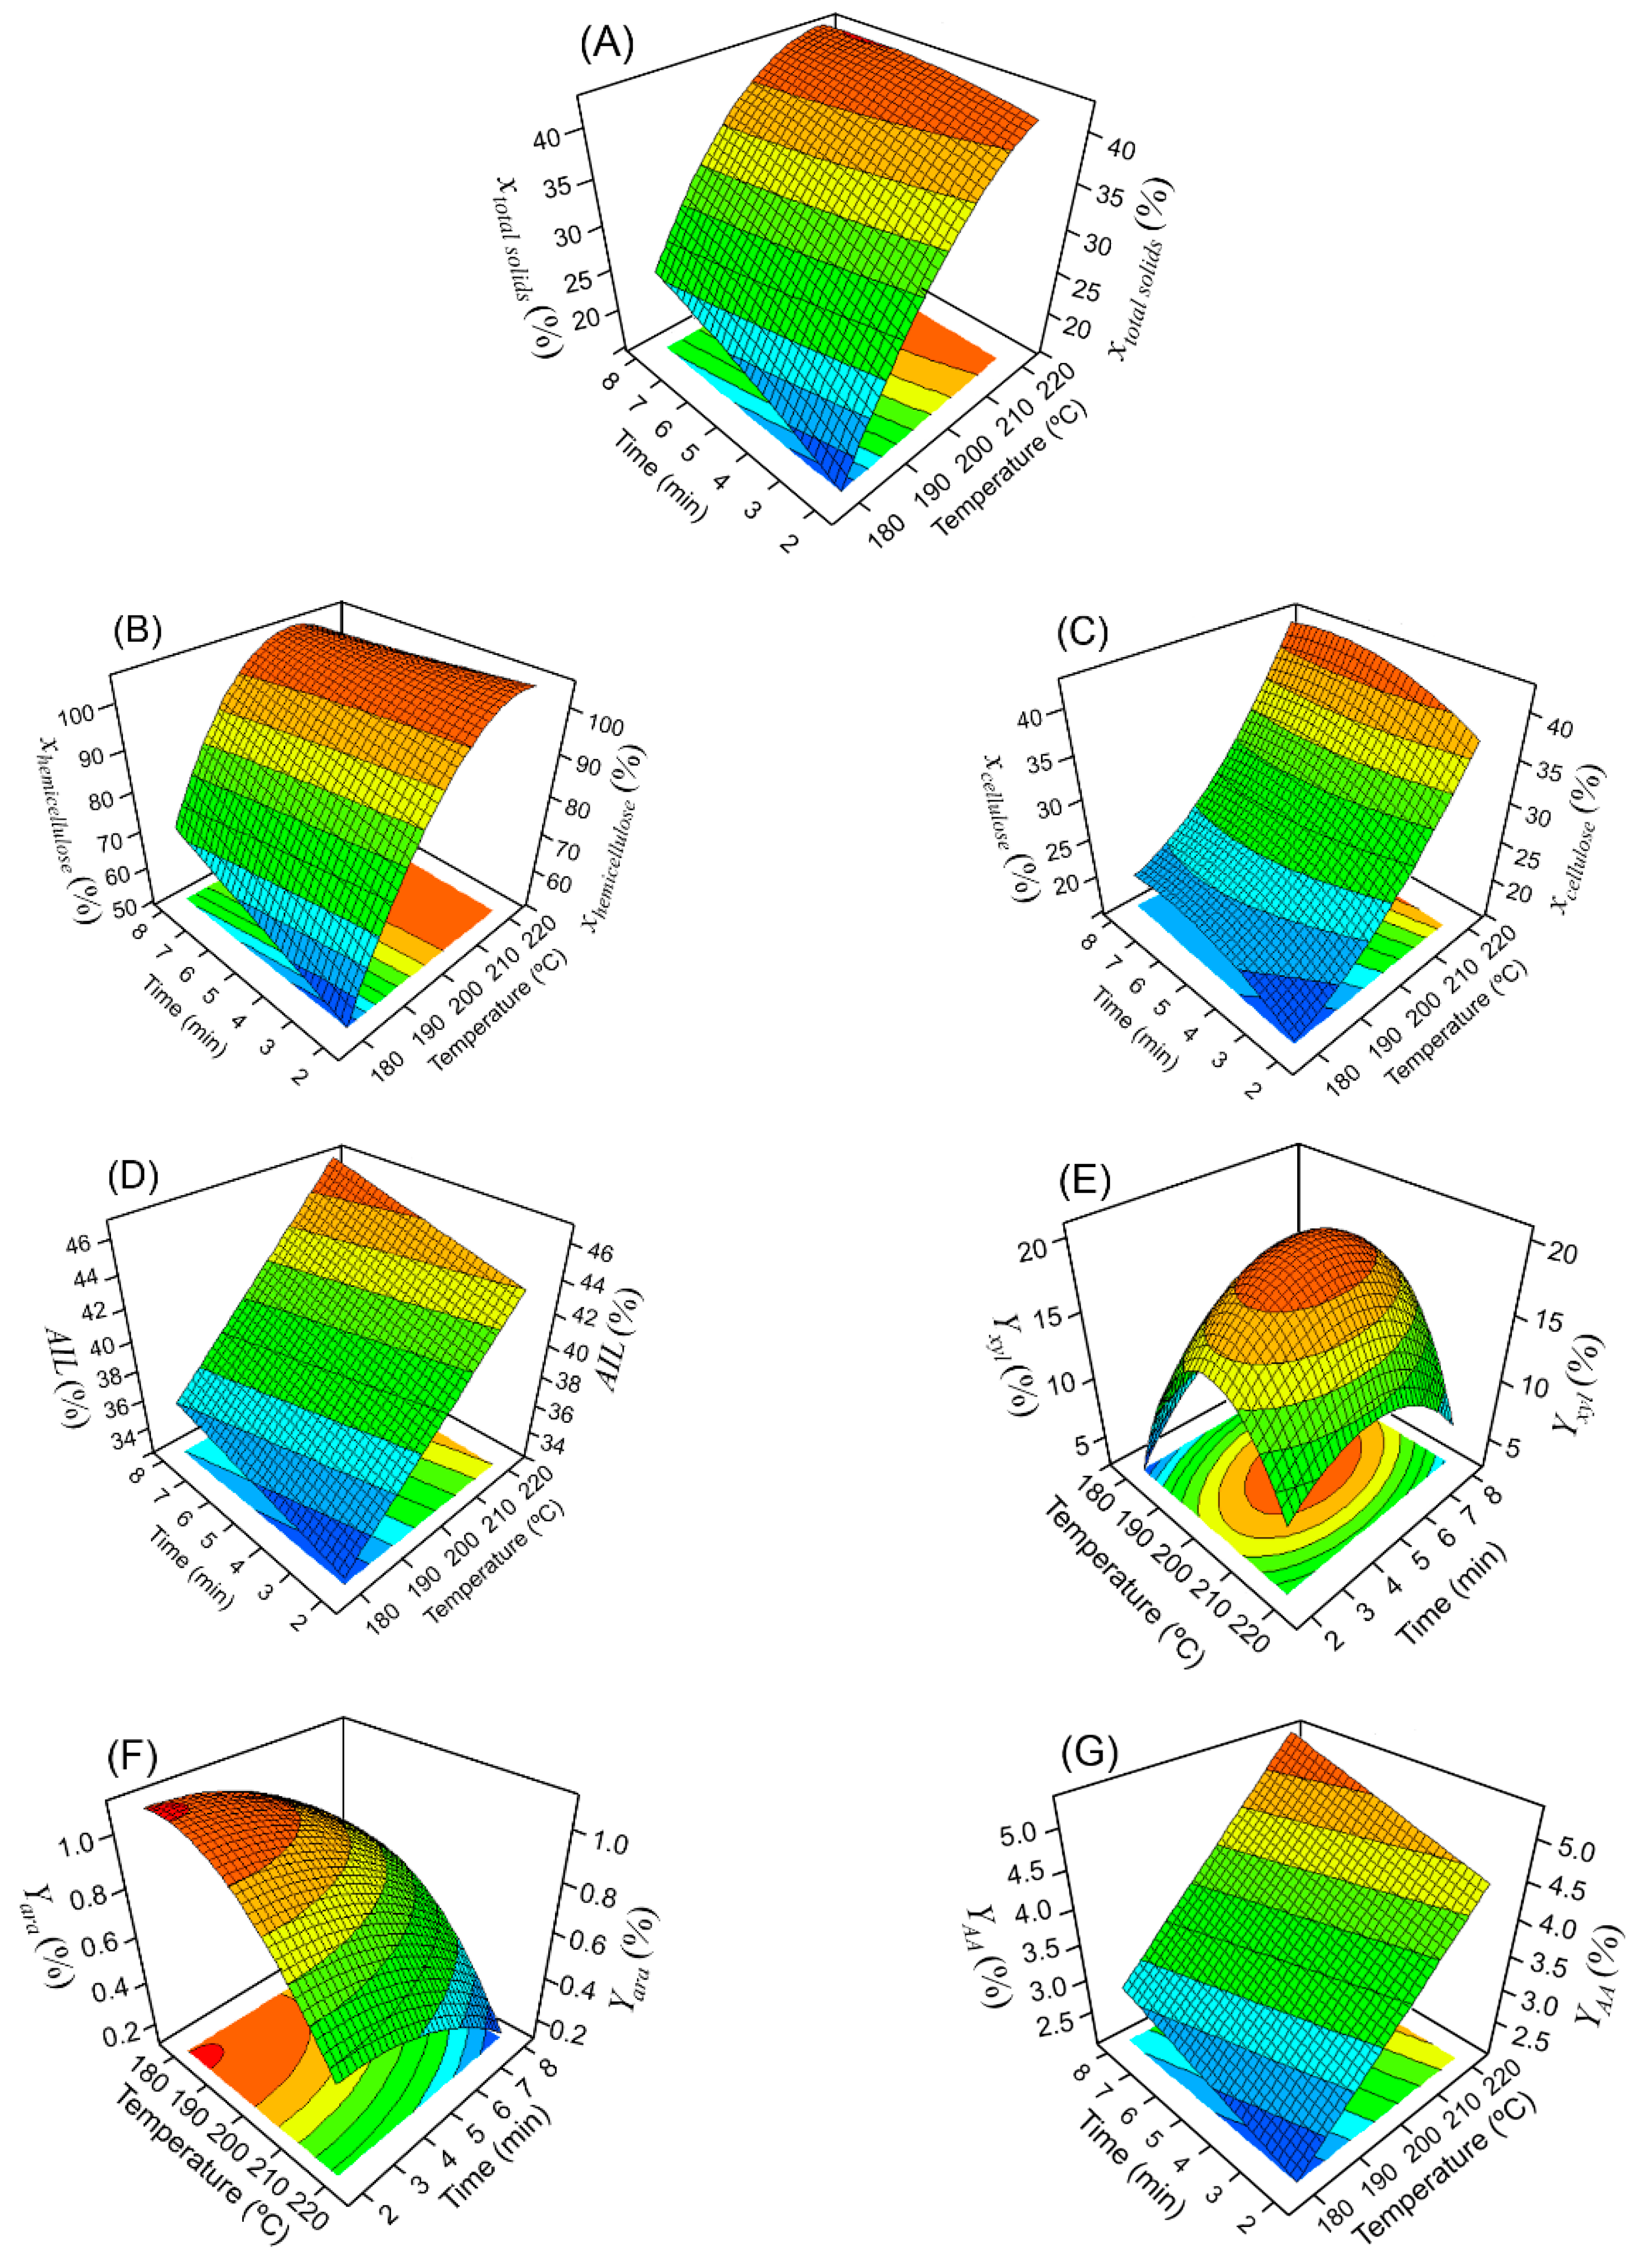
3.2. Dilute Acid Pretreatment: Modelling and Optimization

The application of response surface methodology (RSM) can lead to mathematical models that describe the modification of the composition of the solid residue and the liquid hydrolysate according to the studied independent variables: Temperature (X1) and reaction time (X2). With this aim, the mathematical principles described in Section 2.3 were applied to the experimental data (Table 2), obtaining the values included in Table 3 and Table 4 in terms of normalized values. Data on percentages of total solids solubilization (xtotal solids), hemicellulose conversion (xhemicellulose) and cellulose conversion (xcellulose) were obtained by relating the weight of each material removed during the acid pretreatment (total solids, hemicellulose and cellulose, respectively) to the weight of each material available in the raw material, and multiplying the result by one hundred. All equations were validated using the ANOVA test using the MODDE software. The R2 values obtained for the seven equations varied between 0.925 and 0.999 (Table 3 and Table 4), indicating that the models explain between 92.5% and 99.9% of the variability contained in the responses.
Figure 1 shows the response surfaces and corresponding contour plots built from data in Table 3 and Table 4. In general, mathematical models show that total solids solubilization, hemicellulose, and cellulose conversions, as well as the percentage of AIL in the pretreated solids, increased with the increase in the severity of pretreatment (temperature and reaction time, Figure 1). Notwithstanding, for xtotal solids and, mainly, for xhemicellulose a stabilization of the conversions was observed at relatively high temperatures and reaction times. Thus, Figure 1B shows that total conversion of the hemicellulose fraction was achieved at around 200 °C, the temperature exerting an effect on the response greater than that of the reaction time.
In relation to the main obtained products in the acid prehydrolysate, the response surfaces for D-xylose yield (Figure 1E) and L-arabinose yield (Figure 1F) presented maximum values within the region studied. Partial differentiation of the multivariate functions Yxyl = f(X1, X2) and Yara = f(X1, X2) was carried out to determinate the values of temperature and time that provide these maximums. The predicted values were 201 °C and 5.2 min, with a response corresponded to 20.1 ± 2.8 g D-xylose per 100 g dry raw material (85.9% D-xylose extraction), and 183.6 °C and 2.08 min, with a response of 1.11 g L-arabinose per 100 g dry raw material. The D-xylose extraction was similar to that achieved in rice straw (80.8%) by other authors, the most suitable conditions to depolymerize xylans into xylose being 201 °C, 10 min retention time and 0.5% sulfuric acid concentration [24]. Figure 1G shows that the highest temperature and reaction time assayed (220 °C and 8 min, respectively) were the best conditions for acetic acid recovery.

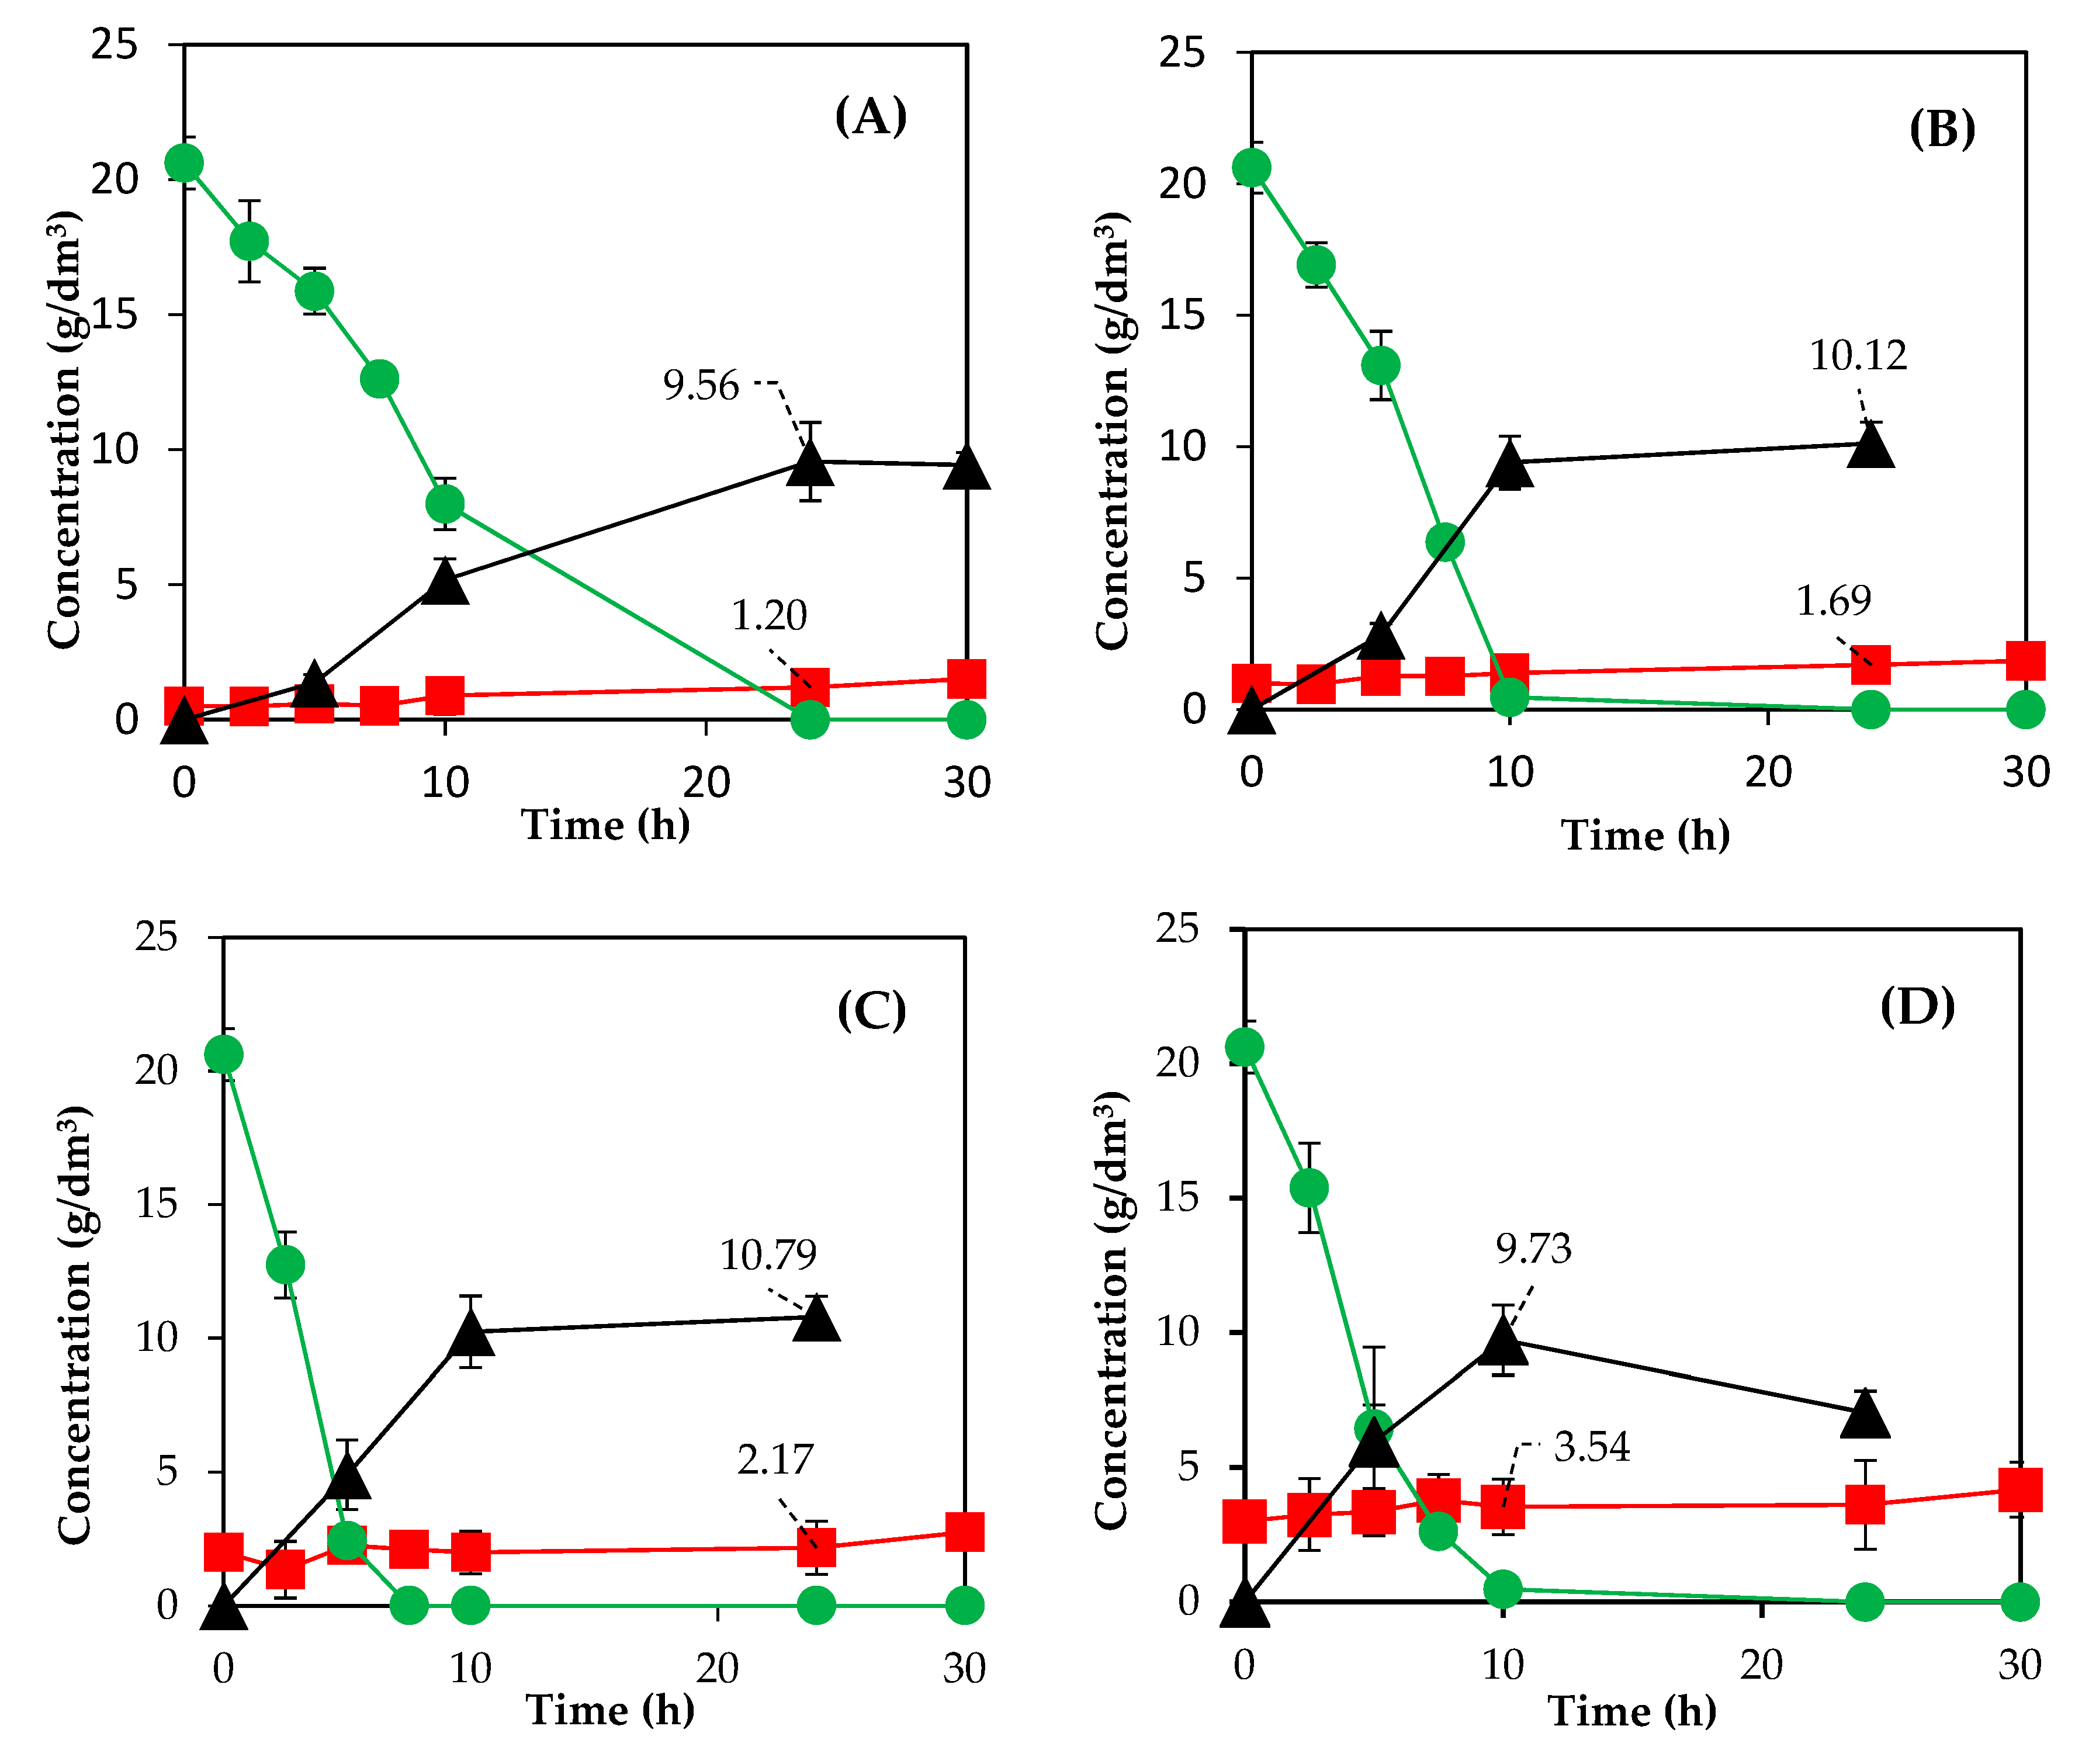
3.3. Fermentation of Acid Prehydrolysates

Figure 2 and Table 5 show the effect of the inoculum concentration on the fermentation of the acid prehydrolysate obtained under the conditions that maximized D-xylose recovery (201 °C—5.2 min), which was previously subjected to vacuum distillation until achieving the following composition (g/dm3): 14.45 D-xylose, 0.73 L-arabinose, 0.28 D-galactose, and 2.23 acetic acid. D-glucose was not detected at the beginning of the fermentation stage. It is worth noting that P. tannophilus yeast completely uptook both D-xylose and acetic acid, although uptake rates depended strongly on the inoculum concentration. Thus, D-xylose was almost depleted in prehydrolysates after 144 h and 48 h for fermentations carried out with initial biomass concentrations of 0.5 g/dm3 and 4.0 g/dm3, respectively (Figure 2). In relation to acetic acid, this compound was completely uptaken within 72 h in all the fermentations. This demonstrate the low inhibition exerted by the medium on P. tannophilus, which is also evident when analyzing the biomass growth data over fermentations. In this sense, there was only a lag phase (about 10 h) in the bioreactor with the lowest initial concentration of microorganism (Figure 2A). The increase in the initial inoculum concentration from 0.5 g/dm3 to 4.0 g/dm3 caused a continuous decrease (from 4.8 g/dm3 to 1.9 g/dm3) in the net biomass production (Table 5). Regarding the production of ethanol and xylitol, it was observed that the latter compound was the main product of cellular metabolism except for fermentations performed with initial inoculum of 4.0 g/dm3. Thus, the maximum concentrations of ethanol and xylitol achieved were 0.25 g/dm3 and 4.81 g/dm3, respectively, for the inoculum of 0.5 g/dm3, and 1.8 g/dm3 and 1.5 g/dm3, respectively, for the inoculum of 4.0 g/dm3 (Table 5). Therefore, the fermentations with the lowest inoculum concentrations were those that led to the highest yields and volumetric xylitol productivity (0.42 g/g and 0.07 g/dm3·h), respectively), which were obtained at 72 h, while the inoculum of 4 g/dm3 led to the highest yield of ethanol (0.17 g/g D-xylose). When comparing these results with those obtained by Saleh et al. [16] it can be pointed out that the decrease in the concentration of sulfuric acid from 0.025 M to 0.010 M in the pretreatment stage results in prehydrolysates with a lower capacity to inhibit P. tannophilus. These sugar media allow reaching, for a fixed inoculum concentration, higher concentrations of ethanol and lower biomass productions. With regards to xylitol, both prehydrolysates reached similar maximum yields (0.42 g/g in this work; 0.44 g/g in the research of Saleh et al. [16]).

3.4. Enzymatic Hydrolysis of Pretreated Solids

The acid pretreatment carried out at 201 °C—5.2 min on the olive stones led to a solid without hemicellulose and rich in cellulose (35.2%) and insoluble acid lignin (40.0%). To study the enzymatic digestibility of pretreated cellulose, enzymatic hydrolyses were carried out with Celluclast 1.5 L using the following enzyme loadings: 10, 20, 40, and 60 FPU/g pretreated solid. The yield in D-glucose, expressed as grams of monosaccharide generated per gram of pretreated solid, over time is shown in Figure 3, showing that the increase in enzyme loading led to the increase in D-glucose yield. Thus, the yields of D-glucose for enzyme loadings of 10, 20, 40, and 60 FPU/g solid were 0.131, 0.137, 0.316, and 0.342 g D-glucose per gram of solid, respectively, at 120 h of reaction, which are equivalent to values of 0.335, 0.350, 0.808, and 0.875 g D-glucose per gram of potential D-glucose in pretreated cellulose. The above data illustrate the capacity of Celluclast 1.5L to hydrolyze above 80% of pretreated cellulose, although high cellulases loadings are required for this. These data could prove that the pretreatment is capable of considerably increasing the porosity of the solid and, therefore, the accessibility of the enzyme to the pretreated cellulose, although high catalyst loadings are necessary to compensate for the losses caused by the adsorption of protein on the pretreated lignin. Fernandez et al. achieved 83% glucan conversion from extracted olive pomace that was previously subjected to autohydrolysis at 230 °C [25].

3.5. Fermentation of Enzymatic Hydrolysates

The enzymatic hydrolysate obtained in Section 3.4, using an enzyme loading of 40 FPU/g pretreated solid, was diluted with water up to achieve a D-glucose concentration of 20.6 g/dm3 in order to ferment it with P. tannophilus. The evolution over time of the fermentations carried out with four inoculum levels (0.5, 1.0, 1.5, and 3.0 g/dm3) is shown in Figure 4. The absence of fermentative inhibitors caused D-glucose uptake to be completed within 24 first hours for the inoculum of 0.5 g/dm3, and in around 10 h for the rest of inocula. In these fermentations, the yeast generated ethanol as the main product along with a low biomass production. Thus, for initial yeast concentrations of 0.5, 1.0, 1.5, and 3.0 g/dm3, the final biomass concentration were 1.51, 1.85, 2.75, and 4.18 g/dm3, respectively. The maximum ethanol concentrations detected for the inocula 0.5, 1.0, 1.5, and 3.0 g/dm3 were 9.6, 10.1, 10.8, and 9.7 g/dm3, respectively, resulting in ethanol yields of 0.464, 0.491, 0.523, and 0.472 g ethanol per g D-glucose, respectively, i.e., values close to the stoichiometric maximum.

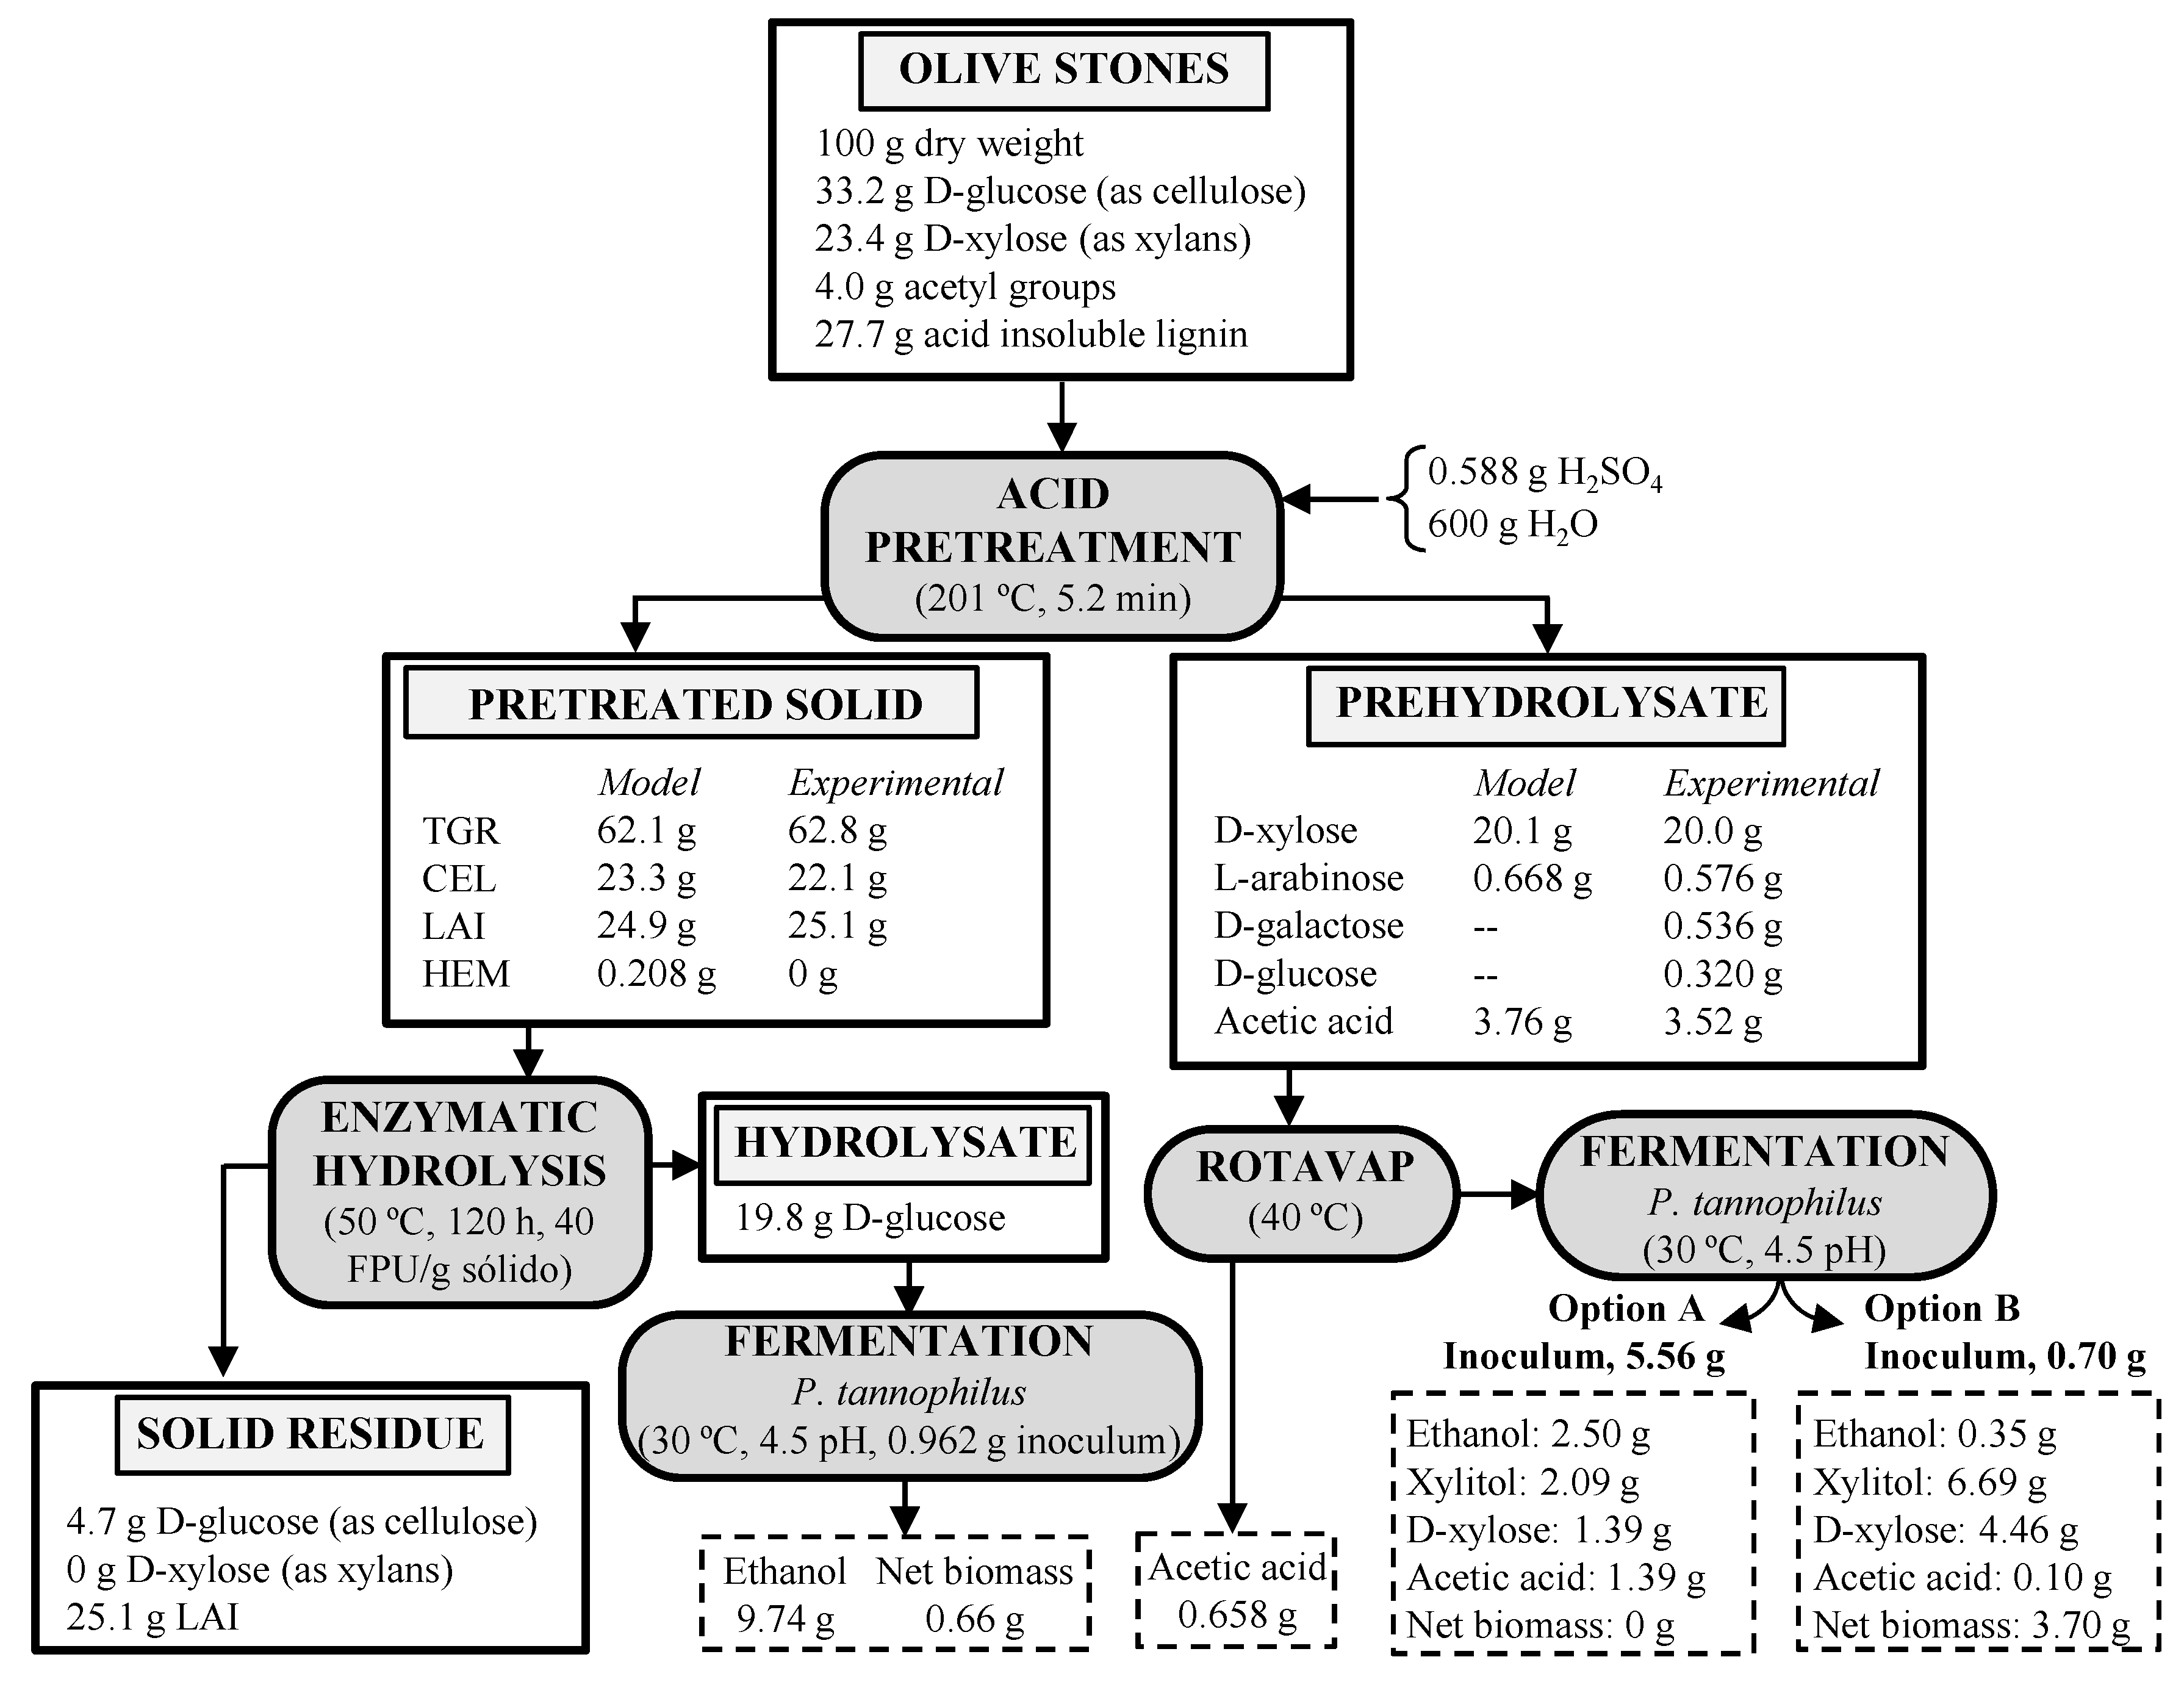
3.6. Mass Macroscopic Balance for Complete Process

Figure 5 shows the mass balance for the complete ethanol production process developed in this work. When 100 g of olive stones were pretreated at 201 °C—5.2 min with 0.010 M sulfuric acid, a liquid prehydrolysate was obtained with the maximum recovery of D-xylose achieved in this work (20.0 g, equivalent to 85.6% monosaccharide recovery) along with a hemicellulose-free solid residue, rich in acid insoluble lignin and cellulose. The enzymatic hydrolysis of the pretreated solid led to high amounts of D-glucose (19.8 g), which were easily metabolized by P. tannophilus, rendering 9.7 g ethanol. With regards to the liquid prehydrolysate, the previous vacuum distillation to concentrate fermentable sugars allowed P. tannophilus to ferment them into ethanol or xylitol. This fermentative stage was strongly influenced, both on its duration and on the production of ethanol and xylitol, by the initial yeast concentration so that two alternative schemes could be considered. In the first scheme (option A, Figure 5), using an initial inoculum concentration of 4 g/dm3, similar amounts of ethanol (2.50 g) and xylitol (2.09 g) would be obtained after 48 h fermentation. In the scheme B an inoculum of 0.5 g/dm3 would be used, and a much richer medium in xylitol (6.69 g) than in ethanol (0.35 g) would be obtained after 72 h fermentation, 4.46 g D-xylose remaining in the fermentation culture. Although the first scheme would generate a total of 12.2 g ethanol per 100 of olive stones, in the second scheme the lower production of ethanol (10.1 g/100 g olive stones) could be compensated with an important production of xylitol, which could reach 8.42 g if the whole D-xylose present in the fermentation medium were used.

4. Conclusions

The proposed flowsheet for the fractionation of the olive stones led to a suitable valorization of their hemicellulose fraction. In this sense, the application of a response surface methodology to the acid hydrolysis stage led to high D-xylose recovery into the liquid prehydrolysate, which could be fermented into ethanol and xylitol using the non-traditional yeast P. tannophilus. The production of these compounds was strongly influenced by the initial concentration of inoculum in the fermentation stage, and fermentation conditions that led to high xylitol production were found. To be specific, starting from a yeast concentration of 0.5 g/dm3 each gram of D-xylose consumed by P. tannophilus was transformed into 0.42 g of xylitol. In relation to the pretreated solids, these materials led to hydrolysates rich in D-glucose (35 g/dm3) when high loadings of cellulases were used, i.e., 40 FPU/g pretreated solid. Therefore, the enzymatic hydrolysis stage still remains to be upgraded in order to reduce operating costs and thus enhance the feasibility of the overall process.

Author Contributions

M.C. performed some experiments and the analysis of the data, and contributed to the aspects related to the design of figures and writing the initial draft paper; M.S. performed some experiments; J.F.G.-M. performed the English translation, text and figures formatting and revision of the paper; S.S. provided the funding, performed the experimental design, and contributed to the revision of the paper. All authors have read and agreed to the published version of the manuscript.

Funding

This work was funded the projects 01272/2005 and AGR/6509 granted by Andalusia Regional Government (Spain).

Acknowledgments

Marwa Saleh wish to thank her grant from the AECI (Spain). The authors also thank to Novo Nordisk Bioindustrial (Madrid, Spain) and ‘S.C.A. San Juan’ (Jaén, Spain) for providing the enzyme preparation and the olive stones, respectively, used throughout this research.

Conflicts of Interest

The authors declare no conflict of interest.

References

  1. Dhillon, R.S.; Wuehlisch, G.V. Mitigation of global warming through renewable biomass. Biomass Bioenergy 2013, 48, 75–89. [Google Scholar] [CrossRef]
  2. Balat, M. Production of bioethanol from lignocellulosic materials via the biochemical pathway: A review. Energy Convers. Manage. 2011, 52, 858–875. [Google Scholar] [CrossRef]
  3. Prasad, R.K.; Chatterjee, S.; Mazumder, P.B.; Gupta, S.K.; Sharma, S.; Vairale, M.G.; Datta, S.; Dwivedi, S.K.; Gupta, D.K. Bioethanol production from waste lignocelluloses: A review on microbial degradation potential. Chemosphere 2019, 231, 588–606. [Google Scholar] [CrossRef] [PubMed]
  4. Bhatia, S.K.; Jagtap, S.S.; Bedekar, A.A.; Bhatia, R.K.; Patel, A.K.; Pant, D.; Banu, R.; Rao, C.V.; Kim, Y.-G.; Yang, Y.-H. Recent development in pretreatment technologies on lignocellulosic biomass: Effect of key parameters, technological improvements, and challenges. Bioresour. Technol 2020, 121936. [Google Scholar] [CrossRef] [PubMed]
  5. Kumar, P.; Barret, D.M.; Delwiche, M.J.; Stroeve, P. Methods for pretreatment of lignocellulosic biomass for efficient hydrolysis and biofuel production. Ind. Eng. Chem. Res. 2009, 48, 3713–3729. [Google Scholar] [CrossRef]
  6. Cuevas, M.; García, J.F.; Sánchez, S. Enhanced enzymatic hydrolysis of pretreated almond-tree prunings for sugar production. Carbohydr. Polym. 2014, 99, 791–799. [Google Scholar] [CrossRef] [PubMed]
  7. Cao, L.; Chen, H.; Tsang, D.C.W.; Luo, G.; Hao, S.; Zhang, S.; Chen, J. Optimizing xylose production from pinewood sawdust through dilute-phosphoric-acid hydrolysis by response surface methodology. J. Clean. Prod. 2018, 178, 572–579. [Google Scholar] [CrossRef]
  8. Jang, S.-K.; Kim, J.-H.; Jeong, H.; Choi, J.-H.; Lee, S.-M.; Choi, I.-G. Investigation of conditions for dilute acid pretreatment for improving xylose solubilization and glucose production by supercritical water hydrolysis from Quercus mongolica. Renew. Energy 2018, 117, 150–156. [Google Scholar] [CrossRef]
  9. García-Martín, J.F.; Sánchez, S.; Cuevas, M. Evaluation of the effect of the dilute acid hydrolysis on sugars release from olive prunings. Renew. Energy 2013, 51, 382–387. [Google Scholar] [CrossRef]
  10. Sánchez, S.; Bravo, V.; Moya, A.J.; Castro, E.; Camacho, F. Influence of temperature on the fermentation of D-xylose by Pachysolen tannophilus to produce ethanol and xylitol. Process Biochem. 2004, 39, 673–679. [Google Scholar] [CrossRef]
  11. Cuevas, M.; Sánchez, S.; García, J.F. Thermochemical and biochemical conversion of olives stones. In Agricultural Wastes: Characteristics, Types and Management; Foster, C.N., Ed.; Nova Science Publishers: New York, NY, USA, 2015; pp. 61–86. [Google Scholar]
  12. Miranda, I.; Simões, R.; Medeiros, B.; Nampoothiri, K.M.; Sukumaran, R.K.; Rajan, D.; Pereira, H.; Ferreira-Dias, S. Valorization of lignocellulosic residues from the olive oil industry by production of lignin, glucose and functional sugars. Bioresour. Technol. 2019, 292, 121936. [Google Scholar] [CrossRef] [PubMed]
  13. Cuevas, M.; Sánchez, S.; Bravo, V.; Cruz, N.; García, J.F. Fermentation of enzymatic hydrolysates from olives stones by Pachysolen tannophilus. J. Chem. Technol. Biotechnol. 2009, 84, 461–467. [Google Scholar] [CrossRef]
  14. Cuevas, M.; García, J.F.; Hodaifa, G.; Sánchez, S. Oligosaccharides and sugars production from olive stones by autohydrolysis and enzymatic hydrolysis. Ind. Crops Prod. 2015, 70, 100–106. [Google Scholar] [CrossRef]
  15. Romero-García, J.M.; Martínez-Patiño, C.; Ruiz, E.; Romero, I.; Castro, E. Ethanol production from olive stone hydrolysates by xylose fermenting microorganisms. Bioethanol 2016, 2, 51–65. [Google Scholar] [CrossRef]
  16. Saleh, M.; Cuevas, M.; García, J.F.; Sánchez, S. Valorization of olive stones for xylitol and ethanol production from dilute acid pretreatment via enzymatic hydrolysis and fermentation by Pachysolen tannophilus. Biochem. Eng. J. 2014, 90, 286–293. [Google Scholar] [CrossRef]
  17. Sánchez, S.; Bravo, V.; Castro, E.; Moya, A.J.; Camacho, F. The fermentation of mixtures of D-glucose and D-xylose by Candida shehatae, Pichia stipitis or Pachysolen tannophilus to produce ethanol. J. Chem. Technol. Biotechnol. 2002, 77, 641–648. [Google Scholar] [CrossRef]
  18. Van Soest, P.J.; Wine, R.H. Use of detergent in the analysis of fibrous feeds. IV. Determination of plant cell-wall constituents. J. Assoc. Off. Anal. Chem. 1967, 50, 50–55. [Google Scholar]
  19. Sluiter, A.; Hames, B.; Ruiz, R.; Scarlata, C.; Sluiter, J.; Templeton, D.; Crocker, D. Determination of Structural Carbohydrates and Lignin in Biomass. In Laboratory Analytical Procedure (LAP); NREL/TP-510-42618; National Renewable Energy Laboratory: Golden, CO, USA, 2012. [Google Scholar]
  20. Puls, J.; Poutanen, K.; Körner, H.; Viikari, L. Biotechnical utilization of wood carbohydrates after steaming pretreatment. Appl. Microbiol. Biotechnol. 1985, 22, 416–423. [Google Scholar] [CrossRef]
  21. Beutler, H.O. Ethanol. In Methods of Enzymatic Analysis; Bergmeyer, H., Ed.; Academic Press: New York, NY, USA, 1974; pp. 594–606. [Google Scholar]
  22. Beutler, H.O.; Becker, J. Enzymatische bestimmung von D-sorbit und xylit in lebensmitteln. Dtsch. Lebensmitt. Rundsch. 1977, 6, 182–187. [Google Scholar]
  23. Bergmeyer, H.; Möllering, H. Acetic acid. In Methods of Enzymatic Analysis; Bergmeyer, H., Ed.; Academic Press: New York, NY, USA, 1974; pp. 1520–1528. [Google Scholar]
  24. Karimi, K.; Kheradmandinia, S.; Taherzadeh, M.J. Conversion of rice straw to sugars by dilute-acid hydrolysis. Biomass Bioenergy 2006, 30, 247–253. [Google Scholar] [CrossRef]
  25. Fernandes, M.C.; Brás, T.S.; Lourenço, P.M.L.; Duarte, L.C.; Carvalheiro, F.; Bernardo, P.; Marques, S.; Neves, L.A. The effect of autohydrolysis pretreatment on the production of second generation bioethanol from extracted olive pomace. In Proceedings of the 4th International Conference on Engineering for Waste and Biomass Valorisation, Porto, Portugal, 10–13 September 2012. [Google Scholar]
Figure 1. Response surfaces and contour plots for (A) total solids solubilization, (B) hemicellulose conversion, (C) cellulose conversion, (D) acid-insoluble lignin percentage, (E) D-xylose yield, (F) L-arabinose yield, and (G) acetic acid yield as a function of reaction temperature (°C) and reaction time (min) at fixed acid concentration of 0.010 M.
Processes 08 00195 g001
Figure 2. Acid prehydrolysate: Effect of inoculum concentration ((A), 0.5 g/dm3; (B), 1.0 g/dm3; (C), 2.0 g/dm3; (D), 4.0 g/dm3) on D-xylose () and acetic acid () consumption, and biomass () and xylitol (▲) production by P. tannophilus at 30 °C and pH 4.5.
Processes 08 00195 g002
Figure 3. Enzymatic digestibility of acid-pretreated olive stones (201 °C, 5.2 min) at different enzyme loadings.
Processes 08 00195 g003
Figure 4. Effect of inoculum concentration ((A), 0.5 g/dm3; (B), 1.0 g/dm3; (C), 1.5 g/dm3; (D), 3.0 g/dm3) on D-glucose consumption (), and biomass () and ethanol (▲) production by P. tannophilus at 30 °C and pH 4.5.
Processes 08 00195 g004
Figure 5. Mass macroscopic balance for the ethanol production flowsheet proposed: Acid pretreatment of olive stones, enzymatic hydrolysis of pretreated solids, detoxification with rotary evaporator and fermentation of hydrolysates using P. tannophilus.
Processes 08 00195 g005
Table 1. Operational conditions assayed as dimensional and dimensionless independent variables.
RunTemperature (°C)Time (min)
Actual Values (T)Coded Values (X1)Actual Values (t)Coded Values (X2)
117205.00−1.414
2180−12.00−1
318018.00−1
4200−1.4140.760
520005.000
620005.000
720005.000
82001.4149.240
9220−12.001
1022018.001
1122805.001.414
Table 2. Total gravimetric recovery and composition of acid-pretreated solids, and products yields (as g/100 g dry raw material) in the prehydrolysates obtained at different acid hydrolysis conditions.
Acid-Treated Solids aPrehydrolysates
Run NumberTtTGRHemCelAILProduct Yield (as g/100 g Dry Raw Material)
(°C)(min)(%)(%)(%)(%)D-XyloseL-ArabinoseD-GalactoseD-GlucoseAA5-HMF
1172586.5323.0530.3832.011.070.920.11<0.012.47<0.01
2180282.9616.7233.3532.871.451.110.14<0.011.45<0.01
3180873.559.4235.5635.445.530.770.25<0.012.71<0.01
42000.7667.562.3137.7235.9710.381.040.34<0.013.43<0.01
5200562.470.0037.7640.0418.990.870.49<0.013.44<0.01
6200563.551.0335.9738.9621.830.970.62<0.013.34<0.01
7200562.320.0036.9340.9819.310.850.50<0.013.77<0.01
82009.2460.520.0038.6242.0713.900.320.42<0.014.120.03
9220258.450.0033.2044.208.170.430.240.244.590.12
10220856.780.0032.0245.874.570.210.231.465.770.80
11228556.540.0025.1048.642.810.120.171.635.291.07
a Chemical composition of 100 g of olive stones: 29.9 ± 1.1 g cellulose, 28.1 ± 1.7 g hemicellulose (of which 20.6 ± 1.1 g xylans and 4.0 ± 0.2 g acetyl groups), 27.7 ± 2.1 g acid-insoluble lignin, 2.1 ± 0.3 g acid-soluble lignin, 6.0 ± 0.3 g extractives, and 0.7 ± 0.0 g ash. TGR: total gravimetric recovery; Hem: hemicelluloses; Cel: cellulose; AIL: acid insoluble lignin; AA: acetic acid; 5-HMF: 5-hydroxymethylfurfural.
Table 3. Acid-pretreated solids: Estimated effects (EE), standard deviations (SD), and significance level (p) for the models representing total solids solubilisation (xtotal solids), hemicellulose conversion (xhemicellulose), cellulose conversion (xcellulose), and acid insoluble lignin percentages (AIL).
Response VariableCoefficientEESDp-Value (Prob > F)R2Radjust2
xtotal solids, %Constant37.220±0.2905.460 × 10−100.9990.996
X110.462±0.1782.674 × 10−8
X22.630±0.1782.547 × 10−5
X1 · X1−4.415±0.2124.673 × 10−6
X2 · X2−0.667±0.2122.532 × 10−2
X1 · X2−1.935±0.2515.891 × 10−4
xhemicellulose, %Constant98.430±1.9644.238 × 10−90.9780.964
X121.829±1.6531.166 × 10−5
X24.075±1.6534.882 × 10−2
X1 · X1−16.978±1.8811.036 × 10−4
X1 · X2−6.183±2.3383.831 × 10−2
xcellulose, %Constant22.557±0.7701.051 × 10−70.9940.990
X113.938±0.4729.964 × 10−8
X22.391±0.4722.289 × 10−3
X1 · X14.445±0.5622.159 × 10−4
X2 · X2−2.565±0.5623.819 × 10−3
AIL, %Constant39.732±0.2837.366 × 10−150.9750.969
X15.660±0.3321.411 × 10−7
X21.608±0.3321.272 × 10−3
X1: temperature (in coded form), X2: time (in coded form). Significance level was defined as p < 0.05.
Table 4. Acid prehydrolysates: Estimated effects (EE), standard deviations (SD), and significance level (p) for the models representing D-xylose (Yxyl), L-arabinose (Yara) and acetic acid (YAA) yields.
FactorsRegression
ResponsesEESDp-Value (Prob > F)R2Radjust2p-Value
Yxyl, %Constant20.044±1.0838.478 × 10−60.9700.9390.001
X11.028±0.6631.820 × 10−1
X20.682±0.6633.509 × 10−1
X1 · X1−9.581±0.7906.717 × 10−5
X2 · X2−4.480±0.7902.368 × 10−3
X1 · X2−1.920±0.9389.602 × 10−2
Yara, %Constant0.897±0.0481.512 × 10−60.9670.9450.000
X1−0.296±0.0295.496 × 10−5
X2−0.197±0.0295.294 × 10−4
X1 · X1−0.181±0.0352.069 × 10−3
X2 · X2−0.101±0.0352.791 × 10−2
YAA, %Constant3.671±0.1151.029 × 10−90.9250.9060.000
X11.274±0.1351.321 × 10−5
X20.427±0.1351.341 × 10−2
X1: temperature (in coded form), X2: time (in coded form). Significance level was defined as p < 0.05.
Table 5. Maximum parameters of xylitol, ethanol and biomass production by P. tannophilus from hemicellulose hydrolysates obtained by sulfuric-acid hydrolysis of olive stones. Effect of inoculum concentrations.
Starting Inoculum Concentration (g/dm3)0.51.02.04.0
Net biomass concentration (g/dm3)4.8 ± 0.2
(120 h) 1
4.6 ± 0.7
(72 h)
3.2 ± 0.1
(72 h)
1.9 ± 0.2
(72 h)
Ethanol concentration (g/dm3)0.25 ± 0.00
(10 h)
0.41 ± 0.04
(10 h)
0.97 ± 0.10
(10 h)
1.8 ± 0.1
(10 h)
Xylitol concentration (g/dm3)4.81 ± 1.63
(72 h)
3.25 ± 0.59
(48 h)
2.43 ± 0.30
(48 h)
1.50 ± 0.05
(48 h)
Xylitol yield 2 (g/g)0.42 ± 0.08
(72 h)
0.26 ± 0.08
(48 h)
0.18 ± 0.01
(48 h)
0.14 ± 0.02
(48 h)
Xylitol volumetric productivity (g/dm3·h)0.07 ± 0.01
(72 h)
0.07 ± 0.02
(48 h)
0.05 ± 0.01
(48 h)
0.04 ± 0.00
(48 h)
1 Culture time, at which the parameter was calculated, is shown in brackets. 2 Based on consumed D-xylose.

