1. Introduction
Renewable energy, that is practically ony wind and solar, cannot cover the world’s total primary energy supply by 2050. The power needed by wind and solar, and the power and energy needed from the storage, are impossible to be achieved. Hence, there is a need to valorize fossil fuel resources, natural gas, oil, coal, as well as use uranium to better convert fossil fuel energy, and further reduce the environmental impact of their use. Not many are working on engines anymore; despite this fact, the world’s growing total primary energy supply is still covered—by more than 90%—by combustion fuels, oil, coal, natural gas, biomass, and waste [
1]. Since 1990, the contribution by combustion fuels has not changed at all; their use is increasing, with a constant share of the growing total [
1]. Solar and wind, presently at 2% of the total primary energy supply, will not be able to satisfy the total primary energy supply by 2050 in a growing world. In addition to the limited opportunities to grow their installed capacity, there are even more limited opportunities to grow the energy storage needed to compensate wind and solar intermittency and unpredictability [
2,
3]. Hence, it still makes a lot of sense to improve the fuel conversion efficiency of internal combustion engines (ICEs), and improve their environmental friendliness, especially with alternative fuels. Under this reasonable perspective, there are opportunities to make more efficient ICEs, either with traditional fuel, or even better, with low carbon fuels (e.g., natural gas (NG)), or with zero-carbon fuels (e.g., hydrogen). As we still need internal combustion engines, there is the opportunity to design more fuel-efficient engines, especially for low carbon fuels. This could drastically improve CO
2 emissions, while also improve the use of natural resources. By replacing a conventional diesel engine with a higher efficiency, diesel-liquefied natural gas (LNG) engine, there is the advantage of the C/H ratio of the fuel, the advantage of reduced depletion of natural resources, the advantage of reduced emissions of pollutants, starting from PM, the diversification of fuel sources, the security of the fuel sources, see references from [
4,
5,
6,
7,
8,
9,
10,
11,
12,
13,
14,
15,
16,
17,
18,
19,
20,
21,
22], just to mention a few. The starting point for this work is given in [
4], which describes the advantages of diesel-LNG engines. Here, the focus is on the better shaping of the heat release rate curve, thanks to the use of very high injection pressures of 1600 bar.
The development of high-power density high-efficiency ICEs, fueled with fuels that are gas at normal conditions, is becoming increasingly relevant. Some of the most promising designs are the dual-fuel, diesel injection ignition, direct injection (DI), and the compression ignition (CI). Further improvement of these engines calls for better-dedicated injectors, see references from [
23,
24,
25,
26,
27]. These injectors must work at high pressures, with cryogenic fluids, delivering substantial amounts of fuel flow energy within brief time frames, with high speeds of actuation. The aim of this work is to investigate the benefit that a higher pressure direct injector may offer in an ICE environment characterized by a high boost and a high compression ratio, typical of the latest racing diesel ICEs. A high compression ratio translates into high thermal efficiency, while a high boost translates into high power density. High boost and high compression ratio are two requirements of today’s diesel engines—for passenger cars, but especially for racing car applications. Diesel engines for passenger cars, such as the 3.0l V6 turbo direct injection (TDI) engine developed by Audi for the VW Phaeton and Touareg, have a compression ratio of 17, coupled to a high boost turbocharger to deliver a maximum torque of 500 Nm, which translates into a brake mean effective pressure (BMEP) of 20.94 bar.
High-pressure DI injectors were proposed in the past to work with gaseous fuels up to 200 bar, delivering up to 23 g/s of methane with effective minimum passage areas of about 0.8 mm
2. The adoption of injection pressures of 1600 bar, coupled to the cryogenic delivery of the liquefied natural gas (LNG) at 113 K, allows much larger flow rates per unit of effective flow area; thus, allowing much larger fuel energy flows with smaller injectors, that are lighter and much faster actuating. Simulations are presented for a dual fuel diesel-LNG engine, featuring two injectors per cylinder, one for the diesel, and one for the LNG. The LNG injector is one of these new generation injectors. While the coupling of a pilot/pre-injection of diesel with a main injection of LNG is straightforward; mixed modes of combustion are also possible, injecting a part of the LNG before, and a part of the LNG after the diesel injection ignition occurs, see again references from [
23,
24,
25,
26,
27]. The LNG injected, prior or contemporary to the diesel, then burns premixed, and the LNG injected after the diesel combustion starts, then it burns diffusion controlled. The engine features a high boost and high compression ratio. It has a super turbocharger, where the turbocharger shaft is connected to the crankshaft by gears and a continuously variable transmission (CVT), to produce the required boost in any operating condition, either steady or transient. The super turbocharger also allows the recovery of the extra energy at the turbine, either steady or transient, references [
28,
29,
30,
31]. In a hybrid powertrain, the super-turbocharger may also be replaced by an F1 style [
32] electrically assisted turbocharger where the extra energy to the turbocharger, or the extra energy from the turbocharger, is drawn from or delivered to the traction battery via a motor-generator unit. In this case, the apparent steady-state efficiency of the engine is larger, especially at low speeds and high loads, as the extra power at the compressor is delivered by the electric motor. At high speed and loads, the apparent steady-state efficiency is otherwise marginally smaller as the extra power at the turbine is delivered to the electric generator.
One example of promising gas injectors that did not evolve to widespread products was the Hoerbiger injector. This direct injection injector was developed as part of the BMW effort towards improved hydrogen engines during the first decade of this century, see references [
33,
34,
35]. The high-pressure direct injector GV1 had an equivalent flow area of 0.8 mm
2, maximum inlet pressure 200 bar, nom. inlet pressure 150 bar. It was intended for operation with maximum cylinder pressure 150 bar. It was also operated at 300 bar of pressure. The steady-state flow rate with compressed natural gas (CNG), i.e., gaseous methane, was 23 g/s. The operating temperature was −40 °C to 120 °C. Internal leakage was <0.2%, and injection accuracy ±2%. The minimum injection duration was 1.0 ms and response time ~0.5 ms. There was also a version of the direct injector with active closing (double acting). The equivalent flow area was 0.7 mm
2. The maximum inlet pressure was 200 bar and the nom. inlet pressure 150 bar. The maximum cylinder pressure was 180 bar. The steady-state flow rate (CNG) was 20 g/s. The operating temperature was −40 °C to 120 °C, the internal leakage <0.1%, the injection accuracy ±2%, the minimum injection duration 0.5 ms and the response time ~0.1 ms. These injectors, which had solenoid designs, were very far from delivering the same speed of actuation and energy flow rates of highly atomized diesel fuel permitted by the latest 2850 bar piezo diesel injectors, extremely helpful in shaping the heat release rate curve by shaping the fuel injection profile to match performance and emission criteria within constraints of maximum pressure and rate of pressure build-up dp/dθ (
p pressure, θ crank angle).
It is also very well known, from the experience by Westport, references [
36,
37,
38,
39,
40,
41,
42], to name a few references, with thousands of heavy-duty trucks, diesel engines converted to diesel-LNG by using their patented dual-fuel diesel-LNG injector; when replacing the main injection of the diesel with a main injection of the LNG, there is no penalty in the fuel conversion efficiency, nor in the BMEP output. The Westport results are supported by engine performance simulations, engine laboratory experiments, and the experience of heavy-duty truck drivers.
The innovation proposed in this paper vs. prior studies, such as [
4], is the opportunity to use very high pressure (1600 bar) for the injection of liquefied natural gas (LNG) in a dual fuel diesel-LNG engine. As demonstrated for the diesel, injection pressures matter. In the diesel, injection pressures have dramatically increased during the 25 years between 1990 and 2015, from 1000 to almost 3000 bar. This increment allowed the delivery of much better power densities and fuel conversion efficiencies, while also reducing the pollutant formation within the cylinder, within constraints of peak pressure and rate of pressure build-up, through the shaping of the heat release curve. For diesel engines designed for the early 1990s, injection pressures were between 1000 and 1200 bar versus the pre-1990s level of 650 to 700 bar. In 2013, injectors using pressures up to 2850 bar were already considered. The increment of the injection pressure has many benefits. The higher pressure allows the increase of the flow rate per unit area; thus, permitting smaller and lighter injectors, of faster actuation, for enhanced injector-shaping capabilities. Therefore, the paper is not just about a higher injection pressure, it is about the enhanced capabilities of shaping the heat release curve thanks to higher injection pressure, in the case of LNG, as it has been done for the diesel.
The sample simulations are based on a diesel racing engine studied in 2013 and 2014. The numerical model for the diesel-LNG engine is obtained by only adding a second direct injector for the LNG, to the numerical model for the diesel only. The proposed concept is applicable to engines for passenger cars, light-duty trucks, racing cars, but mostly heavy-duty trucks. The limit of peak pressure obviously changes according to the specific application, the same for the details of the injection. Injection shaping is generally performed by targeting specific fuel conversion efficiency within the specific constraints of peak pressure, the gradient of peak pressure, peak temperature, pollutants, and others.
2. Materials and Methods
A numerical method is used to describe the operation of the engine featuring the proposed high-pressure direct injector specific to LNG. This section describes the model. Then, the following section proposes the results. Engine performance simulations are performed using state-of-the-art engine performance simulations. Details of the engine system are provided below, as well as the injector modeling, and the modeling of the super-turbocharger, which are not conventional engine system components. Engine performance simulations are performed by using state of the art computer-aided engineering (CAE) computer codes modeling the steady-state operation of super-turbocharged diesel and methane engines. Engine performance simulations were performed by using very well-known commercial CAE software tools. As these codes have now been around for more than 40 years, with well-known skills and limitations, their description is unnecessary. Pollutant emissions, as well as transients, are disregarded in the present study.
The fuel flow rates per unit cross-sectional area, for natural gas, at normal temperatures and different pressures, are considered first. Usually, compressed natural gas (CNG) is pressurized to 300 bar, but as Westport considers higher pressures of 600 bars for the injection of cryogenic fuel (LNG), there is a column detailing the operation with CNG at 600 bar. Then, the injection of natural gas at cryogenic temperatures (LNG) is considered, with injection pressures up to 1600 bar.
Gas and liquid injector flow equations are different. For gas, while the flow rate is independent of backpressure if the flow is choked, it obviously depends on the upstream pressure (p
0) and temperature (T
0) and the specific gas properties. The gas constant (R) and specific heat ratio (γ) of methane impact on the choked flow conditions. The flow equation for a choked nozzle is the following [
43]:
where A is the effective minimal area. For methane, the gas constant R is 518.28 J/kg K and the specific heat ratio γ is 1.31. For 8 holes, 0.4 mm diameter holes’ injector, having a discharge coefficient of 0.8, the geometric minimal area is 1.01·10
−6 m
2 and the effective minimal area A is 8·10
−7 m
2.
Table 1 presents the mass flow rates for methane CH
4 gas injected through an injector with a choked flow area of 8·10
−7 m
2 at various pressures, and ambient temperature 300 K. As the latest injectors by Westport for LNG are being developed for 600 bar [
44], this option is also included in
Table 1 for CNG. The table provides a steady fuel flow rate (
) and the fuel energy flow rate (
·LHV), with LHV the lower heating value. The lower heating value LHV is the amount of heat released by combustion of a kg of fuel and returning the temperature of the combustion products to 150 °C. Opposite to the higher heating value, the latent heat of vaporization of water in the reaction products is not recovered. As the combustion of the fuel injected after the diesel injection ignition has occurred is limited by the diffusion of the quickly vaporized fuel, and the mixing with air, the fuel energy flow rate is an important parameter in shaping the heat release rate curve. In addition, the actuation speed is relevant. Clearly, moving from 200 to 300 and then 600 bar, there is a drastic increment of
and
·LHV.
To further increase the fuel flow rate, as well as the fuel energy flow rate, making the injector smaller and much quicker to operate, there is the need to move to cryogenic injection temperatures, 113 K for methane. At this temperature, methane is liquid. Having high pressure and lower temperature allows the increase of flow rate per unit effective flow area; thus, making injectors smaller and faster actuating, but delivering high flow with high atomization. Injection shaping is mandatory for building high-efficiency, high power density, and dual fuel diesel injection ignition DI CI engines. Properties of methane are given in
Table 2. Data is from [
45]. The Joule–Thomson effect represents the temperature change of a real gas or liquid when forced adiabatically through a valve [
46]. The inversion temperature on methane expansion at a low temperature is a relevant phenomenon presently neglected in engine models that should be otherwise accounted for. The isobaric properties of methane are available with a minimum temperature limit. This is the highest of the following values 90.69 K, and the temperature at which a density of 451.48 kg/m
3 is reached. Additionally, there is a maximum value of the temperature of 625 K. Concerning the isothermal properties, the acceptable range of temperatures is 90.7 to 625.0 K. The pressure is limited to the value at which a density of 451.48 kg/m
3 is reached [
45], is not covering the opportunity of having pressure 1600 bar and temperature 113 K. The minimum temperature available with 1600 bar is 127 K. The maximum pressure available with 113 K is 900 bar. The properties of LNG in the range of pressures and temperatures of interest, down from 1600 bar and up from 113 K, are obtained by approximating the isothermal and isobaric curves of [
45], extrapolated for the missing values with polynomials and interpolating between them. Every parameter is given as a function of pressure and temperature.
For incompressible flow [
43], the mass flow rate may be simply approximated as:
where
is the density and p
c is the downstream chamber pressure. Again, A is the effective minimal area, i.e., the geometric area multiplied by a discharge coefficient. By taking p
0 = 600·10
5 Pa and p
c = 150·10
5 Pa, we have for methane a steady fuel flow rate
of 162.81 g/s, and a similarly increased fuel energy flow rate
·LHV of 8141 kJ/s. By increasing the injection pressure to 1600 bar, mass and energy flow rates further increase, see
Table 3. This permits to drastically reduce the geometric flow areas, for reduced weight, and faster actuation of the injector in a piezo or solenoid design. Another relevant factor is the improved atomization of LNG with higher pressure, because of the smaller diameters of the nozzles, and the larger injection pressure. The above approach provides values for the mass flow rate to be used as an indication of the potentials of the cryogenic high-pressure strategy. Actual injection parameters may be slightly different [
47,
48], because of the compressibility of the liquid fluid and the vaporization across the injector. Modeling of diesel injectors is usually performed by considering a compressible liquid fuel that may change phase to a vaporized fuel, [
49,
50,
51,
52]. With methane liquid, compressibility and change of phase are extremely relevant for the way the fluid leaves the injector and then vaporizes. The latent heat of vaporization (HVAP) is then 0.5 kJ/g with methane. Other properties of methane are finally given in
Table 4.
The fuel pump power, needed per unit of fuel flow rate, is roughly Δp/(ρ·η
p), where Δp is the pressure rise, ρ is the density, and η
p the pump efficiency, typically 0.85. This has to be compared with the power produced by the engine per unit fuel flow rate, that is LHV·η
e, where η
e is the engine efficiency, that is approaching 50%. If Δp = 1.6·10
8 Pa and ρ = 500 kg/m
3, since LHV = 50·10
6 J/kg, the ratio of the pump power to engine power is a considerable, but still accep
Table 1.51%. This is less than the power requirement of a 2850 bar diesel injector, where Δp = 2.85·10
8 Pa ρ = 846 kg/m
3 and LHV = 42.6·10
6 J/kg, translating in a ratio of the pump power to engine power of 1.86% (the efficiency of the diesel is also slightly less, further increasing this ratio).
To be precise, as the engine is dual fuel, the total fuel pump power to engine power is the sum of the fuel pump power to engine power of the LNG pump, plus the fuel pump power to engine power of the diesel pump, where, however, both fuels contribute to the total fuel energy. Thus, if α is the fuel energy replacement by LNG, typically 0.95, then the ratio of LNG fuel energy to diesel fuel energy is 1/(1-α), or about 20, and the ratio of LNG mass flow rate to diesel mass flow rate is LHVdiesel/LHVLNG/(1-α), or about 17.44. Hence, the actual ratio of the pump power to engine power is a linear interpolation of the values for LNG only and diesel only weighted by the relative mass fraction, thus an intermediate number much closer to 1.51% than 1.86%, at about 1.53% in the case of α = 0.95.
The engine considered is a 3.7-L TDI V6. The main parameters are proposed in
Table 5. The V6 has a V-angle of 120 degrees.
This engine model was developed as part of a study for the engine of a Fédération Internationale de l’Automobile (FIA) world endurance championship, Le Mans Prototype class 1 hybrid car powered by a diesel engine. The target performances were those expected from the Audi LMP1-H [
54]. The research and development activities were performed in 2013 and 2014. The modeling studies were performed by using Gamma Technologies GT-Power as well as Ricardo Wave. GT-Power and Wave have many similarities, with minimal differences in the physics being represented. The major difference for the specific application is the opportunity for GT-Power to connect the turbocharger shaft to the crankshaft, which is not permitted in Wave. Wave is, however, much simpler and less demanding in terms of computer requirements. The problem was solved in Wave through post-processing, correcting the engine outputs. The models were used to simulate super-turbocharging, with the gears and a continuously variable transmission (CVT) toroidal mechanism, connecting crankshaft and turbocharger shaft, as well as a motor-generator unit connected to the turbocharger shaft of electrically assisted turbocharging. In the latter case, the crankshaft power output had to be depurated of the power from/to the turbocharger shaft during post-processing. Through the motor/generator unit (MGU-H), in this case, the extra power is delivered to, or extracted from, the traction battery, which is also used by the kinetic motor generator unit (MGU-K) delivering power to the wheels, or recovering the braking energy.
Figure 1 presents a sketch of the 2014 GT Power model.
Worthy to note, this model adopts two injectors per cylinder. The turbocharger shaft is connected to the crankshaft through a simple gears pair. The speed ratio across this gears pair and the efficiency is prescribed at every speed and load. This V6 TDI CAE model allows simulation of the operation of super-turbocharged engines, for compression ignition (CI) operation, with diesel or dual fuel diesel-alternative fuels. The intake and exhaust systems are represented through pipes and junctions where the 1D conservation equations of mass, momentum, energy, and species are solved. Complex elements, such as engine cylinders, are represented by special junctions. Single or multiple zones 0D models are used to describe the in-cylinder space that receives intake flows and distribute outflows through the intake and exhaust valves, represented as orifices, and fuel injectors, by solving conservation equations for mass and energy. Ambient junctions are used at the start of the intake system and at the end of the exhaust system. Turbines and compressors are also modeled through special junctions. The model returns the indicated mean effective pressure IMEP. By computing the friction mean effective pressure (FMEP) through a correlation, the brake mean effective pressure is finally computed.
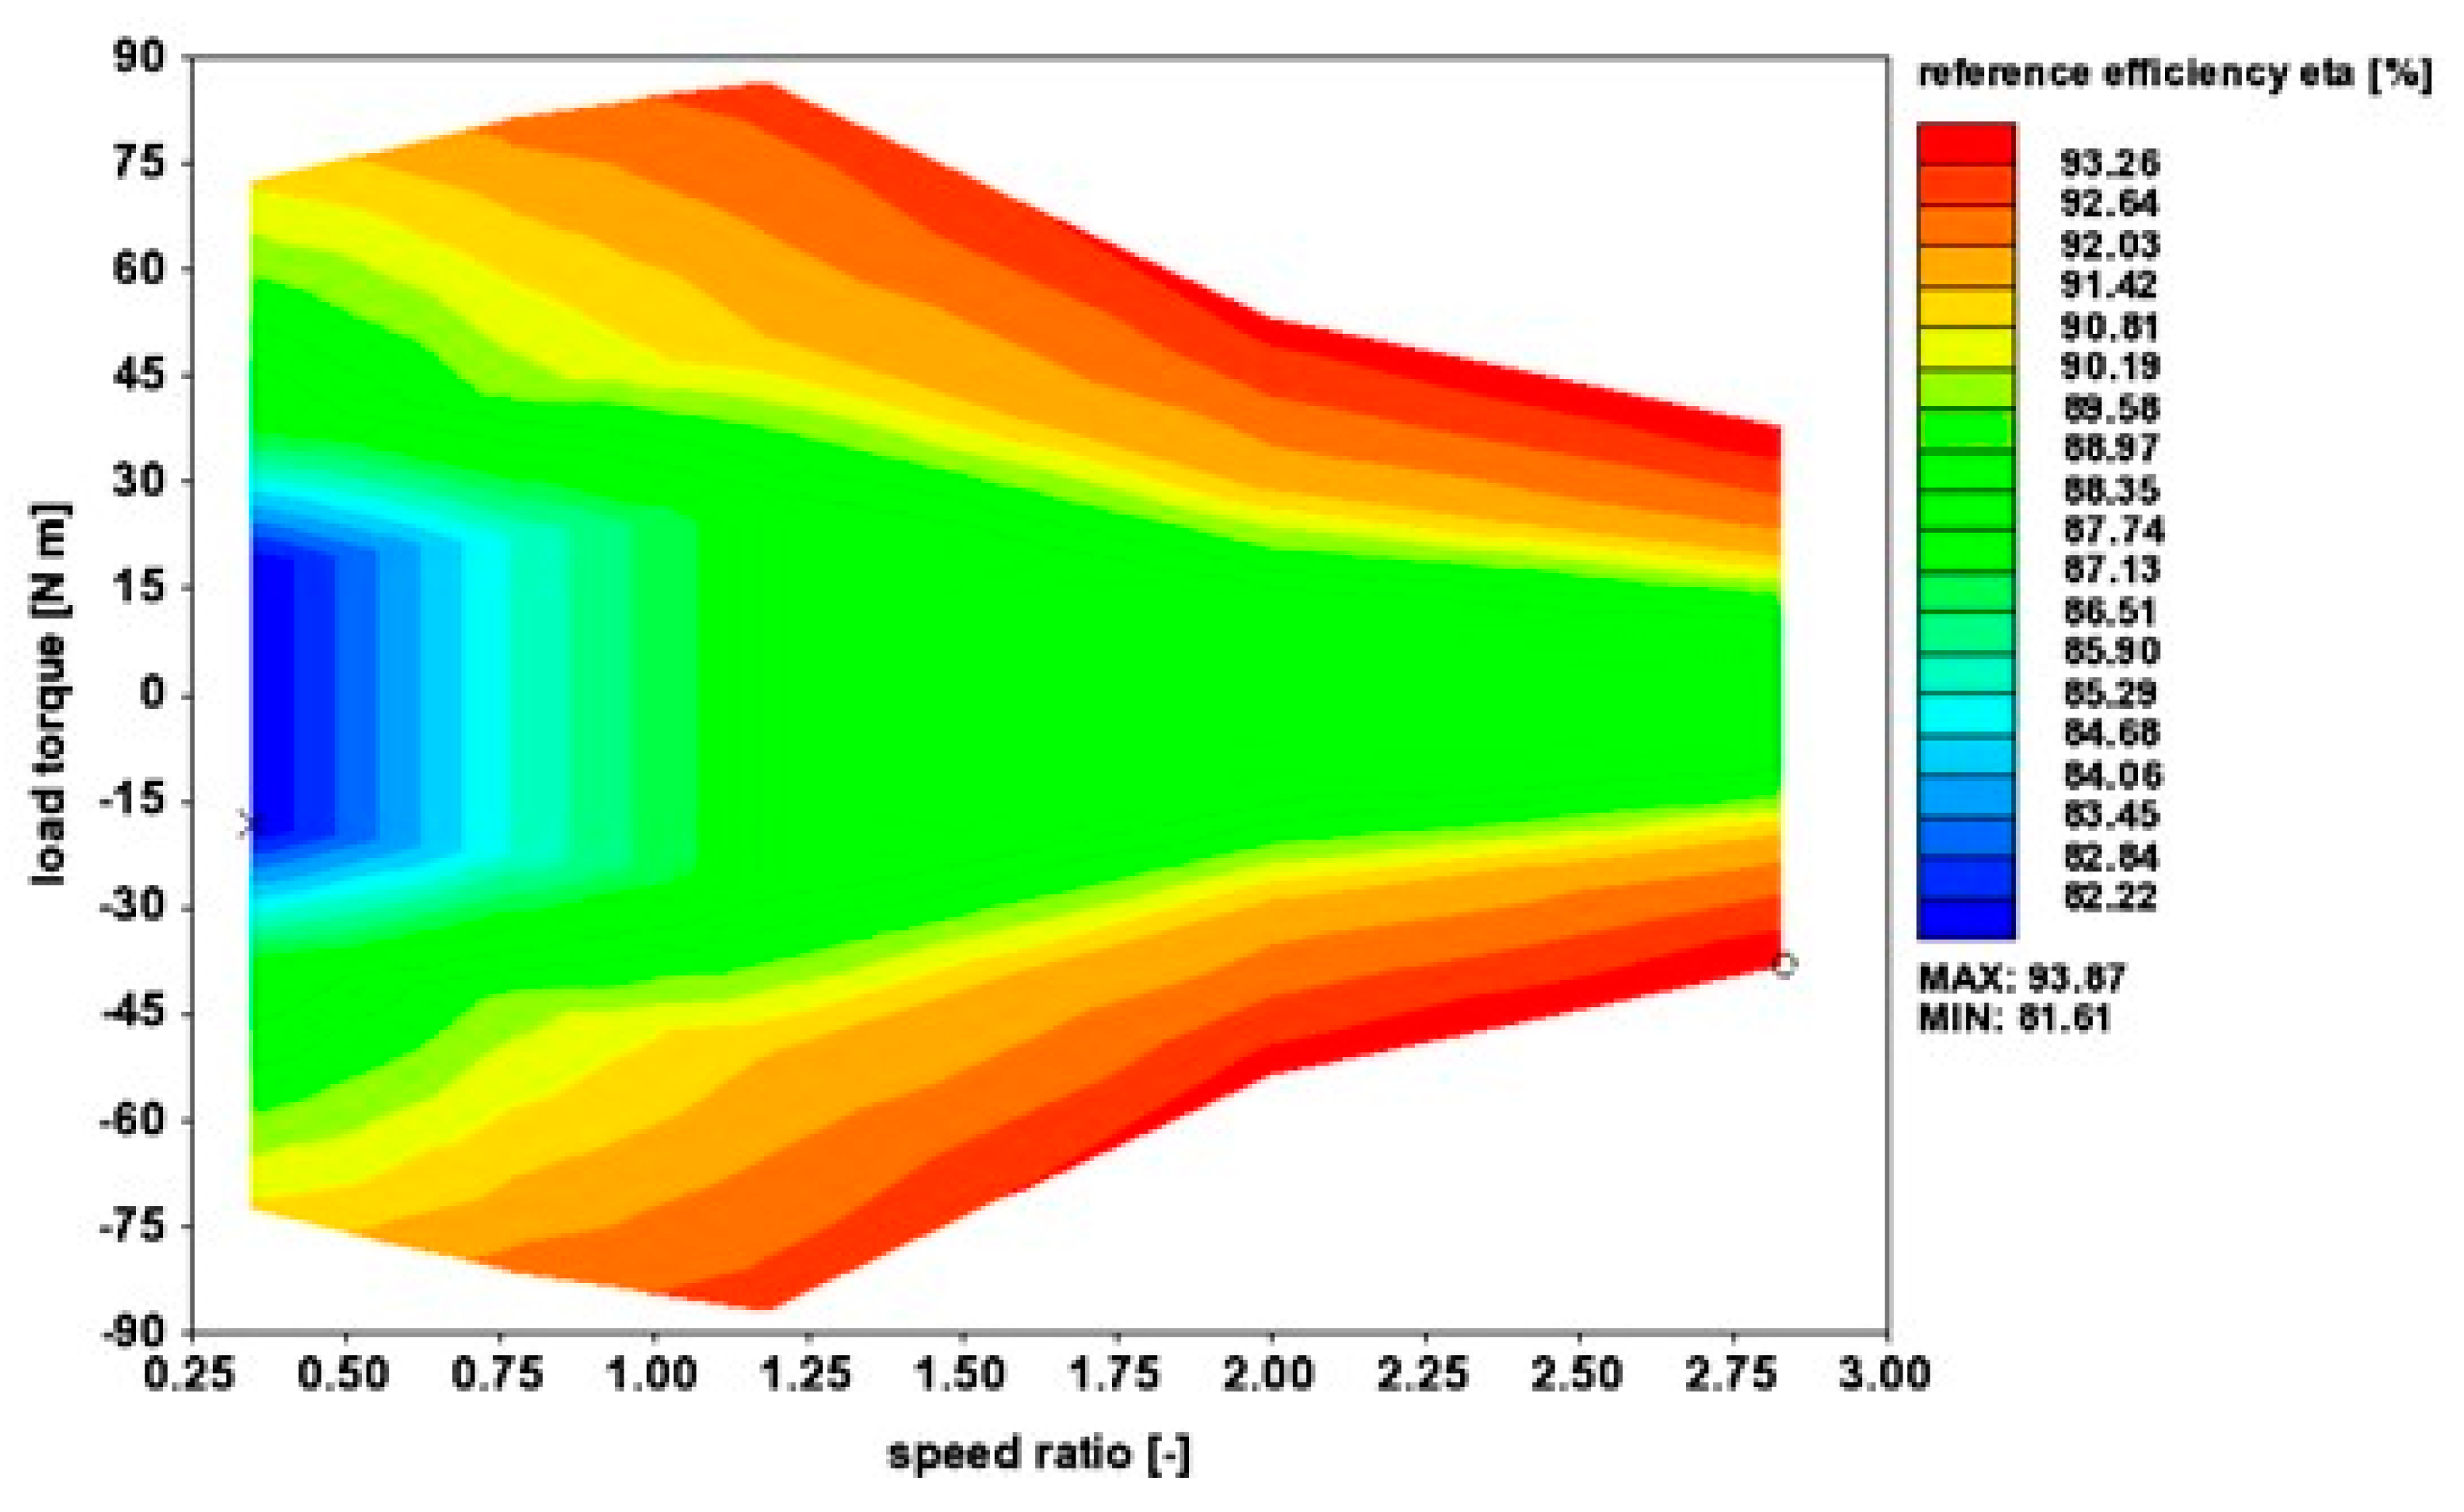
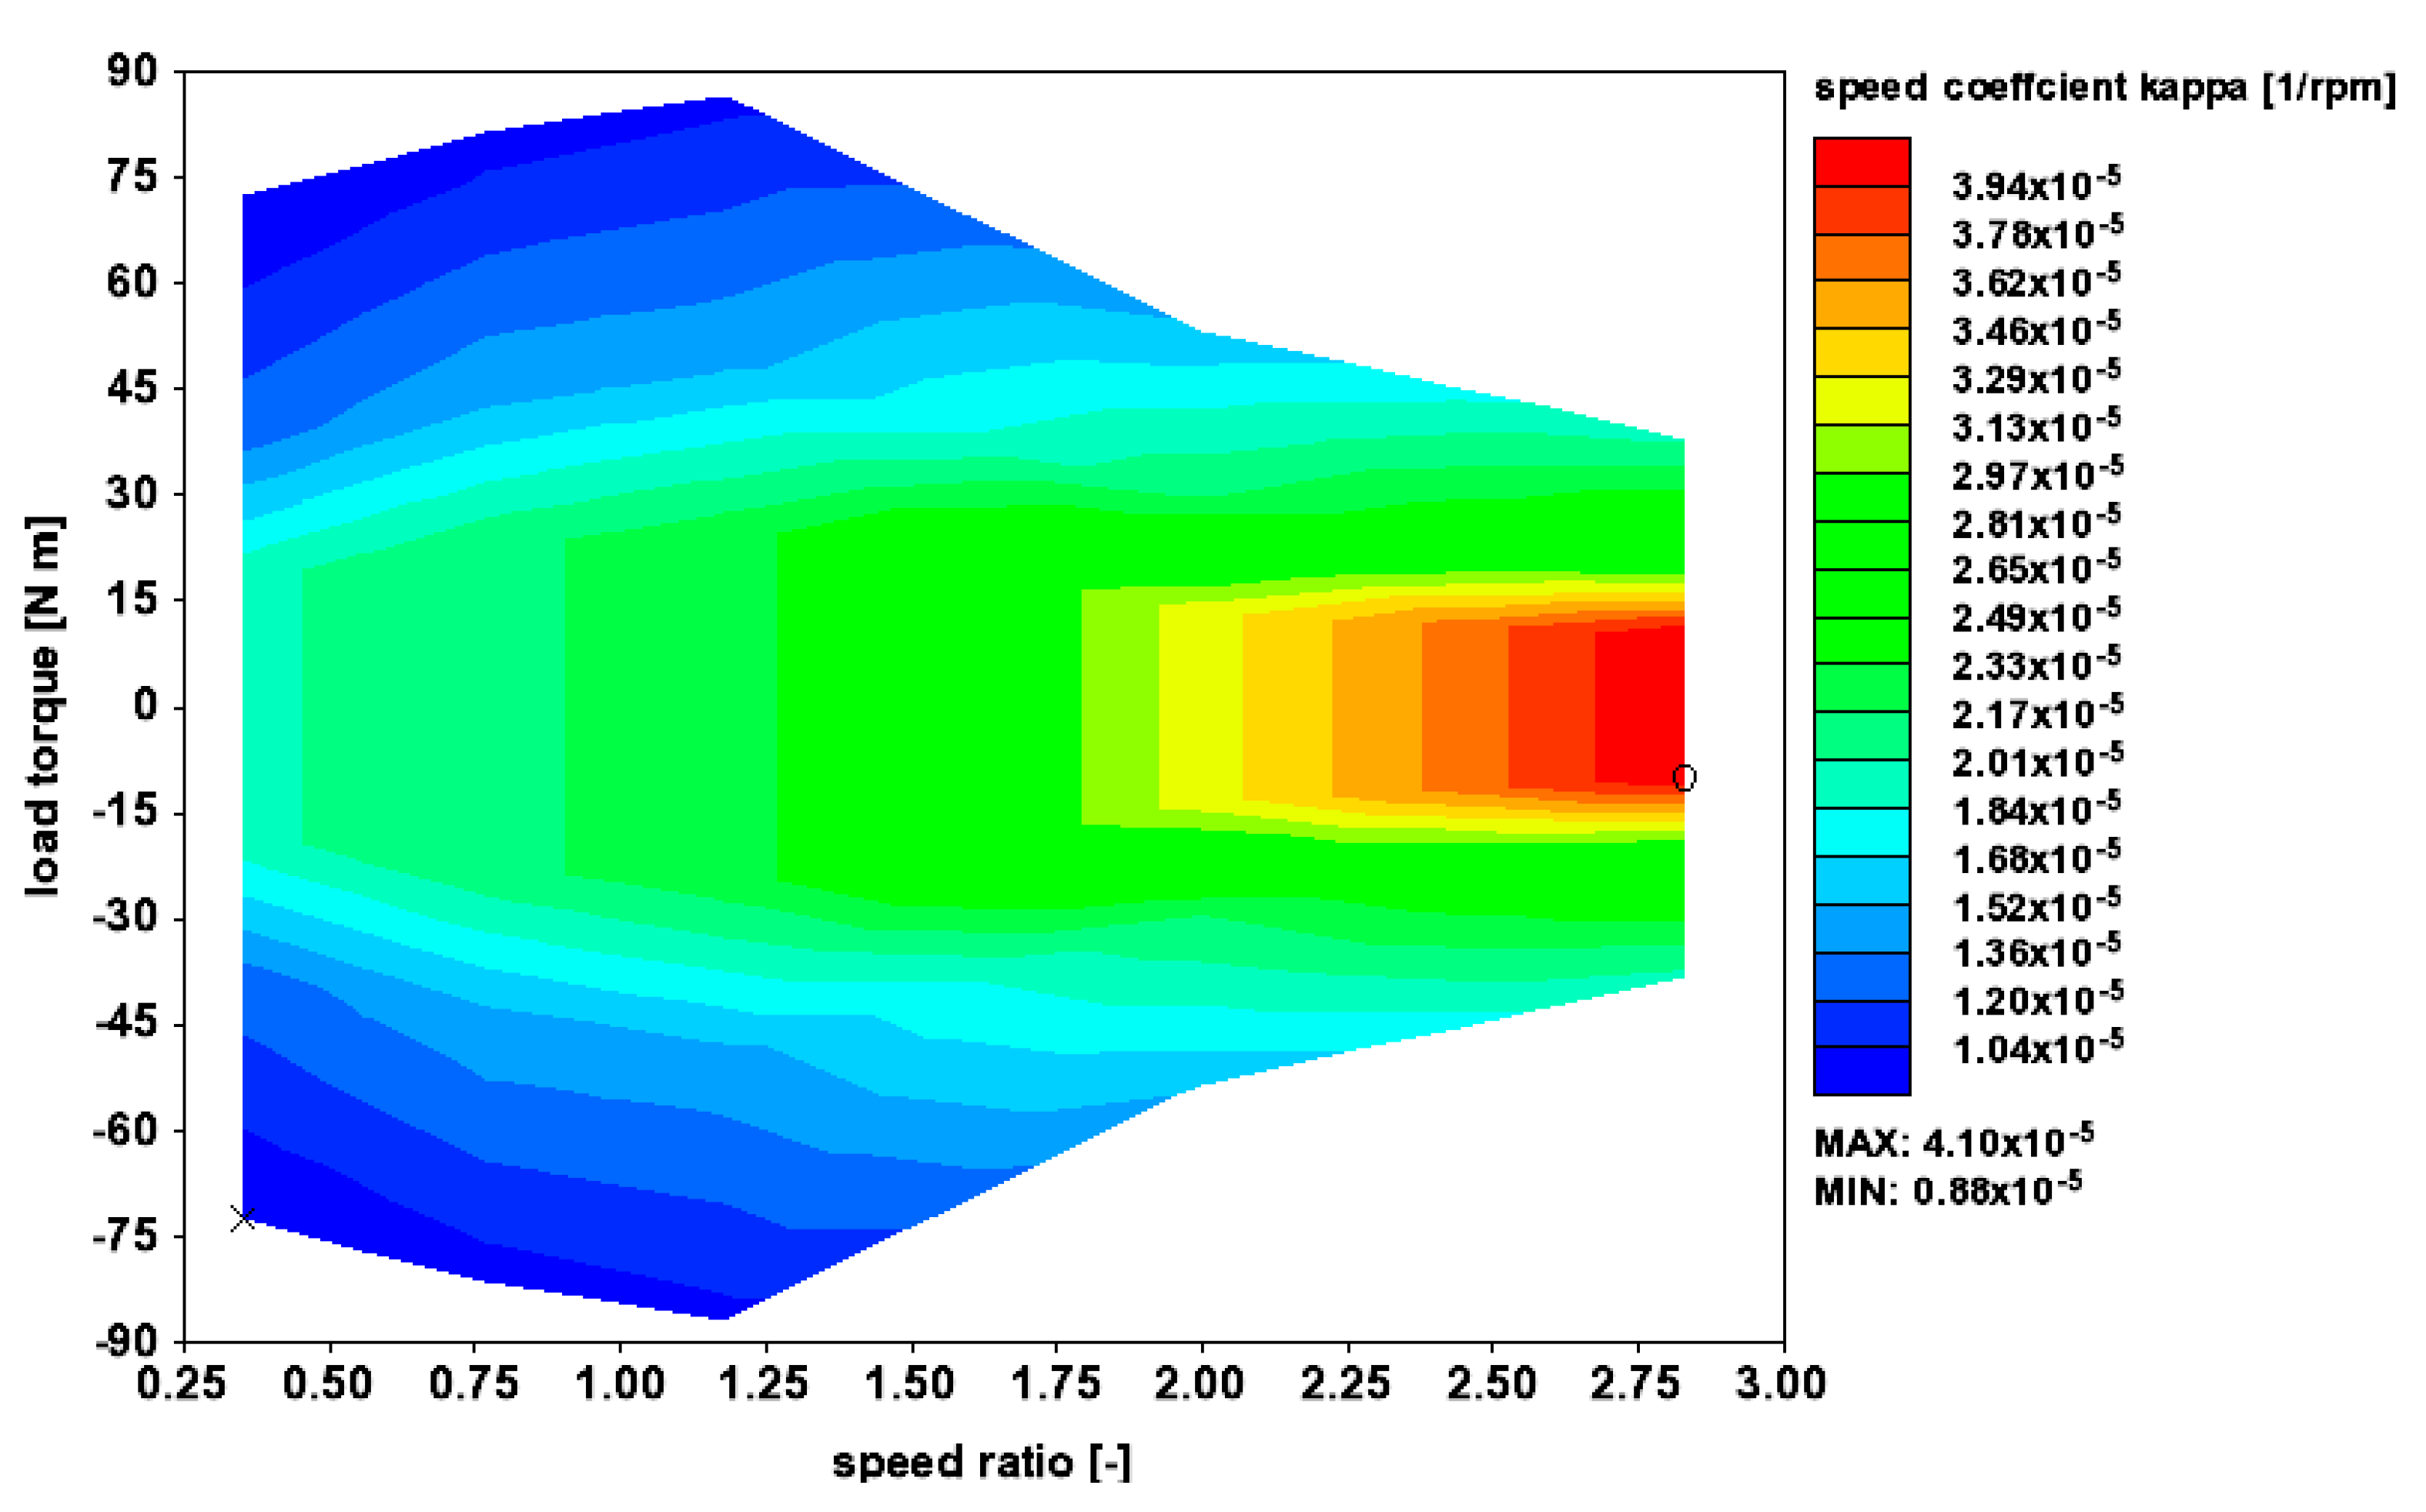
Regarding the super turbocharger, the mechanical efficiency of the connection to the crankshaft is taken as shown in
Figure 2 and
Figure 3. This efficiency only impacts on the extra energy to or from the turbocharger. The speed of the turbocharger is usually kept at the equilibrium value, i.e., the speed where the turbine power is equal to the compressor power. Apart from selected engine high speeds and loads, and low speeds high loads points, the result is not affected by the value of the transmission efficiency. It is assumed here to use a full toroidal CVT, of the spread of speed ratios 7.930, same as the Torotrack V-Charge described later, that however differs for the external overdrive, and for the fact it connects a compressor shaft rather than a turbocharger shaft to the crankshaft. The CVT works with speed ratios from 0.355:1 (underdrive) up to 2.816:1 (overdrive, 2.816 = 1/0.355). The spread of speed ratios is thus 2.816/0.355 = 2.816
2 = 1/0.355
2 = 7.930. The external overdrive is here 21.275. The maximum value of the ratio between the speed of the turbocharger and the speed of the engine is, thus, 60, while the minimum ratio is 7.566. The speed of the turbocharger can, thus, be adjusted in between these two values at any speed and load of the engine. Opposite to the Torotrack V-Charge that transmits the full power required to the compressor, this transmission only transmits to or from the turbocharger the difference between compressor and turbine powers, which is usually much less.
The design of the super-turbocharger has been recently discussed in [
30], and the reader is referred to this work for better details. The proposed toroidal CVT based transmission is a variant of the Torotrack variable-speed supercharging technology [
55]. This is a centrifugal compressor linked to the crankshaft through a CVT based mechanism. Here, the toroidal CVT based transmission is used to connect the crankshaft to the turbocharger shaft. The Torotrack V-Charge comprises a traction drive variator the same as the one adopted here from 0.355:1 (underdrive) up to 2.820:1 (overdrive). It is, however, preceded by a 3:1 overdrive from the engine and followed by a 12.67:1 overdrive through traction drive epicyclic, for a total overdrive of 38.010 vs. the 21.575, here considered. The maximum value of the ratio between the speed of the compressor and the speed of the engine is, thus, 107 (vs. 60), while the minimum ratio is 13.50 (vs. 7.566). The Torotrack V-Charge is used for a gasoline engine, having a larger range of engine speeds, and a compressor that also works up to much higher speeds than the turbocharger here used.
With a full-toroidal design, the spread of the CVT speed ratios is limited to around eight. With a half-toroidal design, the spread of the CVT speed ratios is limited to around four [
54]. In the case of a diesel engine, the spread of speed is reduced in both the engine (4500 rpm max engine speed) and the turbocharger (150,000 rpm maximum turbocharger speed), and a single full-toroidal CVT may be used. Here, the maximum speed of the engine is 4500 rpm and the maximum speed of the turbocharger is 150,000 rpm. A clutch can be added to prevent the engine crankshaft to run the turbocharger at excessive speeds when reducing the loads. This is not a problem with racing engines, and this is not a problem with a diesel engine. If a larger spread of speed ratio is needed, the option of two half toroidal CVT in series can be considered [
30].
Design and analysis of half-toroidal and full-toroidal single-roller CVT are covered in [
30], and [
56,
57,
58,
59,
60].These designs are based on multiple single-roller. Multiple double-roller is considered in [
56], and [
60,
61,
62].Thus, [
60] computes the efficiency as a function of speed ratio, load torque, and input speed. By moving from this approach and using similarity, [
30] defines for the single-roller, full-toroidal CVT the efficiency map
η(
τ,
T1) of
Figure 2, and the speed correction factor map
k(
τ,
T1) of
Figure 3; [
30] also assumes that the same
η apply for transmission of power to, and from, the super-turbocharger, obviously with entry conditions on one side or the other of the single-roller full-toroidal CVT. A good design with enhanced clamping control may deliver an area of operating points well above 90%, albeit with efficiencies still dropping below 90% when seal and parasitic losses will dramatically increase at very low torques. The design certainly requires specific research and development with prototyping and testing. The design, and consequently the efficiency map, is very application-specific, not generic. From
Figure 2 and
Figure 3, it is then
with N speed,
T torque, and
τ the speed ratio.
The transmission for the super-turbocharger is made up of overdrive, the CVT and another overdrive. The transmission is about the same of the Torotrack V-Charge [
55], with differences the different speed ratios for the first and last overdrives, and the fact that the Torotrack V-Charge connects a compressor shaft to the crankshaft, and the super-turbocharger in this paper connects a turbocharger shaft to the crankshaft. As written before, thanks to a different external overdrive, the Torotrack V-Charge works between 13.50 and 107-speed ratios to run the compressor of a gasoline engine. The transmission used here works between 7.566 and 60-speed ratios to run the turbocharger of a diesel engine. The reason for the different range of speed ratios is the different engine—diesel vs. gasoline—and different maps of the turbocharger—the reduced maximum speed here. Better details of the Torotrack V-Charge, including drawings, are proposed in [
55] and references there cited.
As shown in
Figure 1, this transmission is modeled as a simple connection where a speed ratio and an efficiency of transmission is prescribed. The speed ratio is free to vary between the maximum and minimum, which are 60 and 7.566. It is prescribed close to the maximum value for the close to full load operation, and close to the minimum value approaching idle. Over the most part of the load range, it is equal to the value that provides a balance between turbine power and compressor power. The efficiency of transmission is obtained from Equation (3) and
Figure 2 and
Figure 3.
Preliminary combustion results are obtained by coupling an empirical diesel Wiebe function to the above-defined injection profile. The diesel Wiebe function prescribes the ignition delay from the start of the first fuel-injected, i.e., the delay in crank-angle degrees between the earlier start of injection of one of the two injectors, and the start of combustion. The diesel Wiebe function then prescribes the premixed fraction, i.e., the fraction of fuel that mixes before the start of combustion and burns in the “premix” portion of the Wiebe function, and the premixed duration, i.e., the duration in crank-angle degrees of the premixed burn. Then, the model also prescribes main and tail fractions, duration, and exponents.
The Wiebe combustion model uses functions similar to the correlations for pre-mixed and diffusion burn regimes as described in [
63]. An additional third function has been added to represent the tail, slow late burning at the end of the diffusion burning. The normalized mass fraction burned, starting at 0 and progressing up to the value of the combustion efficiency η
c, that is typically 1, is given as a function of the crank angle θ as follows:
where SOI is the Start of Injection, τ the Ignition Delay, E
P the Premix Exponent, E
M the Main Exponent, E
T the Tail Exponent, β
P the Premix Fraction, and β
T the Tail Fraction. The Main Fraction β
M = 1 − β
P − β
T. The Wiebe Premix, Main and Tail Constants φ
P, φ
M and φ
T are expressed as a function of the Premix Duration δ
P and the Premix Exponent, the Main Duration δ
M and the Main Exponent, and the Tail Duration δ
T and the Tail Exponent. The first term represents the premixed burning, the second term the diffusion burning, and the third term the tail burning. The Ignition delay is also computed based on [
63]. These Wiebe functions only approximate the typical shape of a direct injection compression ignition, single main injection burn rate engine, which was the design prior to the Fiat Unijet common rail era.
Since at any instant the specified cumulative combustion cannot exceed the specified injected fuel fraction (the combustion rate is limited by the amount of fuel available) the injection events and the combustion events are interrelated.
Figure 4 presents a typical normalized burn rate result. The start of combustion follows by the ignition delay the start of the first injection. The premixed combustion is progressing at about a linear rate and it is identified by the sharp increment of the burn rate. Then, there are the main combustion and the tail phases. With reference to old fashion diesel direct injection, the premixed phase is not a very large peak followed by a much less intense burn rate during the main combustion rate. Injection shaping permits a much better heat release rate that maximizes performance and minimizes emissions within the due constraints for maximum pressure and maximum pressure gradient. The major issue of this approach, which is based on the empirical evidence for the diesel-only engine, is the inability to cope with a large amount of methane injected prior to the diesel injection ignition at the actual rate, as an “equivalent” much shorter injection is needed.
The sample burning rate profile of
Figure 4, is obtained by using the diesel Wiebe function. The premixed, main (diffusion) and tail combustion phases are clearly evidenced. This model is applicable to multiple injections of diesel, such as those of
Figure 5. However, the model cannot be applied directly to multiple injections of diesel and methane as those depicted in
Figure 6. The model refers, in the various sections of the combustion event, premixed, main and post, to the total mass of fuel that may be unavailable at every given time, from every injector. The ignition delay is computed from the first injection. The complex situation of multiple injections of diesel and methane,
Figure 6, is therefore impossible to be directly represented, and they may only be represented through “equivalent” injection events.
The heat release rate of
Figure 4 is theoretically suitable for a single injection of the diesel, and not for a complex injection of the diesel, such as the one of
Figure 5, or a complex injection of the diesel and the LNG, such as the one of
Figure 6. Modern diesel engines designed following the Fiat Unijet common rail revolution use injection shaping to shape the heat release rate curve targeting performance and emission parameters within given constraints. The “premixed” injection of the methane may start at any time. With flow rates high enough, the methane will be concentrated at the center of the chamber where the diesel injection ignition will occur. This will then start the combustion of the diesel and the methane in the chamber. This combustion pattern is similar to jet ignition. Then, the “diffusion” injection of the methane will sustain the combustion rate. High flow rates are needed especially during this phase. Westport, [
36] to [
42,
44], has traditionally used a main injection of the LNG following a pilot injection of the diesel, but more recently has also explored the opportunity to inject part of the LNG before, and part of the LNG after the diesel, [
39,
41,
42,
44]. This latter activity is both experimental and computational. Westport has also explored the opportunity to have a larger injection pressure for the LNG [
44], but only 600 bar. The remarkable difference vs. the Westport studies is the opportunity, thanks to the use of two much higher pressure, smaller and faster injectors, one for the diesel and one for the LNG, to enhance the injection and thus heat release rate shaping capabilities. It is a logical assumption that, having better injectors, the shaping of the heat release rate can be improved. It has been proven with the diesel only, and Westport has partially proven with the diesel and LNG.
Figure 4 is the normalized burning rate. This is the mass of fuel that burns over 1 degree of the crank angle divided by the total mass of fuel injected in a cycle. The integral in dθ gives a result of 1 if all the fuel burns. An average normalized burning rate of 0.04 1/degrees crank angle. Over a combustion duration of 25 degrees, crank angle returns a total normalized fuel burned of 1. Similarly in
Figure 5 and
Figure 6 is the normalized energy of fuel injected. This is the fuel energy inflow over 1 degree of the crank angle divided by the total energy of the fuel injected in a cycle.
Post injection was originally developed (see, for example, the Fiat Multijet) for particulate trap regeneration, i.e., it was never used in steady-state map points, but only used sometimes during transients. Other uses have been proposed, for example, reduction of engine-out soot emissions. Post injections are not relevant for performance simulations.
The opportunity of having two separate injections for the diesel and the methane translates in the opportunity to have nearly isochoric combustion about the top dead center of the pilot/pre diesel and the premixed methane-air mixture. This is something like homogeneous charge compression ignition (HCCI) in terms of burning rate, but with the advantages of (1) being controlled, and (2) occurring at the center of the combustion chamber; thus, having reduced heat losses, since a cushion of air surrounds the region where combustion occurs. This rapid premixed combustion phase can be optimized for a trade-off between fuel conversion efficiency and constraints, such as the maximum pressure build-up gradient dp/dθ (θ) and the maximum peak pressure and its location, which also depends on the “diffusion” combustion phase. The following combustion phase is then characterized by a rate controlled by the fuel flow rate, as the methane injected in an environment characterized by extremely high temperatures and pressures with ongoing combustion, vaporizes quickly, and burns as soon as oxygen is found. As the engine is now undertaking the expansion stroke, the pressure and temperature may peak at full load operation, about 14–16 degrees crank angle after the top dead center, then it decreases. Since pressure and temperature reduce during the expansion, and also the availability of oxygen reduces because of the combustion already occurred, the combustion rate is then characterized by a tail following a declining rate main phase.
The injector is modeled through an effective area, opening and closing times with multi-event capability, and a pressure profile. The mass of fuel injected is then adjusted to match the desired brake mean effective pressure (BMEP) output. A trial and error procedure is needed to produce realistic injection and combustion profiles. The fluid is considered a compressible liquid with the option to change the phase to a gas. Polynomial approximations as a function of pressure and temperature are used for all the parameters describing the liquid and gas fluids. While data for the gas methane are available in the template library, the data for the liquid methane need to be defined. This is done by using the data of [
45].
For what concerns the detailed model of the injection system, not included in the present work, the approach to follow is to use compressible liquid fuel and vapor fuel models. This permits the dimensioning of all the major components of the injectors with computer-aided engineering (CAE) software tools, similar to those used for engine performance simulations shown in the following sections.
The liquid compressible fuel object describes a compressible liquid that may also undergo a change to the vapor phase for cavitation or boiling. It specifies a vapor fluid object describing the properties of the liquid after it vaporizes and the heat of vaporization. Polynomial functions are describing density and enthalpy as a function of pressure and temperature. The saturation liquid-vapor pressure of the liquid is determined as a function of temperature by integrating the Clausius–Clapeyron equation. Finally, transport properties are also given as a function of pressure and temperature. Properties are approximated as a function of
p and T, for example
where A, α, and β are empirical constants. The gas phase of the liquid is described based on the molecular weight, composition, lower heating value, critical pressure, and temperature and reference entropy, plus polynomial approximation of enthalpy and transport properties function of pressure and temperature. While the gas phase of methane is available in the template properties, the liquid compressible properties require attention. At very high pressures, there are no data in the literature. The injection and combustion models need a better definition for the specific application, based on an experimental campaign. There is a need for novel specific models, as well as for the experimental determination of the parameters embedded in these models. The injector nozzle parameters also impact on the combustion result, through their effect on the injection pressure and velocity. The DI Wiebe combustion model is affected by the values of the injection pressure and velocity. The nozzle discharge coefficient required to achieve the specified injected mass is calculated using the diameter of an individual nozzle hole and the number of holes. A trial-and-error procedure is needed to compute realistic profiles for the injected fuel, and then the combustion. Methane is injected at cryogenic temperatures and high pressure, with high flow rates and high atomization. The methane expands absorbing heat and it quickly mixes with the air. The methane that is injected after the combustion has started vaporizes and mixes even quickly.
3. Results
Reference [
4] presents the results for the baseline engine and the dual fuel diesel LNG engine with a lower pressure direct injector. The substitutional energy by LNG is proposed there. Here we present the results only for the higher pressure injector (1600 bar), permitting an increased flow rate and thus shorter injection timings. Unfortunately, the present injection and combustion model only works to provide an empirically based estimation of the fuel conversion efficiency. It does not permit to compute the detailed injection, combustion, and pollutant formation processes that may benefit even more from high-pressure fast actuation injection. Better models and the support of dynamometer experiments are needed to fully progress the concept.
Figure 7 and
Figure 8 present the fuel conversion efficiency and λ maps for the diesel-LNG engine operation, while
Figure 9 presents the ratio of the turbocharger speed to the engine speed.
Figure 10 and
Figure 11 then propose the maximum pressure and the crank angle of maximum pressure.
Figure 12 finally presents the substitutional methane energy. It is a design constraint to have peak pressures below 300 bar.
The opportunity to use much higher injection pressures translate into the opportunity to have a much lighter and smaller injector, faster to be actuated, that also delivers a larger flow rate with better atomization. It is unfortunately not possible to fully explore the heat release shaping capabilities of such injectors, because the combustion model,
Figure 4 and Equation (4), in theory, is only valid for one simple single injection of the diesel. From the measured pressure curves of one latest diesel, adopting complex injection strategies, there is the opportunity to compute the Wiebe function parameters and an equivalent simple diesel injection to provide about the same heat release rate. The only aspect that can be simulated with the present model for LNG is a faster or slower injection of a given amount of fuel. From
Table 3, moving from 300 bar to 1600 bar, ṁ·LHV increases from 4614 to 15,232 kJ/s if the cross-sectional area remains unchanged. This means that the LNG could be injected during a single main injection phase of length 32% less, while also reducing the injector holes’ diameter of 33%, or the cross-sectional areas of the injector of 56%.
A comparison between operation with 300 and 1600 bar injectors is provided. Results obtained by using a 300 bar injector have been recently published in [
4]. Peak fuel conversion efficiency there is less than 48%. Peak fuel conversion efficiency here is 50%. Peak fuel conversion efficiency there is obtained with λ = 1.67. Peak fuel conversion efficiency here is obtained with λ = 1.74. The BMEP can be further increased simply working richer with the LNG, which is much easier to vaporize, mix with air and burn than the diesel. However, this impact peak pressure. What is done in the model is to simulate a quicker injection and combustion, with the higher injection pressure. The injection and combustion events are differently phased, to avoid excessive peak pressures, while permitting better fuel conversion efficiency, i.e., less fuel for the same BMEP output. No attempt has been made to increase the maximum BMEP for any given speed. Higher injection pressure permits faster actuation, larger flow rates, better atomization, and thus much quicker combustion. The enhanced heat release shaping opportunities are not explored due to the limitations of the combustion model. By only considering a faster main injection of the LNG and quicker combustion, the fuel conversion efficiency increases about two percentage points, and the fuel-to-air ratio similarly reduces for the same BMEP output. The computational model is not optimized, due to the limitations of the injection and combustion model that differs considerably far from the real-world operation. Improvements in real-world engine experiments through appropriate shaping of the heat release rate curve may be larger.
The turbocharger is accelerated to higher speeds at low engine speed and high loads, up to the maximum permitted ratio of 60. The most part of the operating points, far from top loads, is obtained by taking the turbocharger speed as the speed of equilibrium between turbine and compressor powers. Top loads are obtained by using different speeds, with higher compression power at low speeds, and higher turbine powers at high speeds.
Regarding fuel conversion efficiency and λ, these results are constrained by the use of heat release rate profiles, such as the one of
Figure 4, which limits the possibilities. The maps of
Figure 7 and
Figure 8 are computed by assuming the dual-fuel diesel-methane engines have roughly the same combustion behavior of diesel-only engines, that it is not the case. These results are therefore an underestimation of the actual potentials of the proposed solution. It is worth to note the top fuel conversion efficiency, about 48%, is marginally better than the diesel, and also similar to diesel λ values.
It must be added that while the baseline diesel engine model was validated, the diesel-methane model is not. Both dp/dθ and peak pressure are limited, the same as the diesel. The flow rate in the diesel was also limited in the area of high speeds and top loads by the racing rules, and this is also done in the dual-fuel engine. The full load BMEP of the diesel is set as the full load BMEP of the diesel-methane engine. As in the same BMEP points, the methane-diesel engine works with similar and possibly slightly larger λ and η, and the methane-diesel may work λ than the diesel-only, thanks to the lower injection temperature and the faster vaporization and mixing of the methane, there is certainly the opportunity to also deliver better power densities with methane.
In the simulations, it is assumed LNG has an LHV of 50 MJ/kg fuel, and an A/F stoichiometric of 17.2. This translates into an energy content per unit mass of the mixture of 2.78 MJ/kg mixture. In the case of diesel, LHV is 42.6 MJ/kg, A/F stoichiometric is 14.5, and the energy content per unit mass of mixture is a very close, slightly smaller 2.75 (only 1% difference). For the same λ, thus, there is 1% more energy with the LNG, and a (slightly) larger λ can be adopted for the same MJ/kg. λ may be larger (for the same BMEP point) because η also slightly increases. LNG is injected at 113 K rather than 300 K. However, immediately after injected in an environment characterized by hot partially combusted gases, it vaporizes almost instantaneously, and it quickly mixes with air and burns. Methane is much easier to burn than a heavy hydrocarbon such as diesel fuel.
With reference to a traditional turbocharged engine, the super-turbocharger permits much larger BMEP values in the low-speeds range, an increment from about 10 to about 20 bar BMEP at 1000 rpm, while working with about the same λ. At high speeds and loads, the benefits are up to about one percentage point of better fuel conversion efficiency, working with about the same λ.
It must be mentioned that the opportunity to improve the steady-state output and efficiency with the super-turbocharger depends on the specific engine load and speed. At high engine loads and speeds, the energy, otherwise waste-gated, may often be converted to extra power at the turbine to increase, albeit to a small extent, both engine efficiency and output. At low engine speeds, the compressor can be run at higher speeds to increase the engine output thanks to the increased boost. However, this requires power from the crankshaft.
Concerning the after treatment, the diesel after treatment is obviously maintained. One advantage of the two injectors per cylinder is that the engine may work diesel-only, or diesel-methane. The post injections of the diesel for the regeneration of the particulate filter are maintained. The opportunity to run the engine diesel only, or diesel-LNG, depending on the needs, is a significant advantage during transition periods, where the recharging infrastructure for the LNG cannot be widespread. To have a particulate filter is relevant to the opportunity to clean up the air of urbanized areas where the ambient concentration of particulates largely exceeds the value at the tailpipe of a diesel or a diesel-methane vehicle.
A validated diesel engine model, developed by using very well-known XAE software tools, extensively used within engine departments for many years, is modified to only accept an additional injector for a second fuel, LNG. The experience by Westport proves dual fuel diesel-LNG engines work very close to diesel-only engines. The proposed results, detailing the benefits of higher injection pressures, fast actuation and enhanced injection shaping capabilities of the LNG and the diesel, are extremely logical, and thus trustworthy.
As higher injection pressures, fast actuation and enhanced injection shaping capabilities have permitted to dramatically improve the diesel engine, there is no reason why similar improvements in the injection of the LNG and the diesel should not be beneficial.
By replacing the Westport dual fuel injector, of limited injection pressure, low rates of actuation, and limited injection shaping capabilities, with two dedicated injectors, one for the diesel, the other for the LNG, both featuring high injection pressures, fast actuation and enhanced injection shaping capabilities, there are certainly significant complications, as the solution is more appropriate for novel engines rather than the conversion of existing engines, but there is really no logical downfall under the aspect of performance.


