3D CPFD Simulation of Circulating Fluidized Bed Downer and Riser: Comparisons of Flow Structure and Solids Back-Mixing Behavior


Abstract
1. Introduction
2. CPFD Model and Set-Up
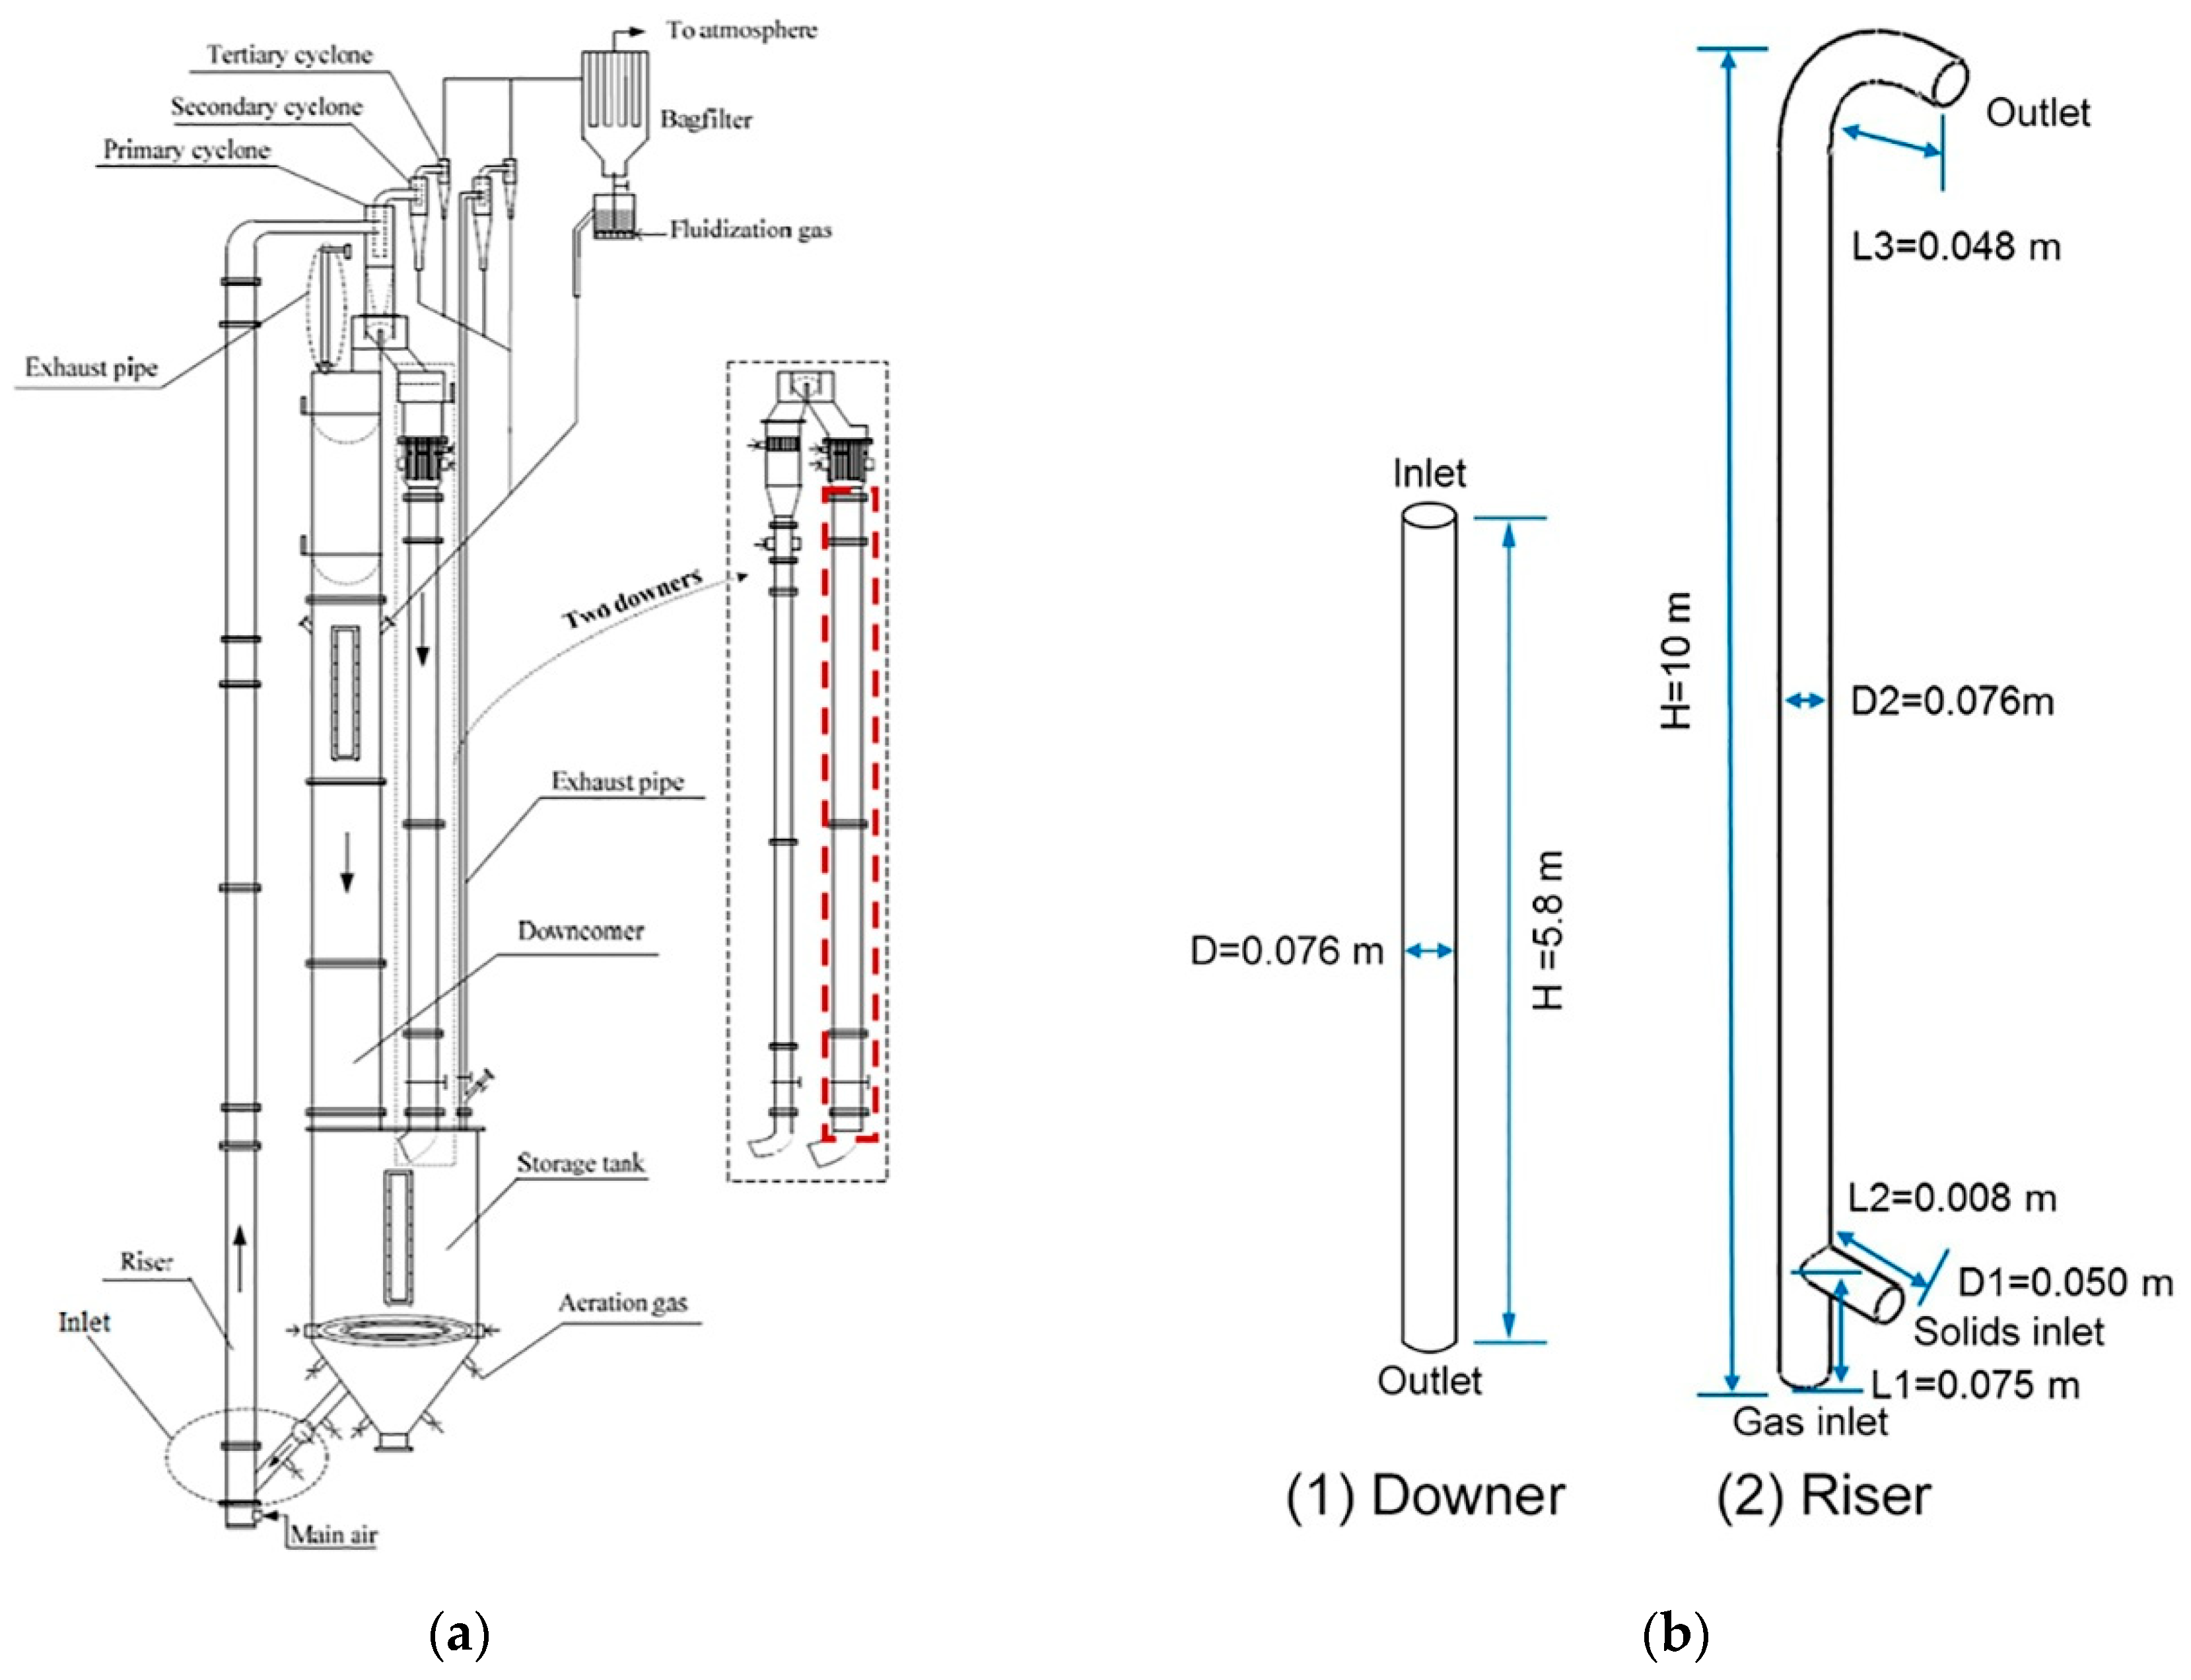
2.1. Simulated CFB System
2.2. CPFD Model
2.3. Simulation Set-Up
3. Results and Discussion
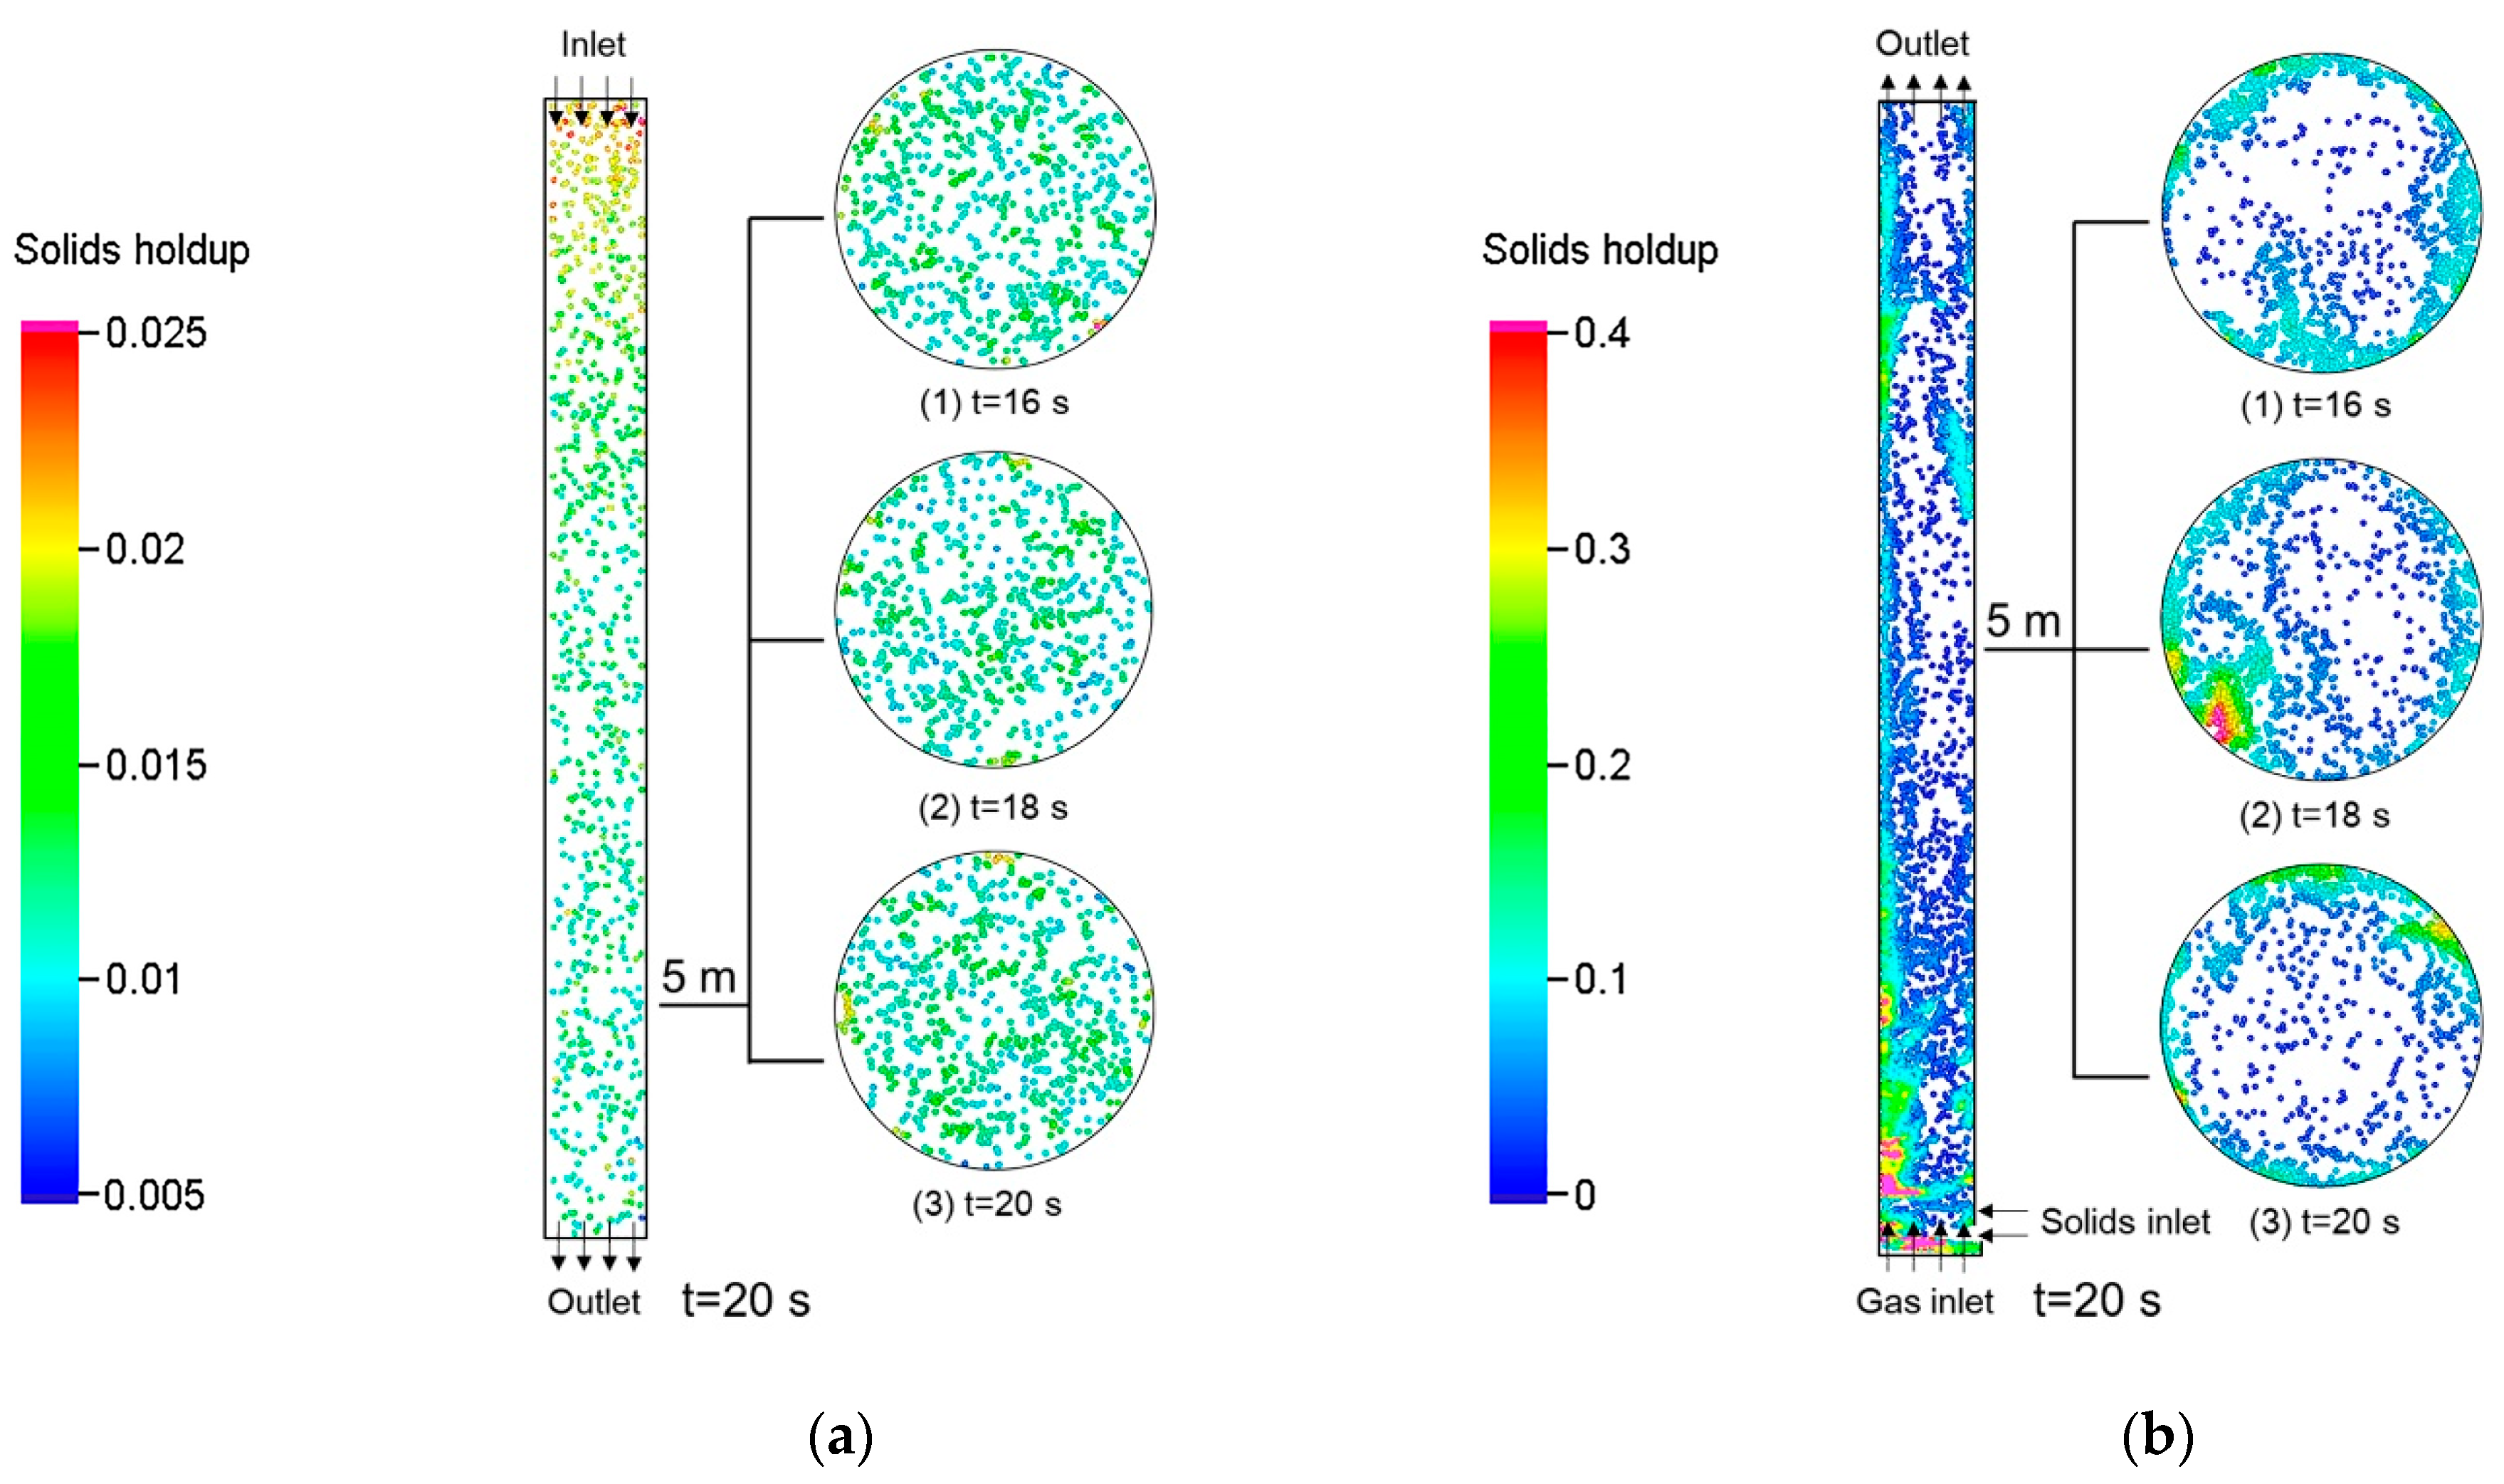
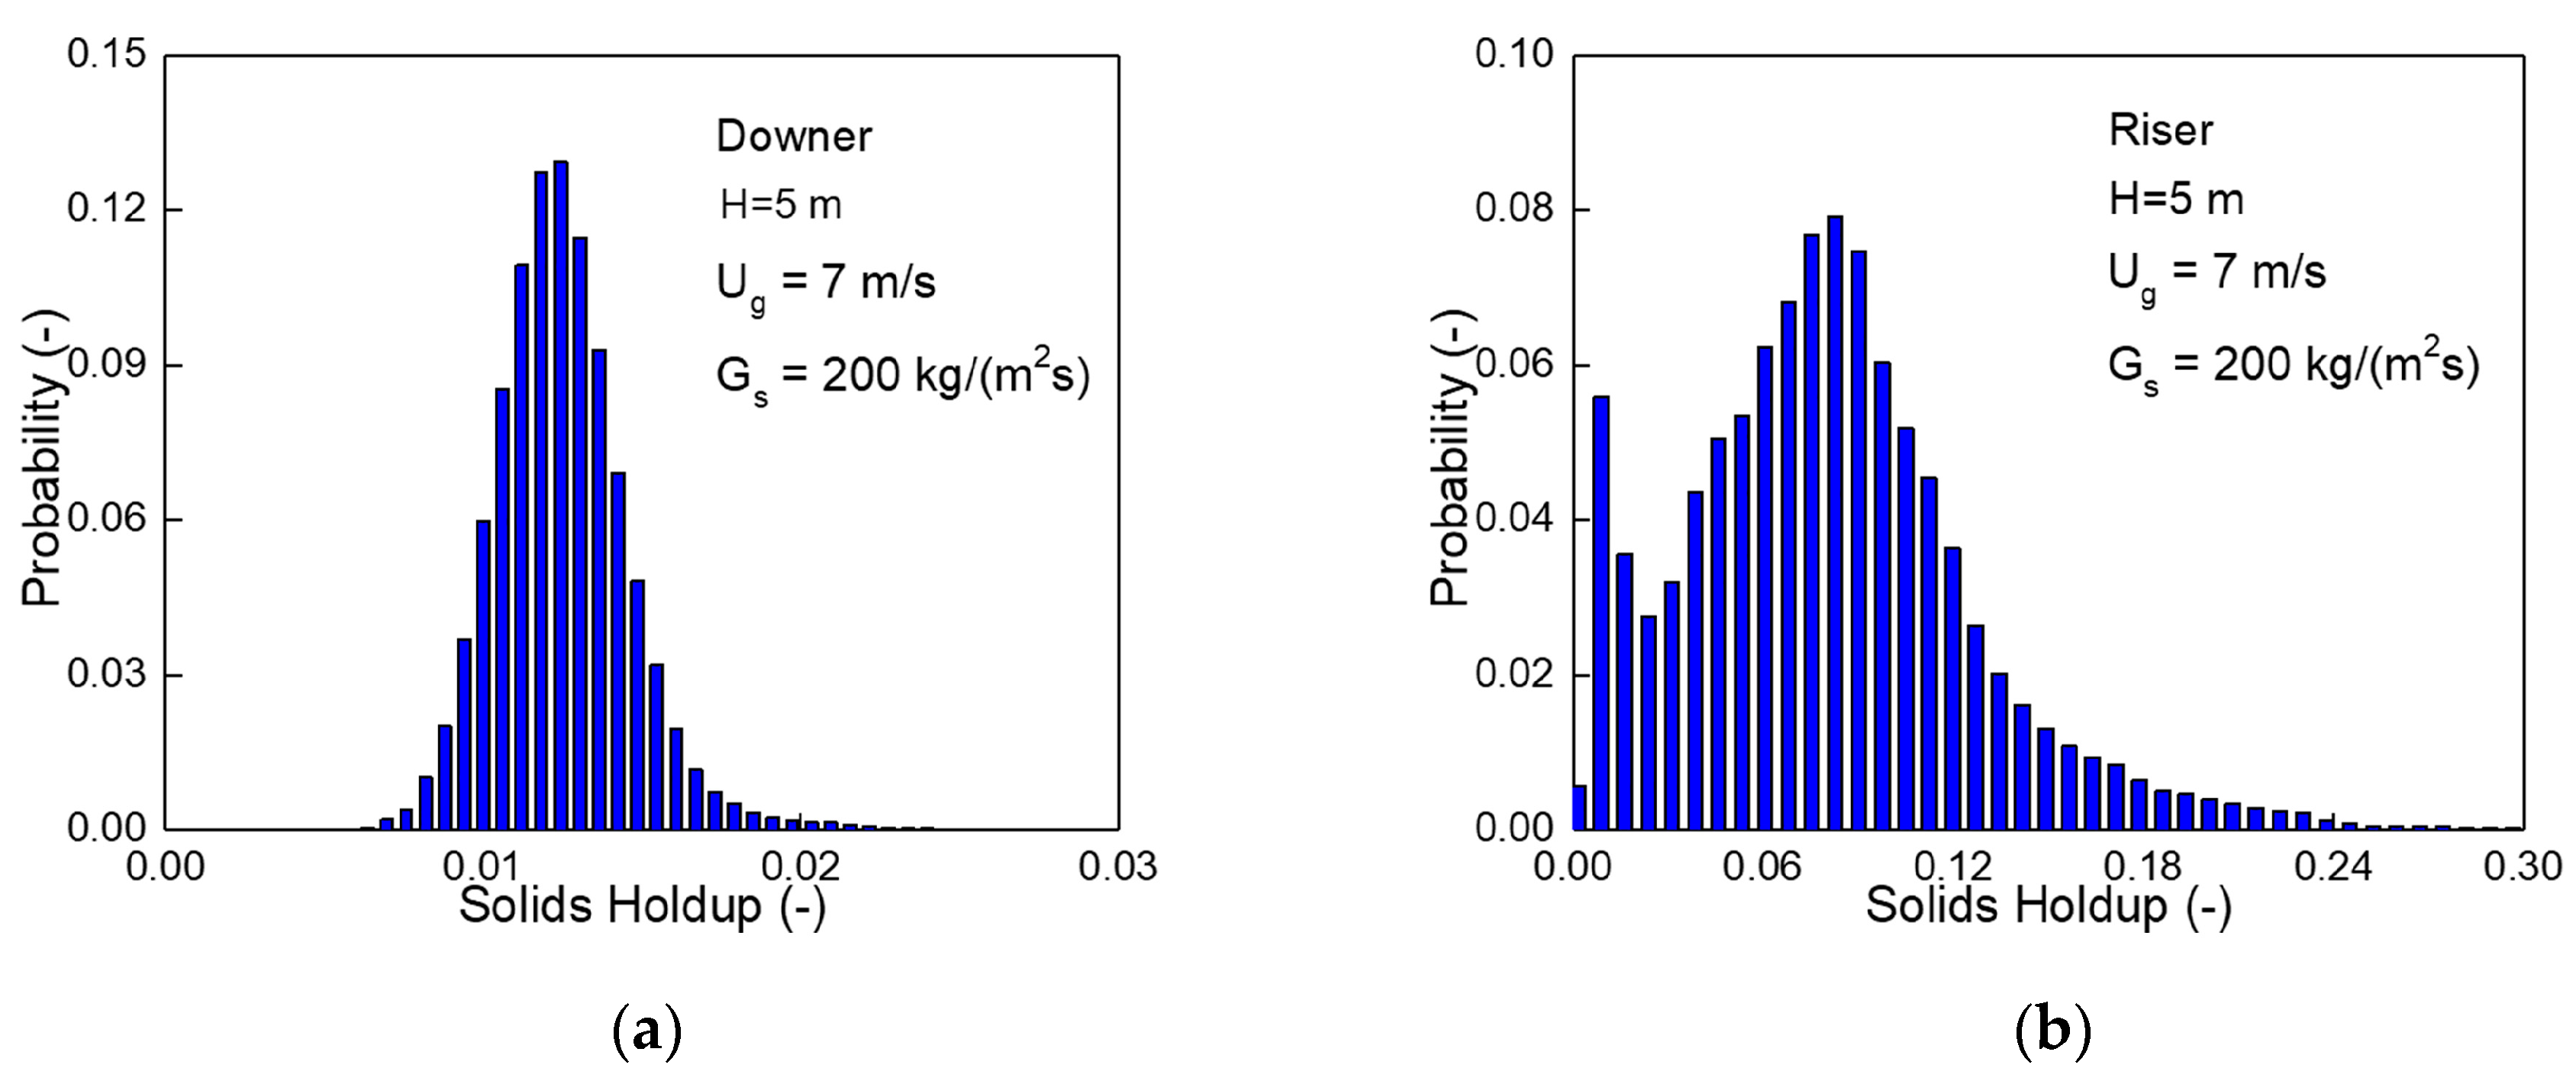
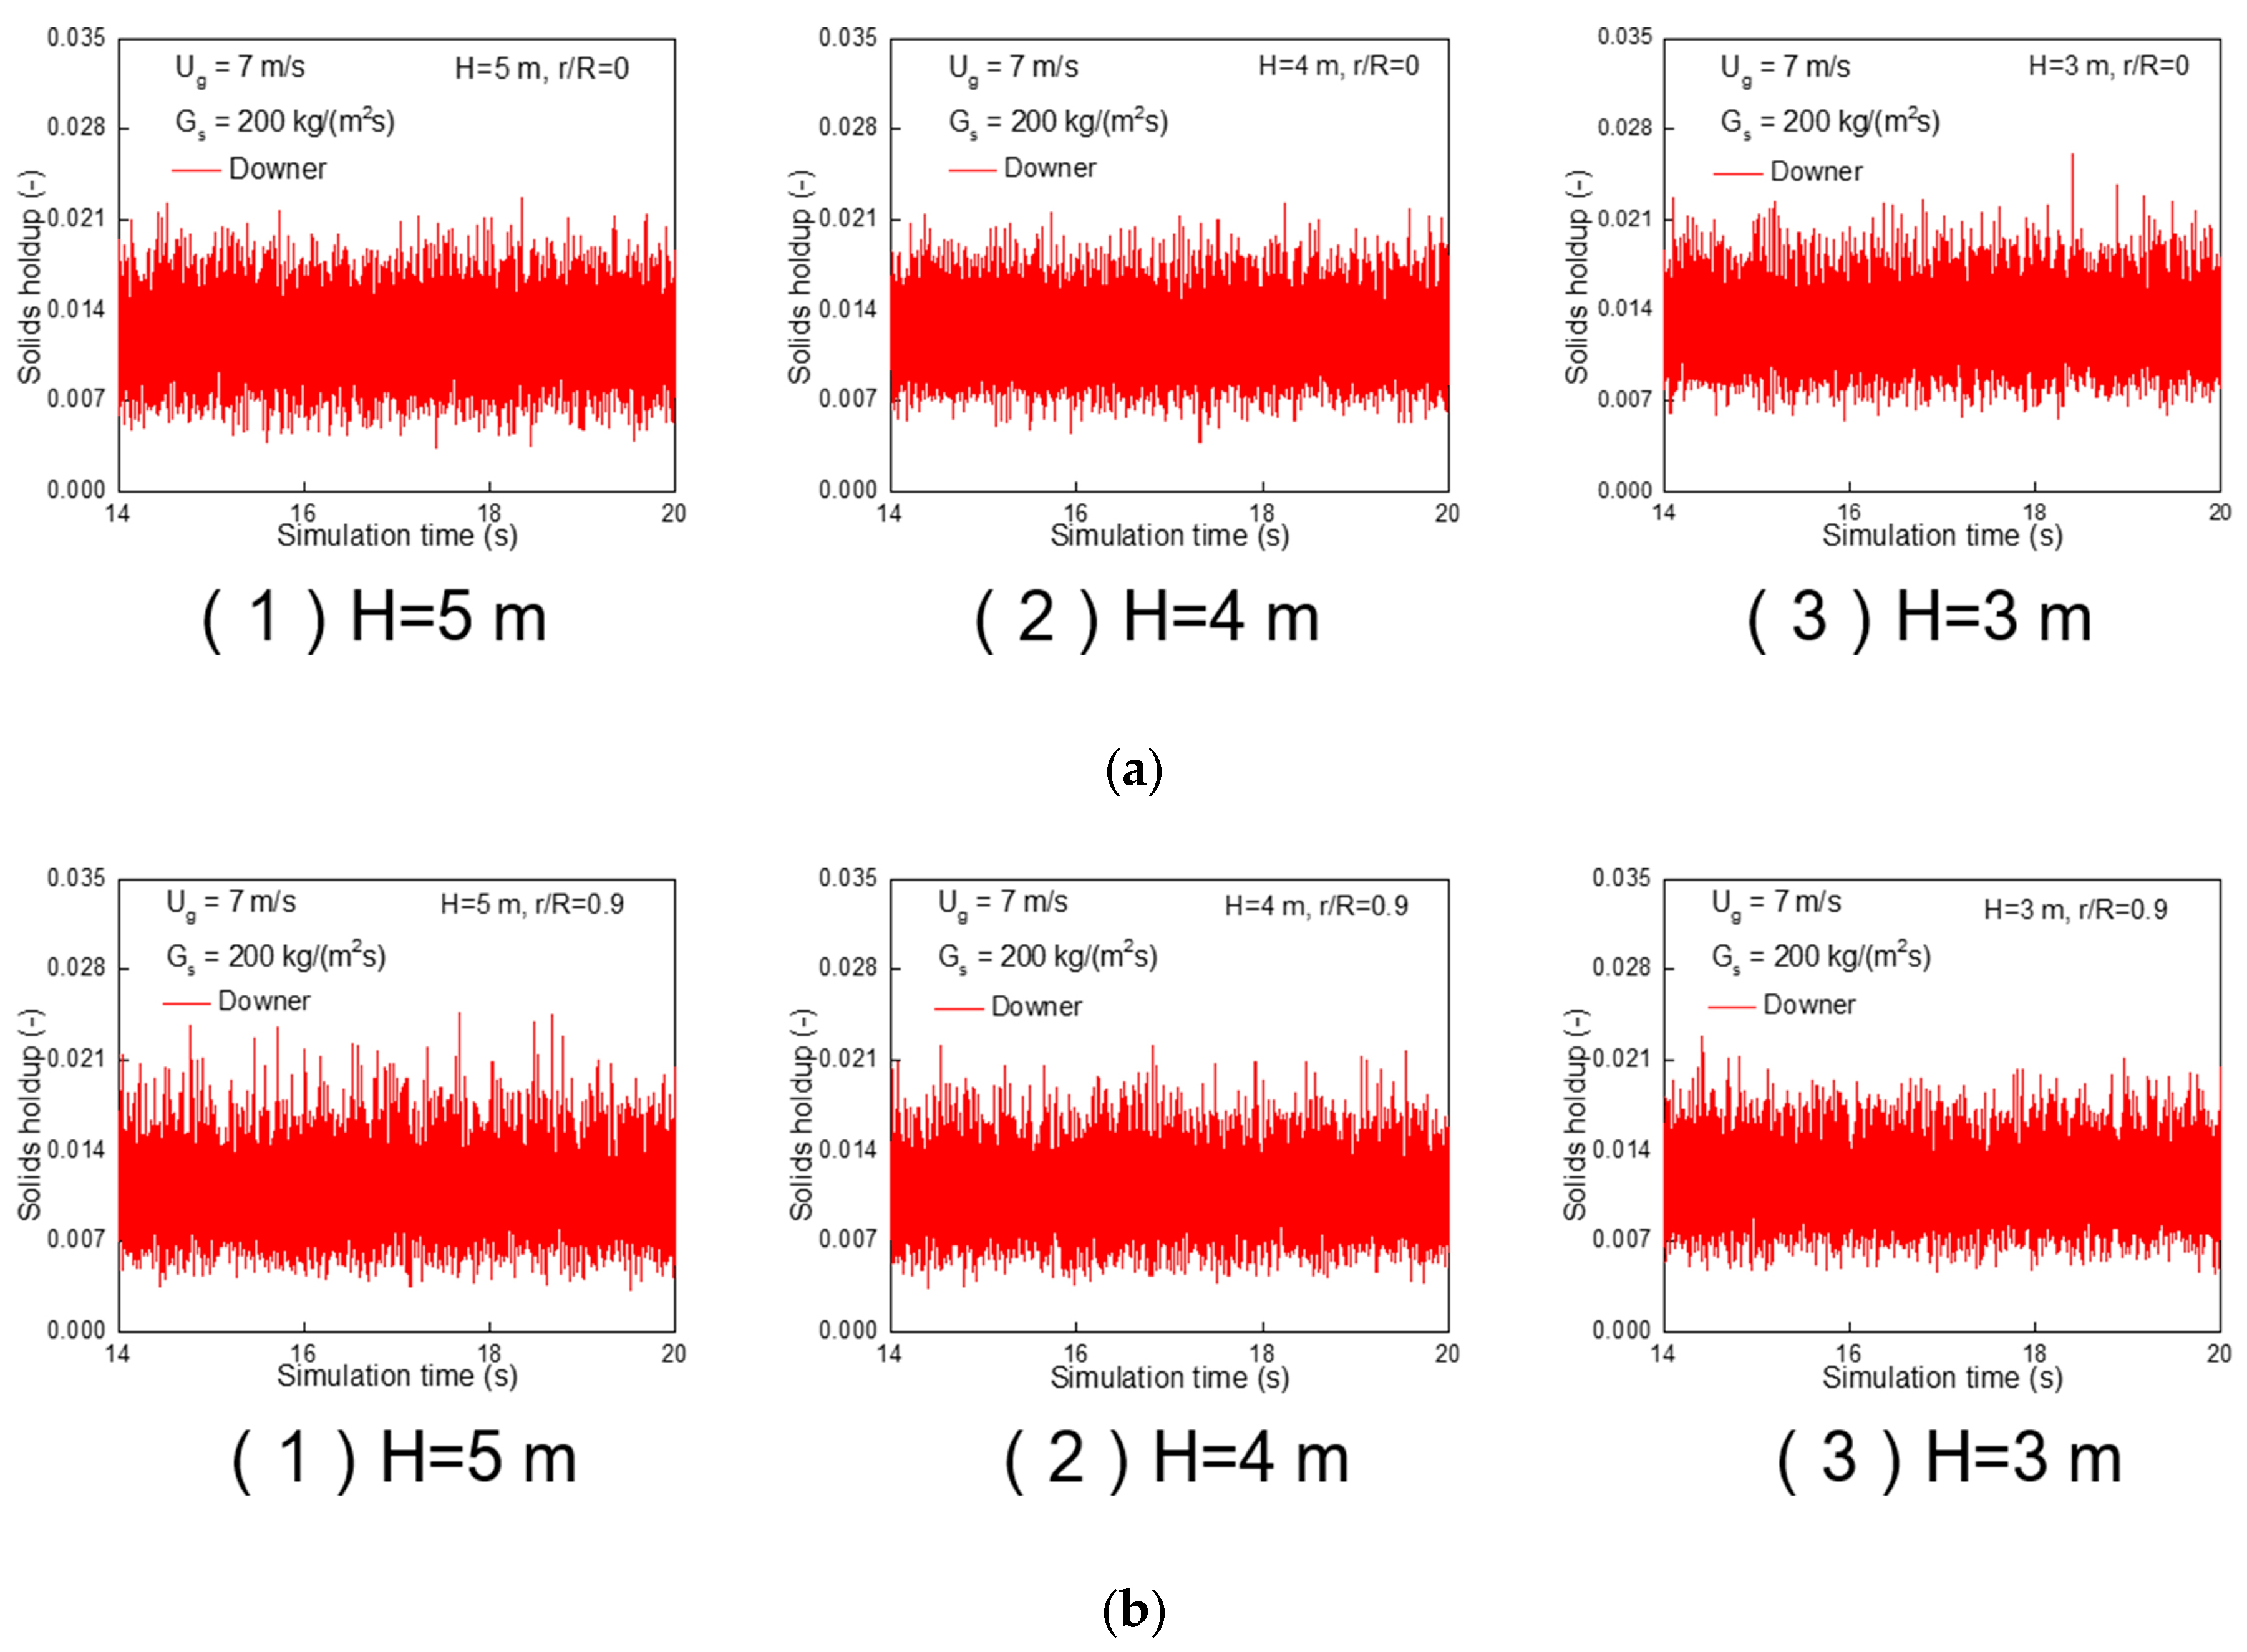
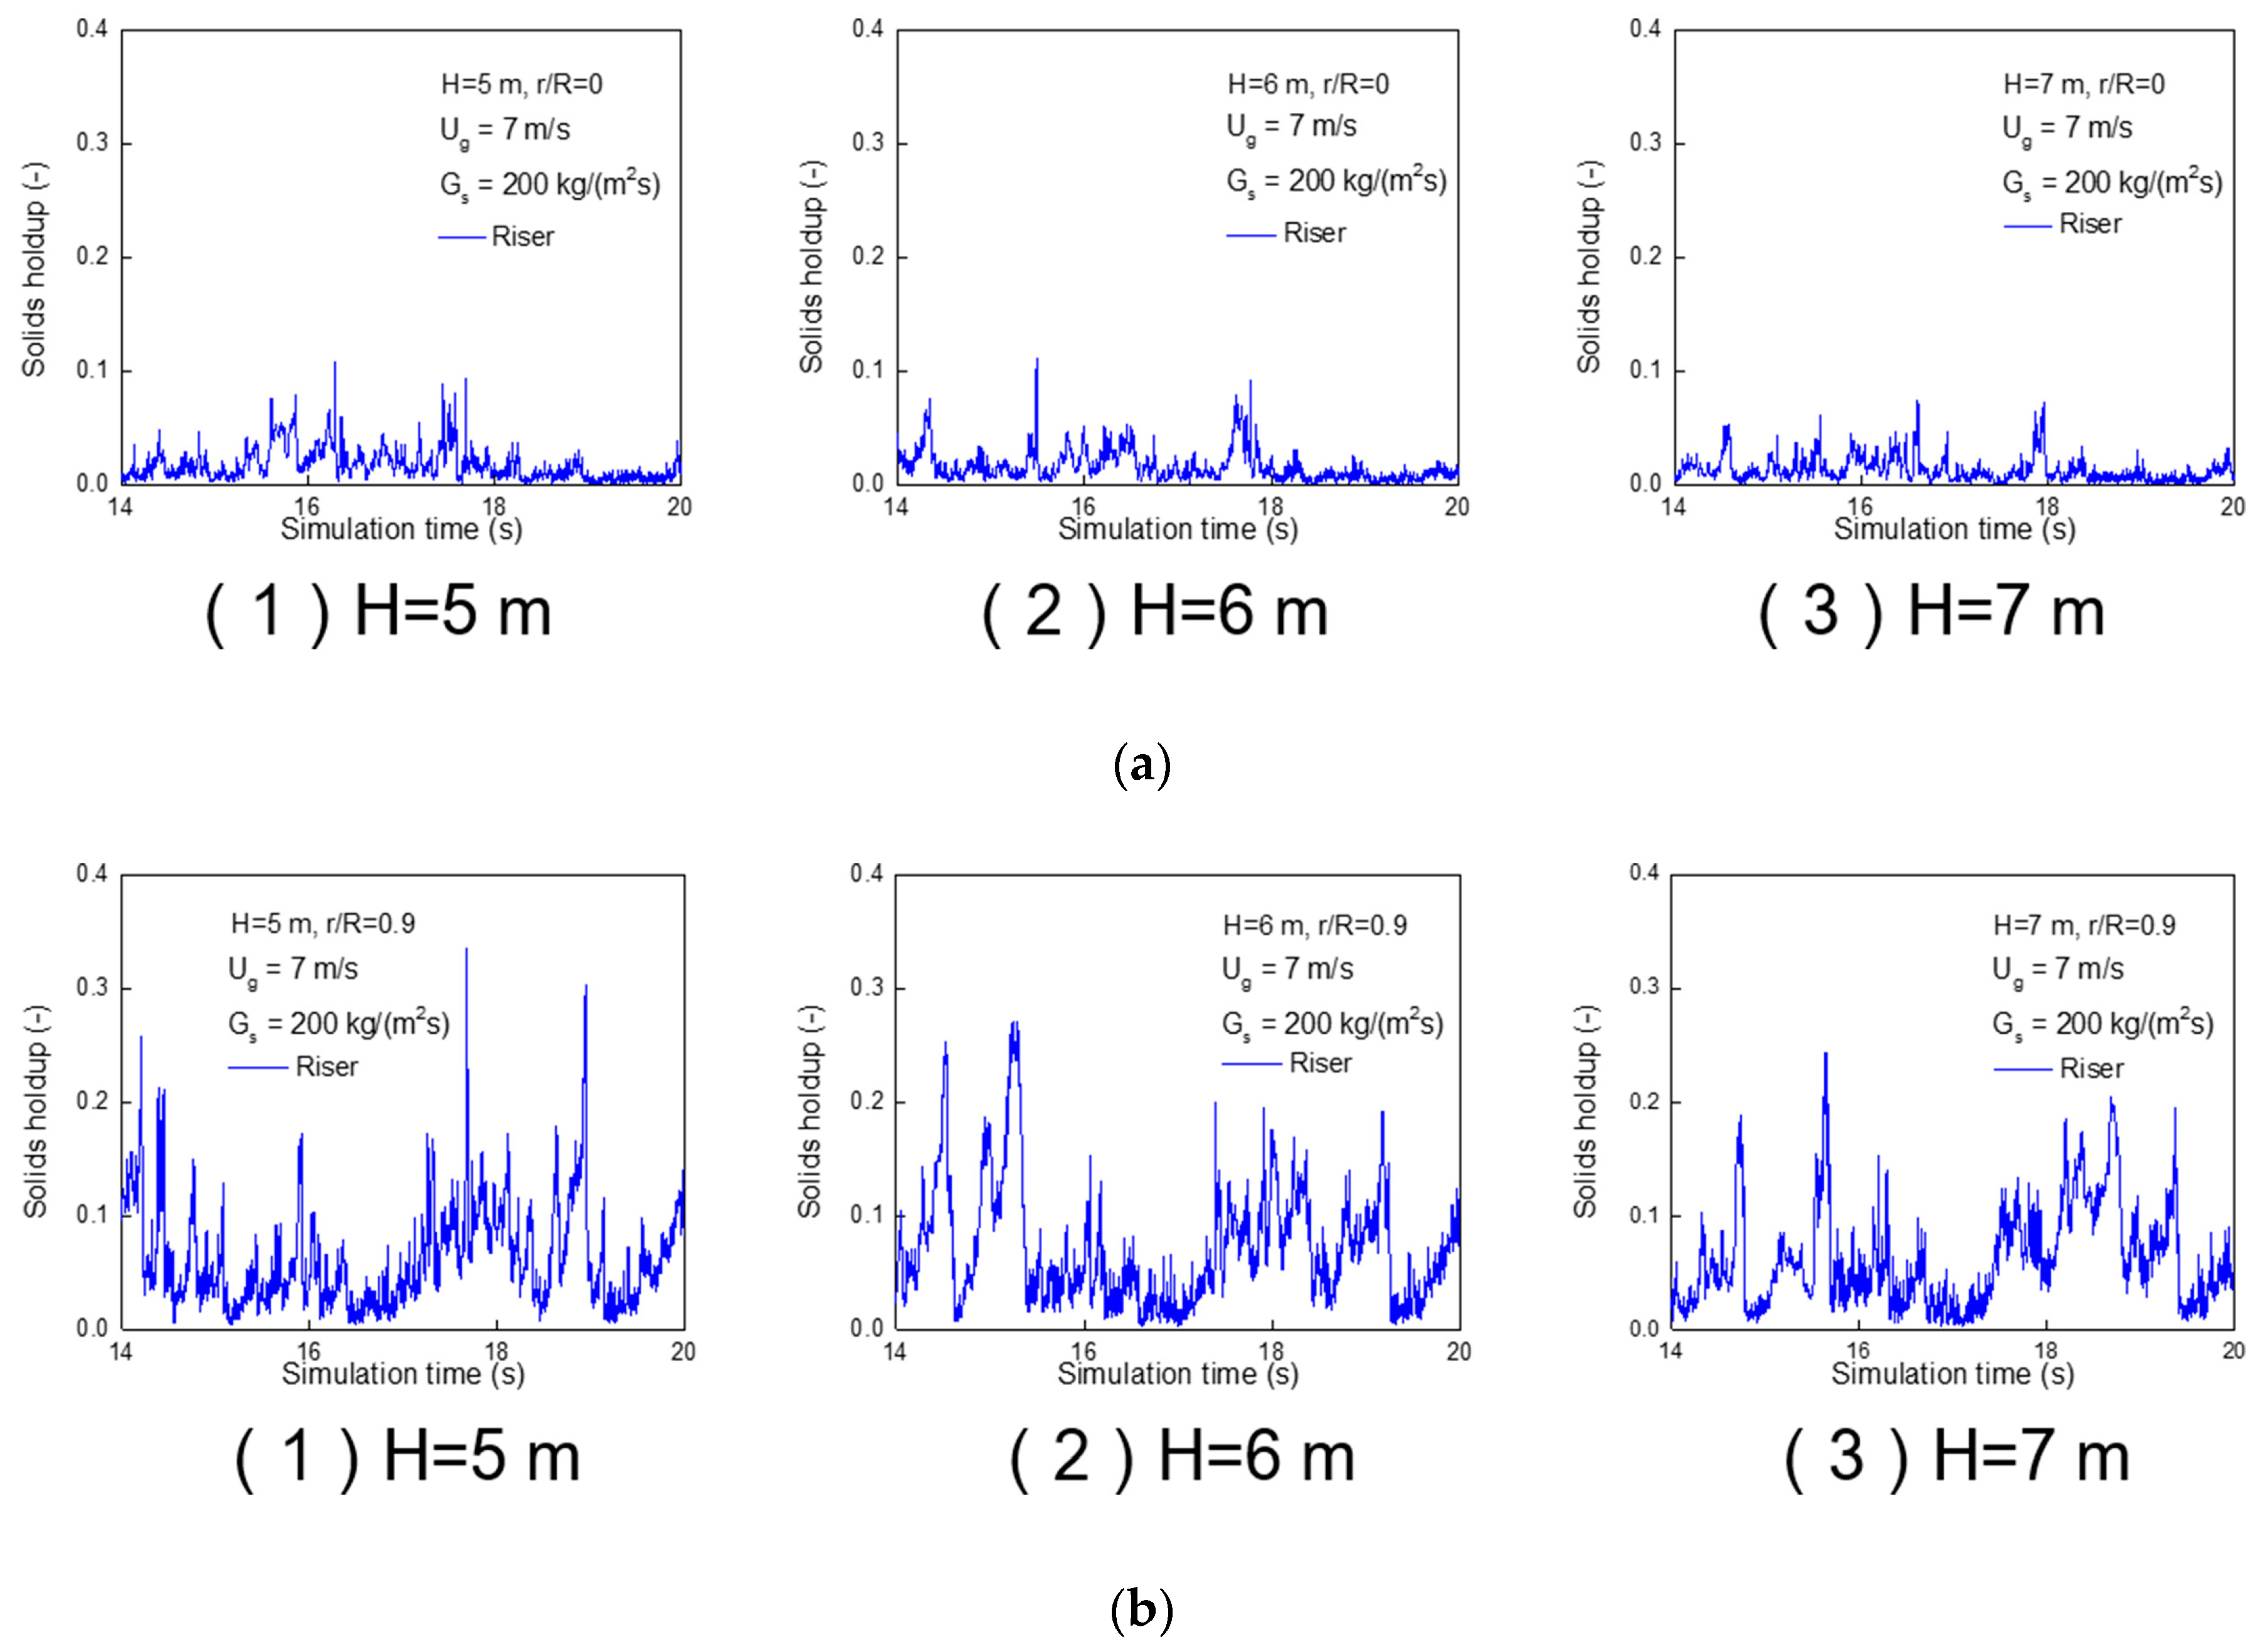
3.1. Solids Holdup
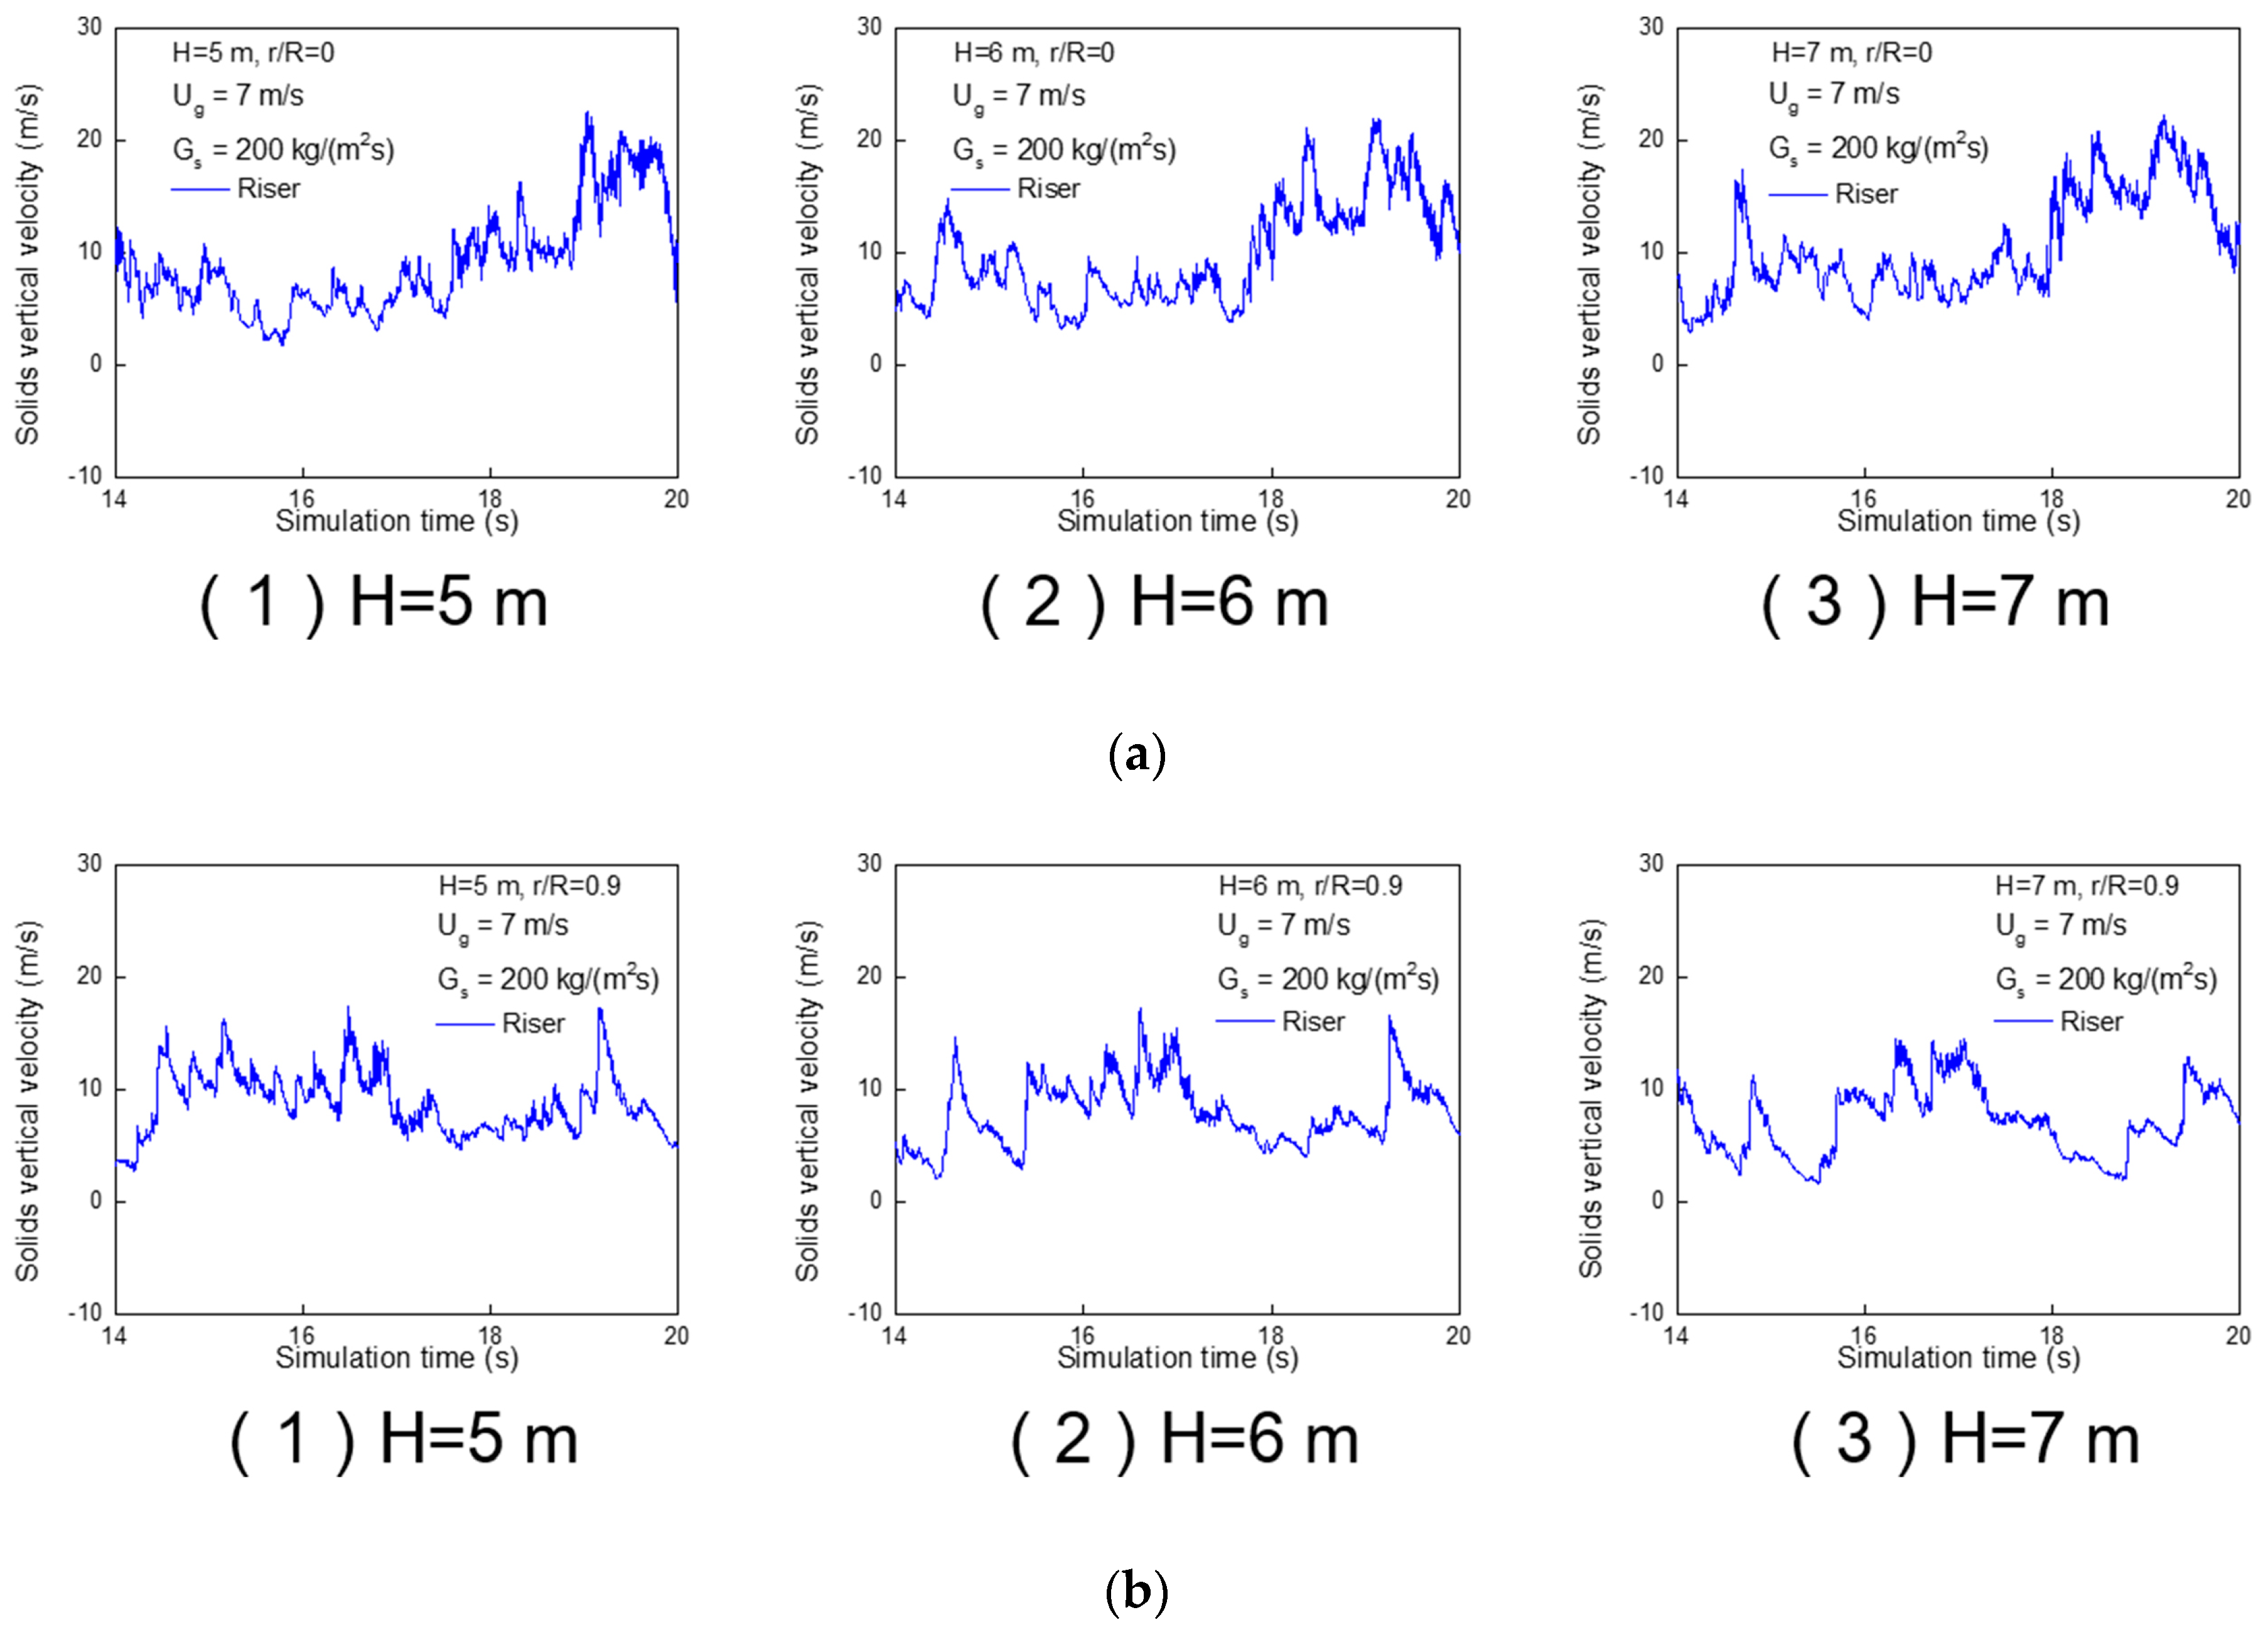
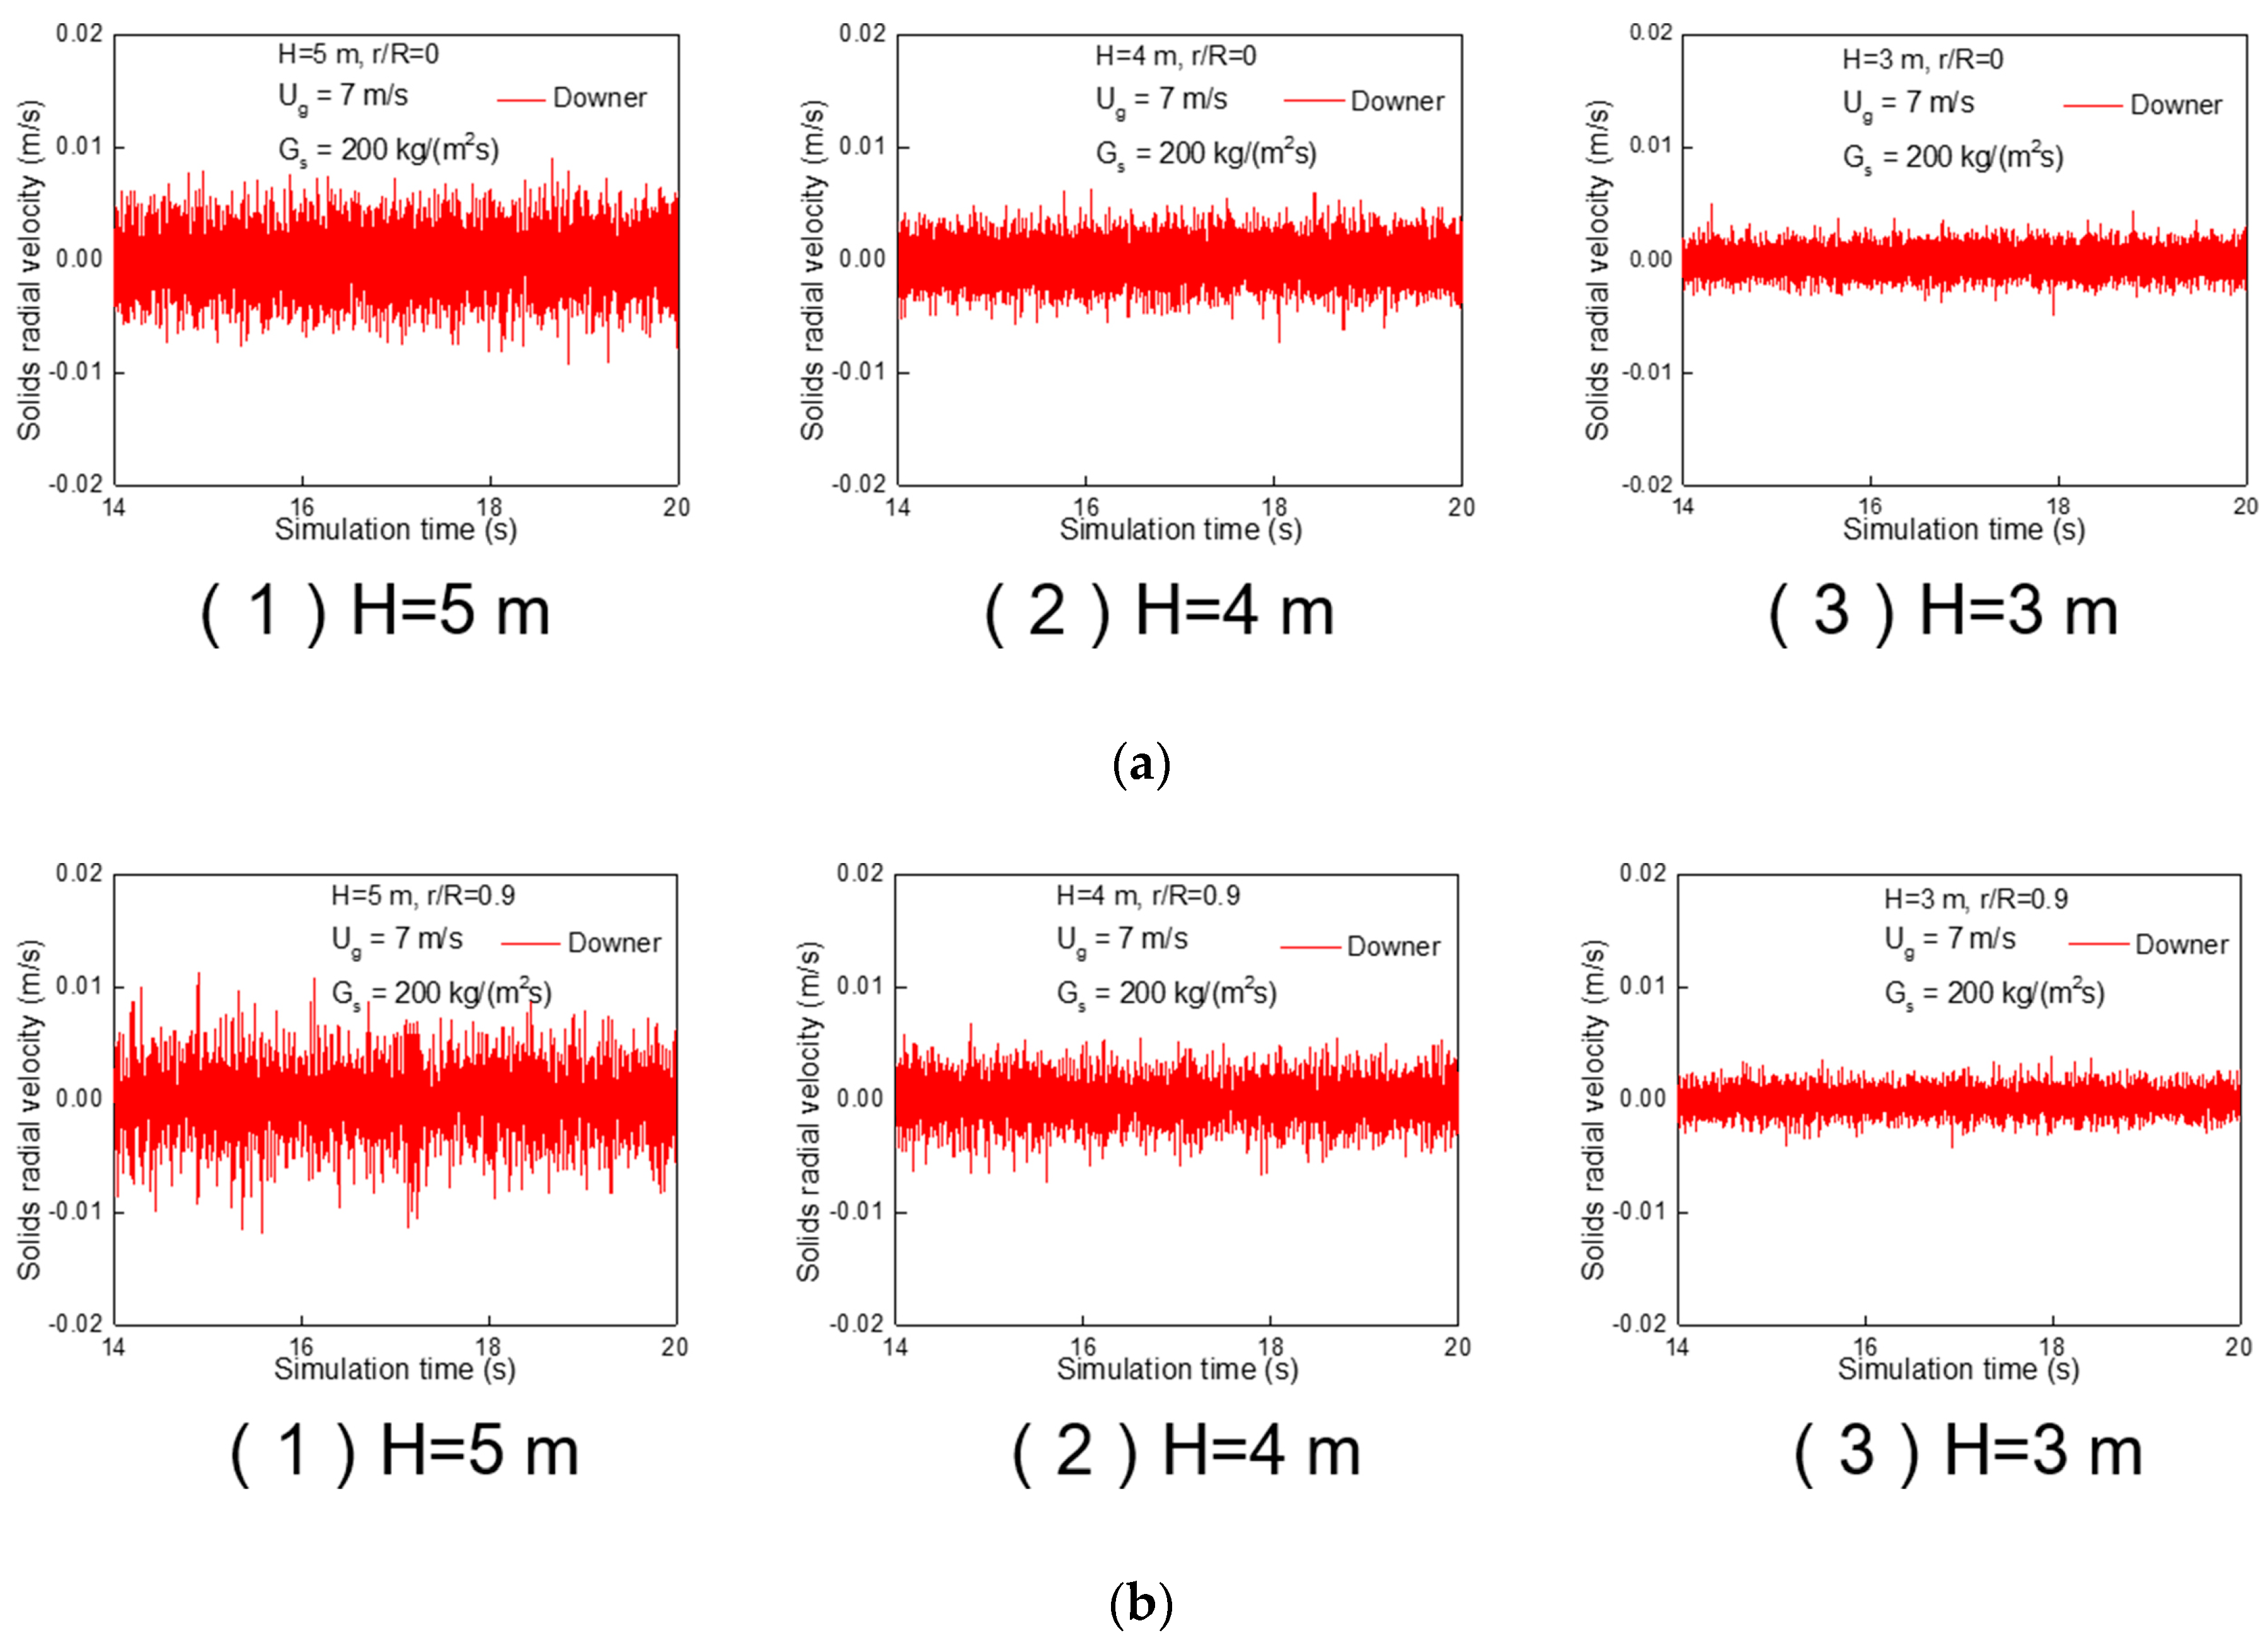
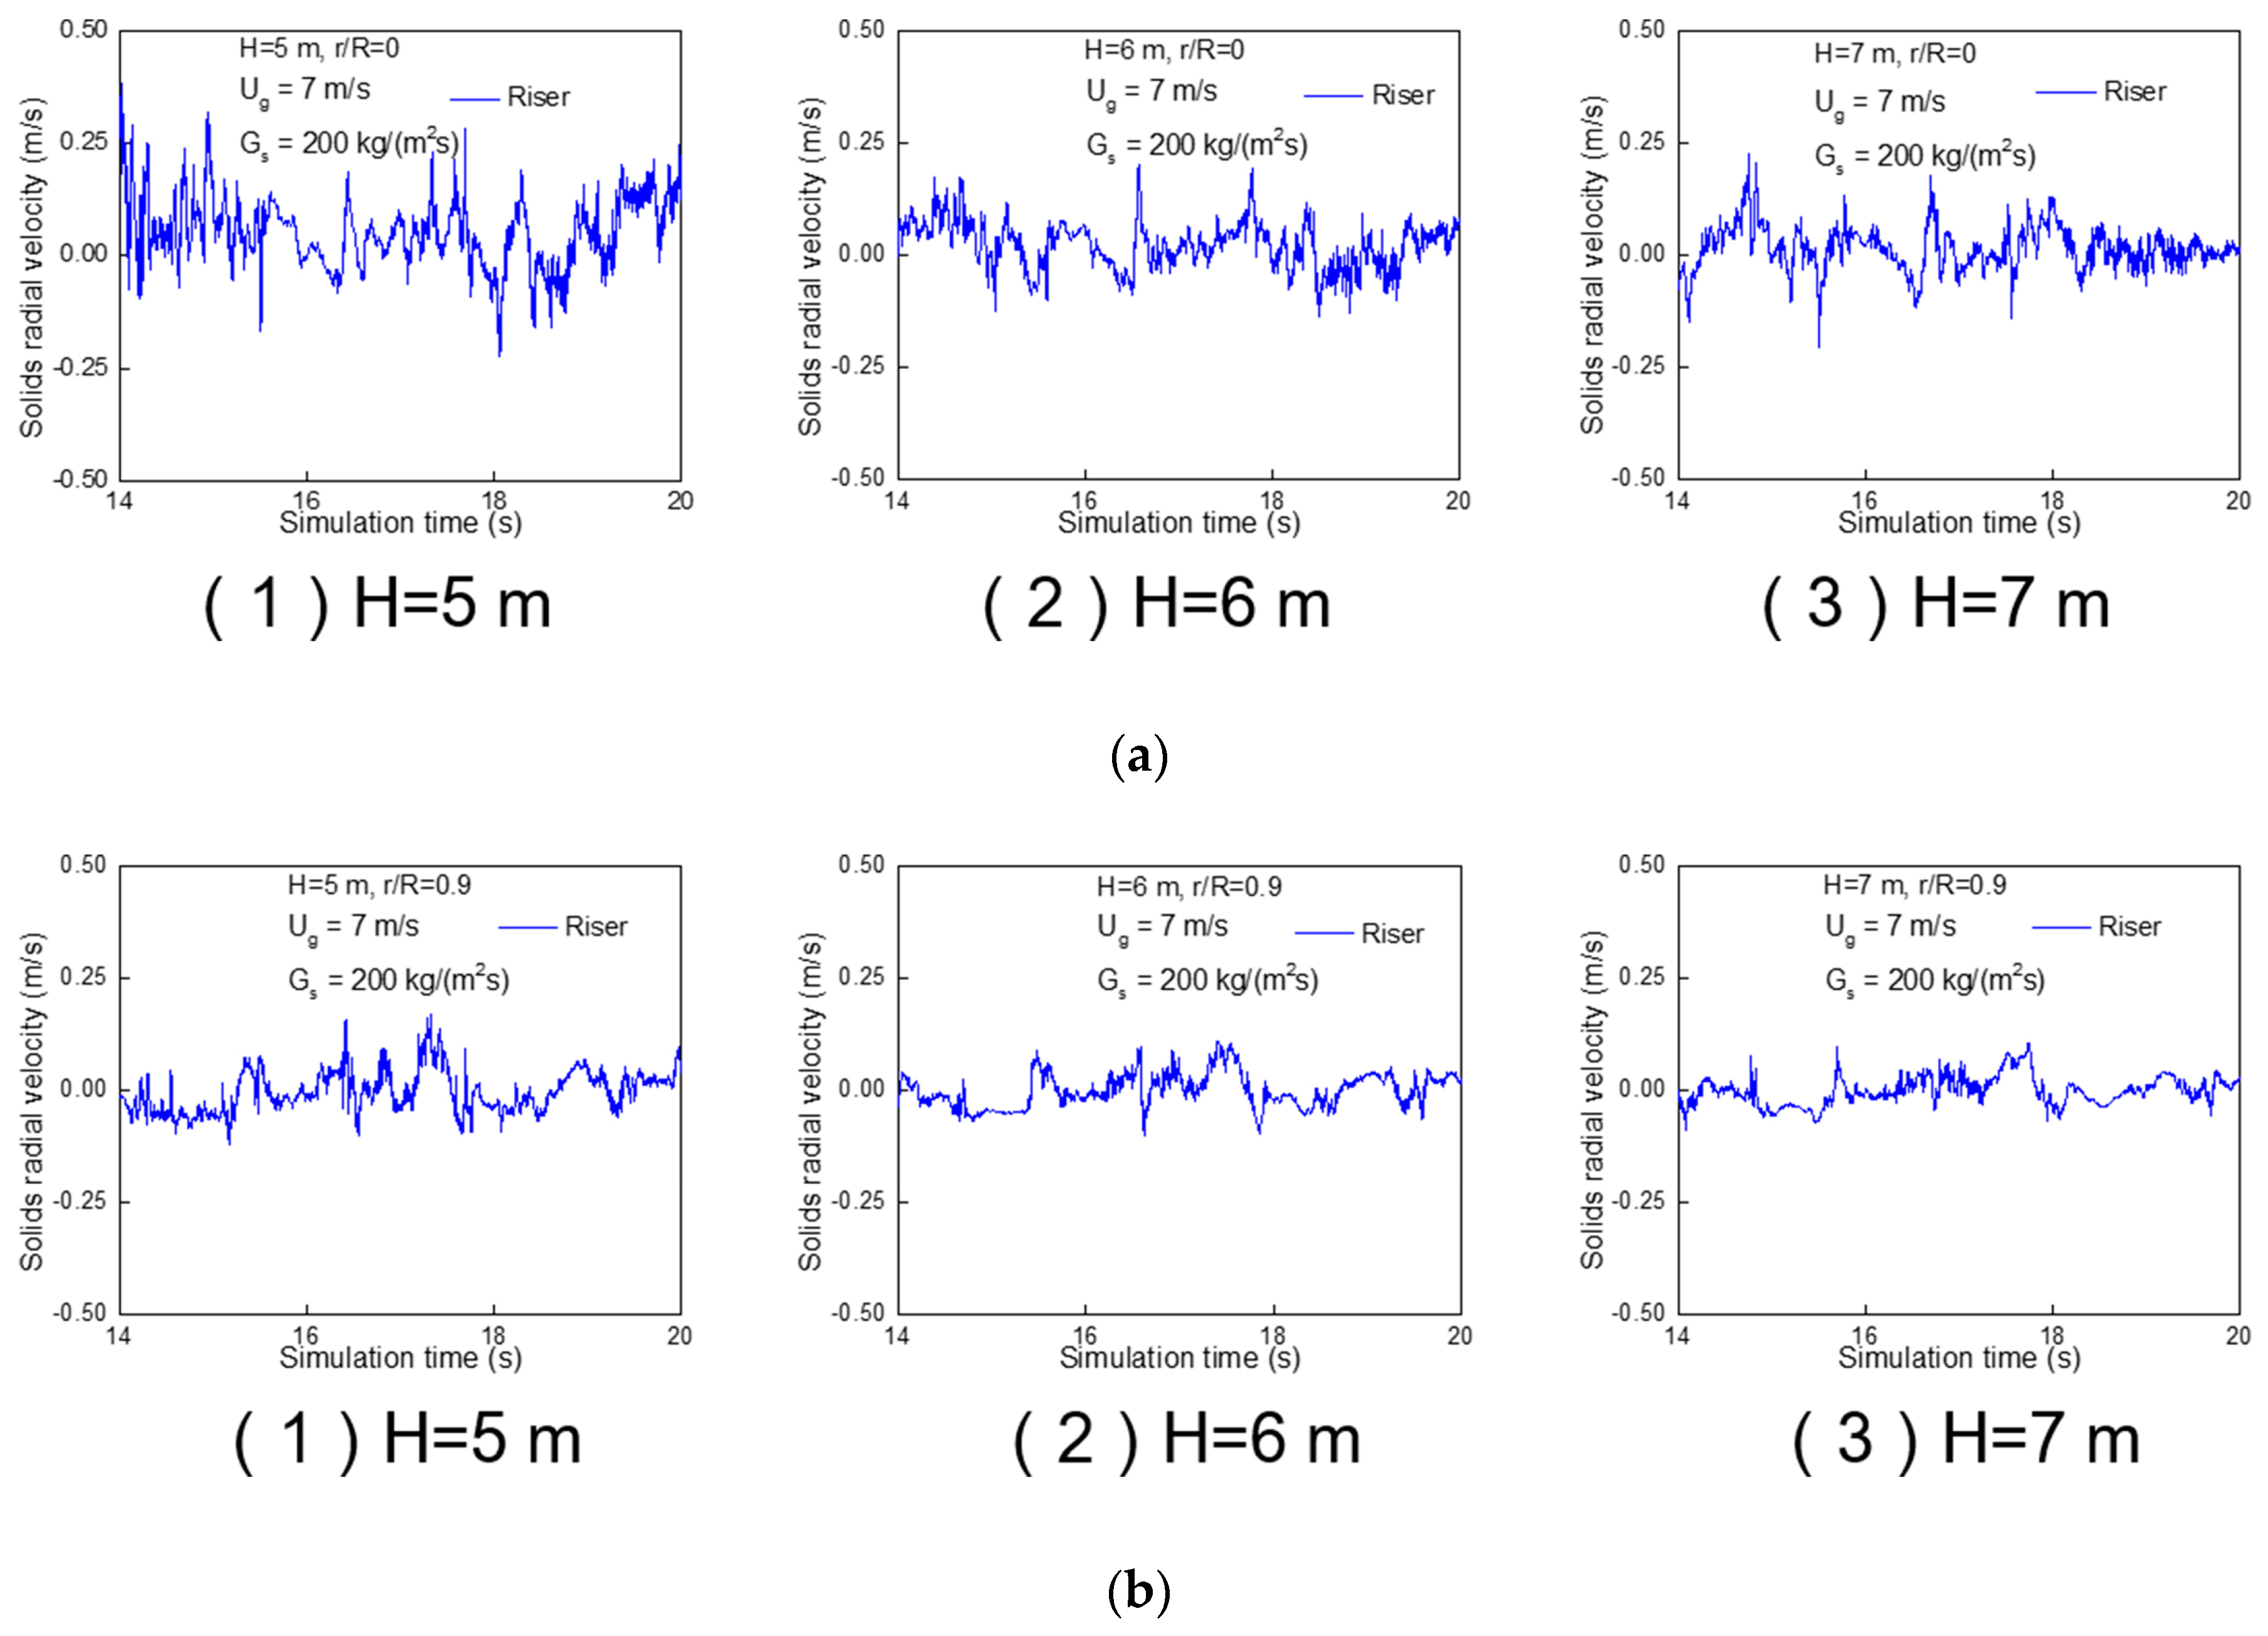
3.2. Solids Velocity
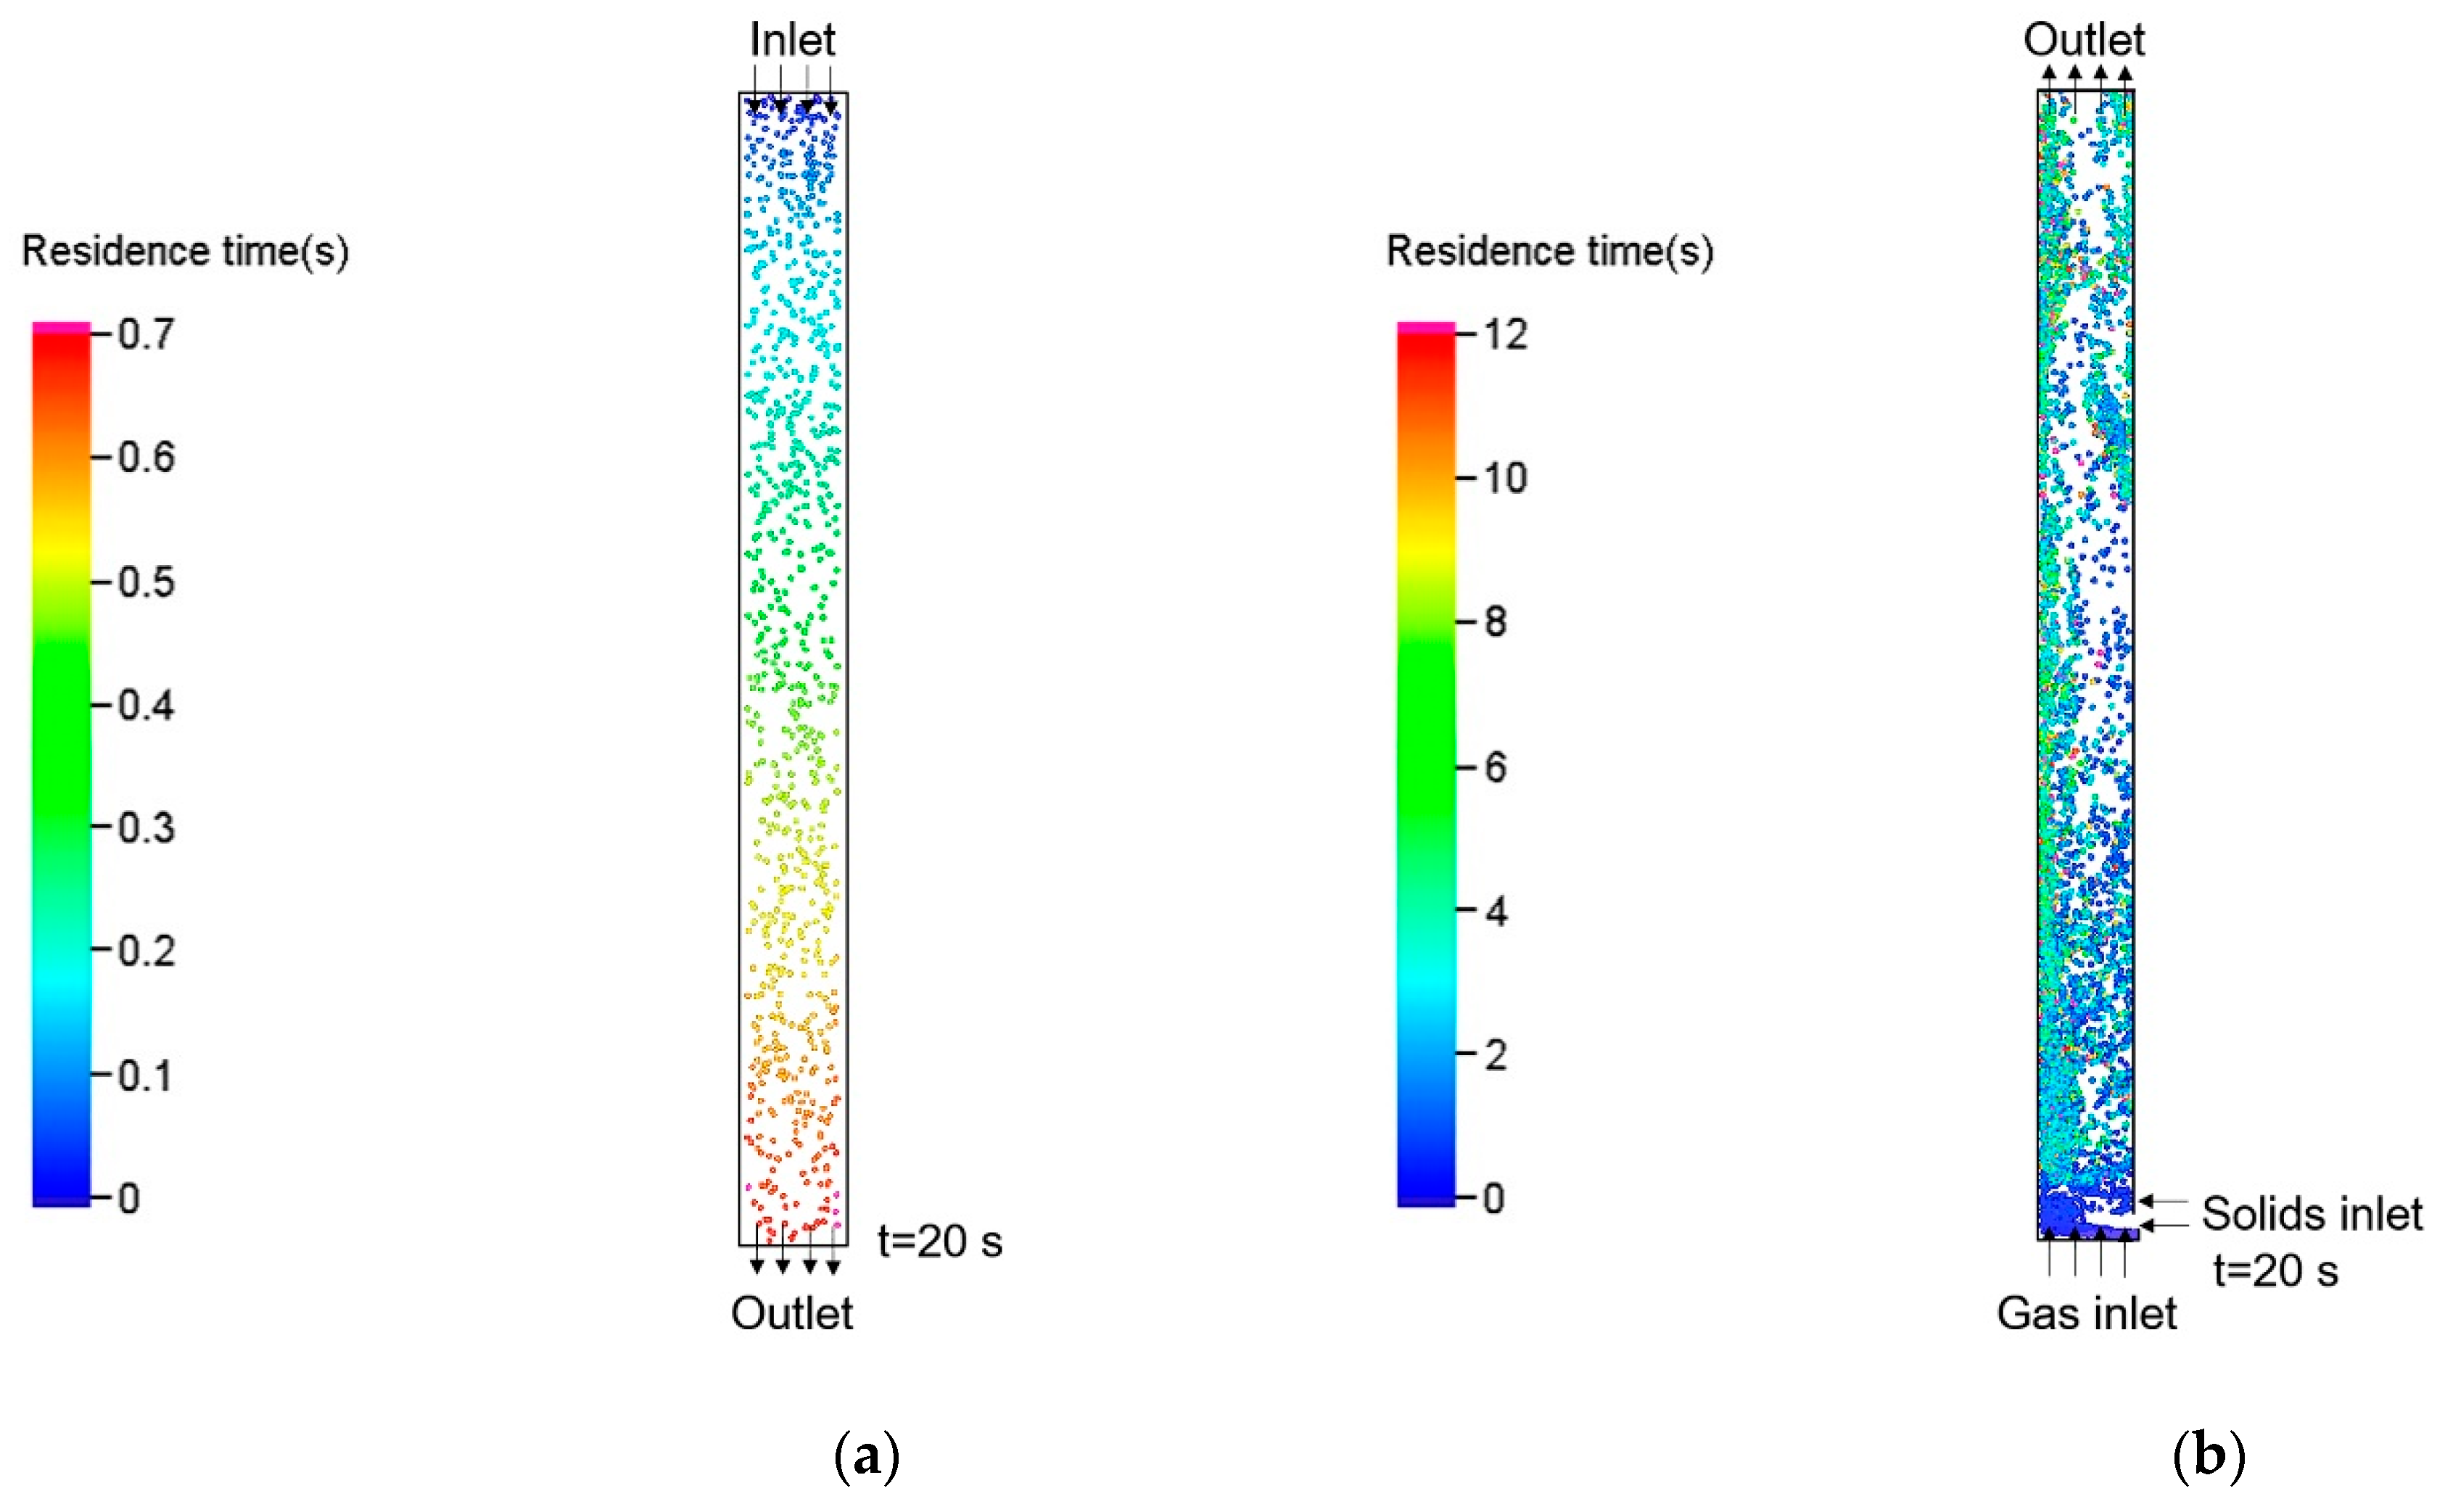
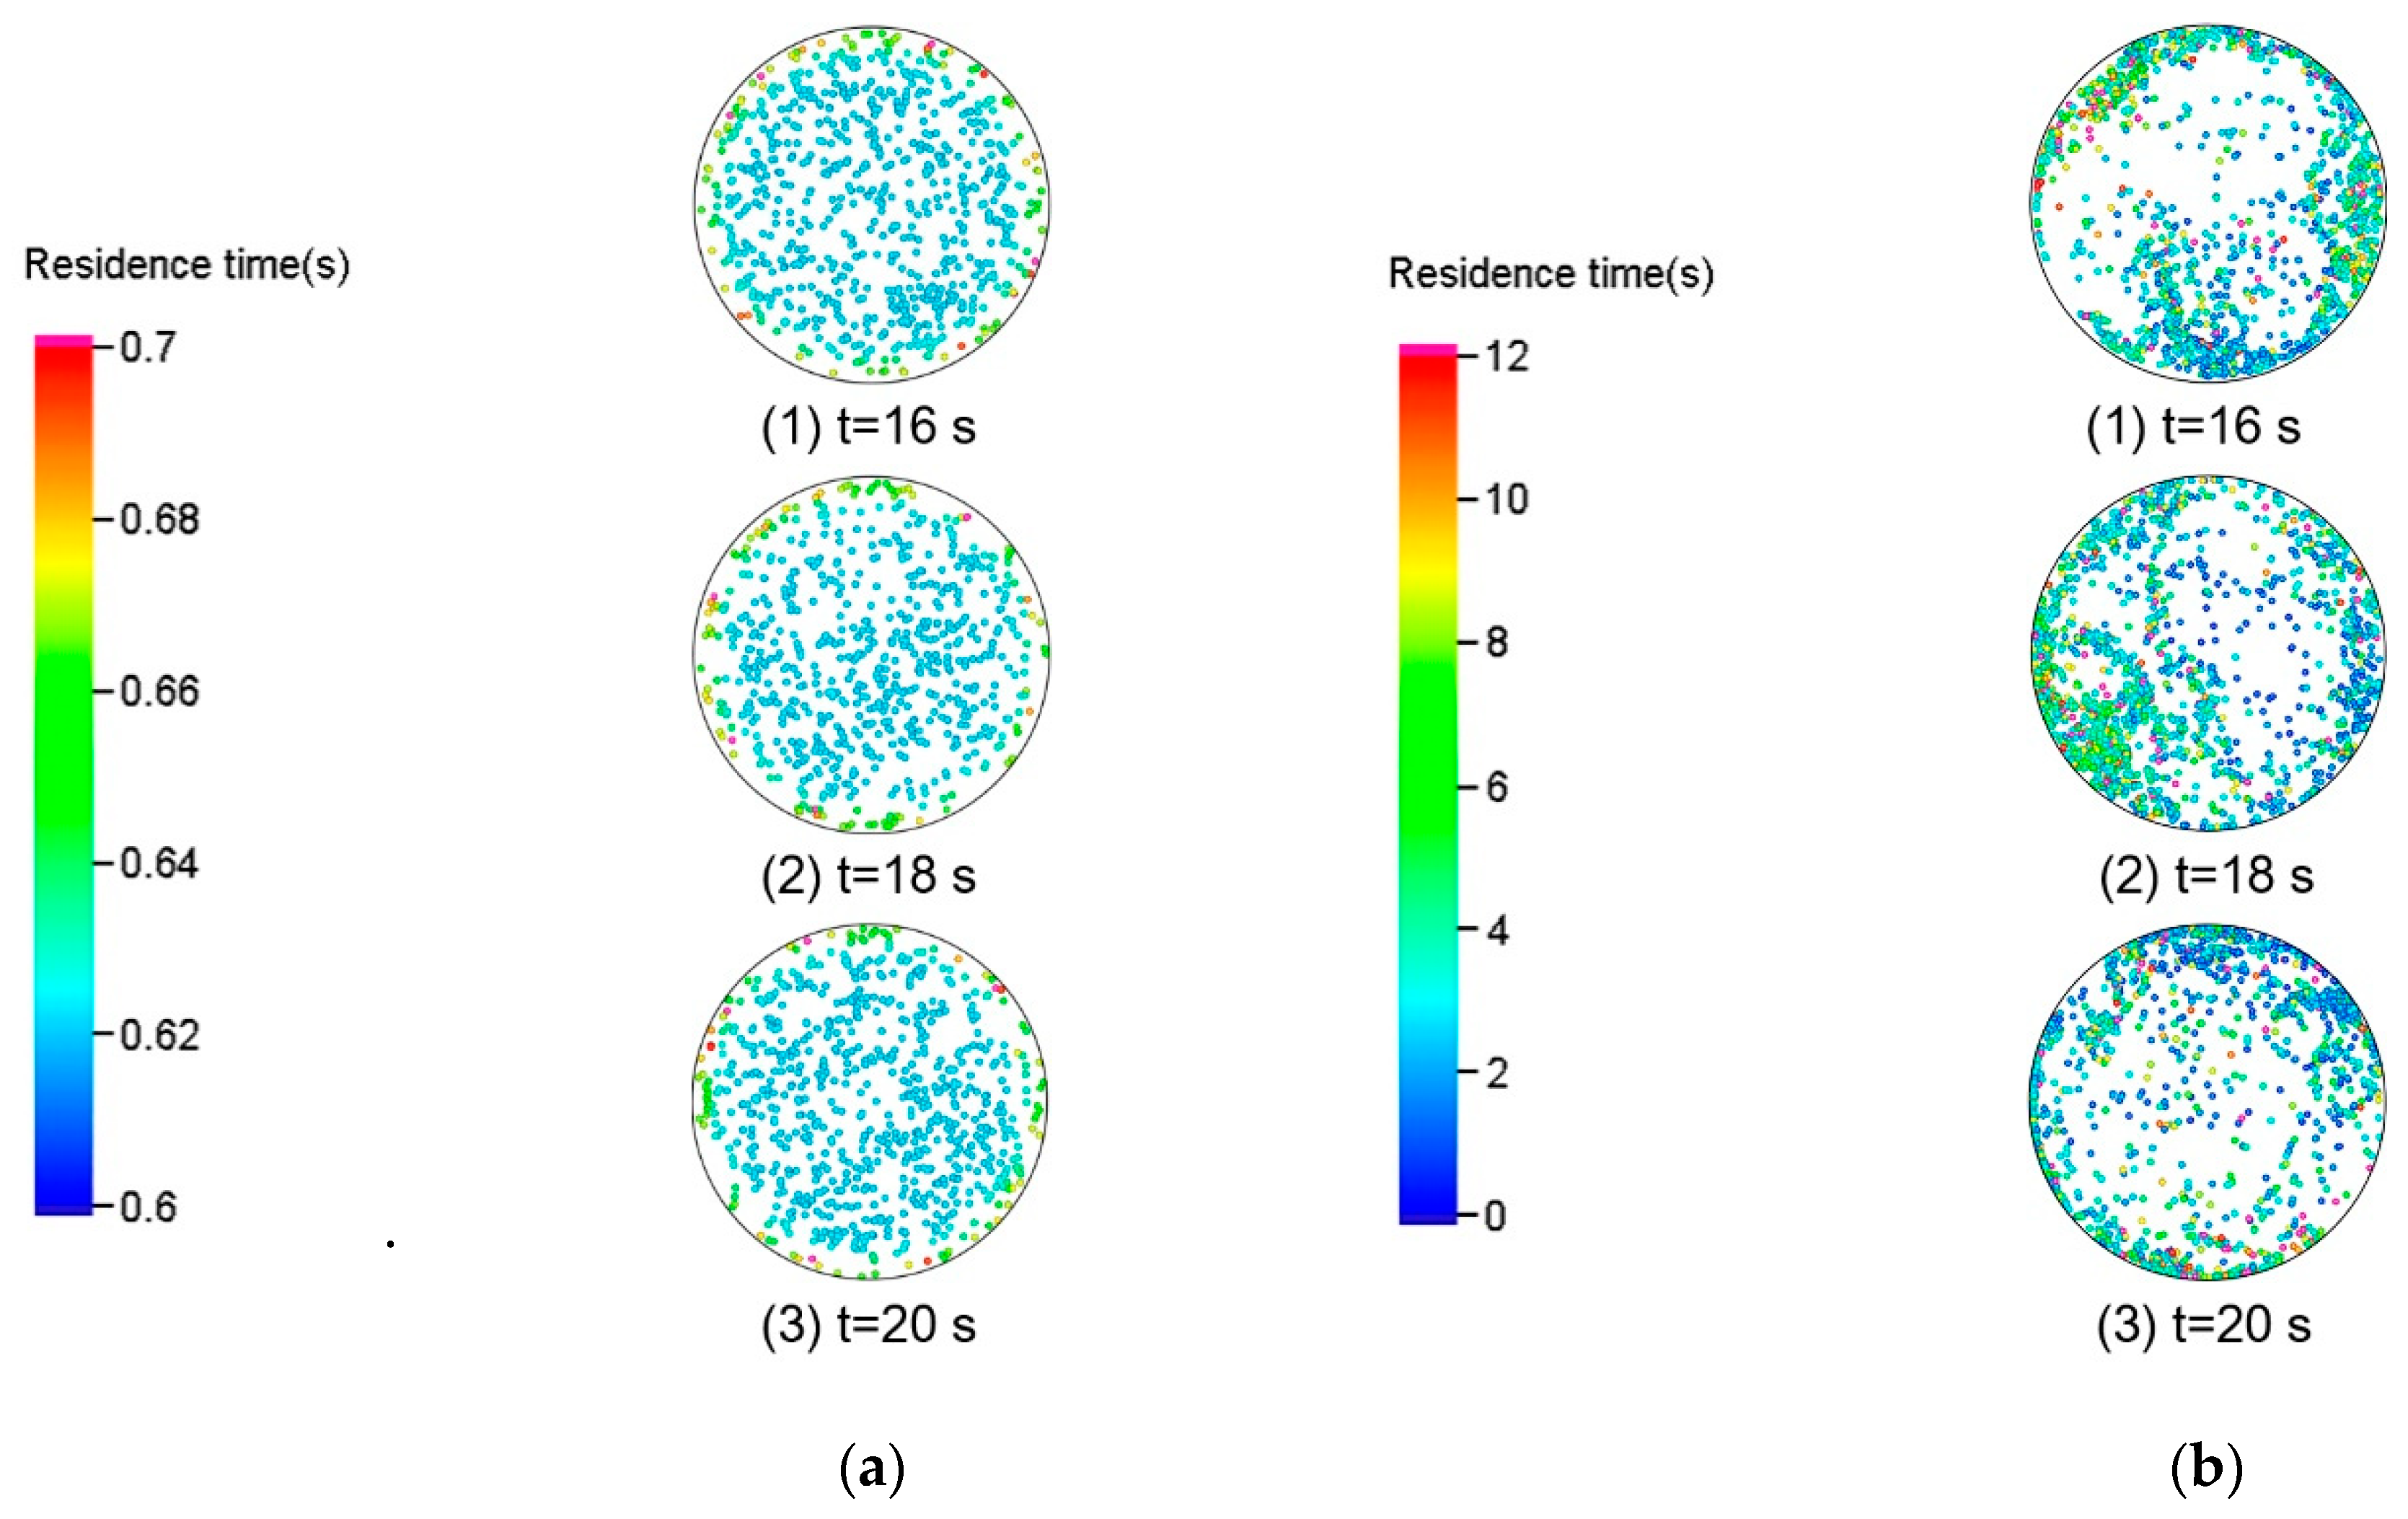
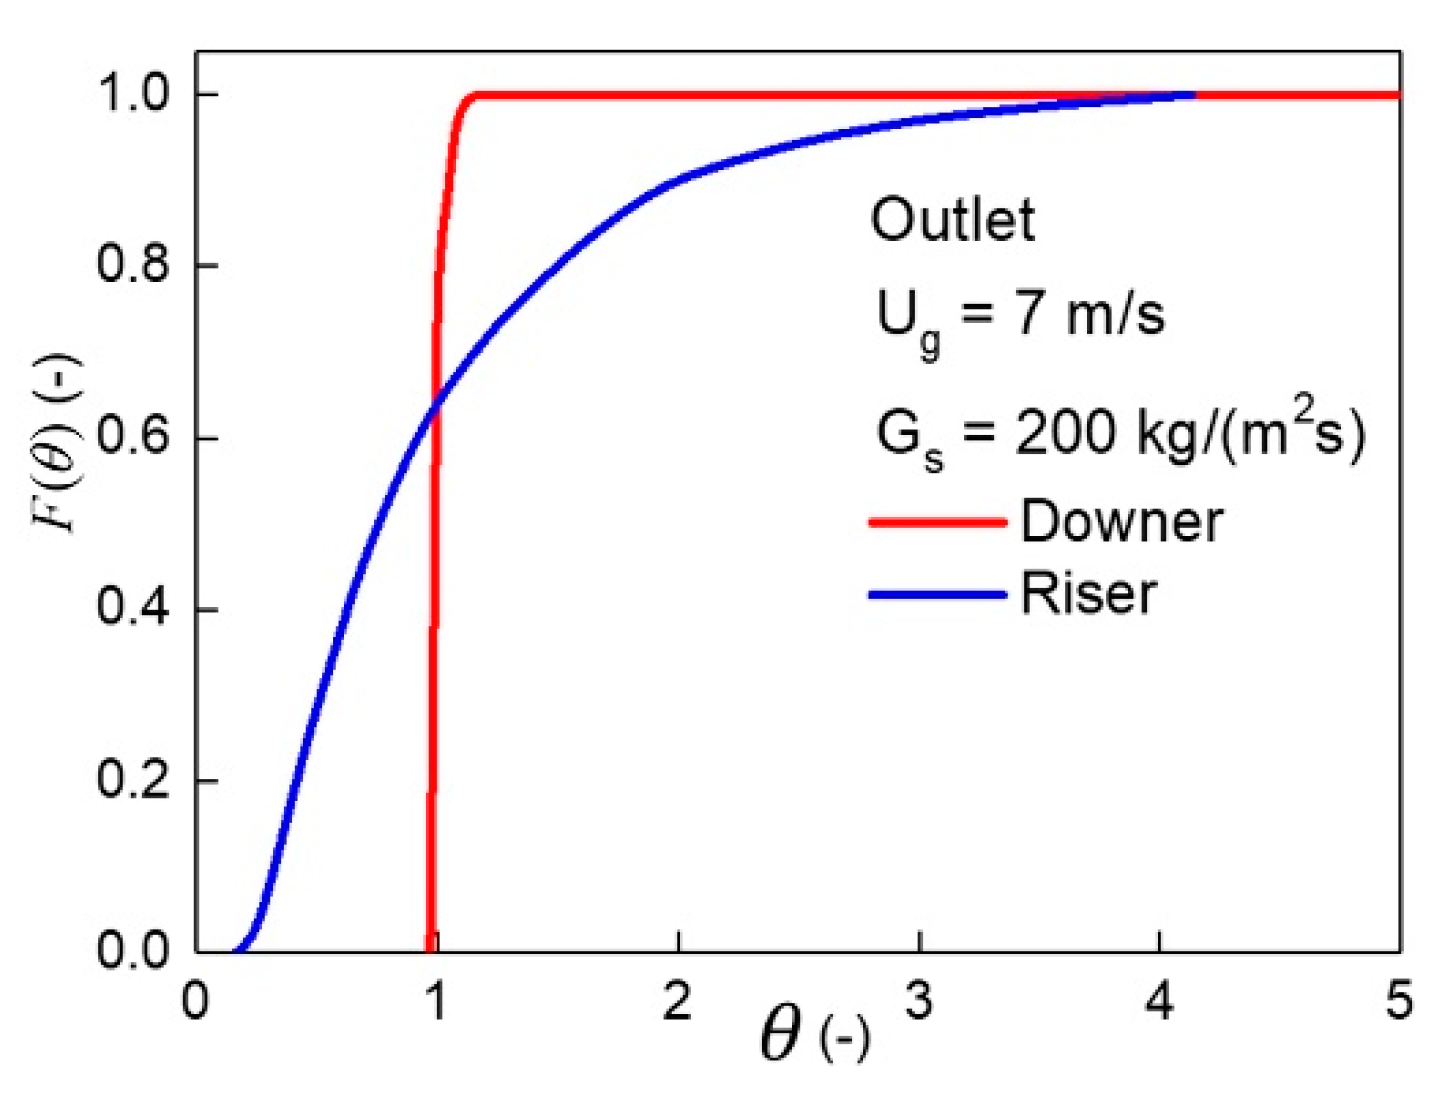
3.3. Solids Residence Time
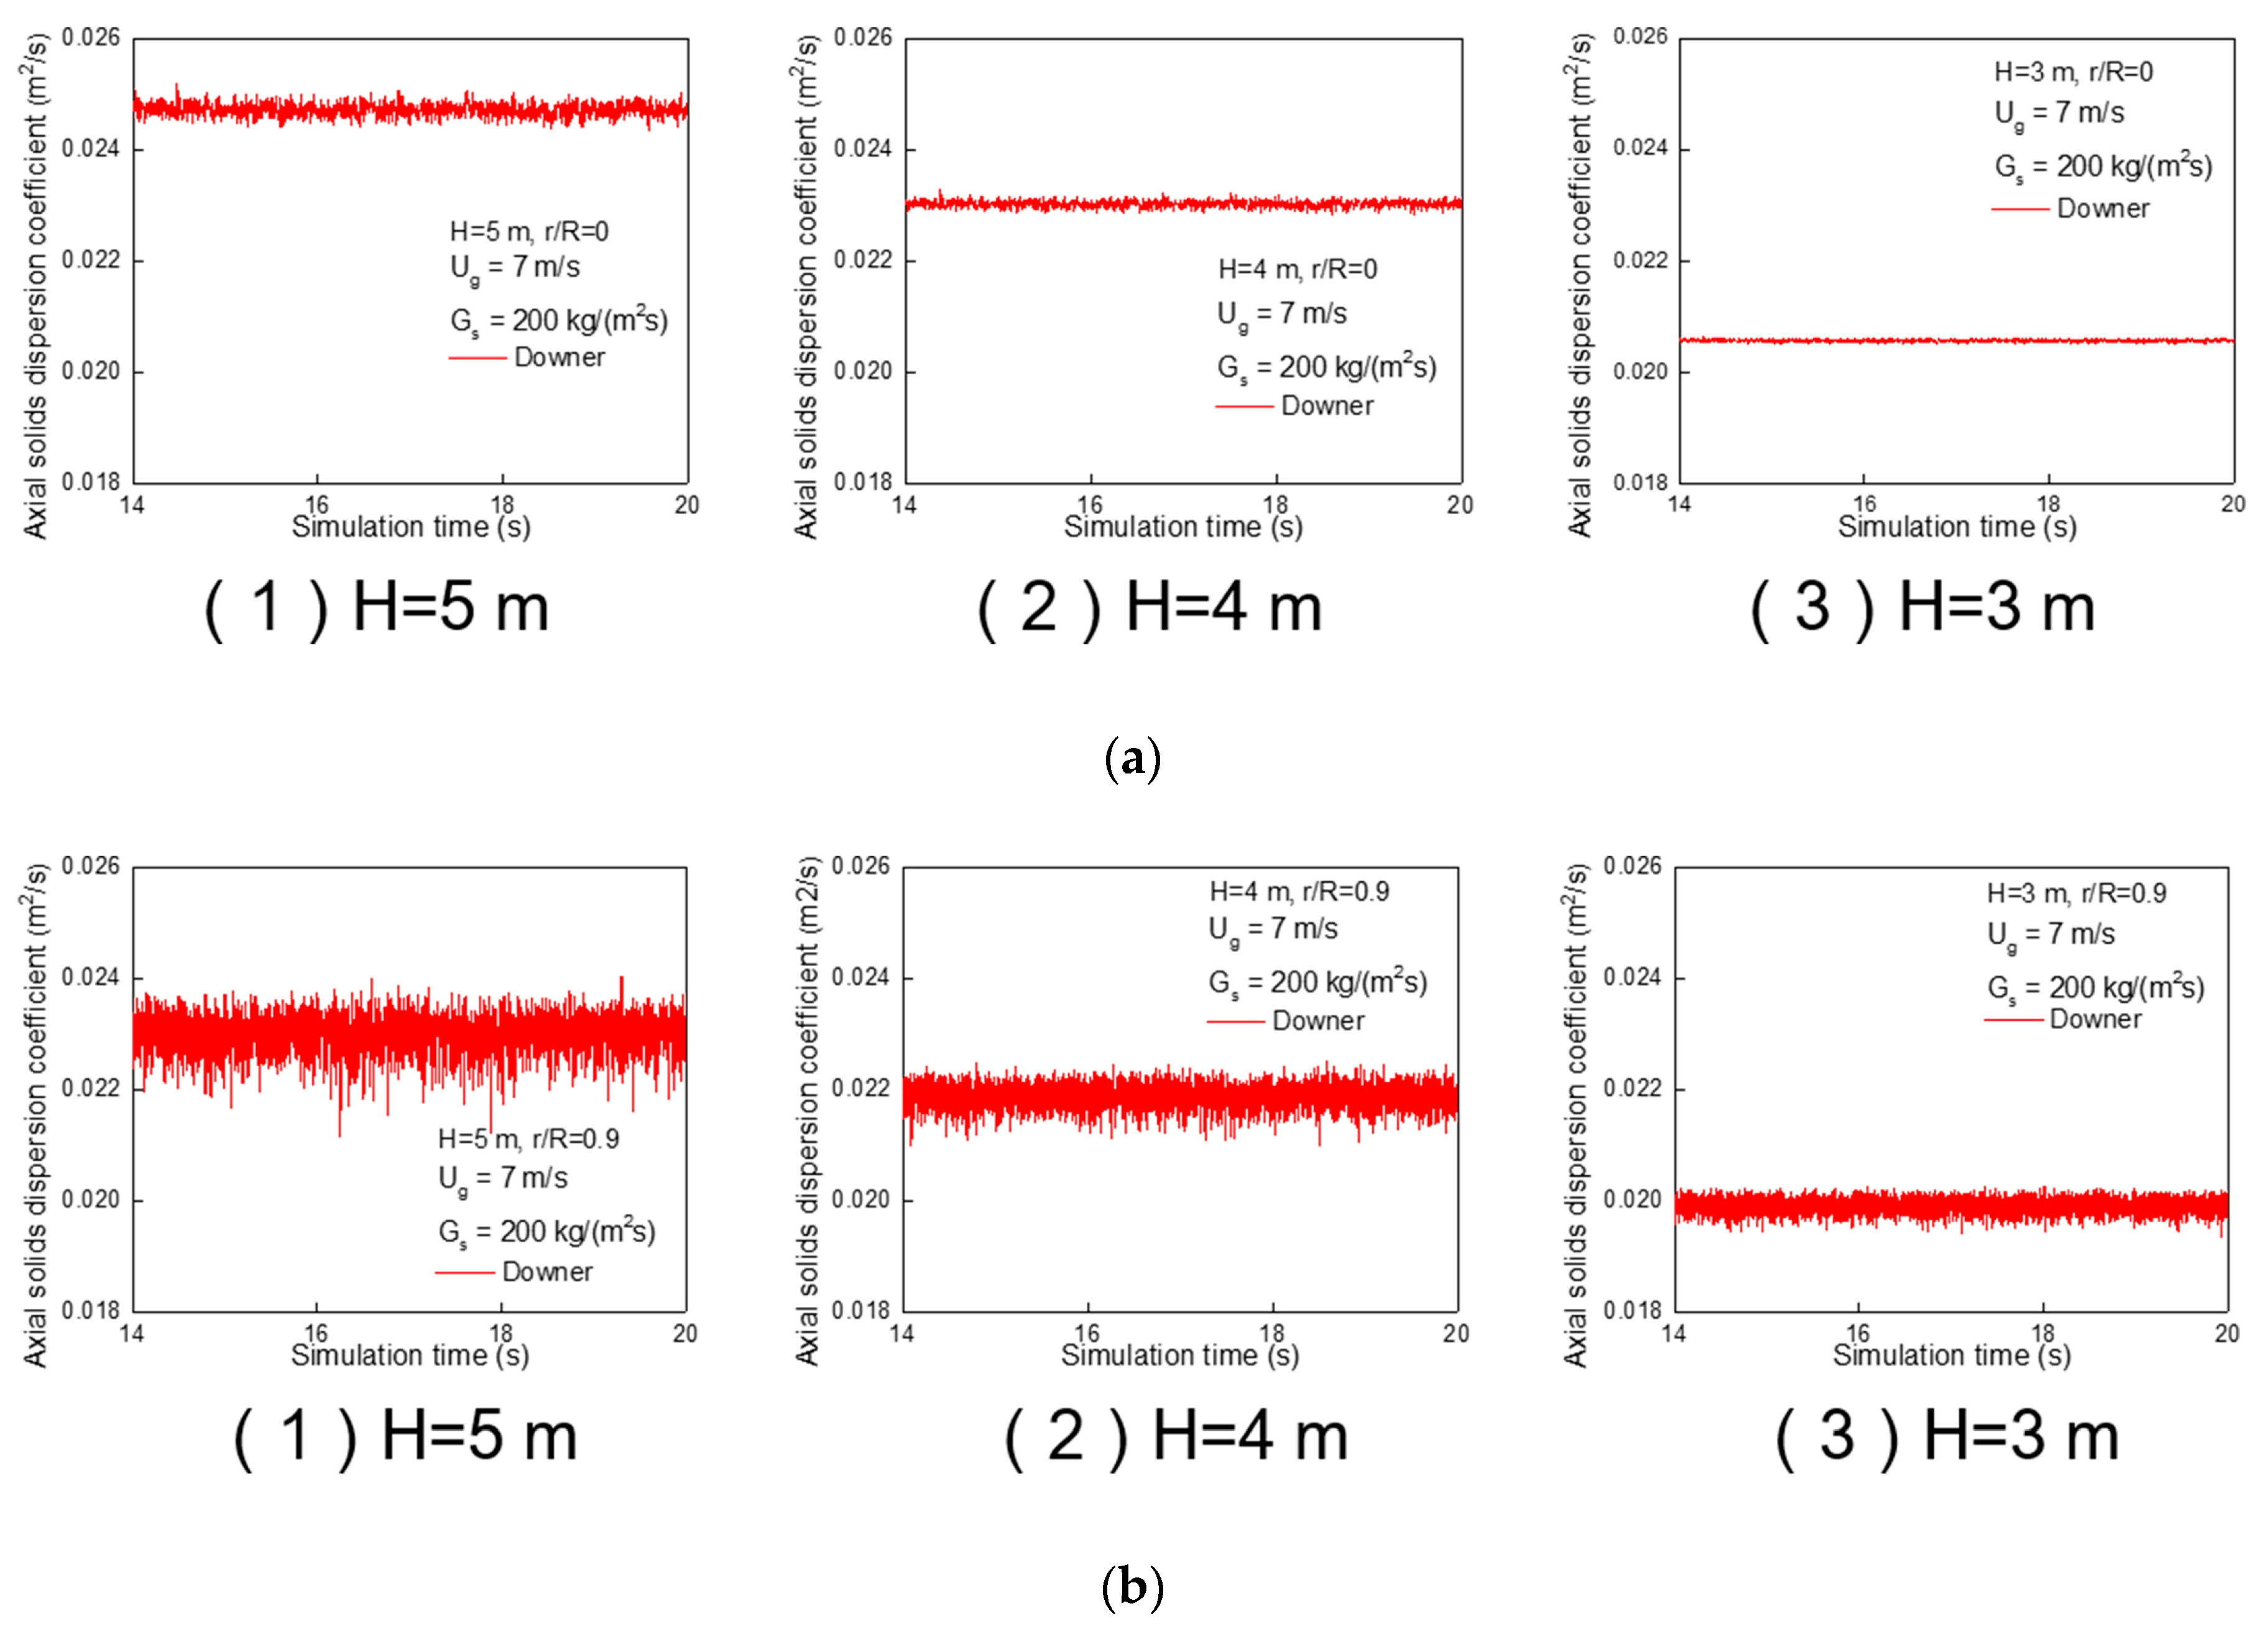
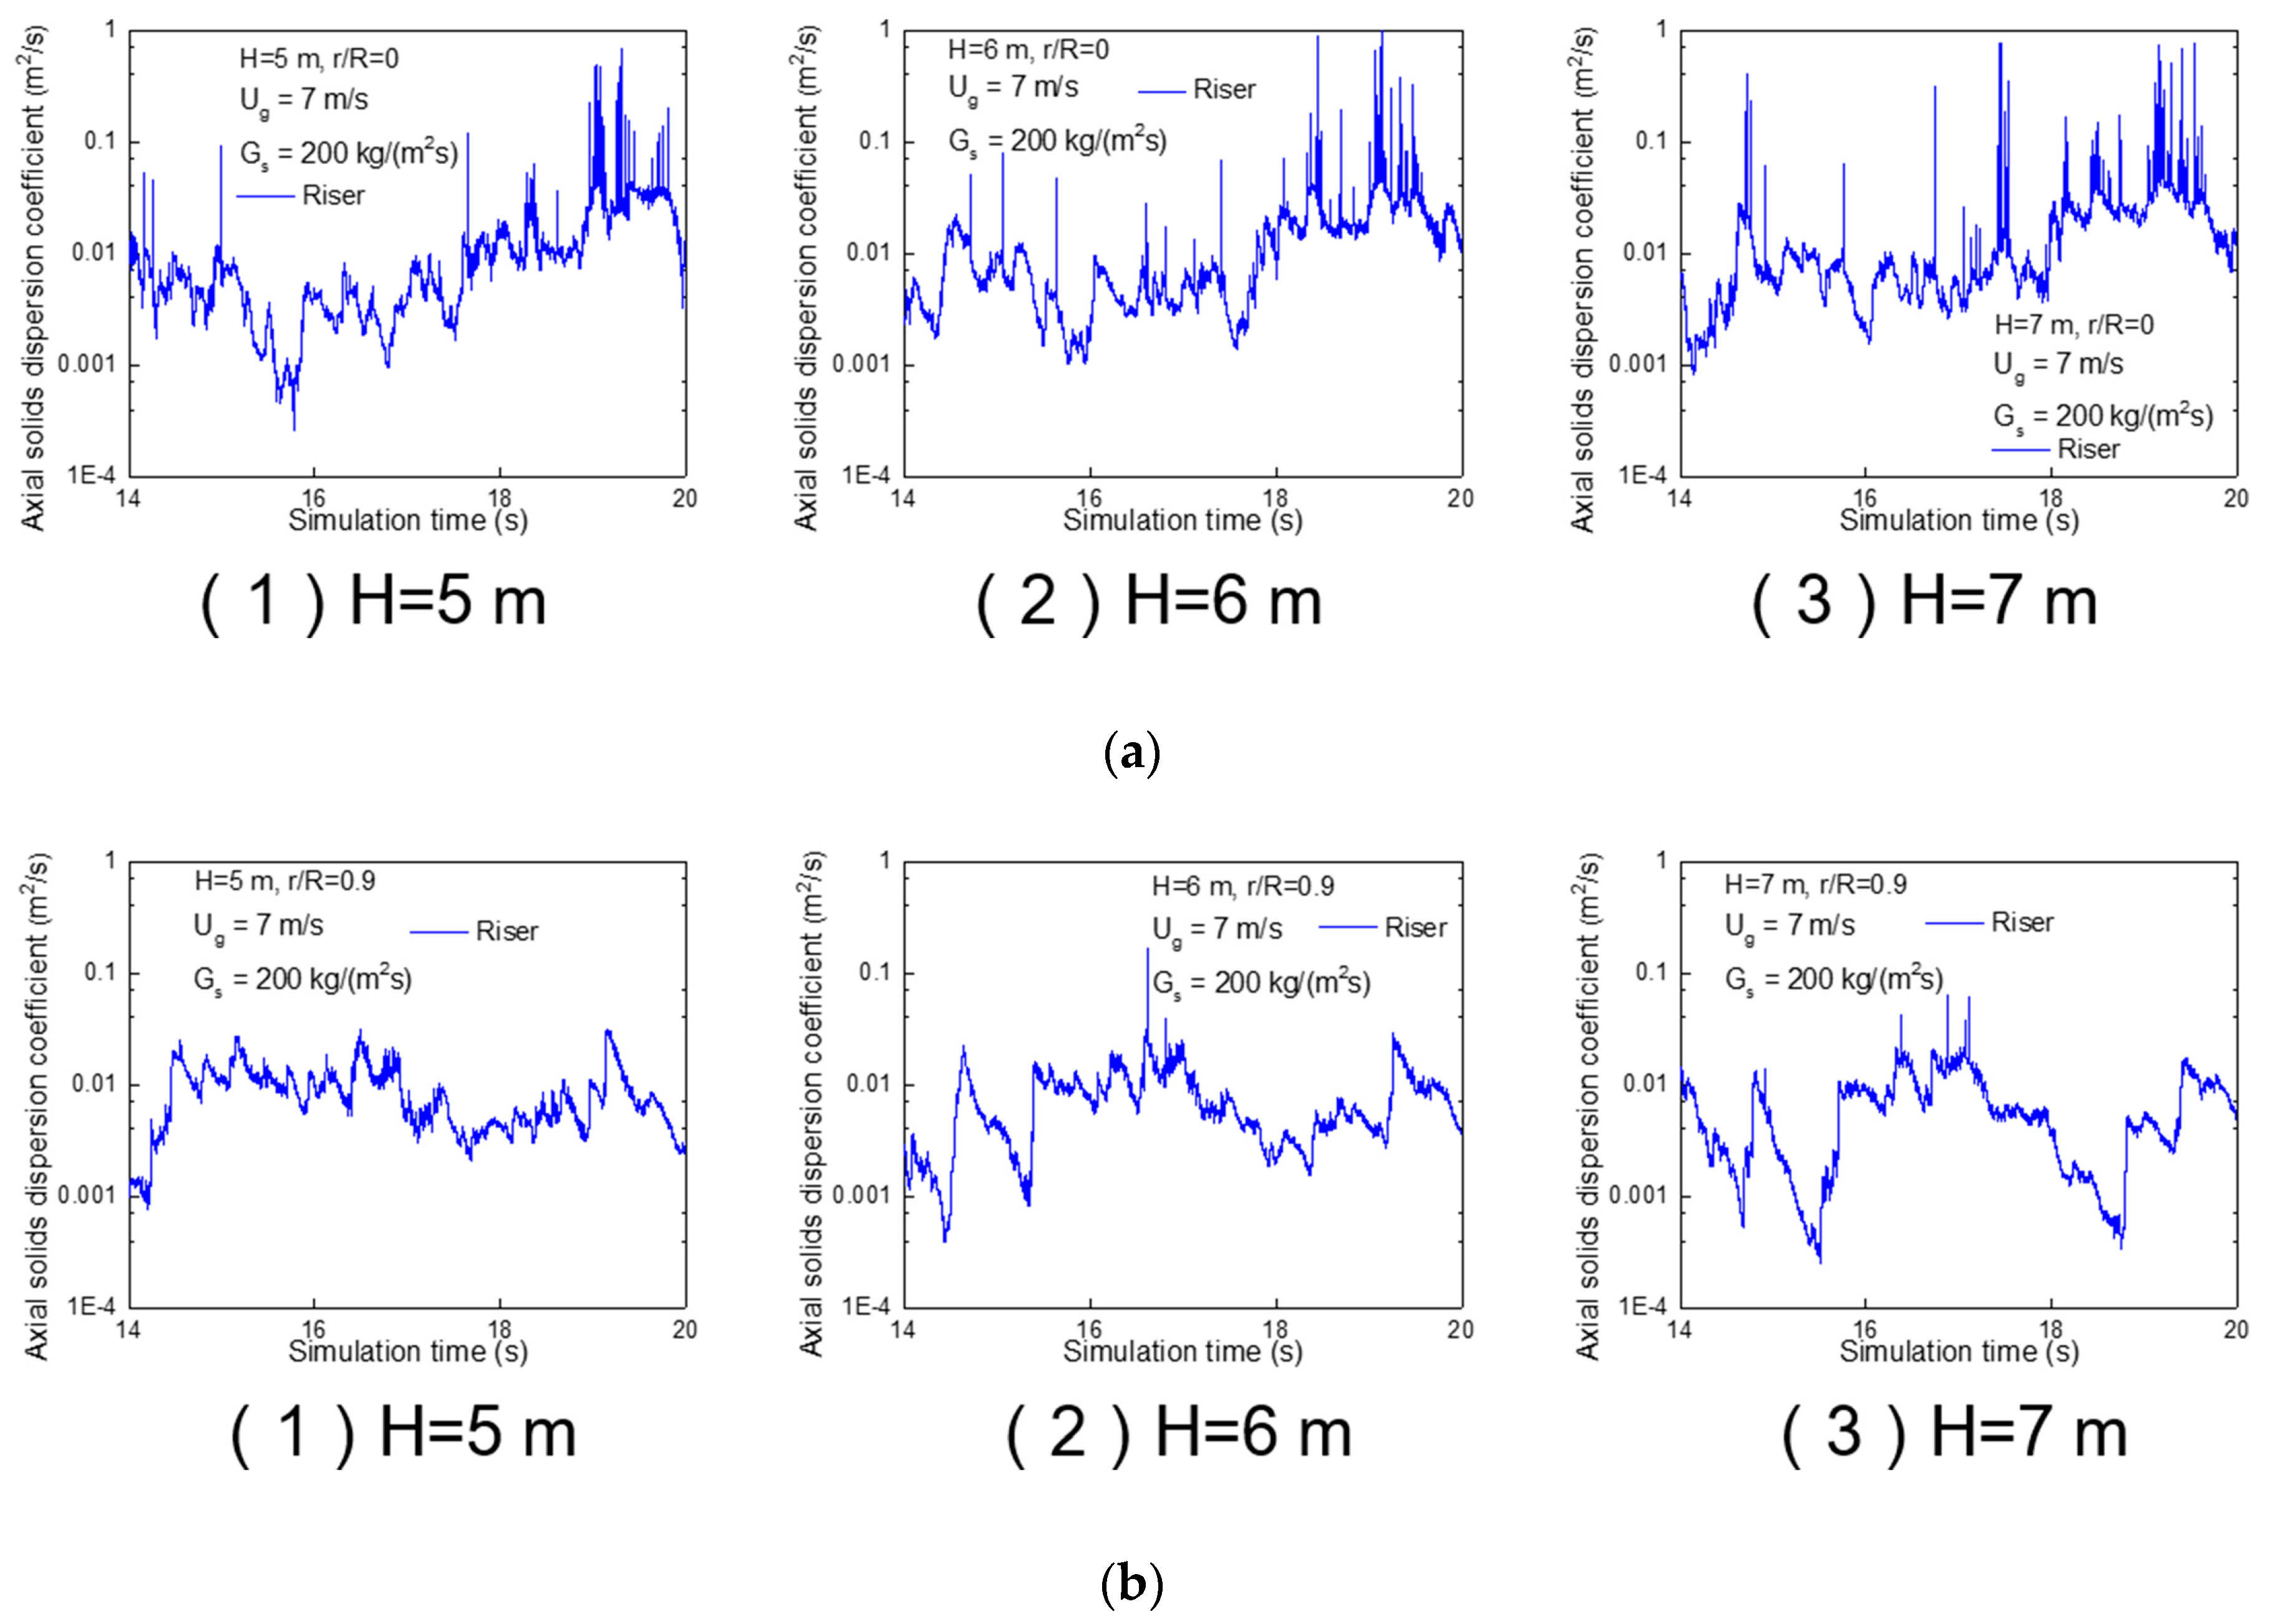
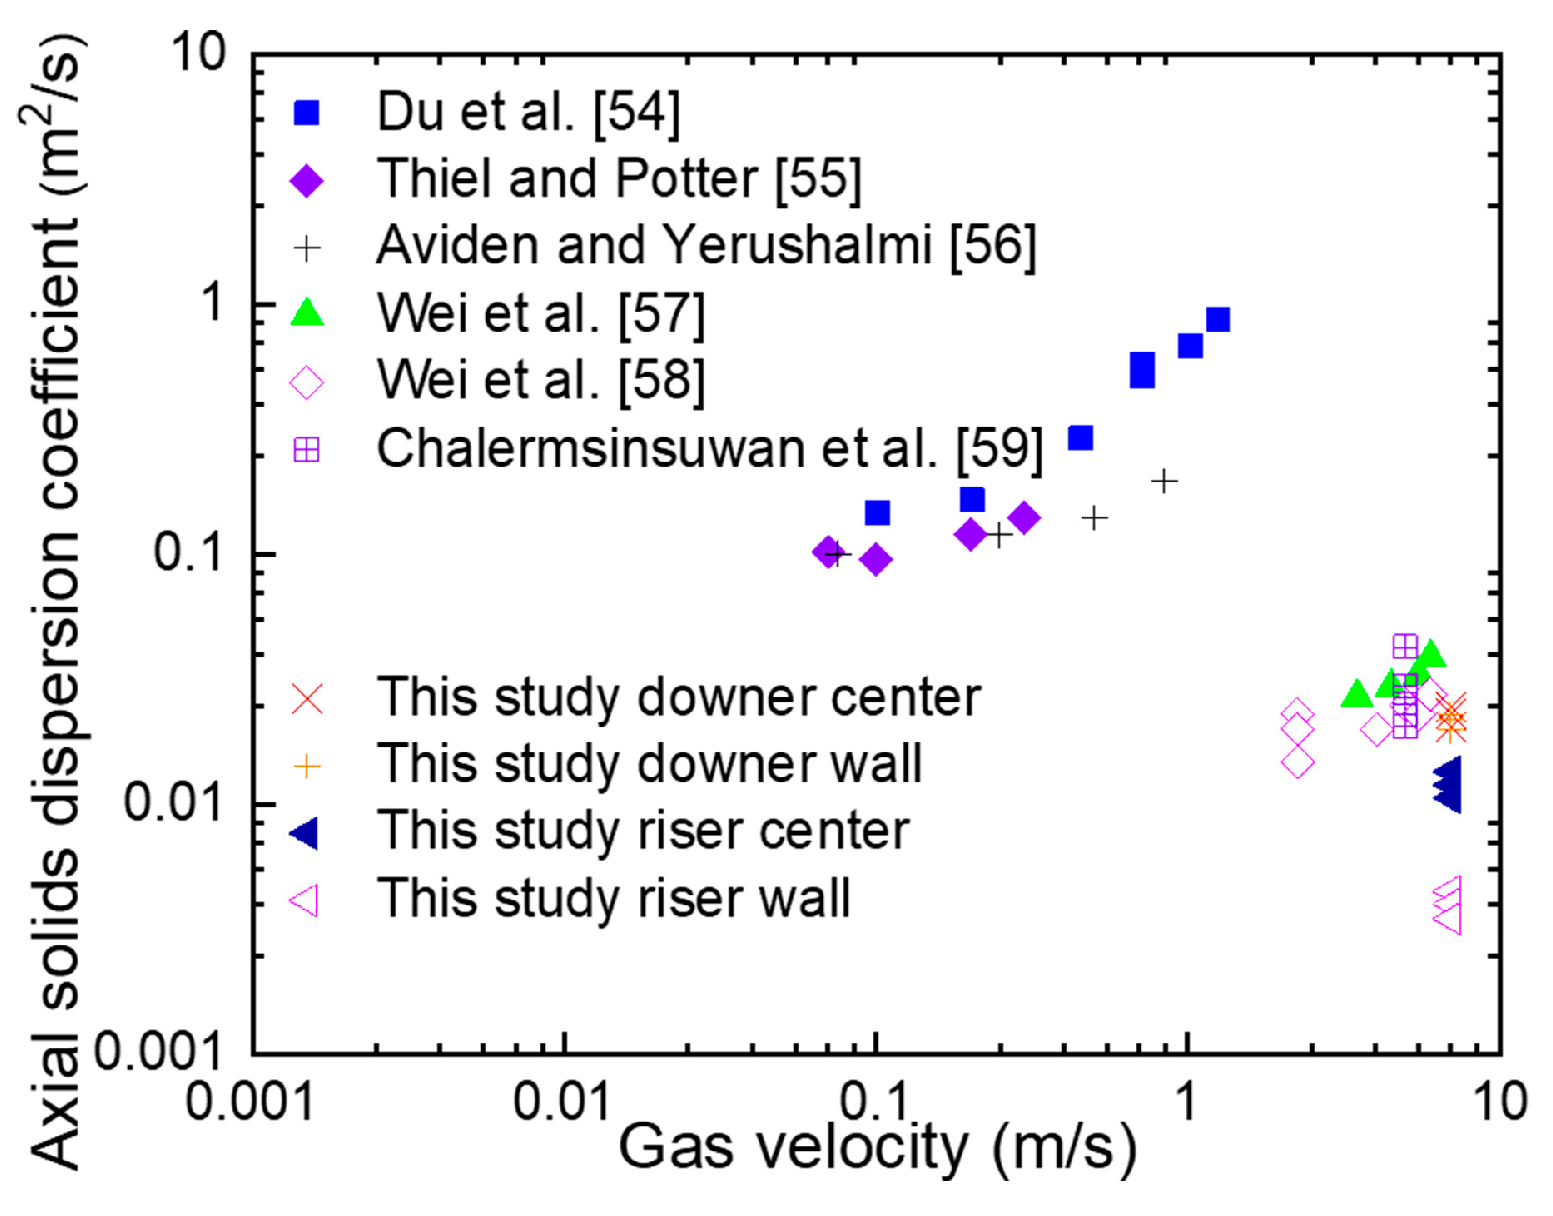
3.4. Solids Dispersion Coefficient
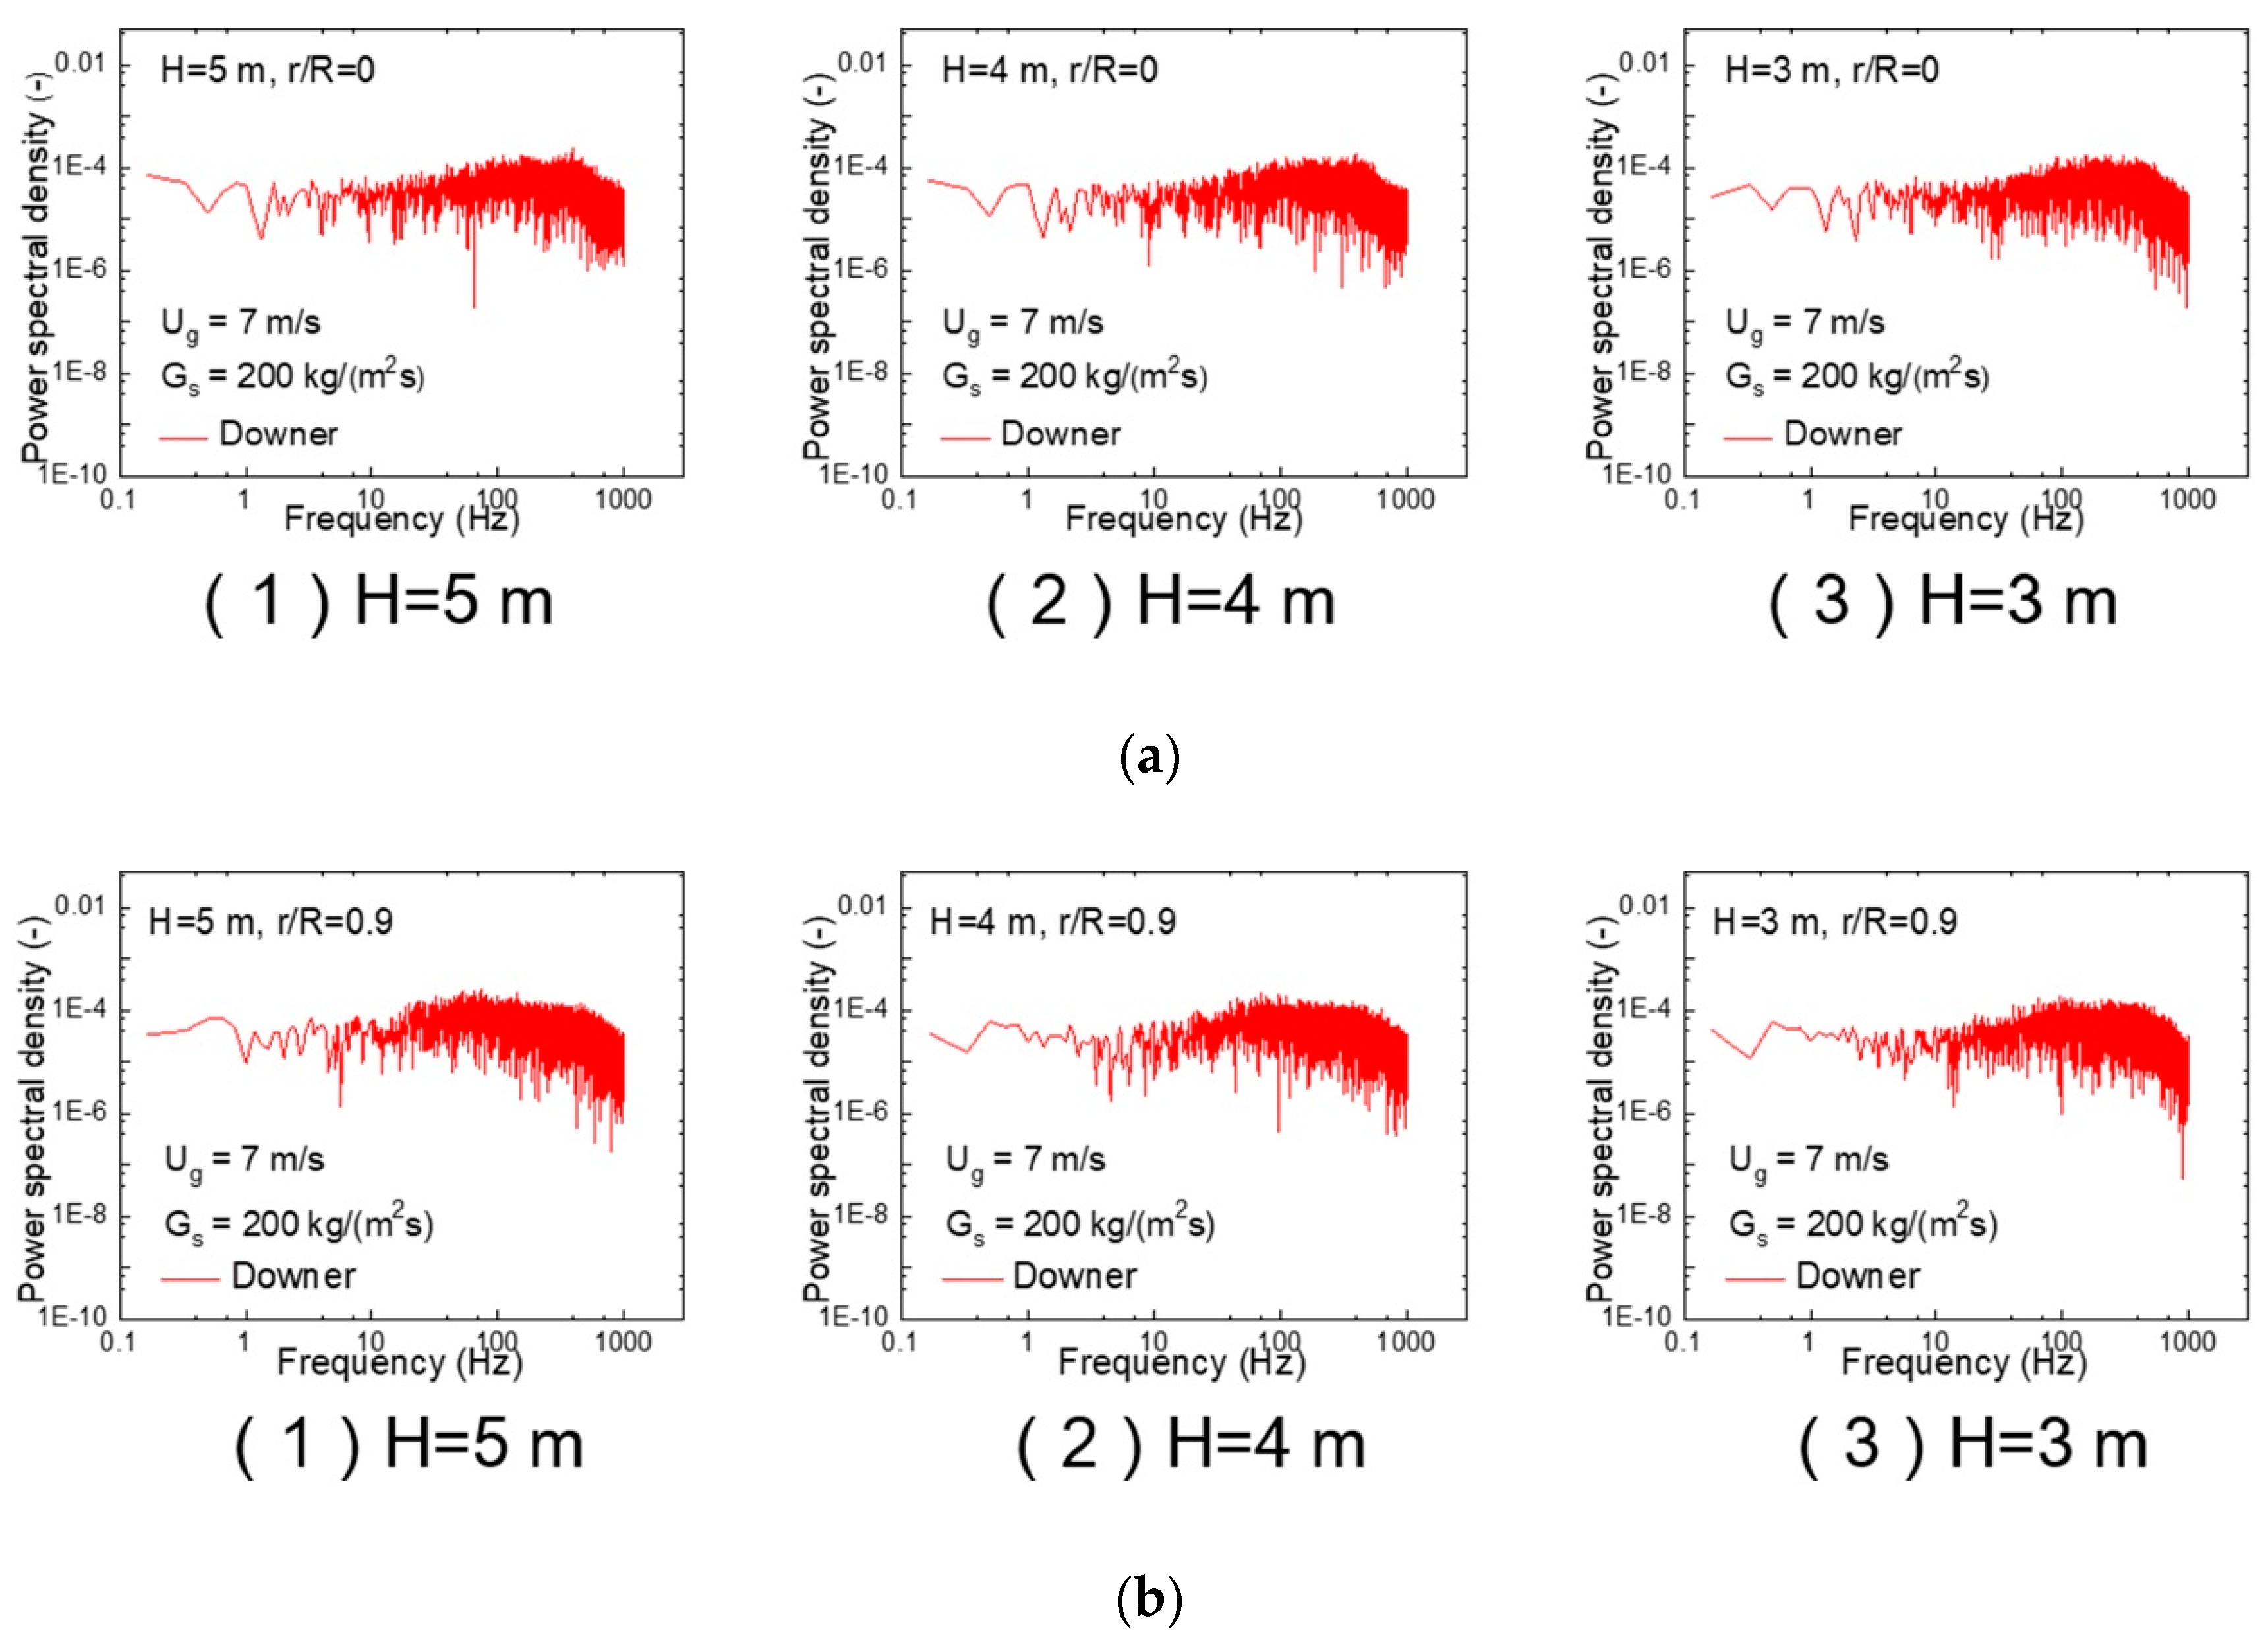
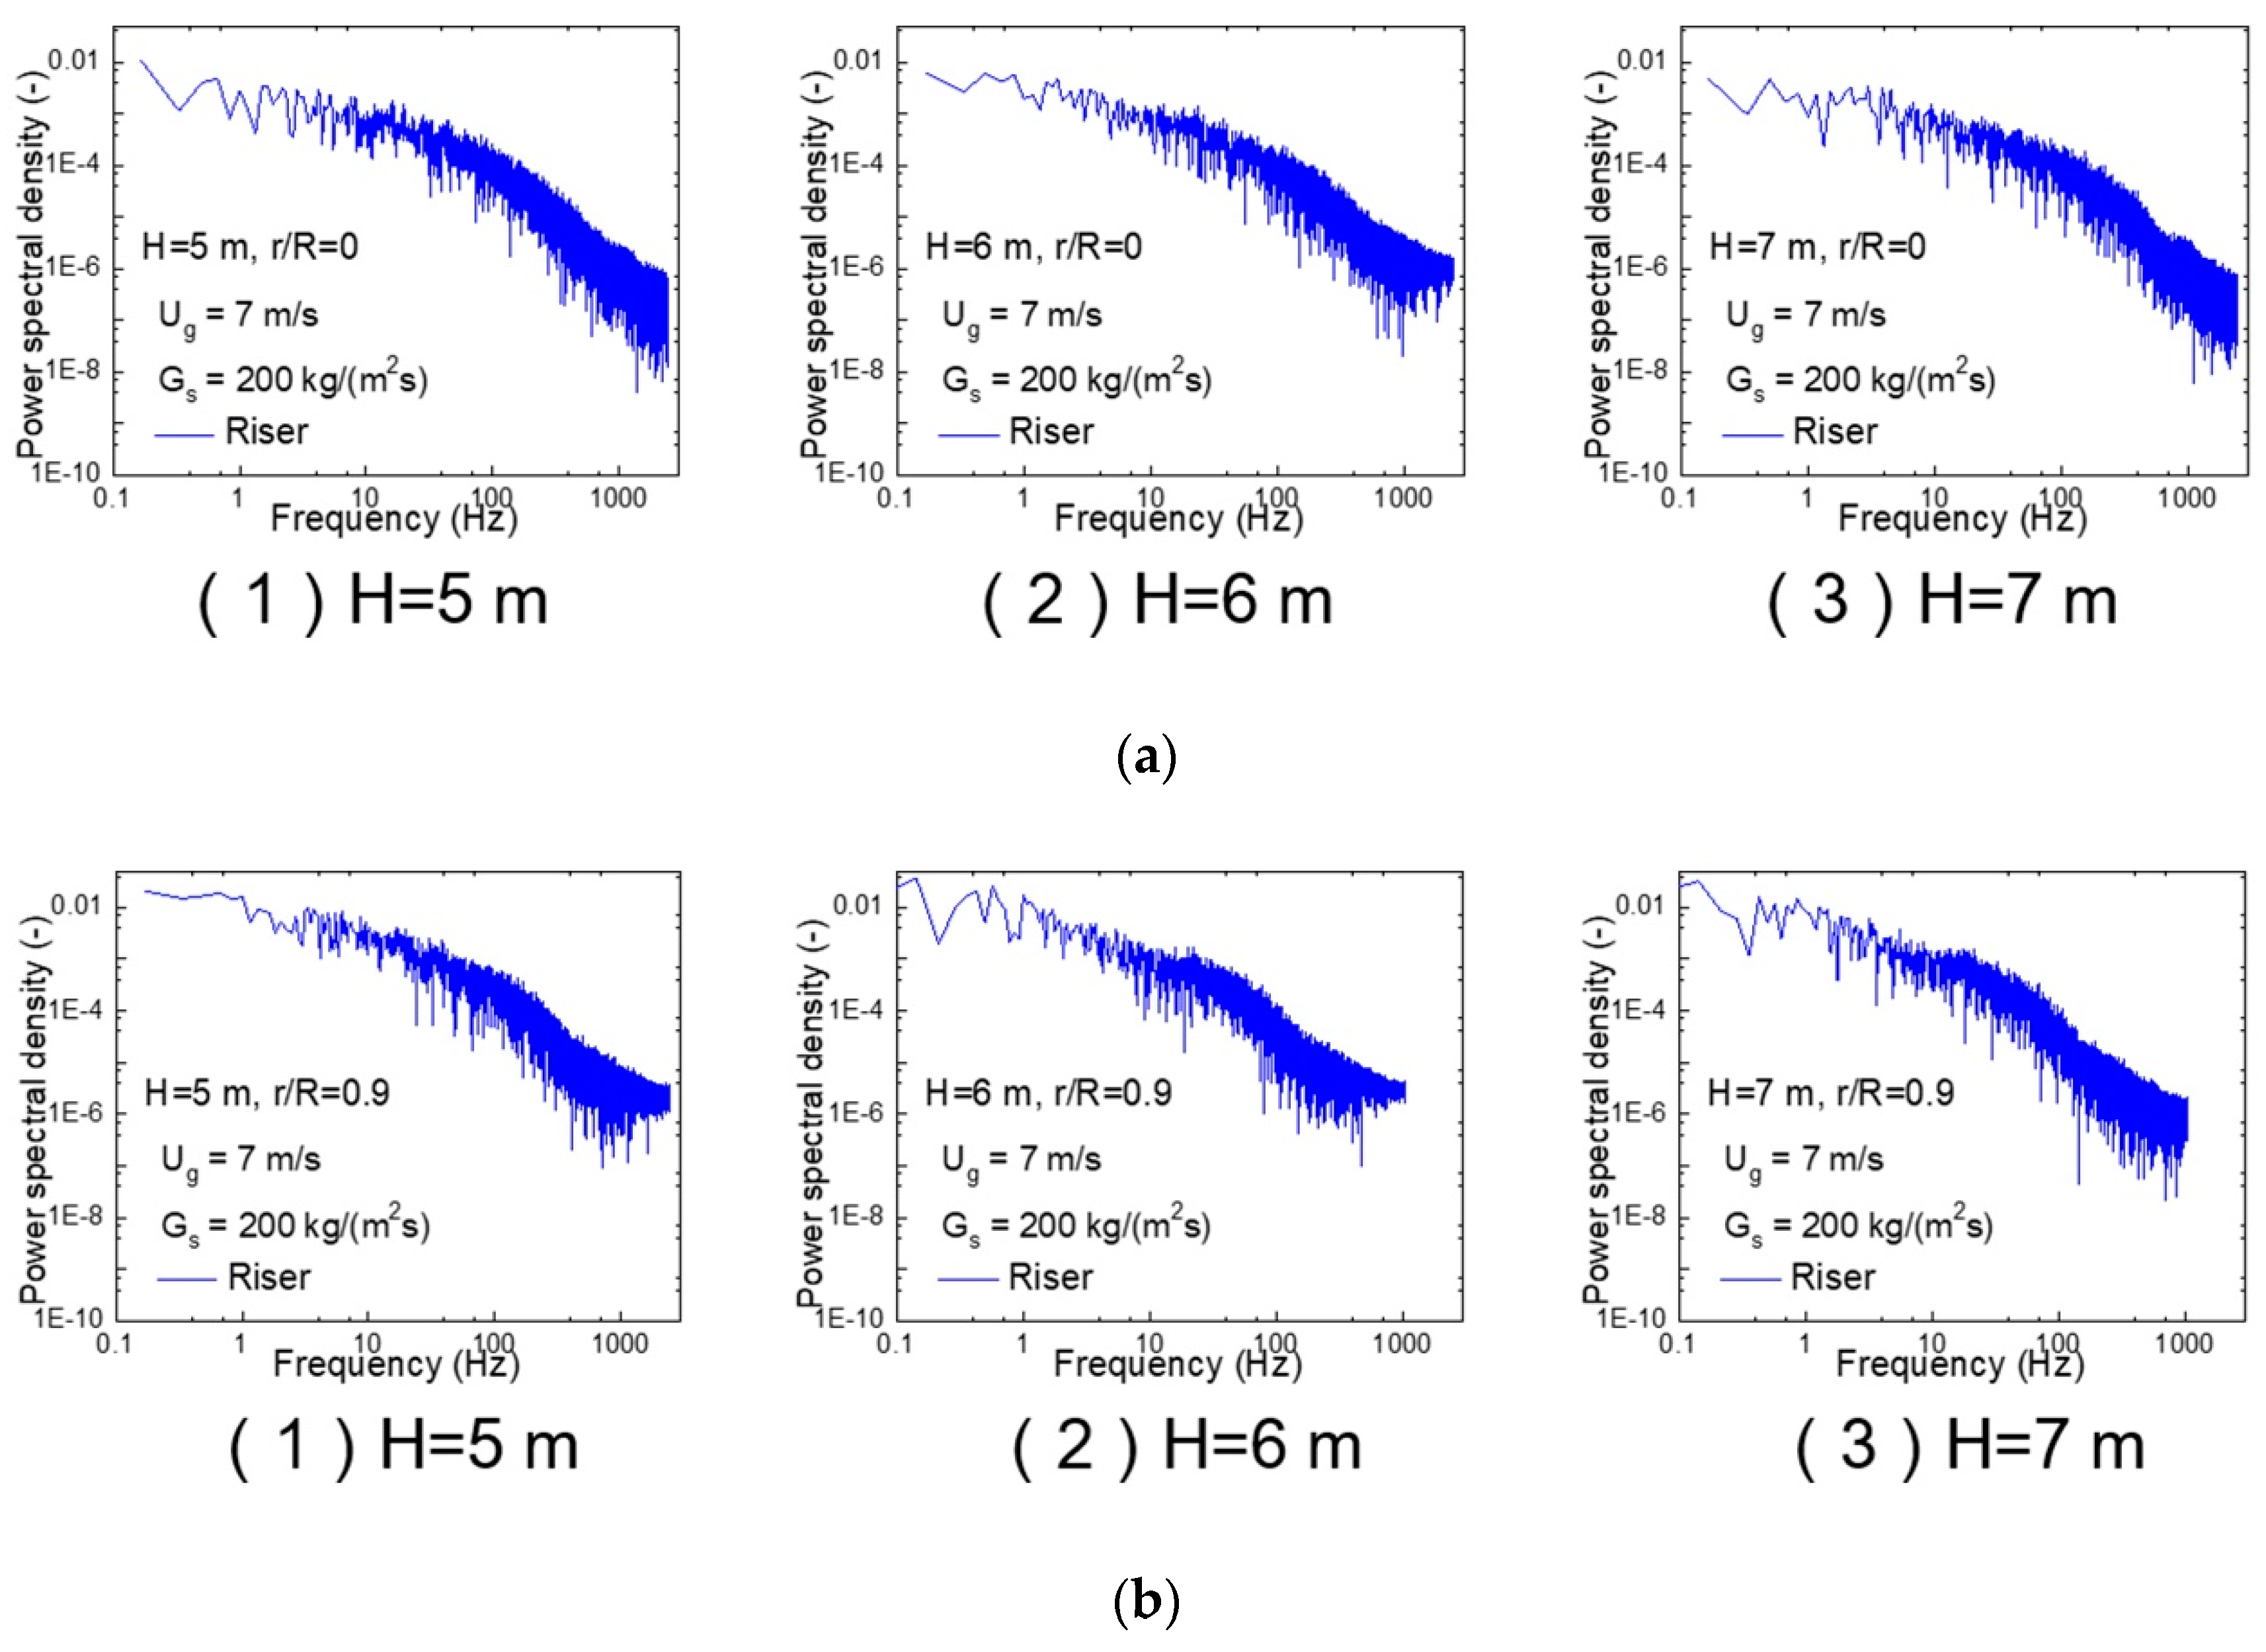
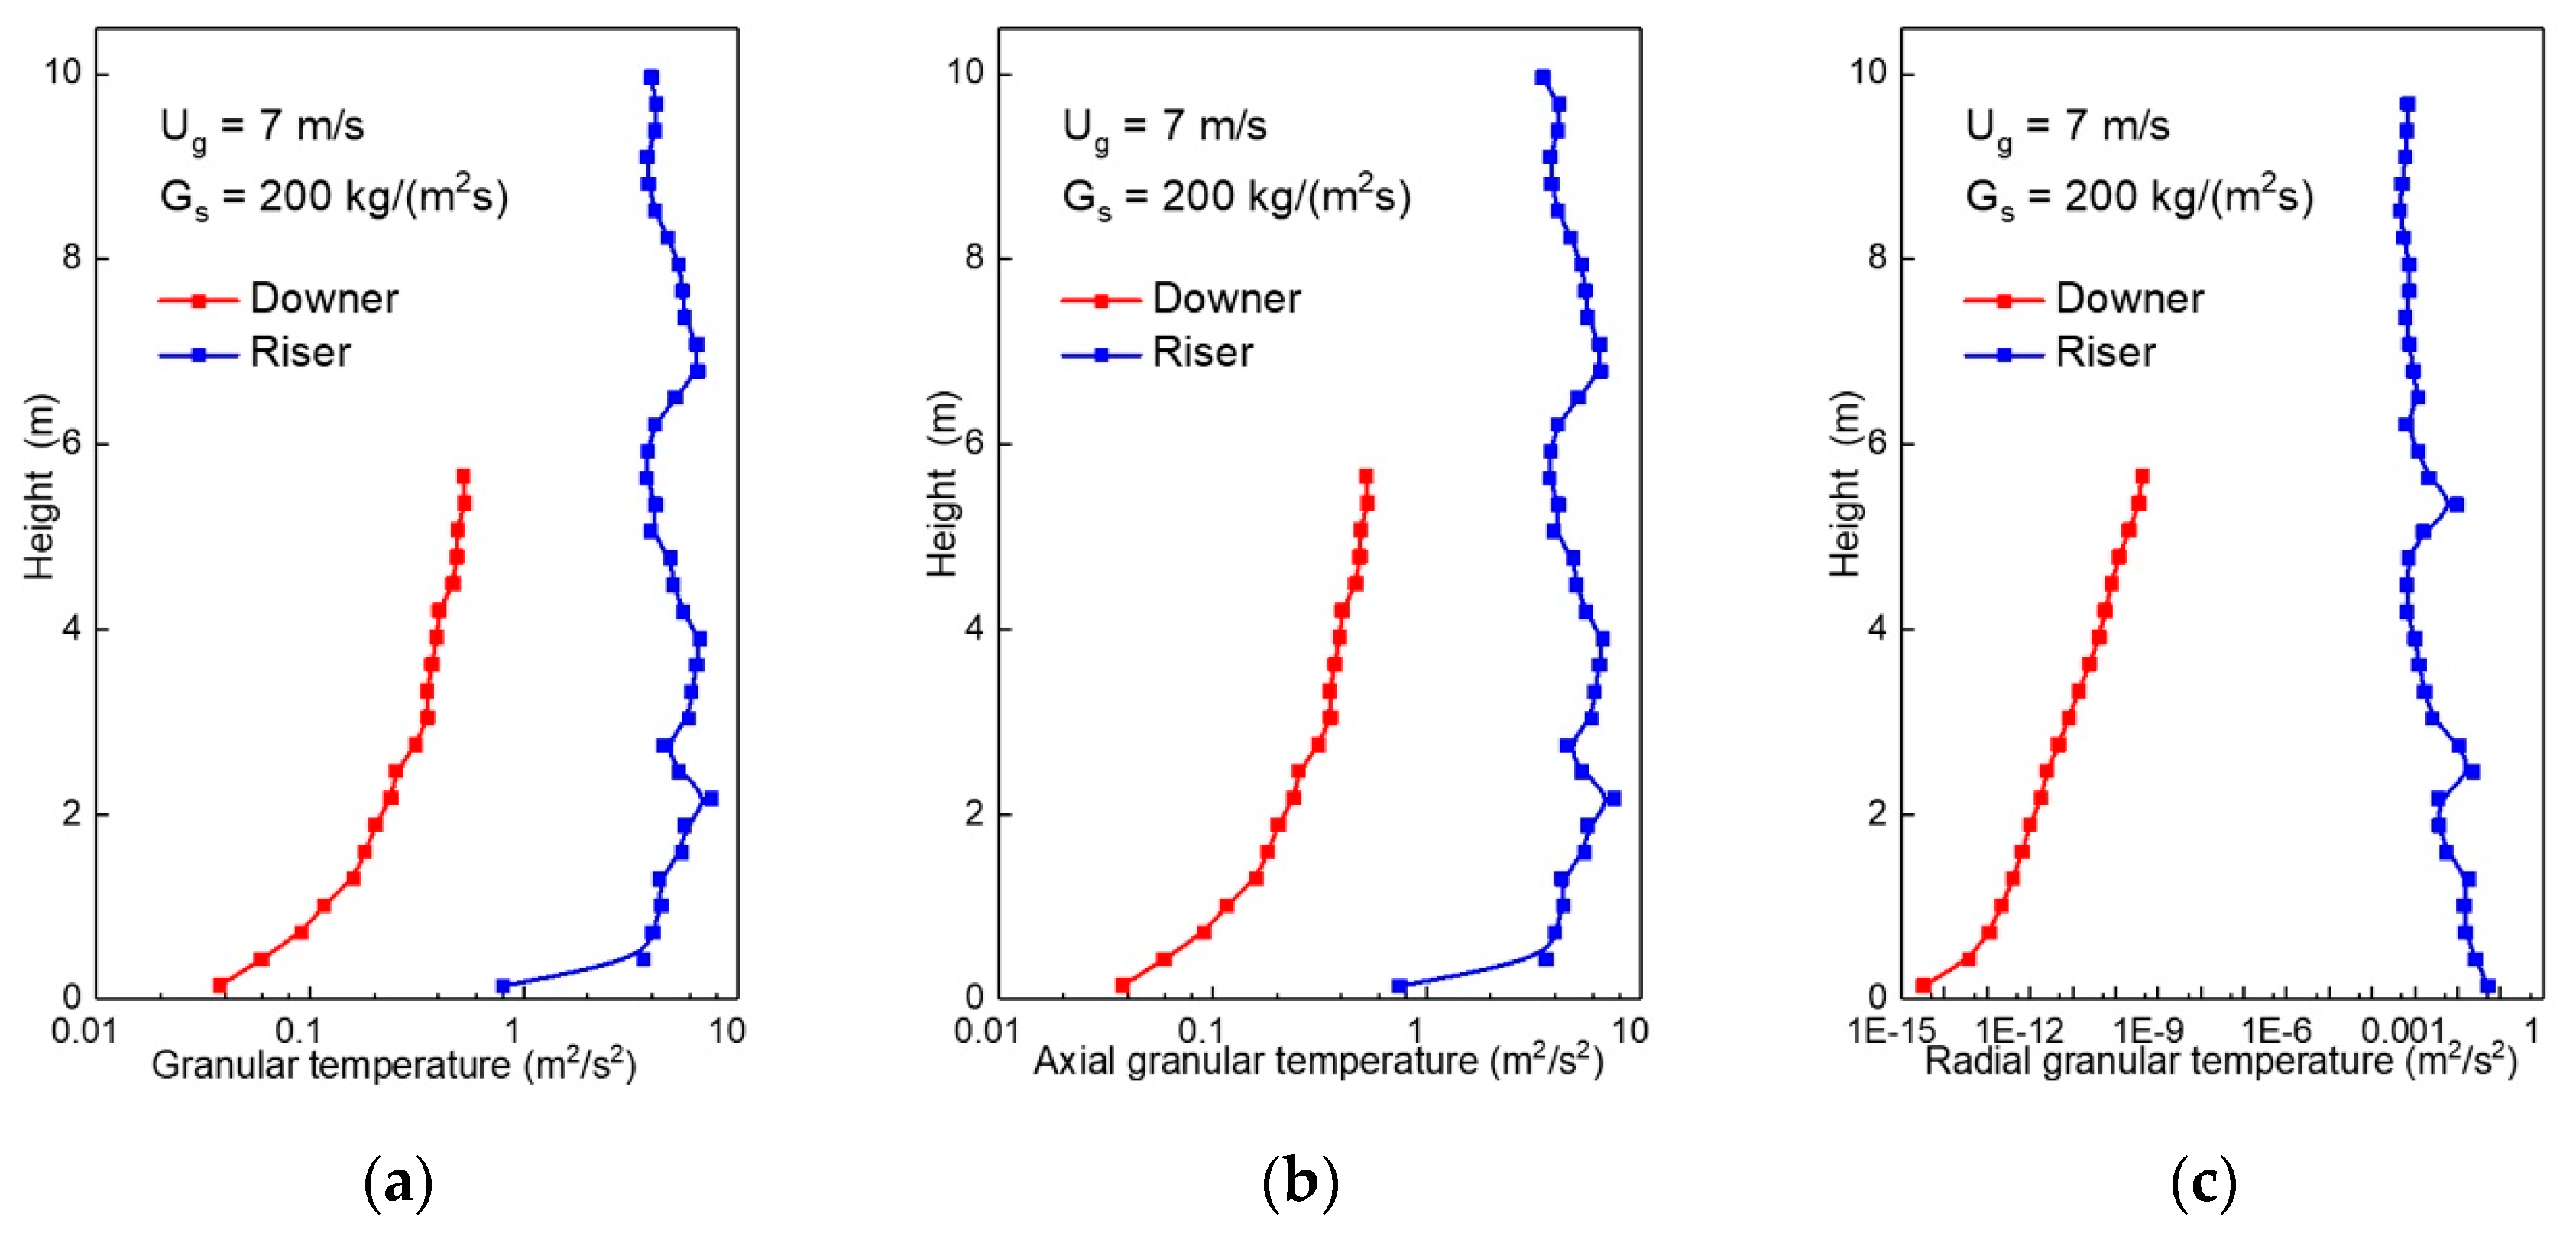
3.5. Solids Turbulence Characteristics
4. Conclusions
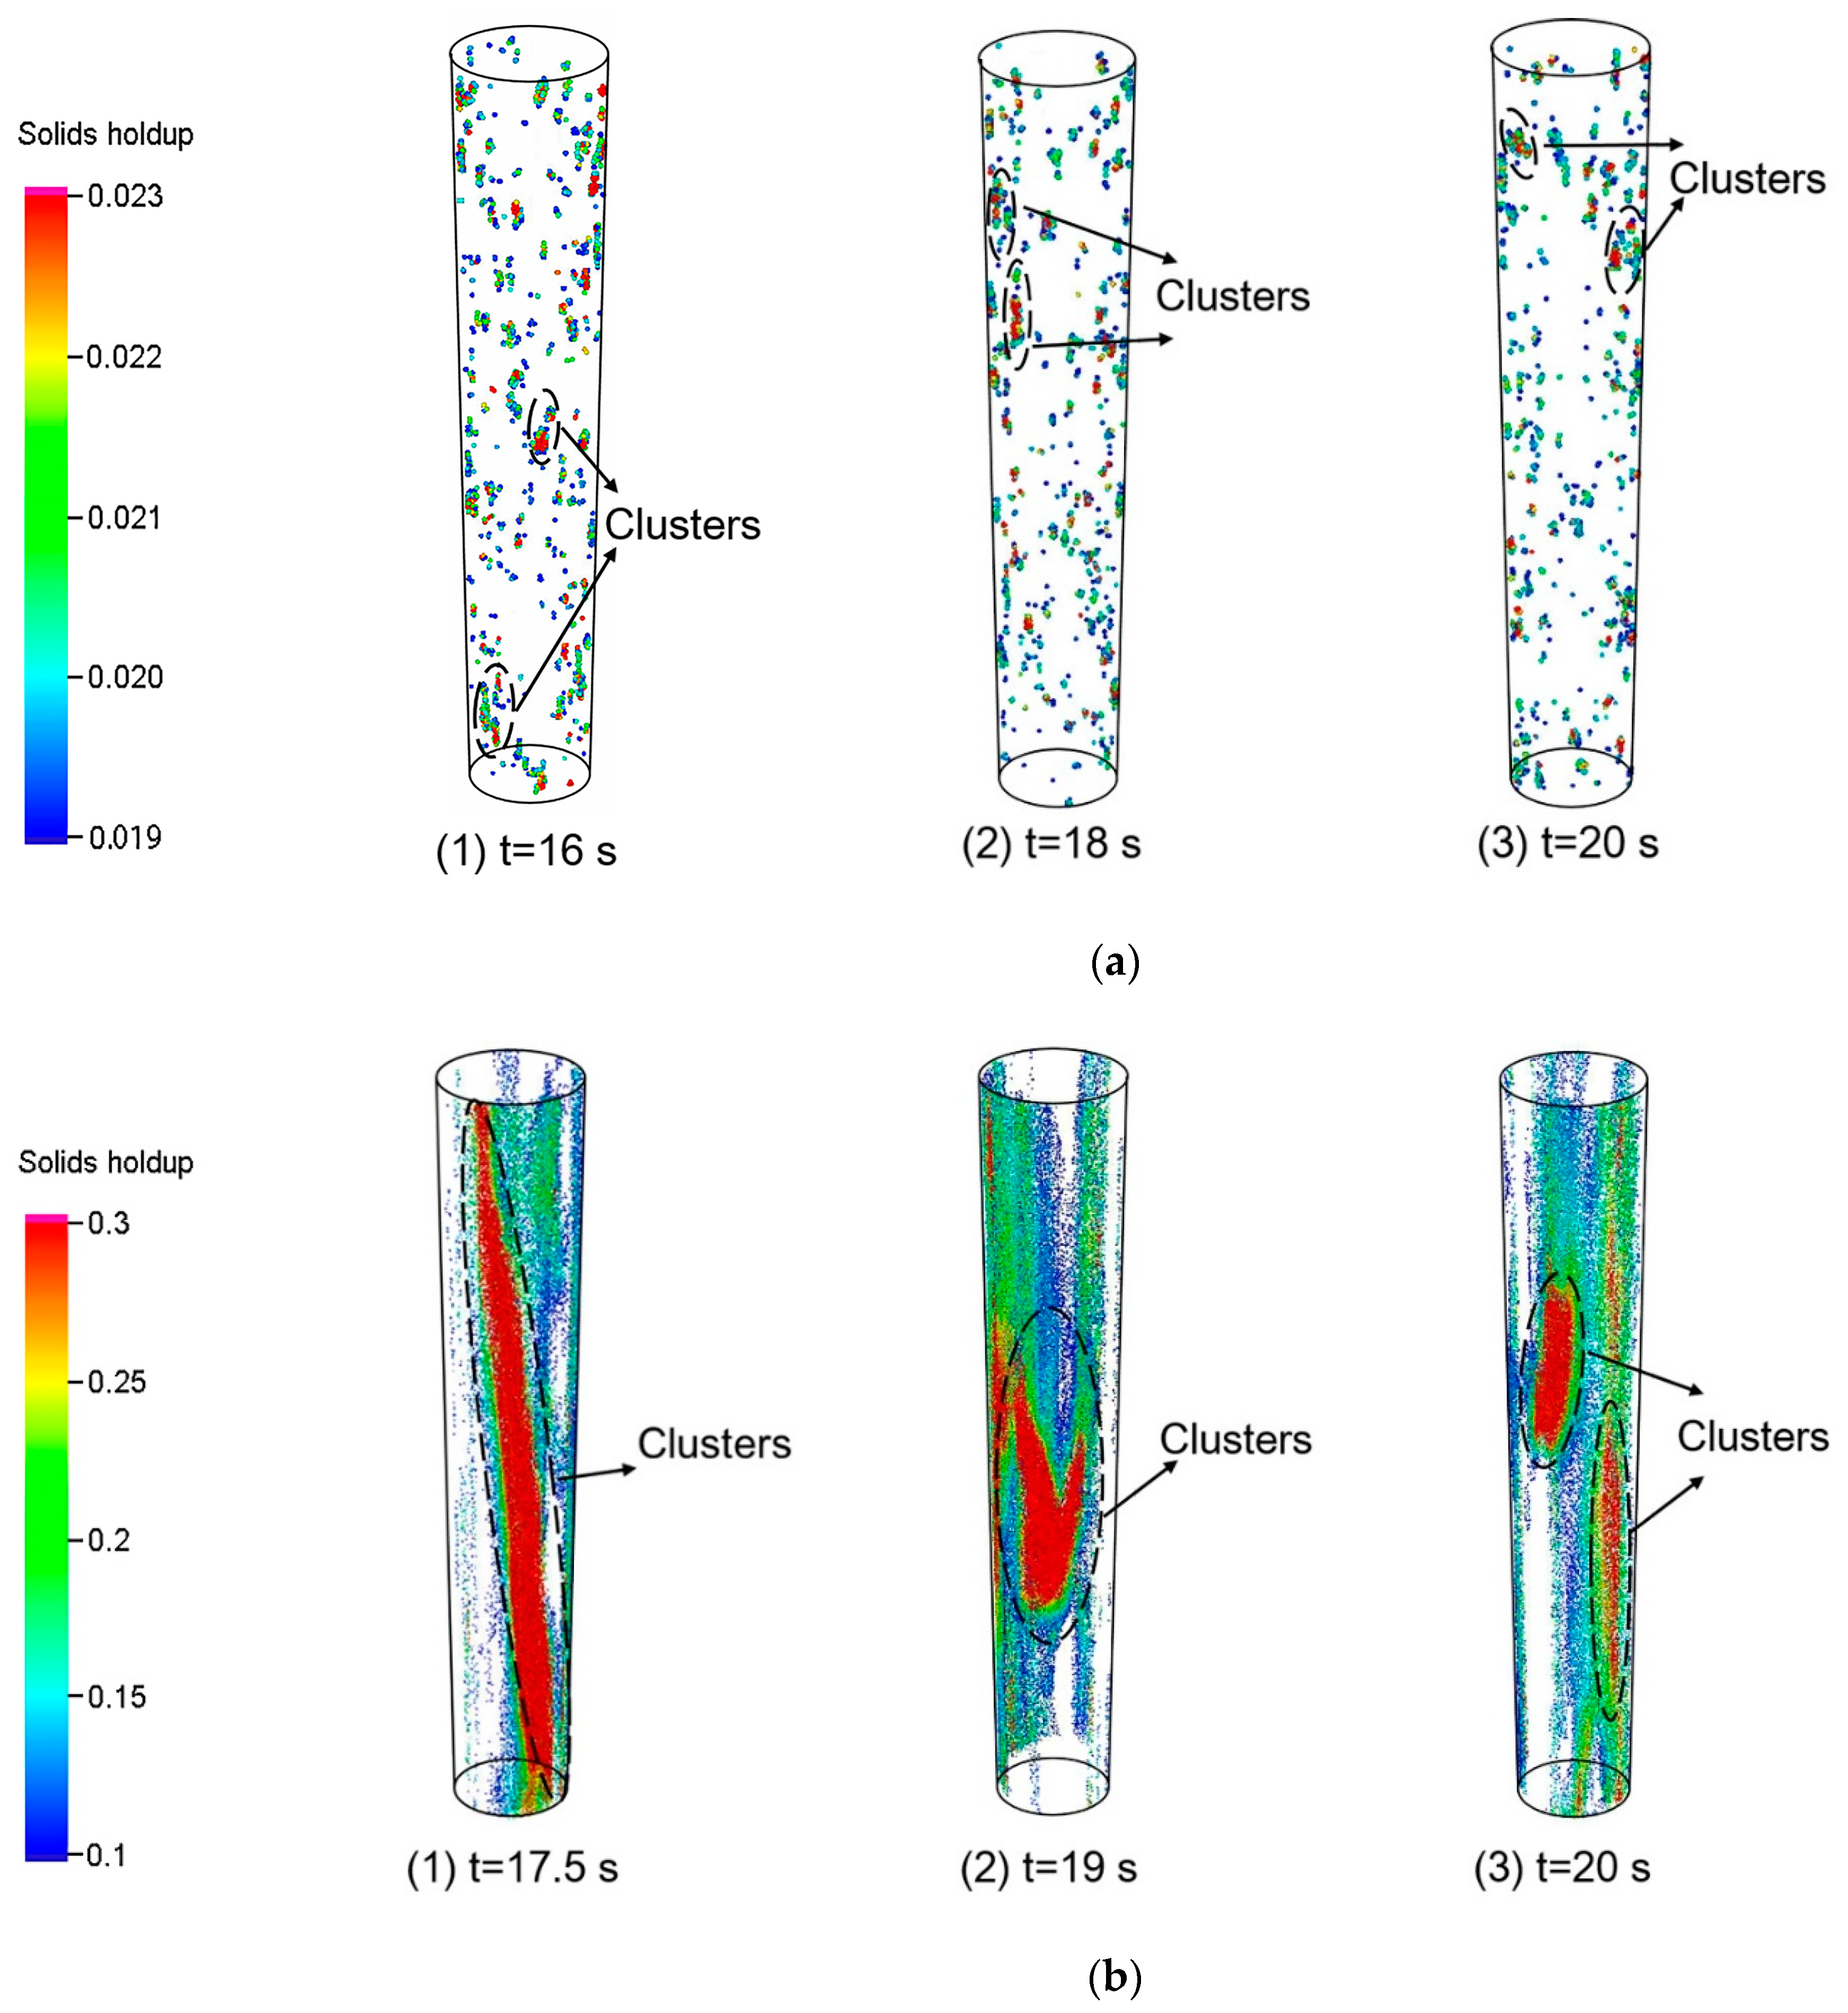
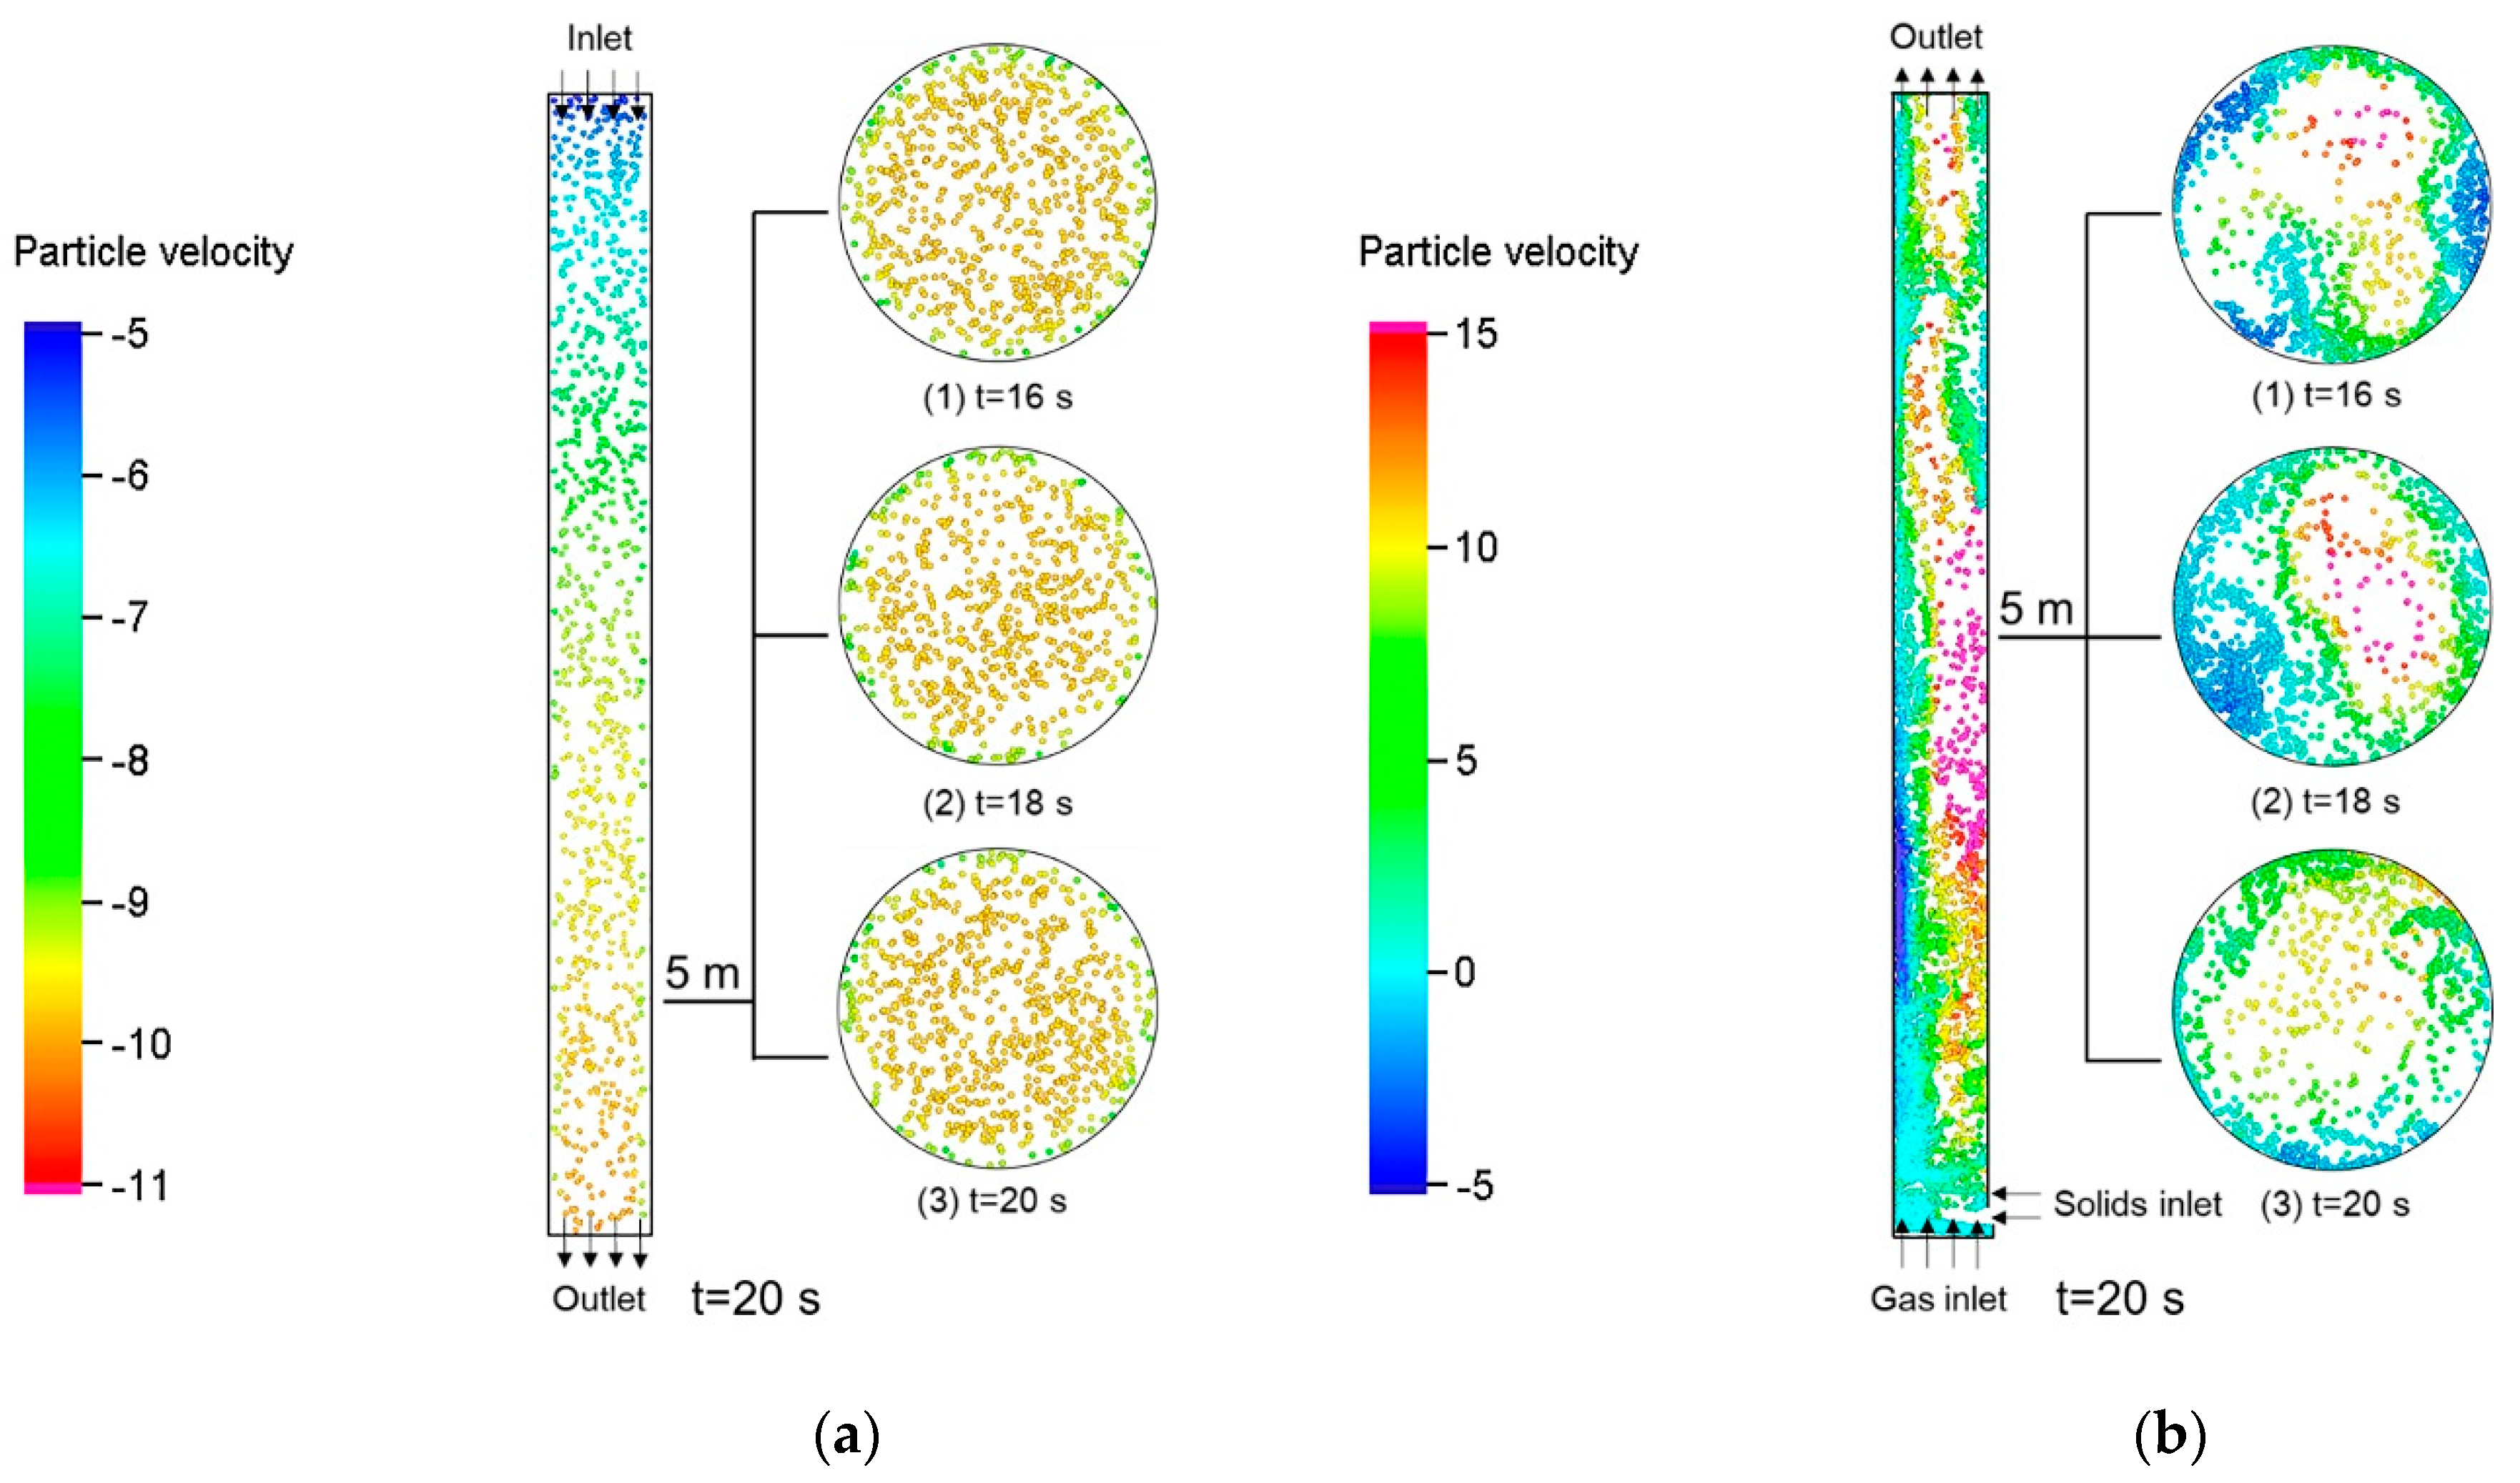
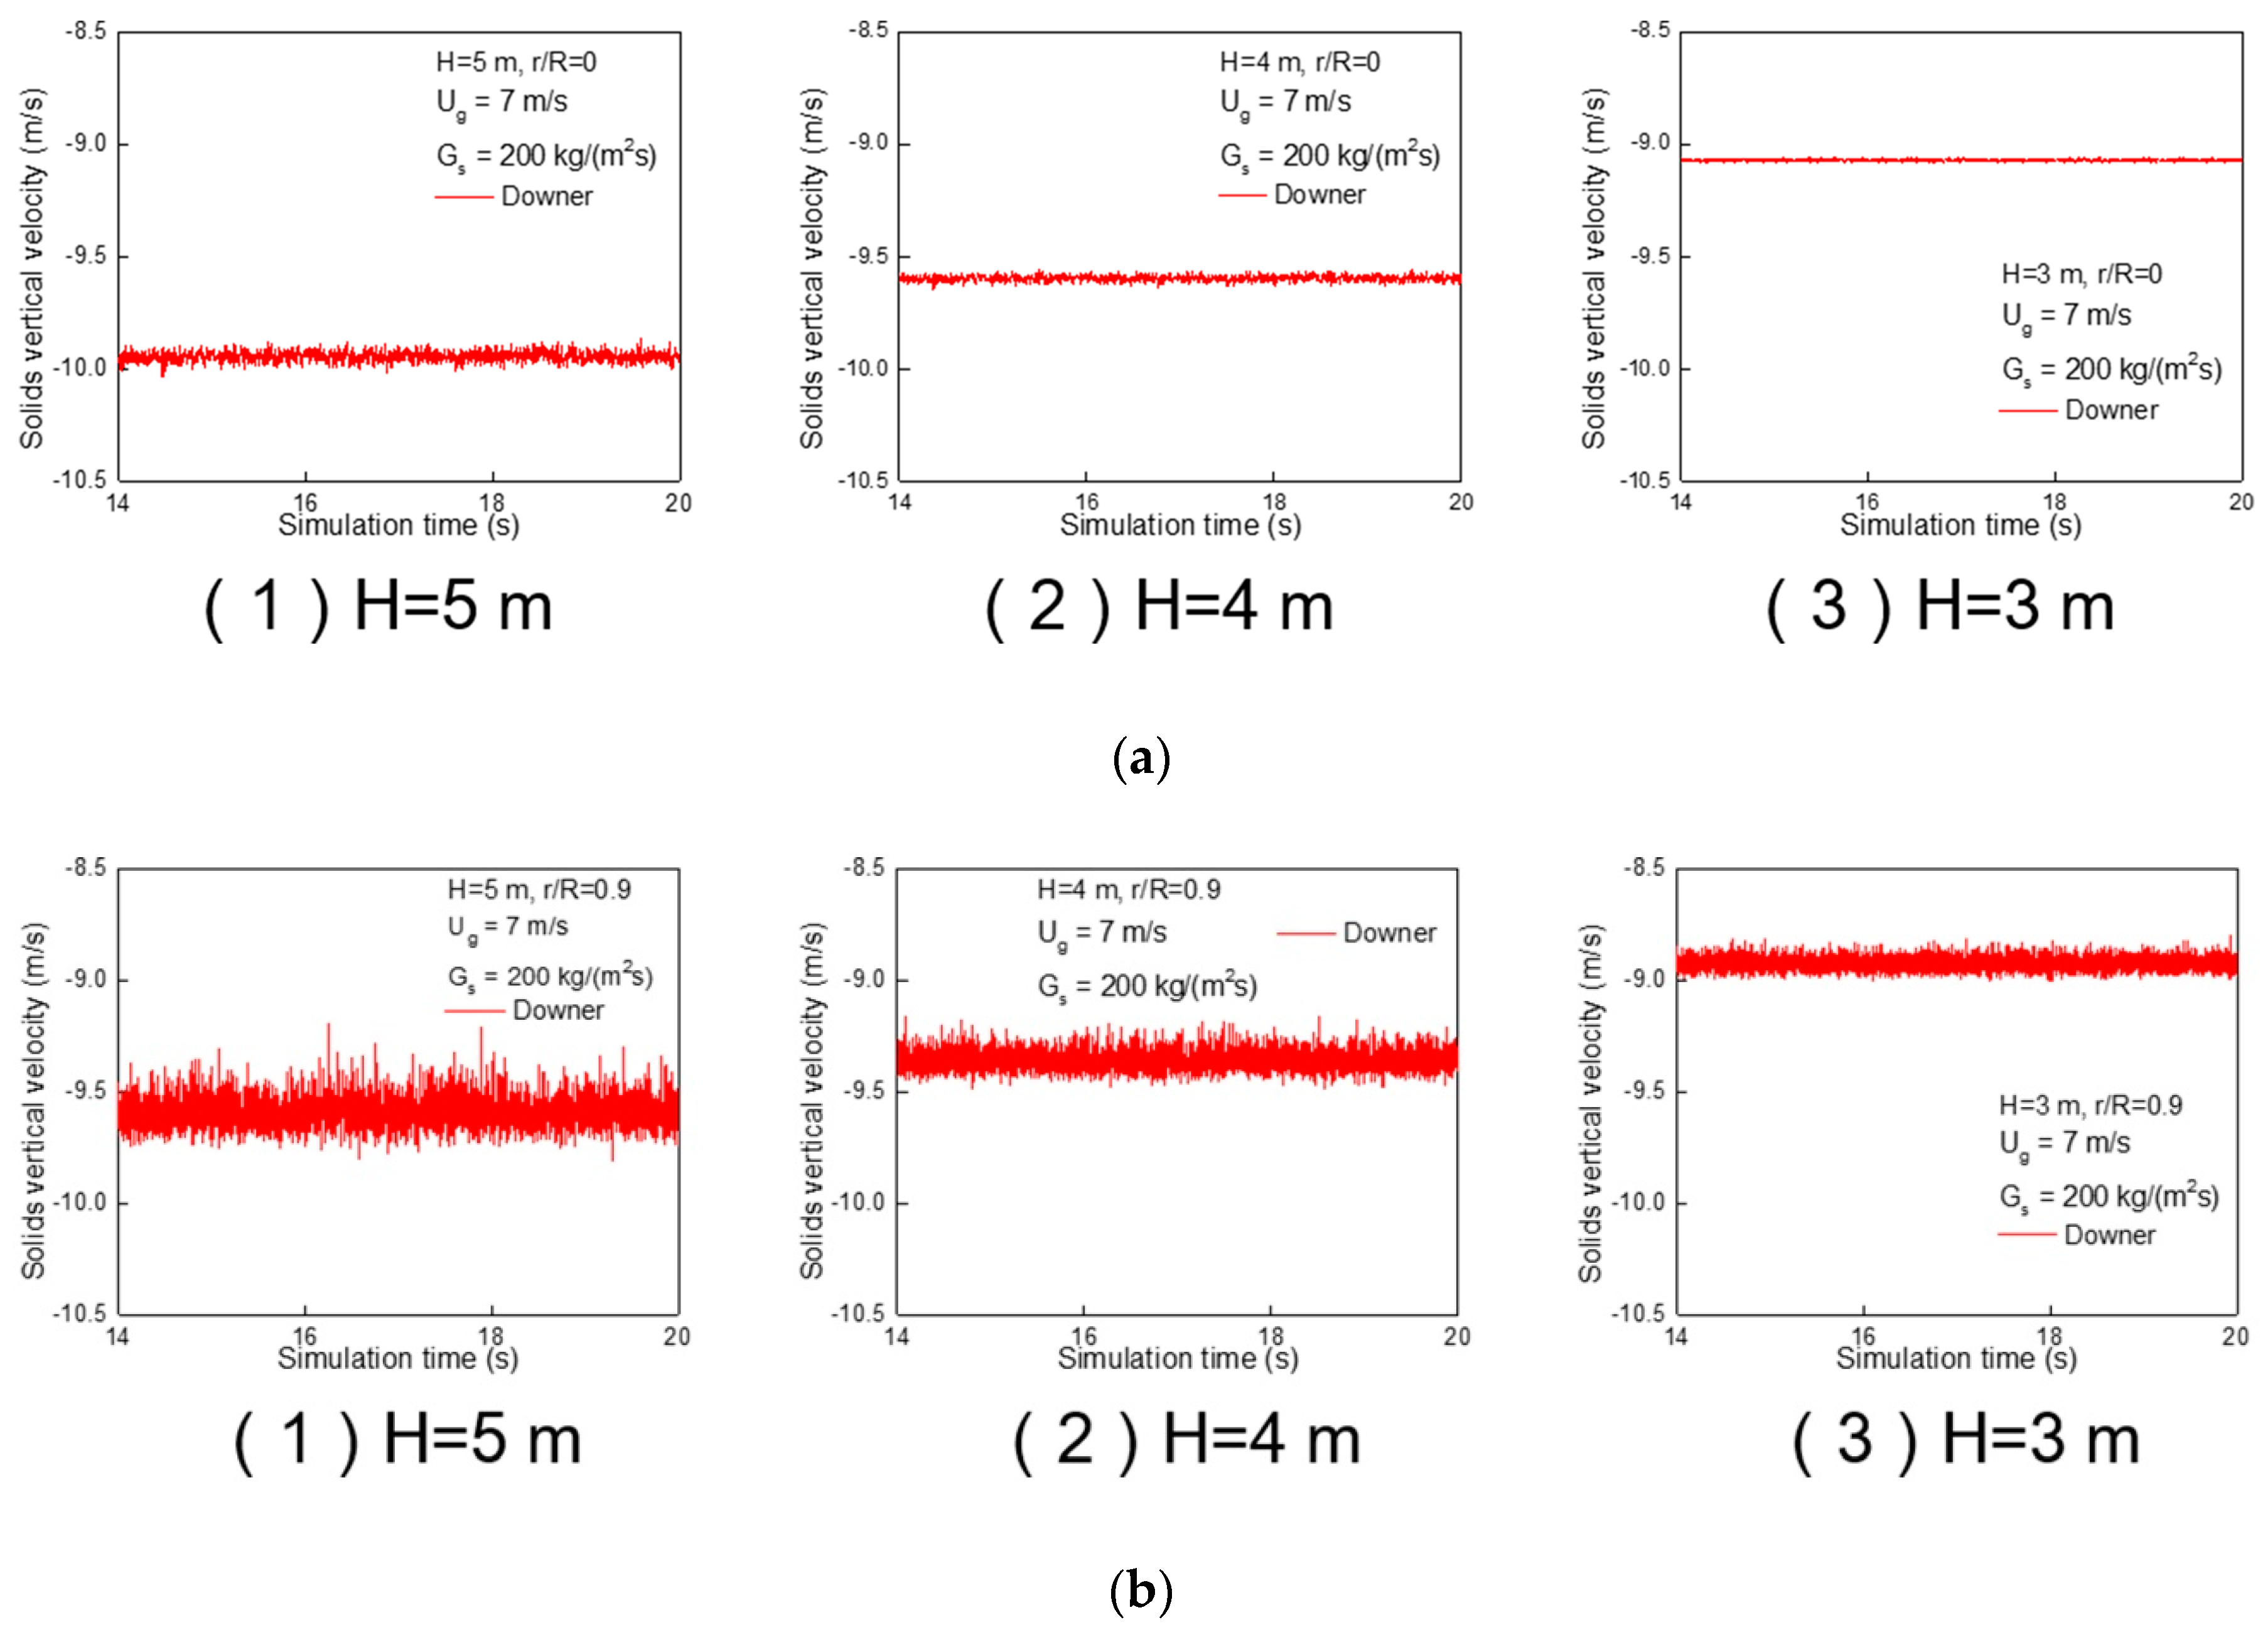
- (1)
- Compared to the riser, the radial distribution of solids holdup and solids vertical velocity were more uniform in the downer. The overall solids holdup in the riser was higher than that in the downer. Solids vertical velocity in both the downer and riser exhibited higher velocity in the center and lower velocity near the wall, which is mainly due to the wall friction and due to the frequent formation and dissolution of clusters.
- (2)
- The non-uniformity index for the radial distribution of solids holdup was 0.02 for the downer and ranged between 0.3 and 0.4 for the riser, further demonstrating that the gas-solids flow in downer was much more uniform than that in riser. The higher non-uniformity in the riser was mainly due to the large cluster with vertical strand or “V” shape.
- (3)
- Compared to riser, the cumulative distribution of solids RTD curve displayed a much steeper slope in the downer, which indicated that limited solids back-mixing existed in the downer and the solids flow structure approached to the ideal plug flow.
- (4)
- The axial solids dispersion coefficient in the downer was higher than that in the riser which indicated that solids transportation ability is much stronger in the downer under the same operating conditions. The decrease of axial dispersion coefficient near the wall in the riser was mainly due to the formation of large volume clusters.
- (5)
- The granular temperature in downer was much smaller compared with the riser, which implied that solids turbulence in the downer was much weaker.
Author Contributions
Funding
Conflicts of Interest
Nomenclature
| A | Particle acceleration, m·s−2 |
| Cd0 | Homogeneous drag coefficient |
| Cdcl | Drag coefficient of cluster |
| D | Solids dispersion coefficient, m2/s |
| Dp | Interphase momentum transfer coefficient, m/s2 |
| dp | Individual particle diameter, m |
| dcl | Equivalent diameter of cluster, m |
| f | Particle probability distribution function |
| FD | Interphase drag force, N |
| g | Gravitational acceleration, m·s−2 |
| Gs | Solids mass flux, kg·m−2·s−1 |
| H | Height of CFB downer and riser, m |
| HD | Heterogeneity index |
| mp | Mass of particle, kg |
| n | Number of particles in the sampled local area |
| Pressure gradient of the gas phase, Pa/m | |
| pg | Gas pressure, Pa |
| P | Operating pressure of CFB downer and riser, Pa |
| P0 | Time-averaged pressure at different heights |
| r | Displacement of particle |
| Recl | Cluster Reynold number |
| Rep | Particle Reynold number |
| t | Time, simulation time, s |
| Tp | Temperature of particle phase, K |
| ug | Gas phase velocity, m/s |
| up | Particle phase velocity, m/s |
| up’ | Fluctuating velocity of particles, m/s |
| Ug | Superficial gas velocity for downer and riser operation, m/s |
| xp | Spatial position of the particles |
| Greek Letters | |
| ρg | Gas density, kg·m−3 |
| ρp | Particle density, kg·m−3 |
| τg | Gas phase stress tensor |
| τp | Normal stress of particle phase, N·m−2 |
| εcp | Particle phase volume fraction at close packing |
| εg | Gas phase volume fraction |
| εp | Particle phase volume fraction |
| εcp | Particle-phase volume fraction at close packing |
| β | Interphase drag coefficient, kg/m3 s |
| Θ | Granular temperature, m2/s2 |
| θ | Dimensionless solids residence time |
| μg | Gas viscosity, kg·m−1·s−1 |
References
- Kunii, D.; Levenspiel, O. Fluidization Engineering, 2nd ed.; Butterworth Heinemann: Oxford, UK, 1991. [Google Scholar]
- Nowak, W.; Mirek, P. 16-Circulating fluidized bed combustion (CFBC). In Fluidized Bed Technologies for Near-Zero Emission Combustion and Gasification; Scala, F., Ed.; Woodhead Publishing Series in Energy; Woodhead Publishing Limited: Sawston, UK, 2013; pp. 701–764. [Google Scholar] [CrossRef]
- Zhang, H.; Huang, W.; Zhu, J. Gas-solids flow behavior: CFB Riser vs. Downer. AIChE J. 2001, 47, 2000–2011. [Google Scholar] [CrossRef]
- Wu, B.; Zhu, J.; Briens, L. A Comparison of Flow Dynamics and Flow Structure in a Riser and a Downer. Chem. Eng. Technol. 2007, 30, 448–459. [Google Scholar] [CrossRef]
- Li, D.; Ray, M.B.; Ray, A.K.; Zhu, J. A comparative study on hydrodynamics of circulating fluidized bed riser and downer. Powder Technol. 2013, 247, 235–259. [Google Scholar] [CrossRef]
- Cheng, Y.; Wu, C.; Zhu, J.; Wei, F.; Jin, Y. Downer reactor: From fundamental study to industrial application. Powder Technol. 2008, 183, 364–384. [Google Scholar] [CrossRef]
- Shu, Z.; Peng, G.; Wang, J.; Zhang, N.; Li, S.; Lin, W. Comparative CFD Analysis of Heterogeneous Gas–Solid Flow in a Countercurrent Downer Reactor. Ind. Eng. Chem. Res. 2014, 53, 3378–3384. [Google Scholar] [CrossRef]
- Shaikh, A.A.; Al-Mutairi, E.M.; Ino, T. Modeling and Simulation of a Downer-Type HS-FCC Unit. Ind. Eng. Chem. Res. 2008, 47, 9018–9024. [Google Scholar] [CrossRef]
- Zhang, H.; Zhu, J.; Bergougnou. M.A. Hydrodynamics in downflow fluidized beds (1): Solids concentration profiles and pressure gradient distributions. Chem. Eng. Sci. 1999, 54, 5461–5470. [Google Scholar] [CrossRef]
- Zhang, H.; Zhu, J. Hydrodynamics in downflow Fluidized Beds (2): Particle Velocity and Solids Flux Profiles. Chem. Eng. Sci. 2000, 55, 4367–4377. [Google Scholar] [CrossRef]
- Wang, C.; Li, C.; Zhu, J. Axial solids flow structure in a high density gas–solids circulating fluidized bed downer. Powder Technol. 2015, 272, 153–164. [Google Scholar] [CrossRef]
- Wang, C.; Zhu, J.; Lan, X.; Gao, J.; Barghi, S. Radial solids flow structure in high flux gas-solids circulating fluidized bed downers. Powder Technol. 2016, 301, 848–857. [Google Scholar] [CrossRef]
- Ma, Y.; Zhu, J. Experimental study of heat transfer in a co-current downflow fluidized bed (downer). Chem. Eng. Sci. 1999, 54, 41–50. [Google Scholar] [CrossRef]
- Luo, B.; Yan, D.; Ma, Y.; Barghi, S.; Zhu, J. Characteristics of gas–solid mass transfer in a cocurrent downflow circulating fluidized bed reactor. Chem. Eng. J. 2007, 132, 9–15. [Google Scholar] [CrossRef]
- Fan, C.; Zhang, Y.; Bi, X.; Song, W.; Lin, W.; Luo, L. Evaluation of downer reactor performance by catalytic ozone decomposition. Chem. Eng. J. 2008, 140, 539–554. [Google Scholar] [CrossRef]
- Wang, C.; Li, C.; Zhu, J.; Wang, C.; Barghi, S.; Zhu, J. A comparison of flow development in high density gas-solids circulating fluidized bed downer and riser reactors. AIChE J. 2015, 61, 1172–1183. [Google Scholar] [CrossRef]
- Ma, Y.; Zhu, J. Heat Transfer in the Downer and the Riser of a Circulating Fluidized Bed–A Comparative Study. Chem. Eng. Technol. 2001, 24, 85–90. [Google Scholar] [CrossRef]
- Wang, C.; Zhu, J.; Barghi, S. Performance evaluation of high density riser and downer: Experimental study using ozone decomposition. Chem. Eng. J. 2015, 262, 478–489. [Google Scholar] [CrossRef]
- Vaishali, S.; Roy, S.; Mills, P.L. Hydrodynamic simulation of gas–solids downflow reactors. Chem. Eng. Sci. 2008, 63, 5107–5119. [Google Scholar] [CrossRef]
- Liu, W.; Li, H.; Zhu, Q. Modeling the hydrodynamics of downer reactors based on the meso-scale structure. Powder Technol. 2017, 314, 367–376. [Google Scholar] [CrossRef]
- Lan, X.; Xu, C.; Wang, G.; Wu, L.; Gao, J. CFD modeling of gas–solid flow and cracking reaction in two-stage riser FCC reactors. Chem. Eng. Sci. 2009, 64, 3847–3858. [Google Scholar] [CrossRef]
- Zhou, Q.; Wang, J. CFD study of mixing and segregation in CFB risers: Extension of EMMS drag model to binary gas–solid flow. Chem. Eng. Sci. 2015, 122, 637–651. [Google Scholar] [CrossRef]
- Zhang, M.; Chu, K.; Wei, F.; Yu, A. A CFD–DEM study of the cluster behavior in riser and downer reactors. Powder Technol. 2008, 184, 151–165. [Google Scholar] [CrossRef]
- Zhao, Y.; Cheng, Y.; Wu, C.; Ding, Y.; Jin, Y. Eulerian-Lagrangian simulation of distinct clustering phenomena and RTDs in riser and downer. Particuology 2010, 8, 44–50. [Google Scholar] [CrossRef]
- Snider, D.M. An Incompressible Three-Dimensional Multiphase Particle-in-Cell Model for Dense Particle Flows. J. Comput. Phys. 2001, 170, 523–549. [Google Scholar] [CrossRef]
- Lanza, A.; Islam, M.A.; Lasa, H.D. CPFD modeling and experimental validation of gas–solid flow in a down flow reactor. Comput. Chem. Eng. 2016, 90, 79–93. [Google Scholar] [CrossRef]
- Lanza, A.; Lasa, H.D. Scaling-up down flow reactors. CPFD simulations and model validation. Comput. Chem. Eng. 2017, 101, 226–242. [Google Scholar] [CrossRef]
- Wu, Y.; Peng, L.; Qin, L.; Wang, M.; Gao, J.; Lan, X. Validation and application of CPFD models in simulating hydrodynamics and reactions in riser reactor with Geldart A particles. Powder Technol. 2018, 323, 269–283. [Google Scholar] [CrossRef]
- Shi, X.; Sun, R.; Lan, X.; Liu, F.; Zhang, Y.; Gao, J. CPFD simulation of solids residence time and back-mixing in CFB risers. Powder Technol. 2015, 271, 16–25. [Google Scholar] [CrossRef]
- Wu, Y.; Shi, X.; Liu, Y.; Wang, C.; Gao, J.; Lan, X. 3D CPFD simulations of gas-solids flow in a CFB downer with cluster-based drag model. Powder Technol. 2019, in press. [Google Scholar] [CrossRef]
- Wang, C. High-density gas-solids circulating fluidized bed riser and downer reactors. Ph.D. Thesis, University of Western Ontario, London, ON, Canada, 2013. [Google Scholar]
- Peng, G.; Dong, P.; Li, Z.; Wang, J.; Lin, W. Eulerian simulation of gas–solid flow in a countercurrent downer. Chem. Eng. J. 2013, 230, 406–414. [Google Scholar] [CrossRef]
- Chen, H.; Gu, S.; Li, H. Simulation gas-solid flow in the downer with new structure-based drag model. Powder Technol. 2018, 323, 163–175. [Google Scholar] [CrossRef]
- Hu, S.; Liu, X. A general EMMS drag model applicable for gas-solid turbulent beds and cocurrent downers. Chem. Eng. Sci. 2019, 205, 14–24. [Google Scholar] [CrossRef]
- Li, F.; Song, F.; Benyahia, S.; Wang, W.; Li, J. MP-PIC simulation of CFB riser with EMMS-based drag model. Chem. Eng. Sci. 2012, 82, 104–113. [Google Scholar] [CrossRef]
- Chen, C.; Werther, J.; Heinrich, S.; Qi, H.; Hartge, E.U. CPFD simulation of circulating fluidized bed risers. Powder Technol. 2013, 235, 238–247. [Google Scholar] [CrossRef]
- Wang, M.; Wu, Y.; Shi, X.; Lan, X.; Wang, C.; Gao, J. Comparison of Riser-Simplified, Riser-Only, and Full-Loop Simulations for a Circulating Fluidized Bed. Processes 2019, 7, 306. [Google Scholar] [CrossRef]
- Yan, A.; Zhu, J. Scale-Up Effect of Riser Reactors (1): Axial and Radial Solids Concentration Distribution and Flow Development. Ind. Eng. Chem. Res. 2004, 43, 5810–5819. [Google Scholar] [CrossRef]
- Zhang, M.; Qian, Z.; Yu, H.; Wei, F. The solid flow structure in a circulating fluidized bed riser/downer of 0.42-m diameter. Powder Technol. 2003, 129, 46–52. [Google Scholar] [CrossRef]
- Lin, Q.; Wei, F.; Jin, Y. Transient density signal analysis and two-phase micro-structure flow in gas–solids fluidization. Chem. Eng. Sci. 2001, 56, 2179–2189. [Google Scholar] [CrossRef]
- Zhu, J.; Manyele, S.V. Radial Non-Uniformity Index (RNI) in Fluidized Beds and Multiphase Flow Systems. Can. J. Chem. Eng. 2001, 79, 203–213. [Google Scholar] [CrossRef]
- Lu, X.; Li, S.; Du, L.; Yao, J.; Lin, W.; Li, H. Flow structures in the downer circulating fluidized bed. Chem. Eng. J. 2005, 112, 23–31. [Google Scholar] [CrossRef]
- Gomez, N.; Molina, A. Analysis of the Particle Clustering Phenomenon in the Fluid Catalytic Cracking of Gasoil in a Downer Reactor. Chem. Eng. Technol. 2019, 42, 1293–1303. [Google Scholar] [CrossRef]
- Shaffer, F.; Gopalan, B.; Breault, R.W.; Cocco, R.; Karri, S.B.R.; Hays, R.; Knowlton, T. High speed imaging of particle flow fields in CFB risers. Powder Technol. 2013, 242, 86–99. [Google Scholar] [CrossRef]
- Xu, J.; Zhu, J. Visualization of particle aggregation and effects of particle properties on cluster characteristics in a CFB riser. Chem. Eng. J. 2011, 168, 376–389. [Google Scholar] [CrossRef]
- Liu, H.; Lu, H. Numerical study on the cluster flow behavior in the riser of circulating fluidized beds. Chem. Eng. J. 2009, 150, 374–384. [Google Scholar] [CrossRef]
- Ambler, P.A.; Milne, B.J.; Berruti, F.; Scott, D.S. Residence time distribution of solids in a circulating fluidized bed: Experimental and modelling studies. Chem. Eng. Sci. 1990, 45, 2179–2186. [Google Scholar] [CrossRef]
- Rhodes, M.J.; Zhou, S.; Hirama, T.; Cheng, H. Effects of operating conditions on longitudinal solids mixing in a circulating fluidized bed riser. AIChE J. 1991, 37, 1450–1458. [Google Scholar] [CrossRef]
- Chan, C.W.; Seville, J.P.K.; Parker, D.J.; Baeyens, J. Particle velocities and their residence time distribution in the riser of a CFB. Powder Technol. 2010, 203, 187–197. [Google Scholar] [CrossRef]
- Velden, M.V.D.; Baeyens, J.; Smolders, K. Solids mixing in the riser of a circulating fluidized bed. Chem. Eng. Sci. 2007, 62, 2139–2153. [Google Scholar] [CrossRef]
- Huang, C.; Qian, Z.; Zhang, M.; Wei, F. Solids mixing in a down-flow circulating fluidized bed of 0.418-m in diameter. Powder Technol. 2006, 161, 48–52. [Google Scholar] [CrossRef]
- Zhang, Y.; Lu, C.; Shi, M. Evaluating solids dispersion in fluidized beds of fine particles by gas backmixing experiments. Chem. Eng. Res. Des. 2009, 87, 1400–1408. [Google Scholar] [CrossRef]
- Liu, D.; Chen, X. Lateral solids dispersion coefficient in large-scale fluidized beds. Combust. Flame. 2010, 157, 2116–2124. [Google Scholar] [CrossRef]
- Du, B.; Fan, L.; Wei, F.; Warsito, W. Gas and Solids Mixing in a Turbulent Fluidized Bed. AIChE J. 2002, 48, 1869–1909. [Google Scholar] [CrossRef]
- Thiel, W.; Potter, O. The mixing of solids in slugging gas fluidized beds. AIChE J. 1978, 24, 561–569. [Google Scholar] [CrossRef]
- Avidan, A.; Yerushalmi, J. Solids mixing in an expanded top fluid bed. AIChE J. 1985, 31, 835–841. [Google Scholar] [CrossRef]
- Wei, F.; Cheng, Y.; Jin, Y.; Yu, Z. Axial and lateral dispersion of fine particles in a binary-solid riser. Axial and lateral dispersion of fine particles in a binary-solid riser. Can. J. Chem. Eng. 1998, 76, 19–26. [Google Scholar] [CrossRef]
- Wei, F.; Zhu, J.; Yu, Z.; Chen, W.; Mori, S. Lateral and Axial Mixing of the Dispersed Particles in CFB. J. Chem. Eng. Jpn. 1995, 28, 506–510. [Google Scholar] [CrossRef]
- Chalermsinsuwan, B.; Gidaspow, D.; Piumsomboon, P. In-depth system parameters of transition flow pattern between turbulent and fast fluidization regimes in high solid particle density circulating fluidized bed reactor. Powder Technol. 2014, 253, 522–536. [Google Scholar] [CrossRef]
- Samruamphianskun, T.; Piumsomboon, P.; Chalermsinsuwan, B. Computation of system turbulences and dispersion coefficients in circulating fluidized bed downer using CFD simulation. Chem. Eng. Res. Des. 2012, 90, 2164–2178. [Google Scholar] [CrossRef]


| Item | Downer | Riser |
|---|---|---|
| Particle diameter/μm | 76 | 76 |
| Particle density/kg m−3 | 1780 | 1780 |
| Solids flux/kg m−2 s−1 | 200 | 200 |
| Gas viscosity/Pa s | 1.84 × 10⁻⁵ | 1.84 × 10⁻⁵ |
| Gas density/ kg m−3 | 1.17 | 1.17 |
| Inlet gas velocity/m s−1 | 7 | 7 |
| Bed diameter/m | 0.076 | 0.076 |
| Bed height/m | 5.8 | 10 |
| Packing limit | 0.6 | 0.6 |
| Normal-to-wall momentum retention | 0.3 | 0.3 |
| Tangent-to-wall momentum retention | 0.9 | 0.99 |
| Simulation time/s | 20 | 20 |
| Initial time step/s | 5 × 10⁻⁴ | 5 × 10⁻⁴ |
| Pressure at inlet/Pa | 101,300 | 101,300 |
| Grid number *, Nx × Ny × Nz | 21 × 21 × 900 | 23 × 17 × 425 |
| Continuity Equation of Gas Phase |
| Momentum Equation of Gas Phase |
| Liouville Equation for Describing the Motion of Particle Phase |
| Particle Acceleration |
| Particle Normal Stress Model |
| Drag Model |
© 2020 by the authors. Licensee MDPI, Basel, Switzerland. This article is an open access article distributed under the terms and conditions of the Creative Commons Attribution (CC BY) license (http://creativecommons.org/licenses/by/4.0/).
Share and Cite
Liu, Y.; Wu, Y.; Shi, X.; Wang, C.; Gao, J.; Lan, X. 3D CPFD Simulation of Circulating Fluidized Bed Downer and Riser: Comparisons of Flow Structure and Solids Back-Mixing Behavior. Processes 2020, 8, 161. https://doi.org/10.3390/pr8020161
Liu Y, Wu Y, Shi X, Wang C, Gao J, Lan X. 3D CPFD Simulation of Circulating Fluidized Bed Downer and Riser: Comparisons of Flow Structure and Solids Back-Mixing Behavior. Processes. 2020; 8(2):161. https://doi.org/10.3390/pr8020161
Chicago/Turabian StyleLiu, Yancong, Yingya Wu, Xiaogang Shi, Chengxiu Wang, Jinsen Gao, and Xingying Lan. 2020. "3D CPFD Simulation of Circulating Fluidized Bed Downer and Riser: Comparisons of Flow Structure and Solids Back-Mixing Behavior" Processes 8, no. 2: 161. https://doi.org/10.3390/pr8020161
APA StyleLiu, Y., Wu, Y., Shi, X., Wang, C., Gao, J., & Lan, X. (2020). 3D CPFD Simulation of Circulating Fluidized Bed Downer and Riser: Comparisons of Flow Structure and Solids Back-Mixing Behavior. Processes, 8(2), 161. https://doi.org/10.3390/pr8020161