Article

Systematic Study of Pressure Fluctuation in the Riser of a Dual Inter-Connected Circulating Fluidized Bed: Using Single and Binary Particle Species

1
Sustainable Energy Technologies Center, College of Engineering, King Saud University, Riyadh 11421, Saudi Arabia
2
Deanship of Scientific Research (DSR), King Saud University, Riyadh 11421, Saudi Arabia
3
Priority Research Centre for Frontier Energy Technologies & Utilisation, the University of Newcastle, Callaghan, New South Wales 2308, Australia
4
Design Confidence Consulting Company, Surry Hills, New South Wales 2010, Australia
5
Mechanical Engineering Department, King Saud University, P.O. Box 800, Riyadh 11421, Saudi Arabia
6
Priority Research Centre for Advanced Particle Processing and Transport, the University of Newcastle, Callaghan, New South Wales 2308, Australia
*
Authors to whom correspondence should be addressed.
Processes 2019, 7(12), 890; https://doi.org/10.3390/pr7120890
Submission received: 30 October 2019 / Revised: 24 November 2019 / Accepted: 25 November 2019 / Published: 1 December 2019

Abstract

:
This study systematically investigates the pressure fluctuation in the riser of a dual interconnected circulating fluidized bed (CFB) representing a 10 kWth cold-flow model (CFM) of a chemical-looping combustion (CLC) system. Specifically, a single-species system (SSS) and a binary-mixtures system (BMS) of particles with different sizes and densities were utilized. The pressure fluctuation was analyzed using the fast Fourier transform (FFT) method. The effect of introducing a second particle, changing the inventory, composition (i.e., 5, 10 to 20 wt.%), particle size ratio, and fluidization velocity were investigated. For typical SSS experiments, the results were similar to those scarcely reported in the literature, where the pressure fluctuation intensity was influenced by varying the initial operating conditions. The pressure fluctuations of BMS were investigated in detail and compared with those obtained from SSS experiments. BMS exhibited different behaviour; it had intense pressure fluctuation in the air reactor and in the riser when compared to SSS experiments. The standard deviation (SD) of the pressure fluctuation was found to be influenced by the fluidization regime and initial operating conditions, while the power spectrum density (PSD) values were more sensitive to the presence of the particles with the higher terminal velocity in the binary mixture.

1. Introduction

The application of gas-solid fluidized beds in industry is highly valued due to their abilities of providing an excellent interaction between solid particles and the gas medium, which in turn enhances energy conversion. Gas-solid fluidized beds are widely applied and have two main fields of application: (i) chemical engineering (i.e., catalytic cracking, mixing/segregation of powders), (ii) energy conversion (i.e., steam and hot water production in boilers) [1,2]. The hydrodynamics of gas-solid fluidized beds are complex, primarily determined by the combined effects of solids’ behaviour and bubbles’ characteristics in terms of development, movement, and burst. The application of chemical-looping combustion (CLC) lies between these two points, i.e., it is both part of the chemical engineering application and in energy conversion and steam production.
It has been well documented that utilizing a mixture of metal oxides significantly improves the oxygen storage capacity of oxygen carrier particles in CLC systems that consist of dual interconnected circulating fluidized bed (CFB) [3,4]. This mixture of oxygen carrier was used as a single particles carrier containing both ingredients. However, other systems utilize a binary-mixture system (BMS) as two separate species that differ in sizes and/or densities in bubbling fluidized beds [5,6,7,8,9,10,11,12,13,14,15,16], and in a single-column fluidized bed [17,18,19,20,21]. Utilizing a BMS that differs in size and/or density will raise a number of operational uncertainties associated with the mixing/segregation of particles and the hydrodynamics of these complex systems. Mixing and segregation of binary solids that differ in both size and density have been investigated previously, where an operating map was developed to avoid any type of segregation (i.e., local or components segregation) in CLC systems [22,23,24]. The hydrodynamics of BMS in a dual interconnected CFB are yet to be investigated extensively. Specifically, the effects of parameters including particle size and density, mixture composition, total solids inventory (TSI) on the pressure profile, solids holdup and solid circulation rate have not been adequately examined [2,25,26,27,28,29,30]. In particular, studies concerning the role of the riser in determining the solid circulation rate, solids holdup and the stability of these CFBs, are very limited.
In addition, to investigate the hydrodynamics of CFB, time-series analysis of pressure fluctuation (gauge or differential pressure) or other signals such as solids holdup can also be used to describe the flow regimes [25,26,29,30]. Bai et al. (1996) studied the pressure fluctuation in a single column fluidized bed to characterise different fluidization regimes. They reported the solids holdup (ϕs) values of 0.35 < ϕs < 0.6 for the bubbling fluidization, 0.15 < ϕs < 0.35 for the turbulent fluidization, 0.05 < ϕs < 0.15 for the fast fluidization and ϕs < 0.05 for the pneumatic transport [25]. The standard deviation (SD) of pressure fluctuation was also used to determine the minimum fluidization velocity of the binary mixture of solids [31]. Lue and Wu (2000) used the sum of the SD of pressure fluctuation of each species to determine the SD of the binary mixture by multiplying the fraction of each species in the mixture to its corresponding individual SD under the same operating conditions [31]. Pressure fluctuation analysis has also been used to determine the combustion region in a fluidized bed reactor by studying the SD of the pressure fluctuation, and it was found that the combustion region was related to the regions that have high SD values [27]. In addition, the dominant power spectral density (PSD) is also helpful information for investigating the hydrodynamics in a fluidized bed with the method of fast Fourier transform (FFT). The irregular behaviour over time is due to the linear summation of periodic or random fluctuations, which is assumed by spectral and statistical analyses of electrical signals [28]. Conversely, owing to the complexity of gas–solid interactions, the hydrodynamics of the fluidized bed feature high non-linearity, anisotropy and different time scales that point to the non-stationary nature of the bed dynamics [1,32,33]. Therefore, the gas–solid fluidized bed has been considered as a chaotic system [34]. The PSD analysis by means of FFT analysis has been generally applied to the time series of pressure signals in a fluidized bed [35,36].
Most of the previous hydrodynamics studies have been focused on the SSS systems [37,38,39,40,41,42,43,44] with a view to gaining insight into: (i) the bed operating regime, (ii) solid entrainment, (iii) gas leakage, (iv) particle residence time, and (v) pressure profile [43,45,46]. The total solids inventory has been identified to play a significant role in defining the specific solid circulation rate whereby an increase in the inventory leads to an increase in solid circulation rate [23,45,47]. Also, attempts were also made towards: (i) improving the gas–solid interaction over the total height of the fuel reactor; (ii) reducing total inventory requirements of the fuel reactor by improving the solids-gas interaction; and (iii) increasing the cross-sectional area of the fuel reactor to provide steadier global solids holdup [43,44,45]. Operating the fuel reactor in the turbulent or fast fluidization regimes were also proposed as an effective means to enhancing the gas–solid contact, thus to potentially reduce the total solids inventory which becomes of great relevance for increased plant capacities [43].
However, the riser is one of the major components of all CFB systems (such CLC) which contributes to the global solid circulation rate. The objective of this study is to investigate systematically the hydrodynamics of SSS and BMS in a cold-flow model (CFM) of CLC systems, in particular in the riser and its related component i.e., the air reactor, through a detailed pressure fluctuation analysis. The effects of the system key parameters including fluidization superficial gas velocity, particle size and density, mixture composition, total solids inventory, on the pressure fluctuation characteristics are investigated systematically based on the PSD and SD analyses.

2. Materials and Methods

Experiments were performed on a 10-kWth CFM–CLC system located at the Priority Research Centre of Frontier Energy Technologies and Utilisation at the University of Newcastle, Australia (Figure 1), with system total solids inventory capacity is between 1 to 3 kg. This is a lab scale 10 kWth CFM–CLC unit which was developed and designed based on Glickman scaling laws [48,49,50]. The total solids inventory was varied between 1 to 2 kg, which represents the specific inventory norms of 100–200 kg/MWth [39,51]. Particles physical properties, operating conditions, and operating dimensionless numbers are listed in Table 1 and Table 2, respectively. The apparatuses’ component geometry in terms of air and fuel reactors, risers and loop seals, and the applied experimental procedure, methodology and analysis in this work were described in greater detail in previous related studies (i.e., [23,52,53,54]).
Glass bead (GB) particles with an apparent density of 2462 kg/m3 was used in the SSS experiments (Table 2); this is because it is the dominant species in the BMS experiments. GB particles Reynolds number in the air reactor (Redp(A.R.)) is between 1.75–3.8 and in the riser (Redp(riser)) is between 7–13.6. For the BMS, particles of different size GB and polyethylene (PE) with apparent densities of ρPE = 939 kg/m3 as shown in Table 3 were used for the hydrodynamics studies (PE with Redp(A.R.) = 4–6.42 and Redp(riser) = 16.5–25.7). Different sizes of glass beads (GB) and polyethylene (PE) particles were prepared and used in the experiments, ranging from 98 to 328 μm, at three compositions of polyethylene particles, i.e., 5 wt.%, 10 wt.%, and 20 wt.%. A small amount of Larostat antistatic agent was added into the mixture to prevent electrostatic effects during fluidization. In the cold flow model, N2 was used in the air reactor and air in the fuel reactor. The reason for using N2 in the air reactor is to generate a stable fluidization of particles. This is because of the limited capacity of the available compressed air system (in term of supplied pressure), especially for the air reactor. Alternatively, N2 was used that has very similar density and viscosity to those of air (i.e., ρ(air)/ρ(N2) = 1.04 and μ(air)(N2) = 1.04) to supply the required pressure [48]. At room temperature in cold-flow model studies, it is believed that the error induced only by this subtle difference in density ratio would be negligible. The density ratios between the utilized particles and fluid (ρp/ρf) are 2113 and 806 for GB and PE, respectively.
CFM–CLC are usually made out of Perspex material, therefore, there are two important reasons of not using active metal oxide in CFM–CLC units: (i) abrasion effect if optical measurement methods were utilised, and (ii) the expensive use of active metal oxides in the CFM–CLC experiments. In the hydrodynamic studies of fluidized bed (specially in CLC systems) dimensionless analysis is conducted, which is essential for selecting special particles, these particles should relatively represent the same physical features in terms of their sizes and densities as those of metal oxide particles used in an actual CLC process [43,52]. This dimensionless analysis considers the density and the viscosity of the fluid at the required temperature. The selected particles were calculated based on the Archimedes number (Ar) expressed as:
A r = ρ f ( ρ p ρ f ) g d p 3 μ 2
where dp is the particle size, g is the acceleration due to gravity, μ is the gas viscosity, ρf and ρp are the fluid (i.e., gas) and particle densities, respectively. By assuming that the dimensionless Ar number for the CFM at 25 °C is equal to the Ar number at the actual hot CLC process (i.e., 500–1000 °C):
A r ( 25 ° C ) = A r ( hot )
where Ar(25 °C) was determined using μ and ρf for air at 25 °C, ρp and dp of GB and PE, and Ar(hot) is expressed as,
A r ( hot ) =   ρ f ( hot ) ( ρ p ρ f ( hot ) ) g d p 3 μ ( hot ) 2
By substituting Equation (3) into Equation (2),
A r ( 25 ° C ) = ρ f ( hot ) ( ρ p ρ f ( hot ) ) g d p 3 μ ( hot ) 2
The diameter of the metal oxide in the actual CLC process can be obtained by knowing the metal oxide density, which is well defined in the literature, and by knowing the density and the viscosity of the fluid at the required temperature. The diameter of the metal oxide in the actual CLC process, which represents the particles used in the CFM–CLC system in terms of density and size, can be found using the following expression:
d p = [ A r ( 25 ° C ) μ ( hot ) 2 ρ f ( hot ) ( ρ p ρ f ( hot ) ) g ] 1 3
Therefore, based on this analysis, 98–138 μm (GB) at ambient operating conditions (i.e., 25 °C) relatively represents particles such as CuO (ρp = 6315 kg/m3, 117–313 μm), Fe2O3 (ρp = 5242 kg/m3, 125–330 μm), NiO (ρp = 6670 kg/m3, 115–307 μm) and SiO2 (ρp = 2684 kg/m3, 156–417 μm) at 500–1000 °C using air in the air reactor (Ar = 78–217) and CH4 in the fuel reactor (Ar = 48–133). Similarly, 234–275 μm (PE) at ambient operating conditions (i.e., 25 °C) relatively represents particles such as CuO (ρp = 6315 kg/m3, 203–457 μm), Fe2O3 (ρp = 5242 kg/m3, 216–487 μm), NiO (ρp = 6670 kg/m3, 200–449 μm) and SiO2 (ρp = 2684 kg/m3, 270–608 μm) at 500–1000 °C using air in the air reactor (Ar = 403–1111) and CH4 in the fuel reactor (Ar = 247–679). Under constant Ar number, to have hydrodynamic similarity, the Froude number ratio (i.e., between the hot and cold model) can be close to 1 [43,48,49,50]. The velocity of the air reactor in the hot model should be between 0.9–1.8 times that of the CFM. The applicability of the result obtained from this lab-scale CFM–CLC using the particles in Table 1 is validated and might only be applied to this or similar units. The scaling from 10 kWth CFM–CLC (i.e., lab scale) to 200 kWth CFM–CLC (i.e., demonstration pilot plant) using similar particles and approach was also validated in previous work and showed hydrodynamic similarity [48].
At fixed air reactor fluidization velocity (ug(A.R.)), each case was conducted at least 3 times with five fuel reactor fluidization velocities (ug(F.R.)) in the range of 0.0294–0.1470 m/s. After conducting the experiments and steady-state operating conditions being reached (Figure A1), the pressure readings were taken using 20 pressure ports allocated on the apparatus (i.e., Honeywell micro switch sensoring and control, 142PC05D, 164PC01D37 and 142PC01D, Morris Plains, New Jersey, USA) that recorded pressure at different points in the system, and in the same time the solid circulation rate was measured. The solid circulation rate (i.e., g/min) was obtained using the direct measurement method [53] during a steady state operation by stopping the aeration of loop seal 1 and measuring the time required to reach a particle bed height accumulation of 1–2 cm (repeated for 3 times). The solids holdup was obtained using pressure drop measurement (i.e., ϕs = Δp/[ρph]) from the pressure ports installed along the CFM–CLC system (the numbers in Figure 1 are the location of each pressure port). Two types of pressure data throughout the CFM–CLC system were recorded simultaneously at steady-state operation conditions (i) an averaged pressure value from 100 readings of each pressure port (i.e., 10 readings per 1 s for 10 s interval), and (ii) transient pressure data recorded for each port with a rate of 500 readings per second for a period of 10–60 s (i.e., 5000–30,000 readings). The pressure at each point in the system was compared with the pressure values of the zero reference point measurements that were taken at the beginning of each experiment. Thus, the absolute pressure values of the system could be obtained. The confidence intervals of the error associated with the pressure measurements were less than ±0.03 kPa at 95%, where also the uncertainty analysis in our study showed that the associated error of the solid circulation rate measurements was rather reasonable, falling within 5%–15% [52,53].
To understand the effect of using BMS in the CFM–CLC, a systematic investigation was conducted using firstly SSS, and later another species was added into the system for BMS analysis. For both systems, the effect of changing the superficial gas velocity i.e., in the air reactor (ug(A.R.)) and riser (ug(riser)), total solids inventory, particle size, along with the effect of adding another species at constant fuel reactor ug(F.R.) on riser pressure fluctuation were analysed qualitatively and quantitatively. In the CFM–CLC, the air reactor has larger diameter (i.e., din(A.R.) = 80 mm and h = 300 mm) and operates under turbulent to fast fluidization regimes (to increase the particle residence time in the reactor), while the riser has smaller diameter (i.e., din(riser) = 40 mm and h = 1150 mm) and operates under pneumatic conveying regime to give the particles that departed the air reactor the additional momentum to circulate the system, as shown in Figure 1. For the first part of the experimental investigation, the pressure fluctuation was taken for 60 s (i.e., for SSS). However, to save experimental time and since there is no change in the global solid circulation in the system at steady state, it was decided to be taken at the same sampling rate, however, only for 10–15 s. It is worth noting that the transient pressure fluctuation figures are averaged for every 60 readings to avoid a thick line that cannot be read and compared, all pressure fluctuation figures are produced for 11–12 s. The averaged pressure, solids holdup, and solid circulation rate profiles of the examined conditions along with their detailed discussions can be found in our earlier studies [23,52].

Pressure Fluctuation Analysis

The complex Fourier method was used in the analysis of the pressure signals monitored in the air reactor and the riser. For the complex Fourier method, the first step is to find the complex Fourier expansion amplitudes for given temporal-varying pressure:
Δ P ( t ) = X 0 + i = 1 N [ X i cos ( ω i t ) + Y i sin ( ω i t ) ]
P S D ( ω i ) = X i 2 Y i 2 2 π
in which t denotes to the time of the monitored variable, ωi is the angular frequency (ωi = i × (2π/P)), P is the monitored period (P = 11.0 s), i is an integer and X and Y are the amplitude at the angular frequency ωi.
The nature of the Fourier analysis as shown in Equation (6) is to fit all monitored data using an analytic function expressed as the right hand side (RHS) of Equation (6). There are 2N + 1 unknowns (X0, X1, X2XN; Y1, Y2, … YN) which are solved by the Fourier series analysis. During 11 s period, 5500 monitored points match well with the prediction from the Fourier coefficients (X0, X1, X2XN; Y1, Y2, … YN) as shown by Figure 2.
The signal-sampling rate for the pressure fluctuation was 500 s−1 over a time period of 10–60 s at the steady-state operation. The pressure fluctuation SD was calculated by:
S D = [ 1 N i = 1 N ( Δ P i Δ P A v e r a g e ) 2 ] 1 2
where N is the number of the sampling points; ΔPi is the pressure drop for each sampling point and ΔPAverage is the average pressure drop over the entire sampling points. Some of the SD data are found to be slightly higher or lower due to the artefact of the local solids holdup just before or after the area of interest (i.e., point 3–4 in the air reactor and point 6–9 in the riser). Thus, for some points the average of three SD values was taken (e.g., SD for pressure at point 6, SD for pressure at point 9 and SD for pressure drop point 6–9).

3. Results and Discussion

3.1. Single Species and Binary Mixtures Systems (BMS)

The effect of adding a second species to the total solids inventory was investigated, the study consisted of adding polyethylene particles with apparent density of 939 kg/m3 to the binary mixture. The segregation intensity between/within the air and the fuel reactors (i.e., the local and components segregation) are studied in greater detail in [23,24]; in this work the discussion is more focused on the pressure fluctuation analysis of BMS.
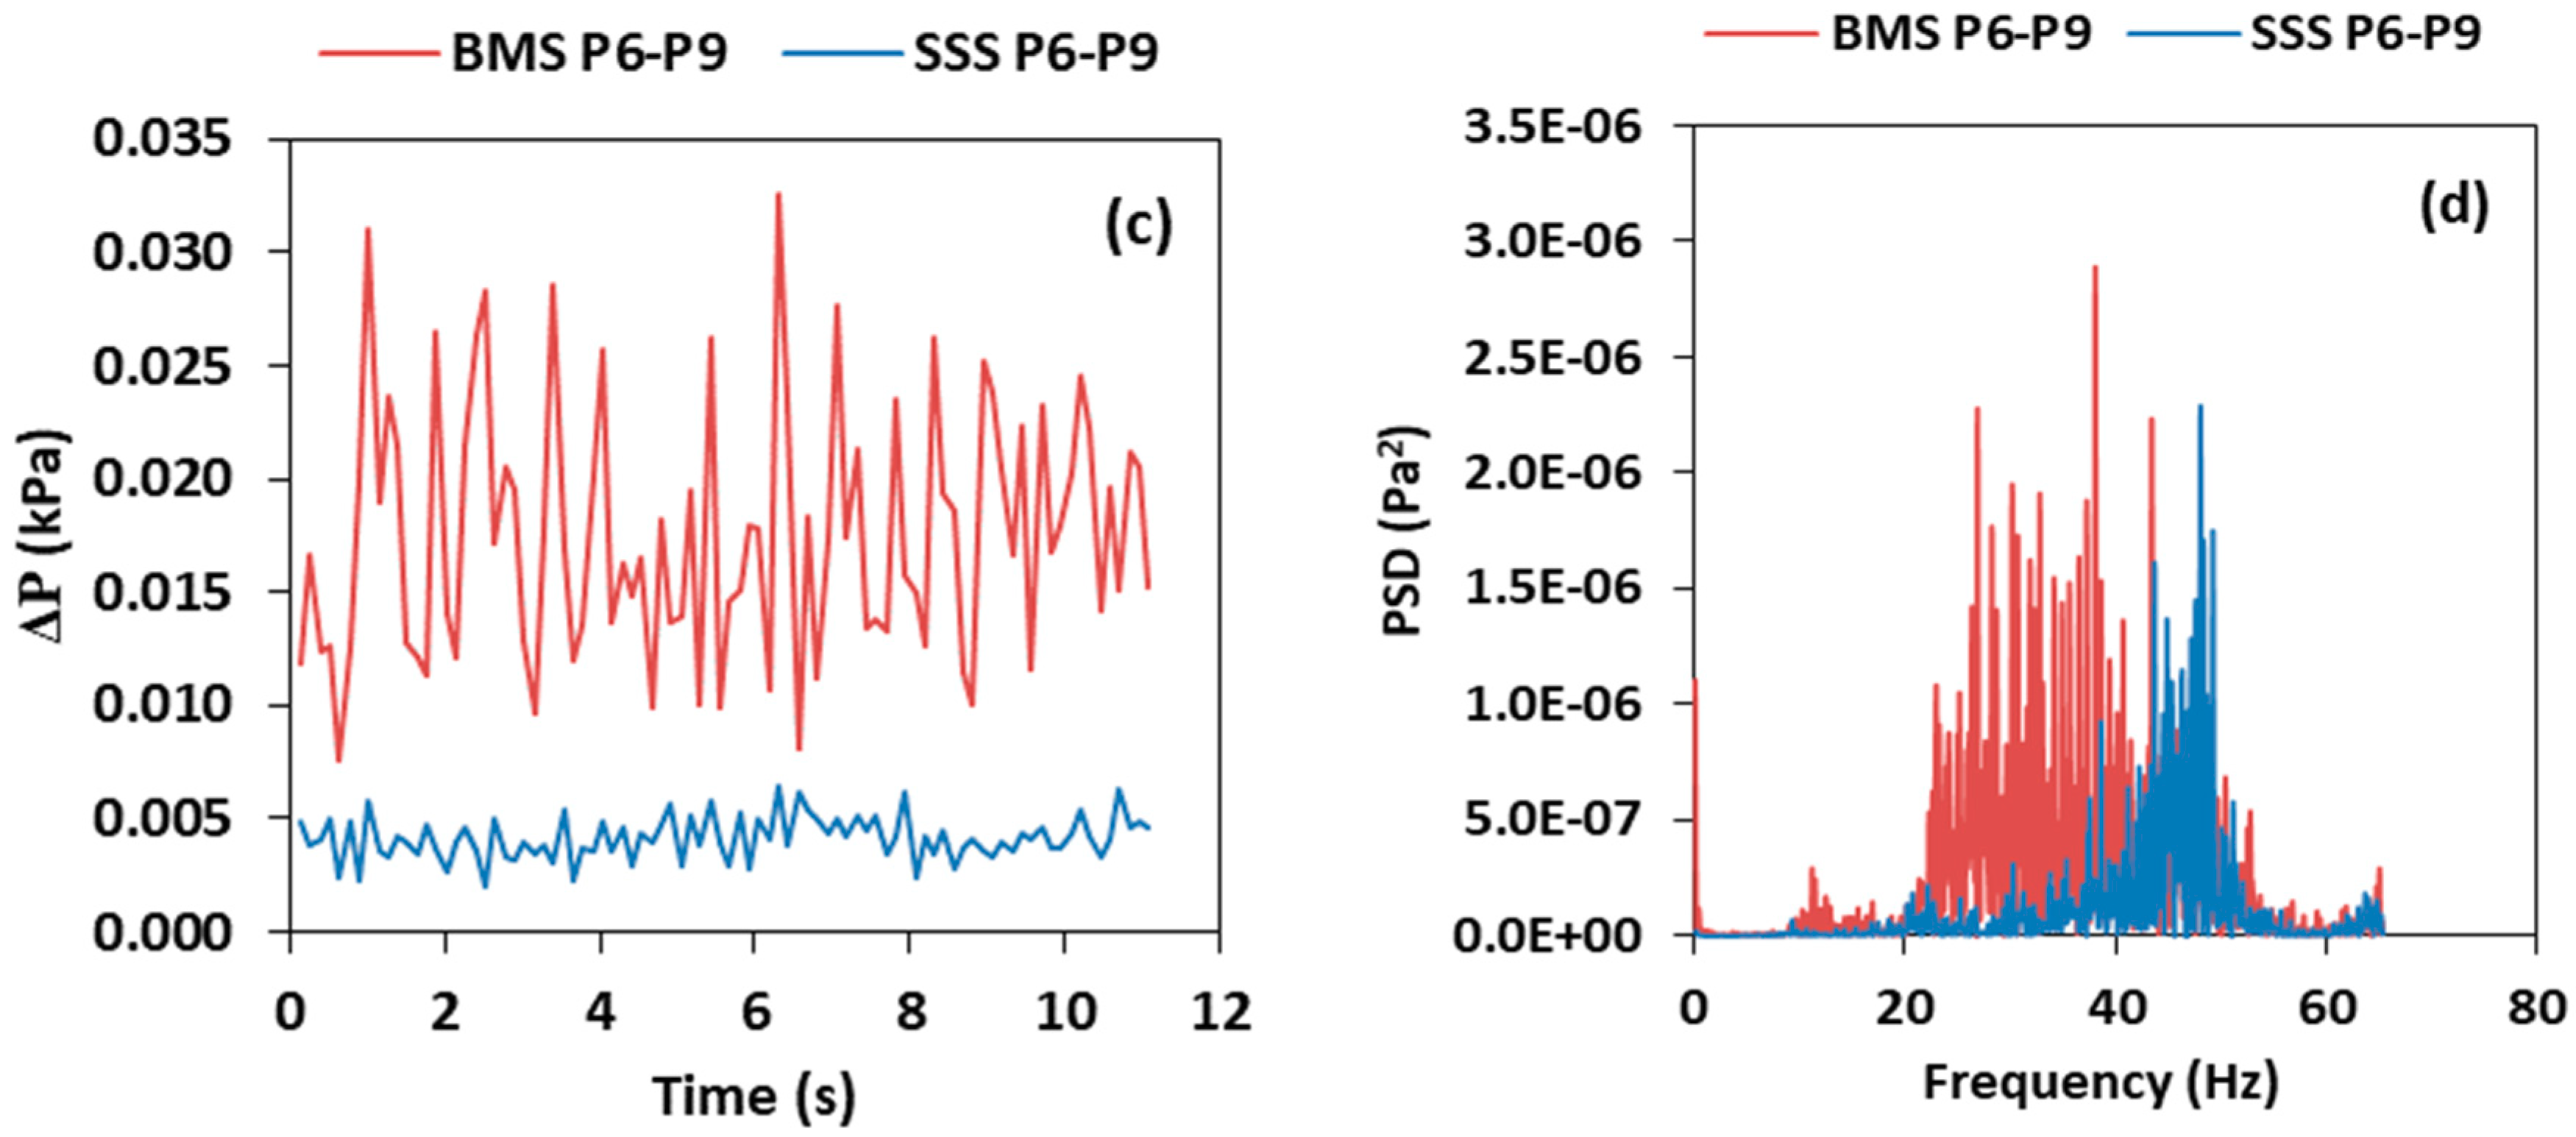
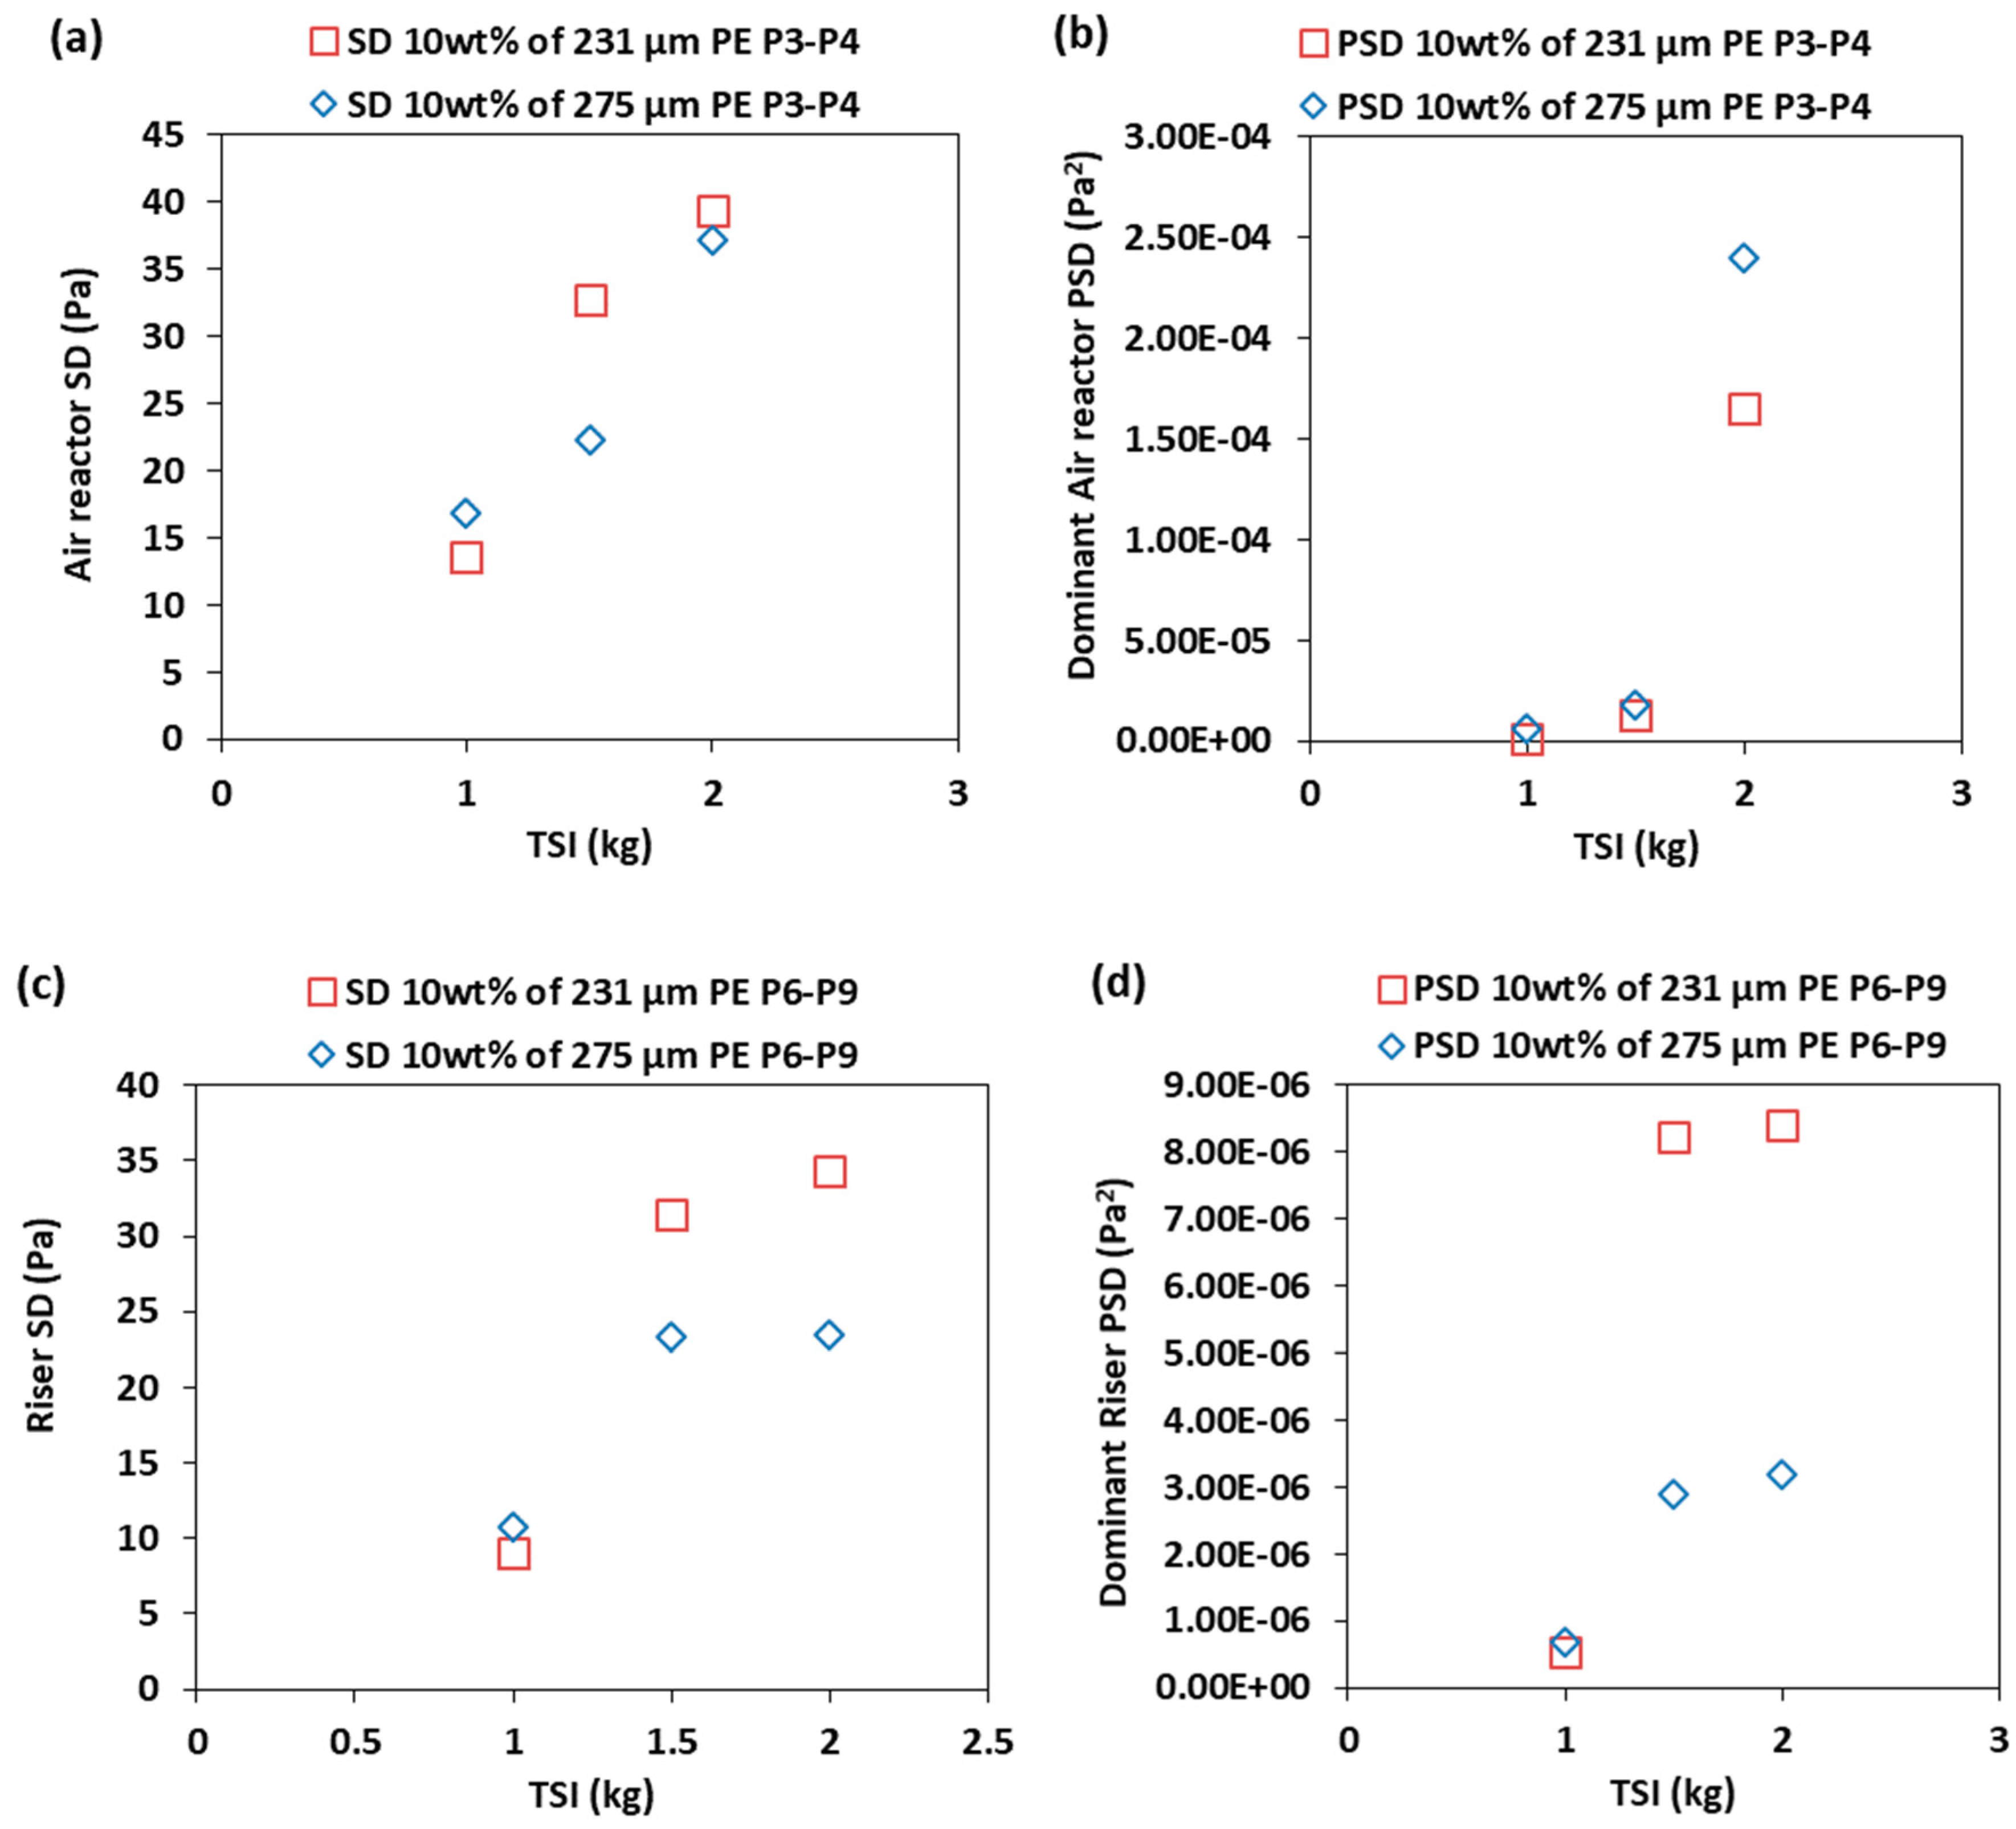
Adding a second species to the inventory affected the overall pressure and solids holdup profiles, however, the profiles in general were found to be comparable to SSS [23,52]. Higher riser pressures and hence a greater solids holdup and solid circulation rate are obtained when using a BMS. The pressure fluctuation in the air reactor and the riser are also greater than that of the SSS, indicating some discrepancies in the local solids holdup profile for the BMS. That is because using a second species in the system with a larger size (dp), a lower density and a higher terminal velocity increases the overall bed height and the solids holdup of that species in the system. In response, the fluctuation intensity in terms of SD and its corresponding PSD increases as well. Therefore, increasing the holdup in the air reactor between points 3 and 4 increases the interaction and collision of particles. As shown in Figure 3a,b, the pressure fluctuation value and intensity, and the PSD are higher at the air reactor for the BMS than that of SSS.
In the riser, some of the particles are observed to fall back as they reach the top of the riser, resulting in a back mixing near the wall. Therefore, the riser also follows the same behaviour where the pressure fluctuation intensity and the PSD are higher for BMS, Figure 3c,d. The wide and strong periodicity of the pressure fluctuation in the riser (i.e., Figure 3c) which demonstrates itself as multiple narrow peaks (Figure 3d) of PSD indicating the presence of solids holdup bubbles of different sizes in the riser. This is the artefact of falling particles adjacent to the riser wall which causes a large variation in the local solids holdup when it is mixed with the upcoming flow from the air reactor. Decreasing the polyethylene size from 275 μm to 231 μm shows the same trend where the BMS has a higher pressure fluctuation intensity and PSD in the air reactor and the riser. This intensity (as discussed above) manifests itself as stronger SD and a higher dominant PSD amplitude (Figure 4). It is worth noting that at 1 kg, the values of SD and PSD were close, and this is because at this inventory the volume of the 10 wt.% of PE particles was not high enough to show the difference, however, it was more pronounced at higher inventory. Nevertheless, it still shows a slight increasing trend. In the air reactor at 1 kg for SSS, BMS (case 1–3) and BMS (case 4–6) the values of SD were 13.24, 13.55 and 16.78 (Pa), and the values of PSD were 1.9, 1.53 and 5.7 (×10−7 Pa2), respectively. While in the riser, the values of SD were 9.2, 9 and 10.77 (Pa), and the values of PSD were 6.2, 5.40 and 6.7 (×10−7 Pa2), respectively.

3.2. Effect of the Superficial Gas Velocity

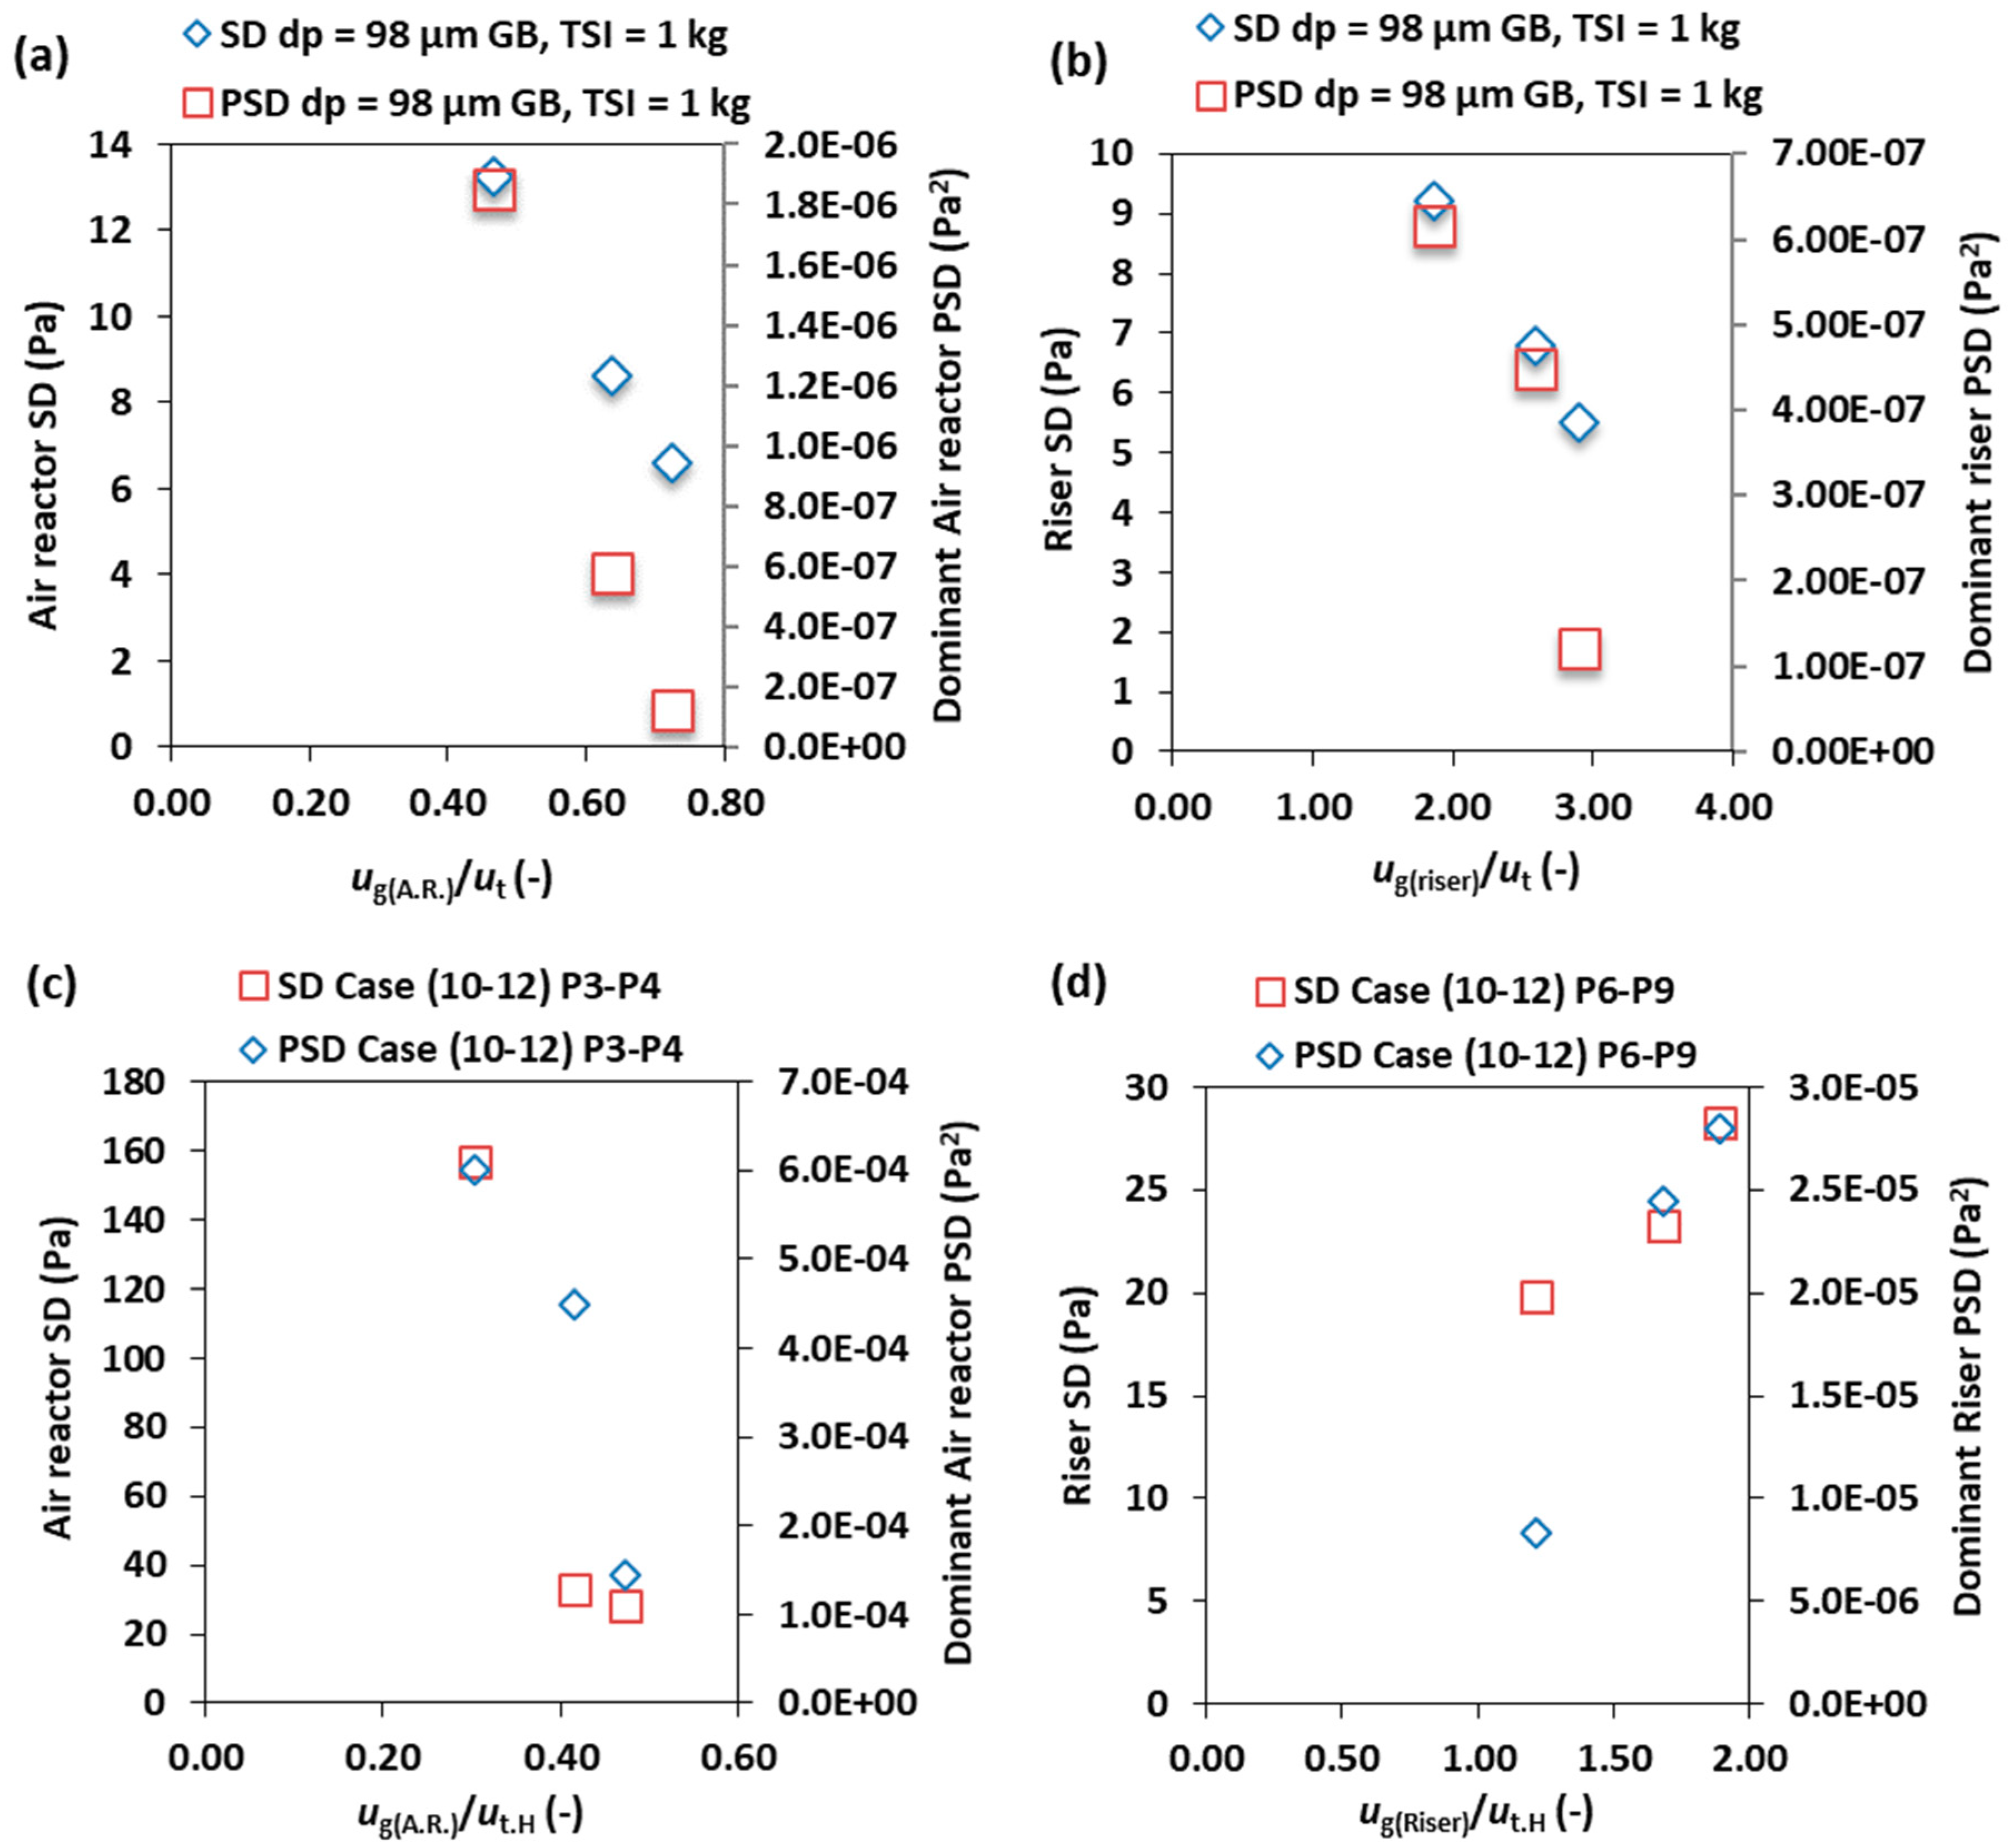
The effect of the superficial gas velocity (ug(A.R.) and ug(riser)) on the pressure fluctuation for SSS and BMS were studied along the air reactor and the riser. Changing ug(A.R.) at a constant total solids inventory influenced the overall pressure and solid circulation rate profiles [23,52], pressure fluctuation, the frequency distribution and the amplitude of that fluctuation in terms of SD and PSD between points 3 and 4 in the air reactor and between points 6 and 9 in the riser.
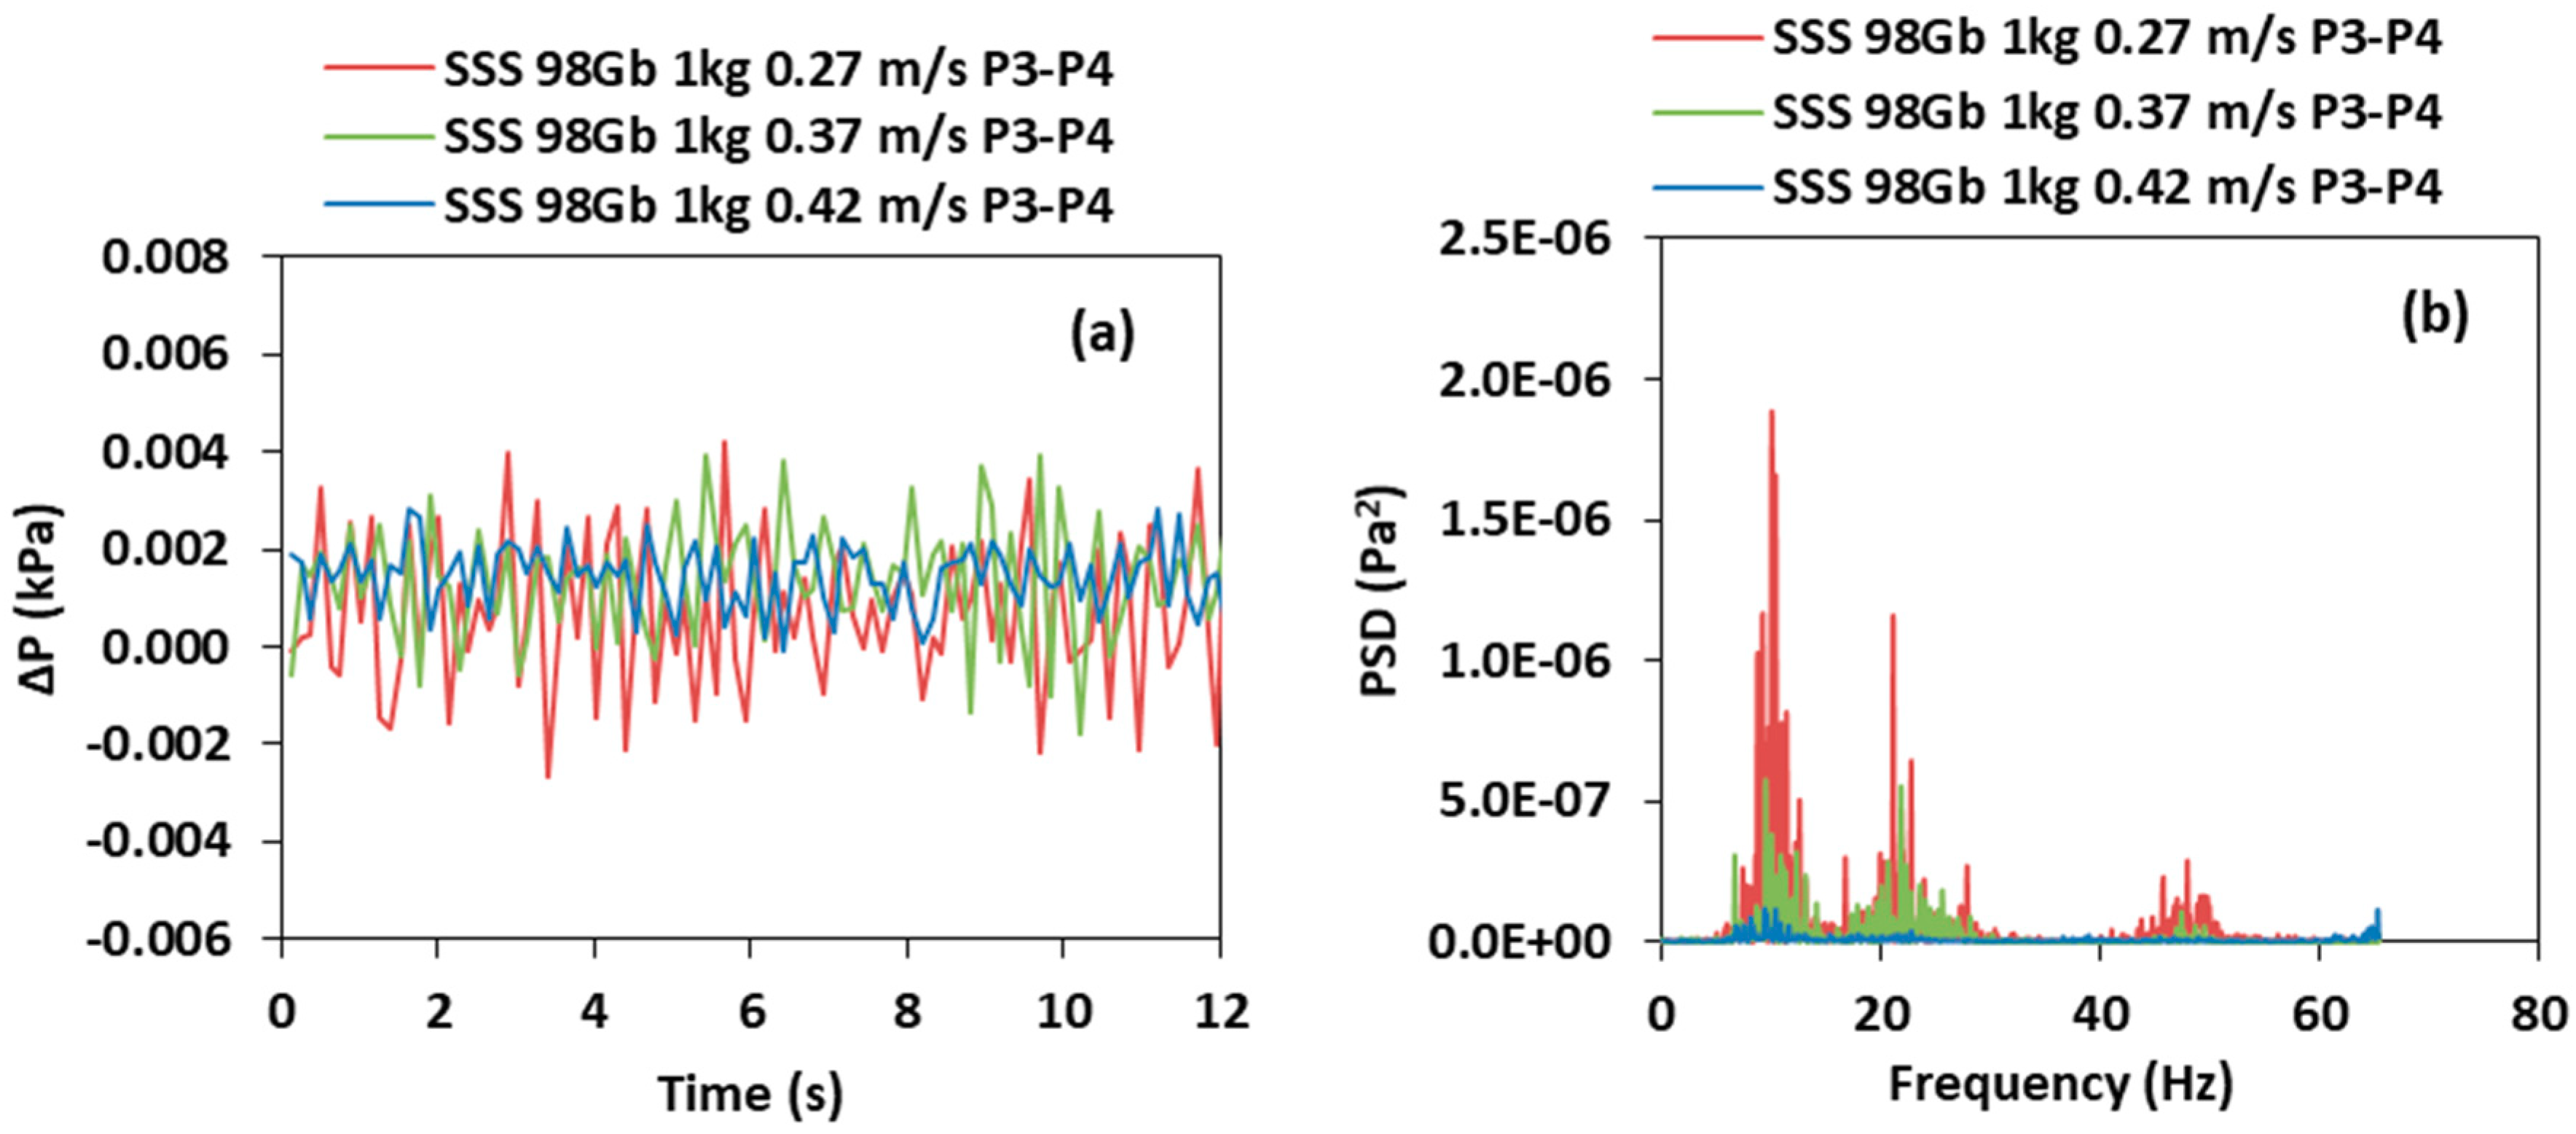
For SSS, at a lower ug(A.R.), the variation of the solids holdup is more significant in the air reactor than that at a higher velocity, as shown in Figure 5a,b. The BMS followed the same behaviour in the air reactor as those of the SSS when the inlet velocity increased from 0.27 to 0.42 m/s, Figure 5c,d. This is because at a low gas inlet velocity, the solids holdup for both systems i.e., SSS and BMS are higher. In general, the pressure fluctuation is less intense with smaller dominant amplitude in terms of PSD and frequency distribution at higher velocities, as shown in Figure 5b,d. This is because as the velocity increases in the air reactor, the solids interaction and holdup decrease. This behaviour was also observed by Bai et al. (1996) when operating the CFB under the same operating regimes in the air reactor [25]. Therefore, the strong periodicity of pressure fluctuation that manifests itself as multiple narrow peaks of PDS indicating the presence of bubbles of different sizes in the air reactor. This is reasonable since the air reactor is operating under turbulent to fast fluidization regime. The value of this amplitude will become less as the air reactor fluidization velocity increased [28].
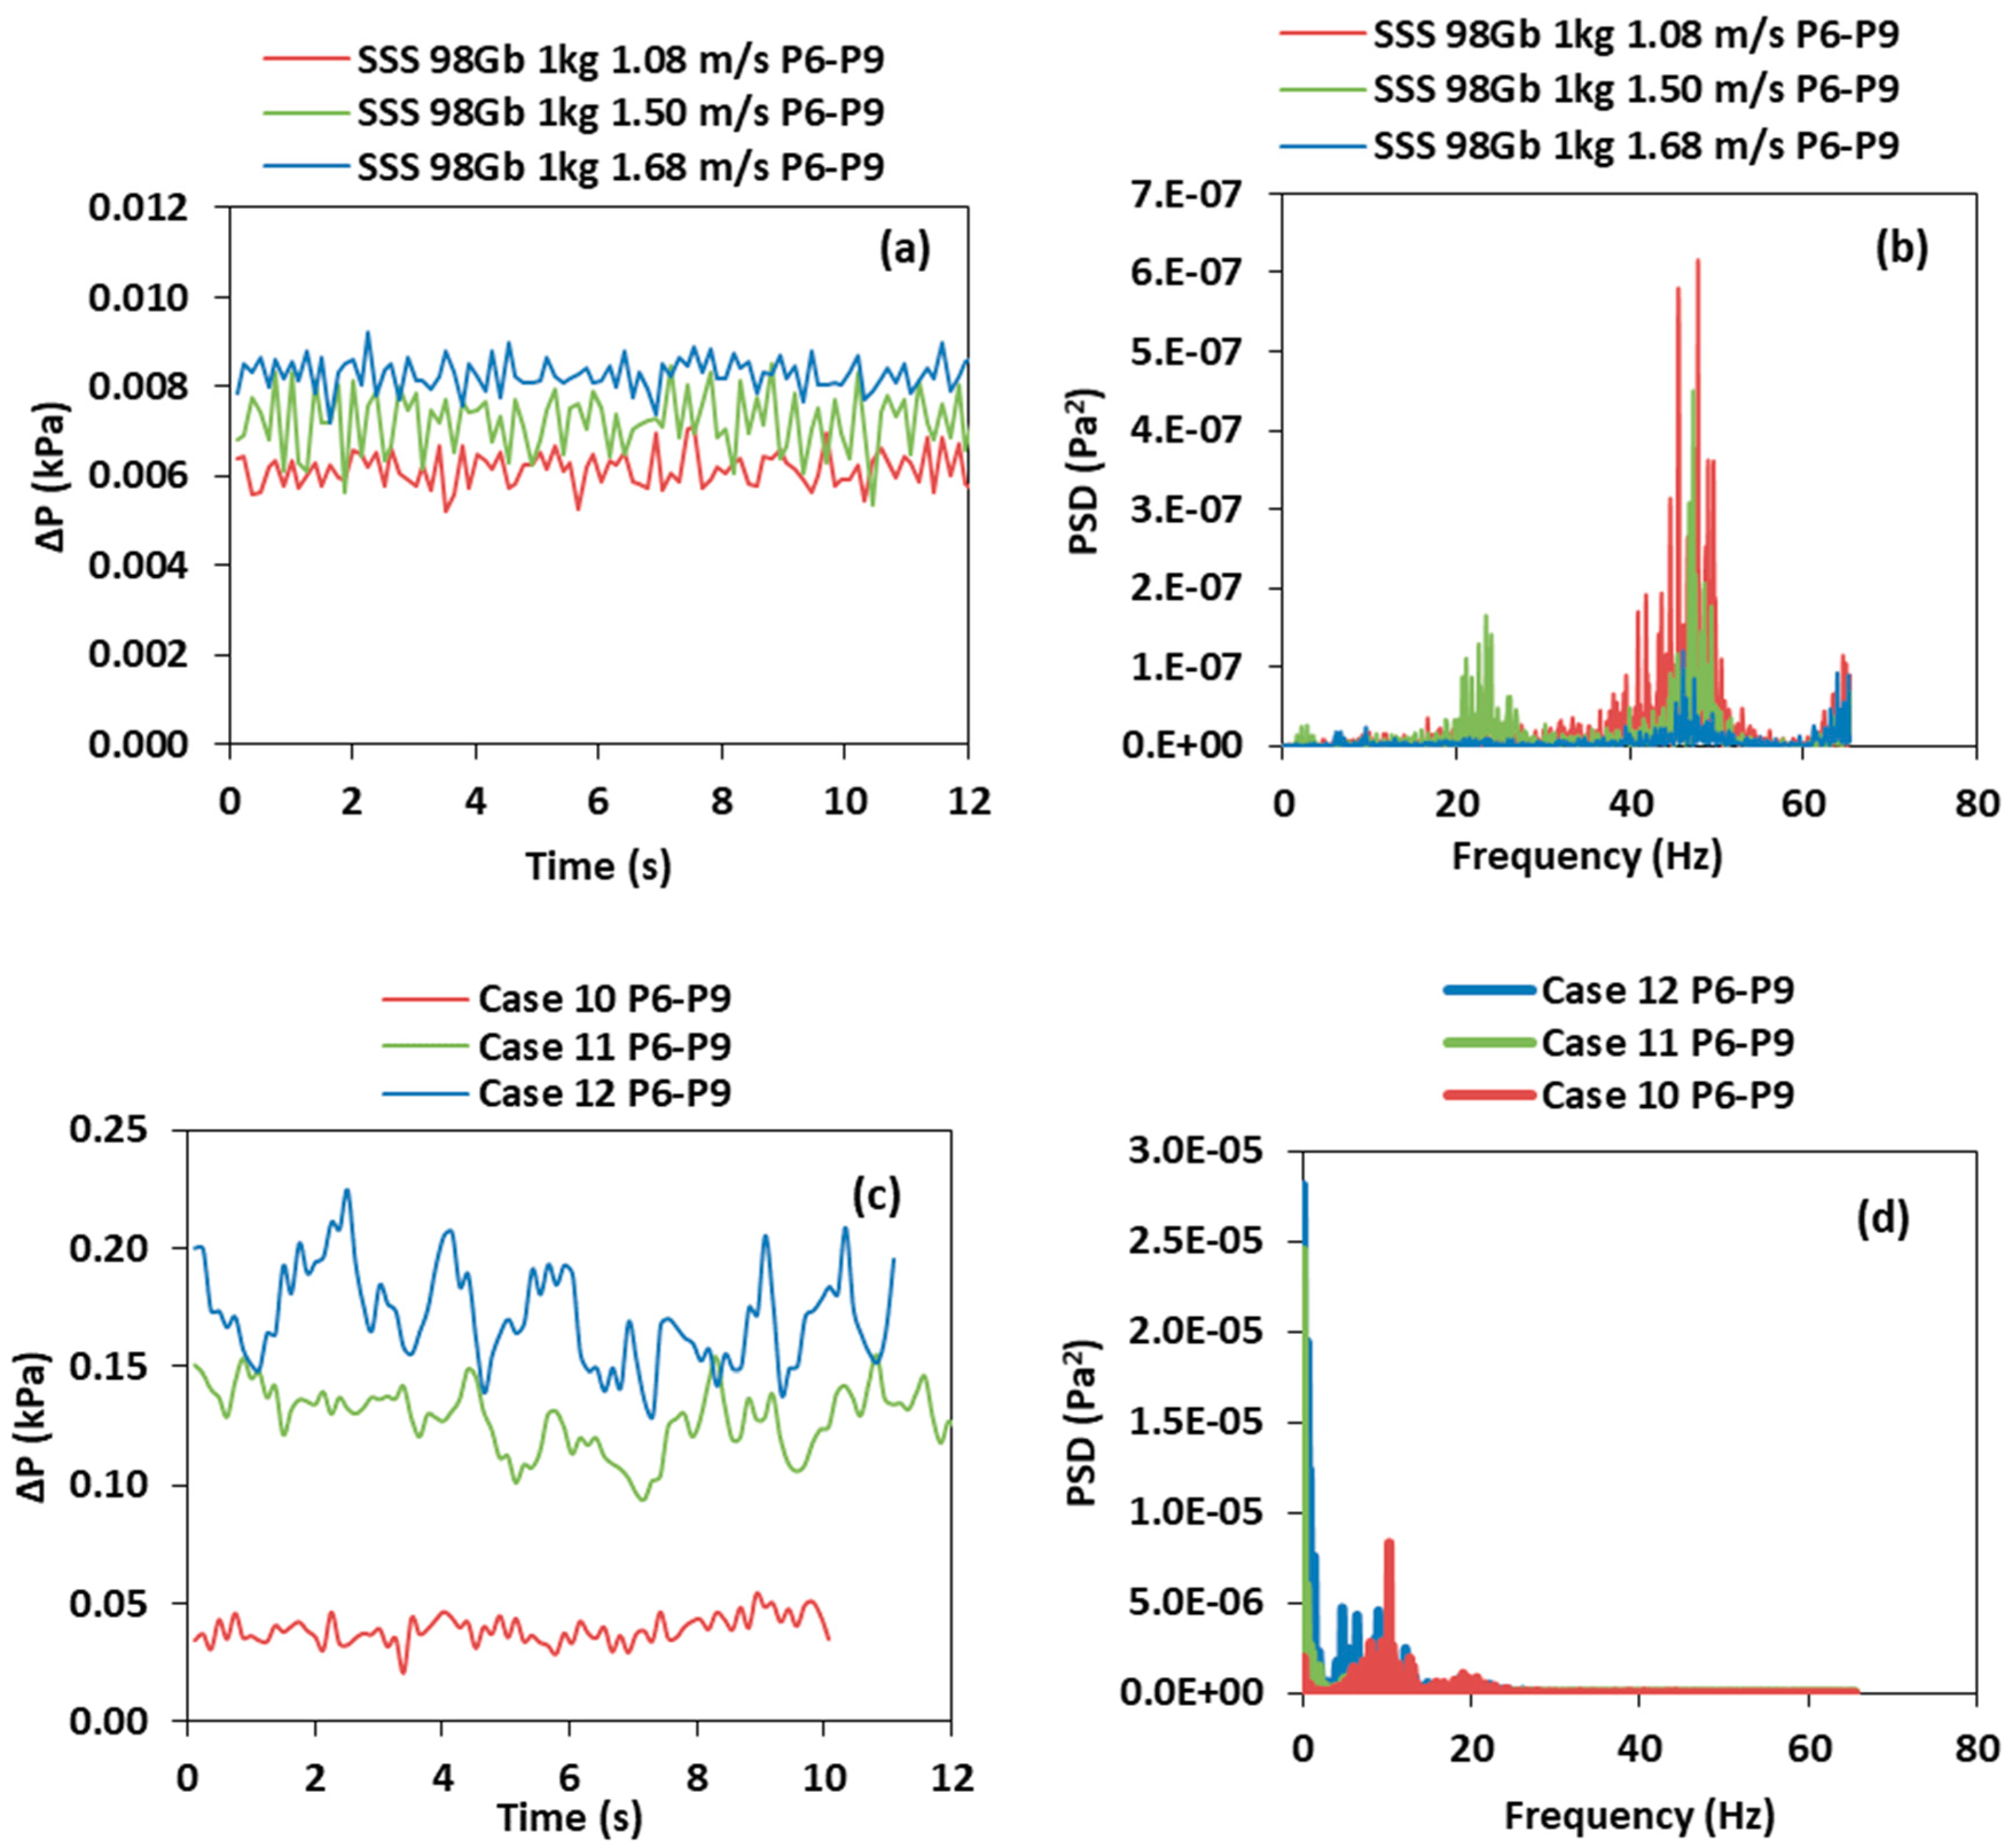
In the riser between points 6 and 9, the solids holdup and the pressure values are higher at higher inlet velocity. This is because increasing the superficial gas velocity leads to the conveying of more solids to the riser, as shown in Figure 6a. For SSS, the dominant amplitude is higher at a lower velocity [28]. The reason behind this is that, at a lower velocity, more solids falls downwards near the riser wall [53]; consequently, more disturbances are observed in the riser due to this chaotic behaviour. Therefore, in the riser, always one narrow high peak is observed along with a few smaller ones; this is because the riser’s main function is to transport the solid particles to the cyclone and then to the fuel reactor. Therefore, if the superficial gas velocity in the riser is not high enough to convey all particles out of the riser, the interactions between particles will become more intense, and will show consecutively as intense pressure fluctuations, presenting as multiple smaller peaks. The frequency distributions for 1.08 and 1.50 m/s in the riser are wider and more intense than that at 1.68 m/s, as shown in Figure 6b.
Similarly, for BMS, the pressure fluctuation value in the riser is higher at a higher superficial gas velocity, see Figure 6c. This is because more particles are transported to the riser and, therefore, it causes the solids holdup to increase, especially for the larger size in the BMS (i.e., PE particles). As the riser velocity increased from 1.08, 1.5 to 1.86 m/s, its ratio to the terminal velocity of the particle with the higher terminal velocity in the BMS increased from 1.2, 1.7 to 1.89, respectively. Accordingly, the solid circulation rate increased rapidly from 90, 237.7 to 364.1 g/min. Even though the percentages that circulated in the loop for glass beads and polyethylene in the total solid circulation rate for these cases were constant and around 92.8% and 7.2%, respectively. The circulation of the polyethylene particle that has a higher terminal velocity in the BMS increased from 6.81, 15.77 to 27.16 g/min [23], respectively. However, as shown in Figure 6d, the PSD behaviour in the riser for the BMS was opposite to that observed in SSS, this is because of the increased presence of the larger size particles (i.e., has higher ut), thus, the intensity and disturbance at higher velocity was observed.
In the air reactor for SSS and BMS, Figure 7a,c show the effect of varying ug(A.R.) at a constant total solids inventory on the SD and PSD of the pressure fluctuation. The SD and PSD values decreases as the velocity increases due to the same reasons mentioned in the above discussion. In the air reactor for BMS the SD and the PSD decreased as the inlet velocity increased and followed the same behaviour as that of SSS. Increasing the air reactor superficial gas velocity in the BMS increases the solids holdup of larger particles in the riser. The SD of the pressure fluctuation and its corresponding PSD of the dominant amplitude increased and followed the opposite behaviour (Figure 7d) when compared with the SSS (Figure 7b).

3.3. Effect of the Total Solids Inventory

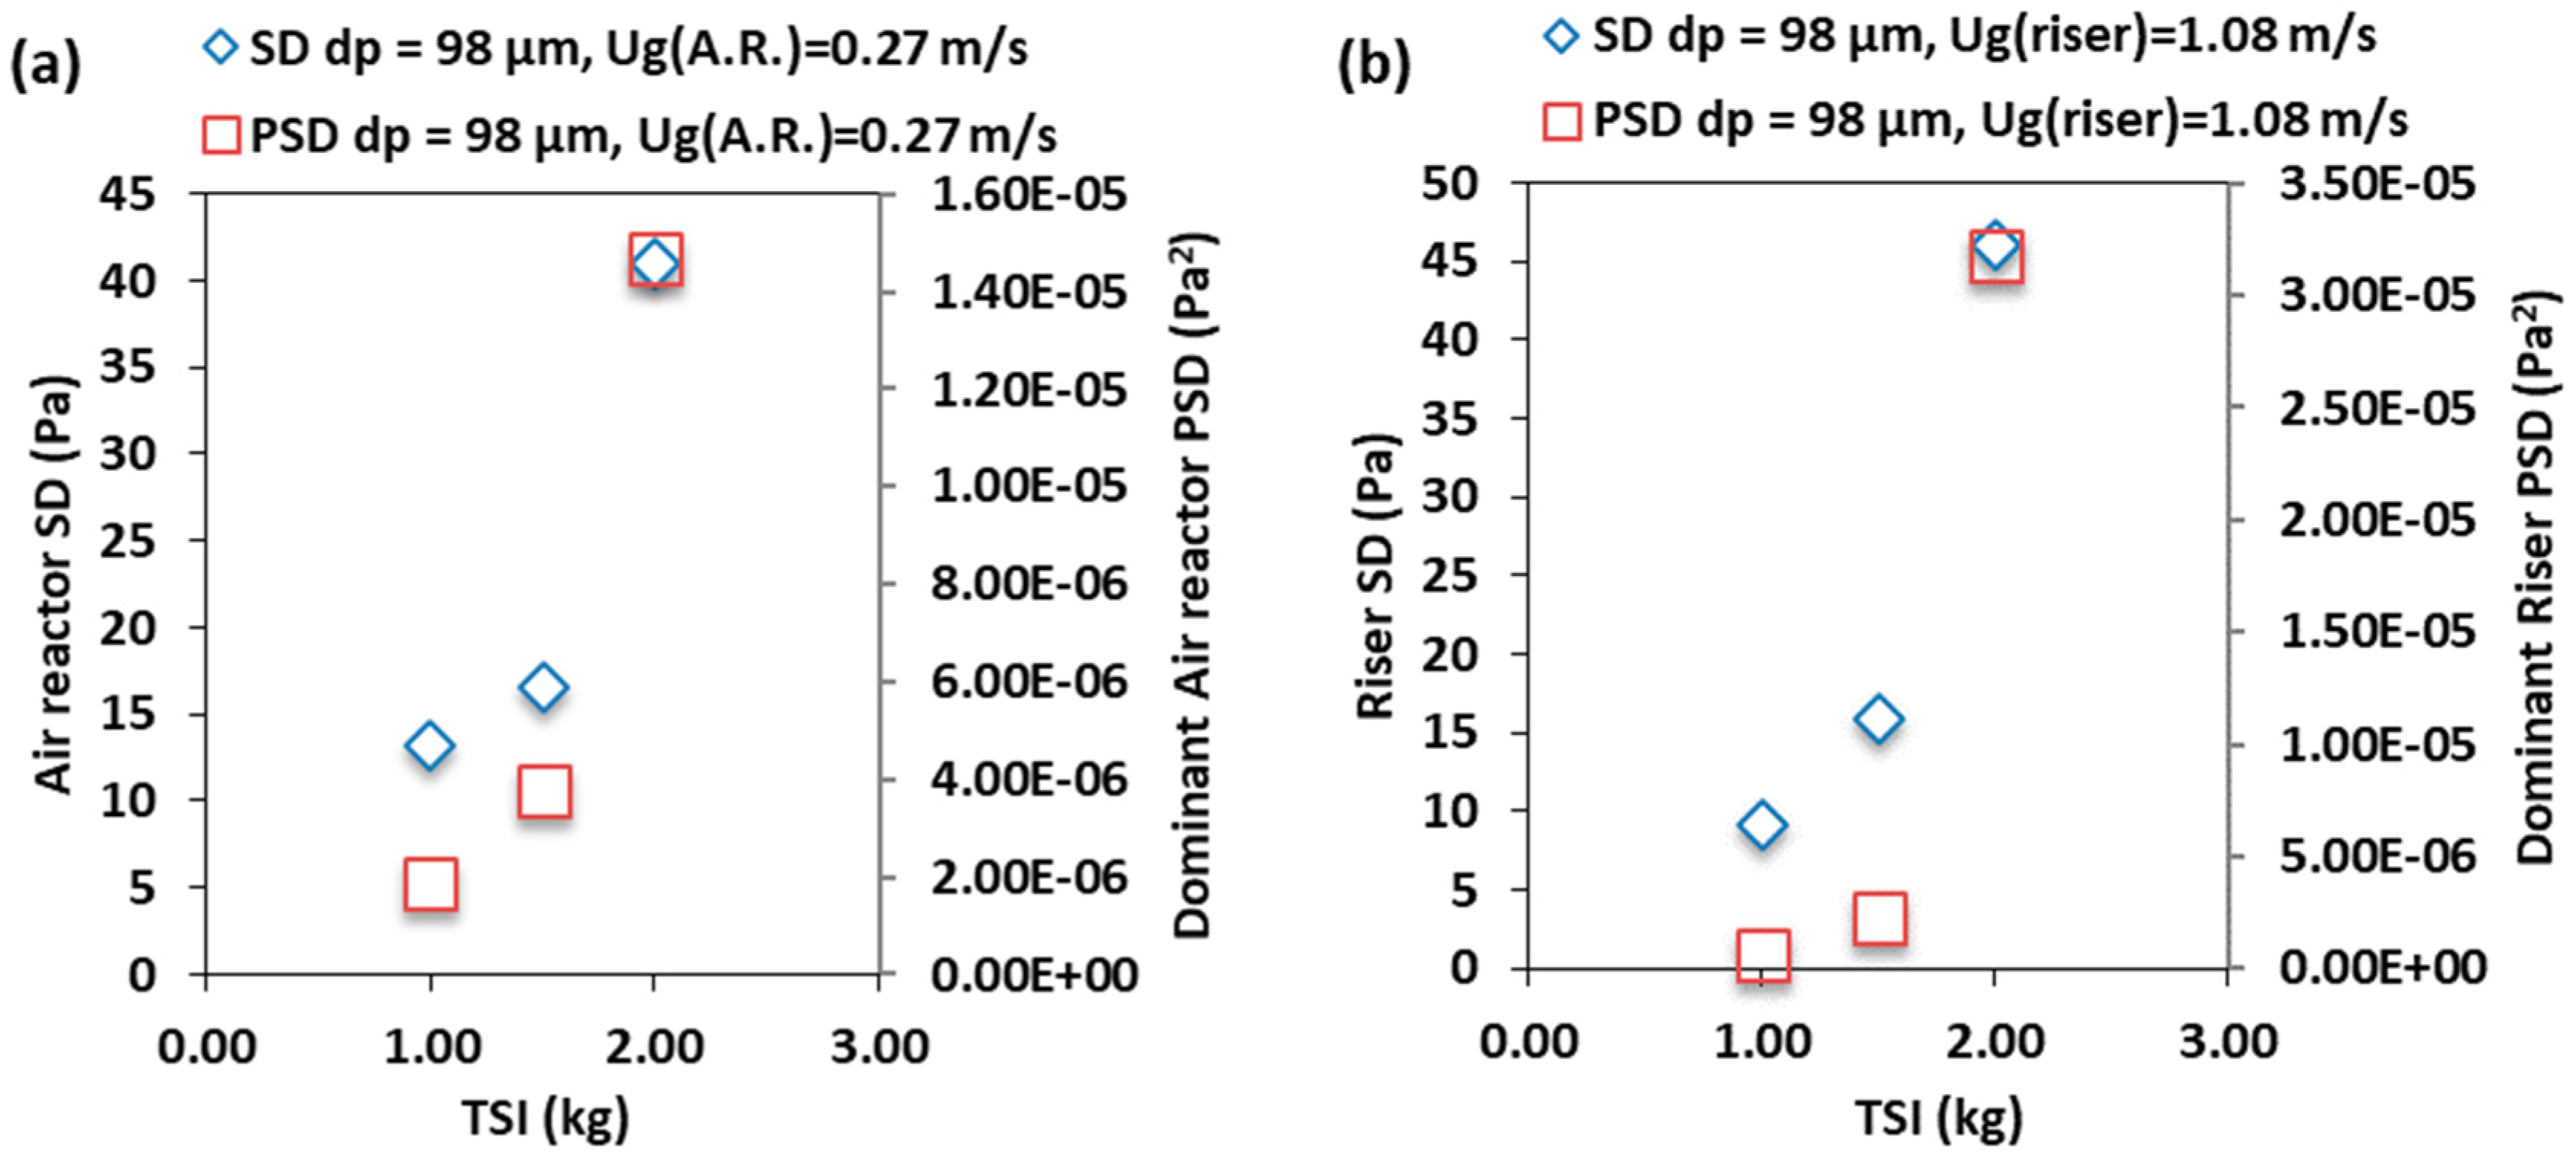
Increasing total solids inventory affected the air reactor and the riser pressure fluctuation intensity and the dominant PSD value for SSS and BMS. For SSS and BMS, at fixed air reactor inlet velocity, the solids holdup and the intensity of the pressure fluctuation were higher at 2 kg. This is the product of increasing the solids inventory at fixed inlet velocity in the air reactor. Even though for example for SSS the solids holdup increased in the air reactor because of increasing the inventory, the solid circulation rate increased from 3.86 g/min, 22.22 g/min to 180.84 g/min for 1 kg, 1.5 kg and 2 kg [52], respectively. Figure 8 shows the effect of increasing the total solids inventory on the SD of the pressure fluctuation and the dominant PSD on the air reactor and the riser. For both systems, the higher the total inventory of solids, the higher the pressure fluctuation intensity and the dominant PSD in the air reactor and the riser.

3.4. Effect of the Particle Size

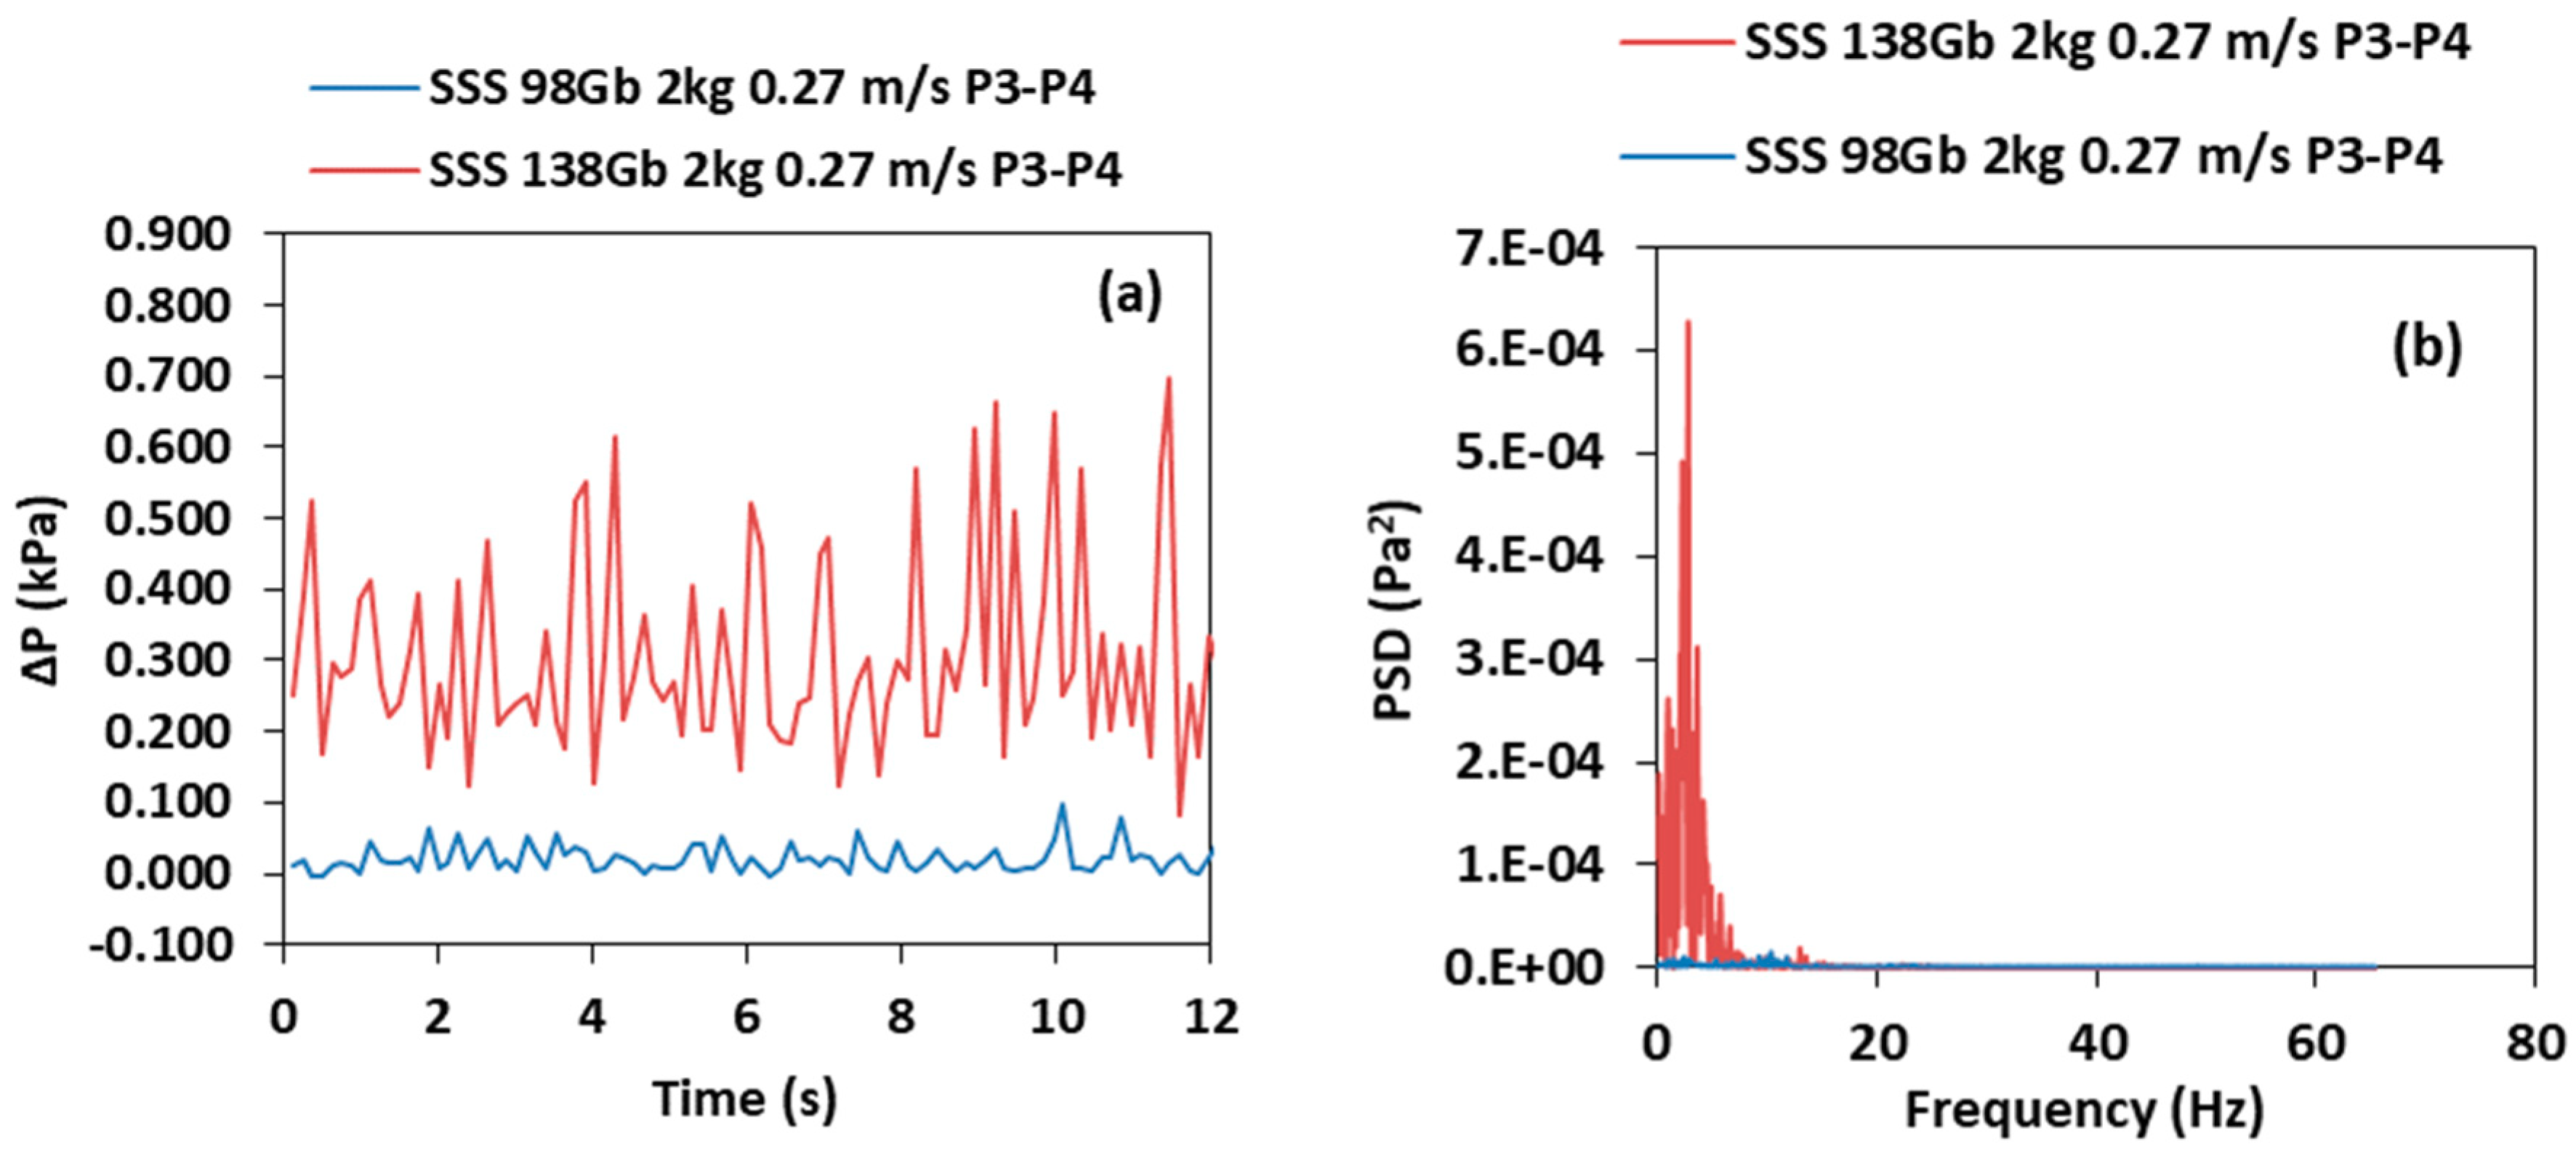
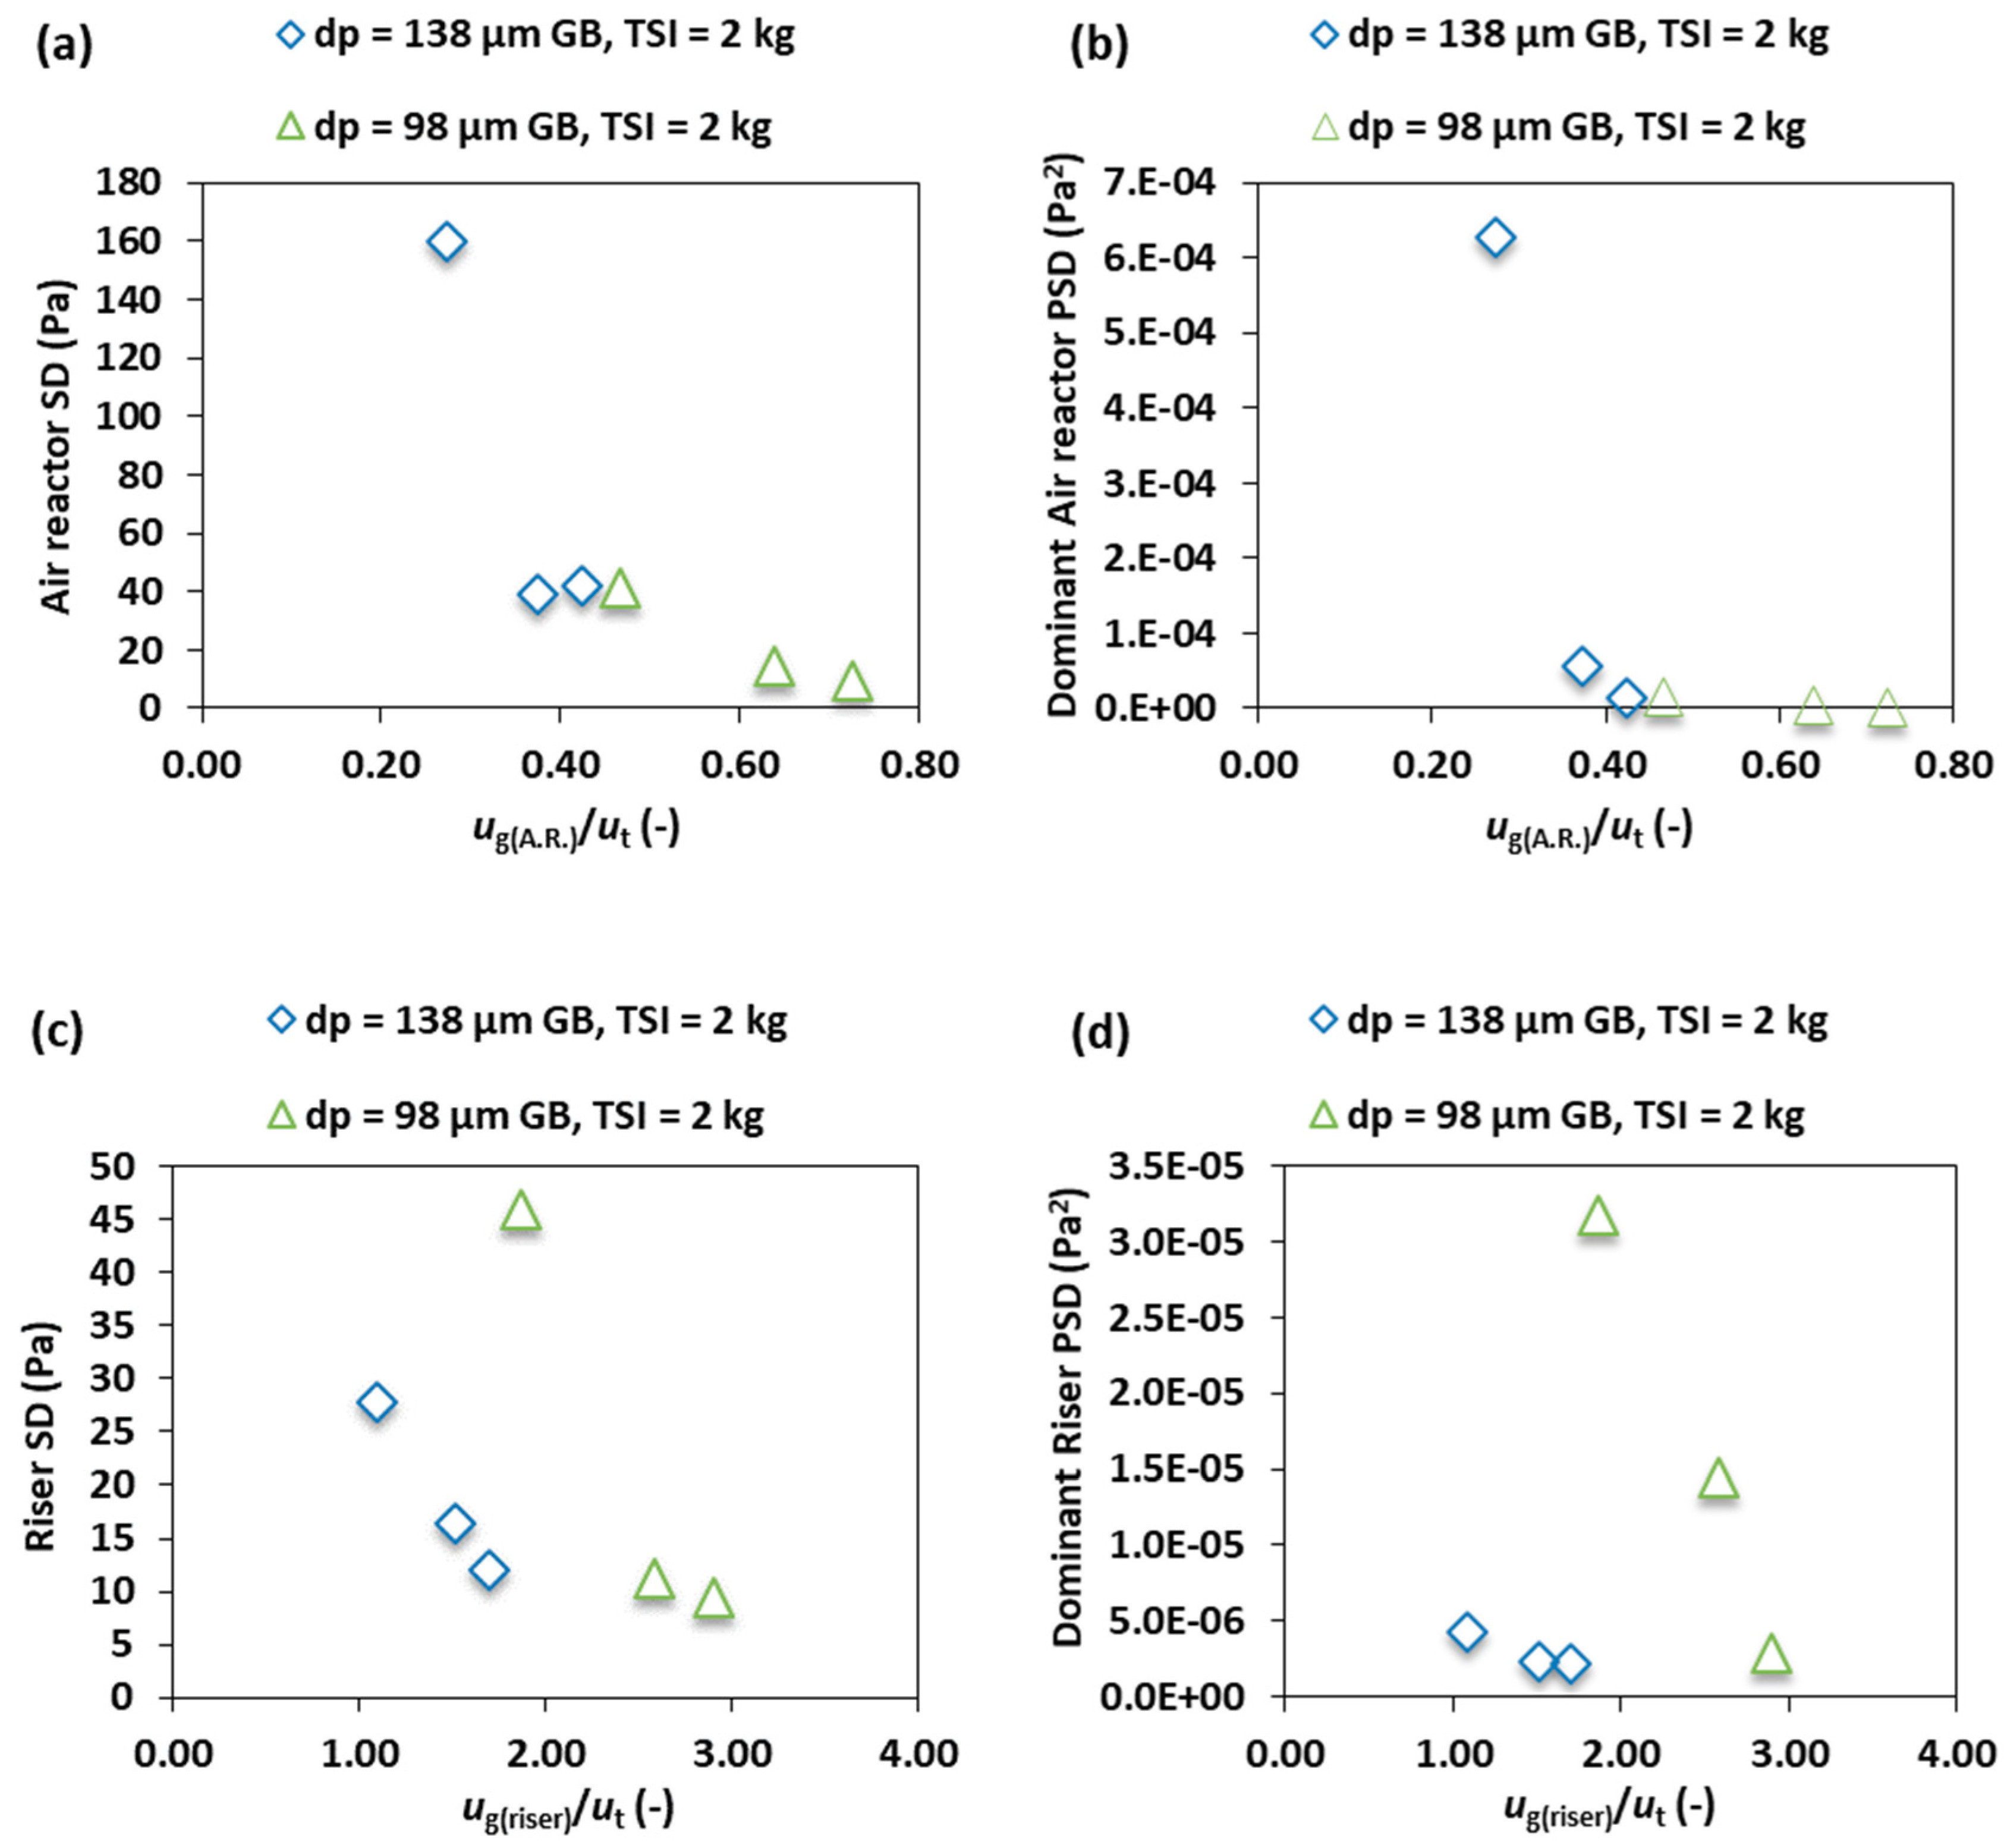
Varying the particle size for SSS influenced the profiles of the pressure and the solids holdup in the air reactor and in the riser [52]. The larger particle (i.e., dGB = 138 μm) has a higher pressure fluctuation intensity and holdup in the air reactor than the smaller particle (i.e., dGB = 98 μm), as reported in Figure 9a. As the particle size increases, u(mf) of the larger particles increases from 0.0085 m/s to 0.012 m/s. As a result, the PSD of the dominant amplitude is higher for the larger particles, as shown in Figure 9b. Figure 10, shows the effect of the particle size on the SD of pressure fluctuation and the dominant PSD, respectively. In the air reactor, the SD and PSD values are higher for the larger particle at different operating conditions, as shown in Figure 10a,b.
In the riser, the smaller particle has higher pressure fluctuation intensity and its PSD amplitude values are also higher, see Figure 9c,d and Figure 10c,d. This can be attributed to the terminal velocity of each particle. The riser velocity to the terminal velocity ratio for the 98 and 138 µm glass beads are 1.88 and 1.08, respectively. Thus, increasing the riser gas to terminal velocities ratio means more solid circulation and solid interaction in the riser. In addition, it can be observed that in the riser, owing to higher ug(riser)/ut (i.e., by increasing ug(riser) not decreasing ut) the riser’s pressure fluctuation SD and PSD for the large particles become slightly higher (Figure 10c), this is because of the increased presence of the larger particles in the riser.
By contrast with SSS, for a BMS at the same superficial gas velocity in the air reactor, increasing the particle size by increasing the BMS particle diameter ratio (see Table 3, e.g., cases 2 and 5) leads to a lower pressure drop fluctuation value [23]. This is because of increasing umf(mixture); thus, as the particle diameter ratio increased from 2.4 to 2.8, less bed expansion and fluidization was observed, as seen in Figure 11a,b. Consequently, the solids holdup of the case with larger diameter ratio near the bed bottom was higher; the dominant PSD of the pressure fluctuation were higher with less distribution, which showed as less pressure intensity and SD (Figure 12a,b). Conversely, the fluidization of the bed with the smaller diameter ratio is more intense due to a lower umf(mixture) (i.e., umf(mixture) = 0.00769 m/s). As a result, intense pressure fluctuation was measured with a wider PSD distribution and a higher SD, as shown in Figure 11a,b and Figure 12a,b. It seems that from the above observation, the SD value was more affected by the fluidization behaviour, while the PSD value was more sensitive to and affected by the holdup/presence of the larger diameter particles in the mixture.
In the riser, the pressure fluctuation value and intensity in terms of SD and PSD were higher for the mixture with the smaller polyethylene particles, as shown in Figure 11c,d and Figure 12c,d. This is because it has a lower terminal velocity, which leads to a higher solids holdup in the riser (i.e., similar to SSS, Figure 10c,d).

3.5. Effect of BMS Composition

Varying the wt.% of each species in the BMS was investigated, and the pressure fluctuation intensity increased as the wt.% of the polyethylene increased in the air reactor. At fixed inlet gas velocity, increasing the wt.% of polyethylene increases the solid circulation rate as well as the percentage of circulated polyethylene more quickly than glass bead particles (polyethylene here is the species with a lower terminal velocity). Consequently, as the polyethylene wt.% increased, the percentage of glass beads in the circulated solids decreased (GB%: 94.4%, 90.4% and 73%) and the holdup of the glass bead particles increased in the air reactor [23]. Smooth frequency and distribution in the air reactor was measured. This can be attributed to the fact that, at this high solid circulation rate, the particles are exiting the air reactor at a higher rate, thus less chaotic interaction and collision of particles occur. Undoubtedly, an increase in the composition of the lower terminal species increases the pressure and the intensity (i.e., SD) in the riser (see Figure 13a). The spectral analysis and the distribution in the riser were also smoother and follow the same behaviour as that of the air reactor. This is again due to low solid interaction in the riser at high solid circulation rate. The dominant amplitude (PSD) increases in the riser as the wt.% of the polyethylene in the CFM–CLC increases, as shown in Figure 13b.
This information of the pressure fluctuation and the PSD analysis are very useful if being used along with the SD analysis to understand the consequence of changing one variable in the initial operating condition of CFBs when SSS and BMS are utilized.
The observed behaviour for the above tested conditions are summarized in Table 4. It can be seen that there is clear difference between the two systems (i.e., SSS and BMS). In general, in BMS the SD values were found to be influenced by the fluidization regime and initial operating condition, the PSD values were more sensitive and affected by the presence of the particles with the higher terminal velocity in the mixture. Further investigations are needed to fully understand the riser pressure fluctuation when BMS is used, specially the hydrodynamic of such a chaotic region in CFB. Similar studies could prove beneficial to identifying the mixing region, and the critical region at which the particles gained enough momentum to circulate out of the riser [53].

3.6. Effect of the Fuel Reactor Fluidization Velocity

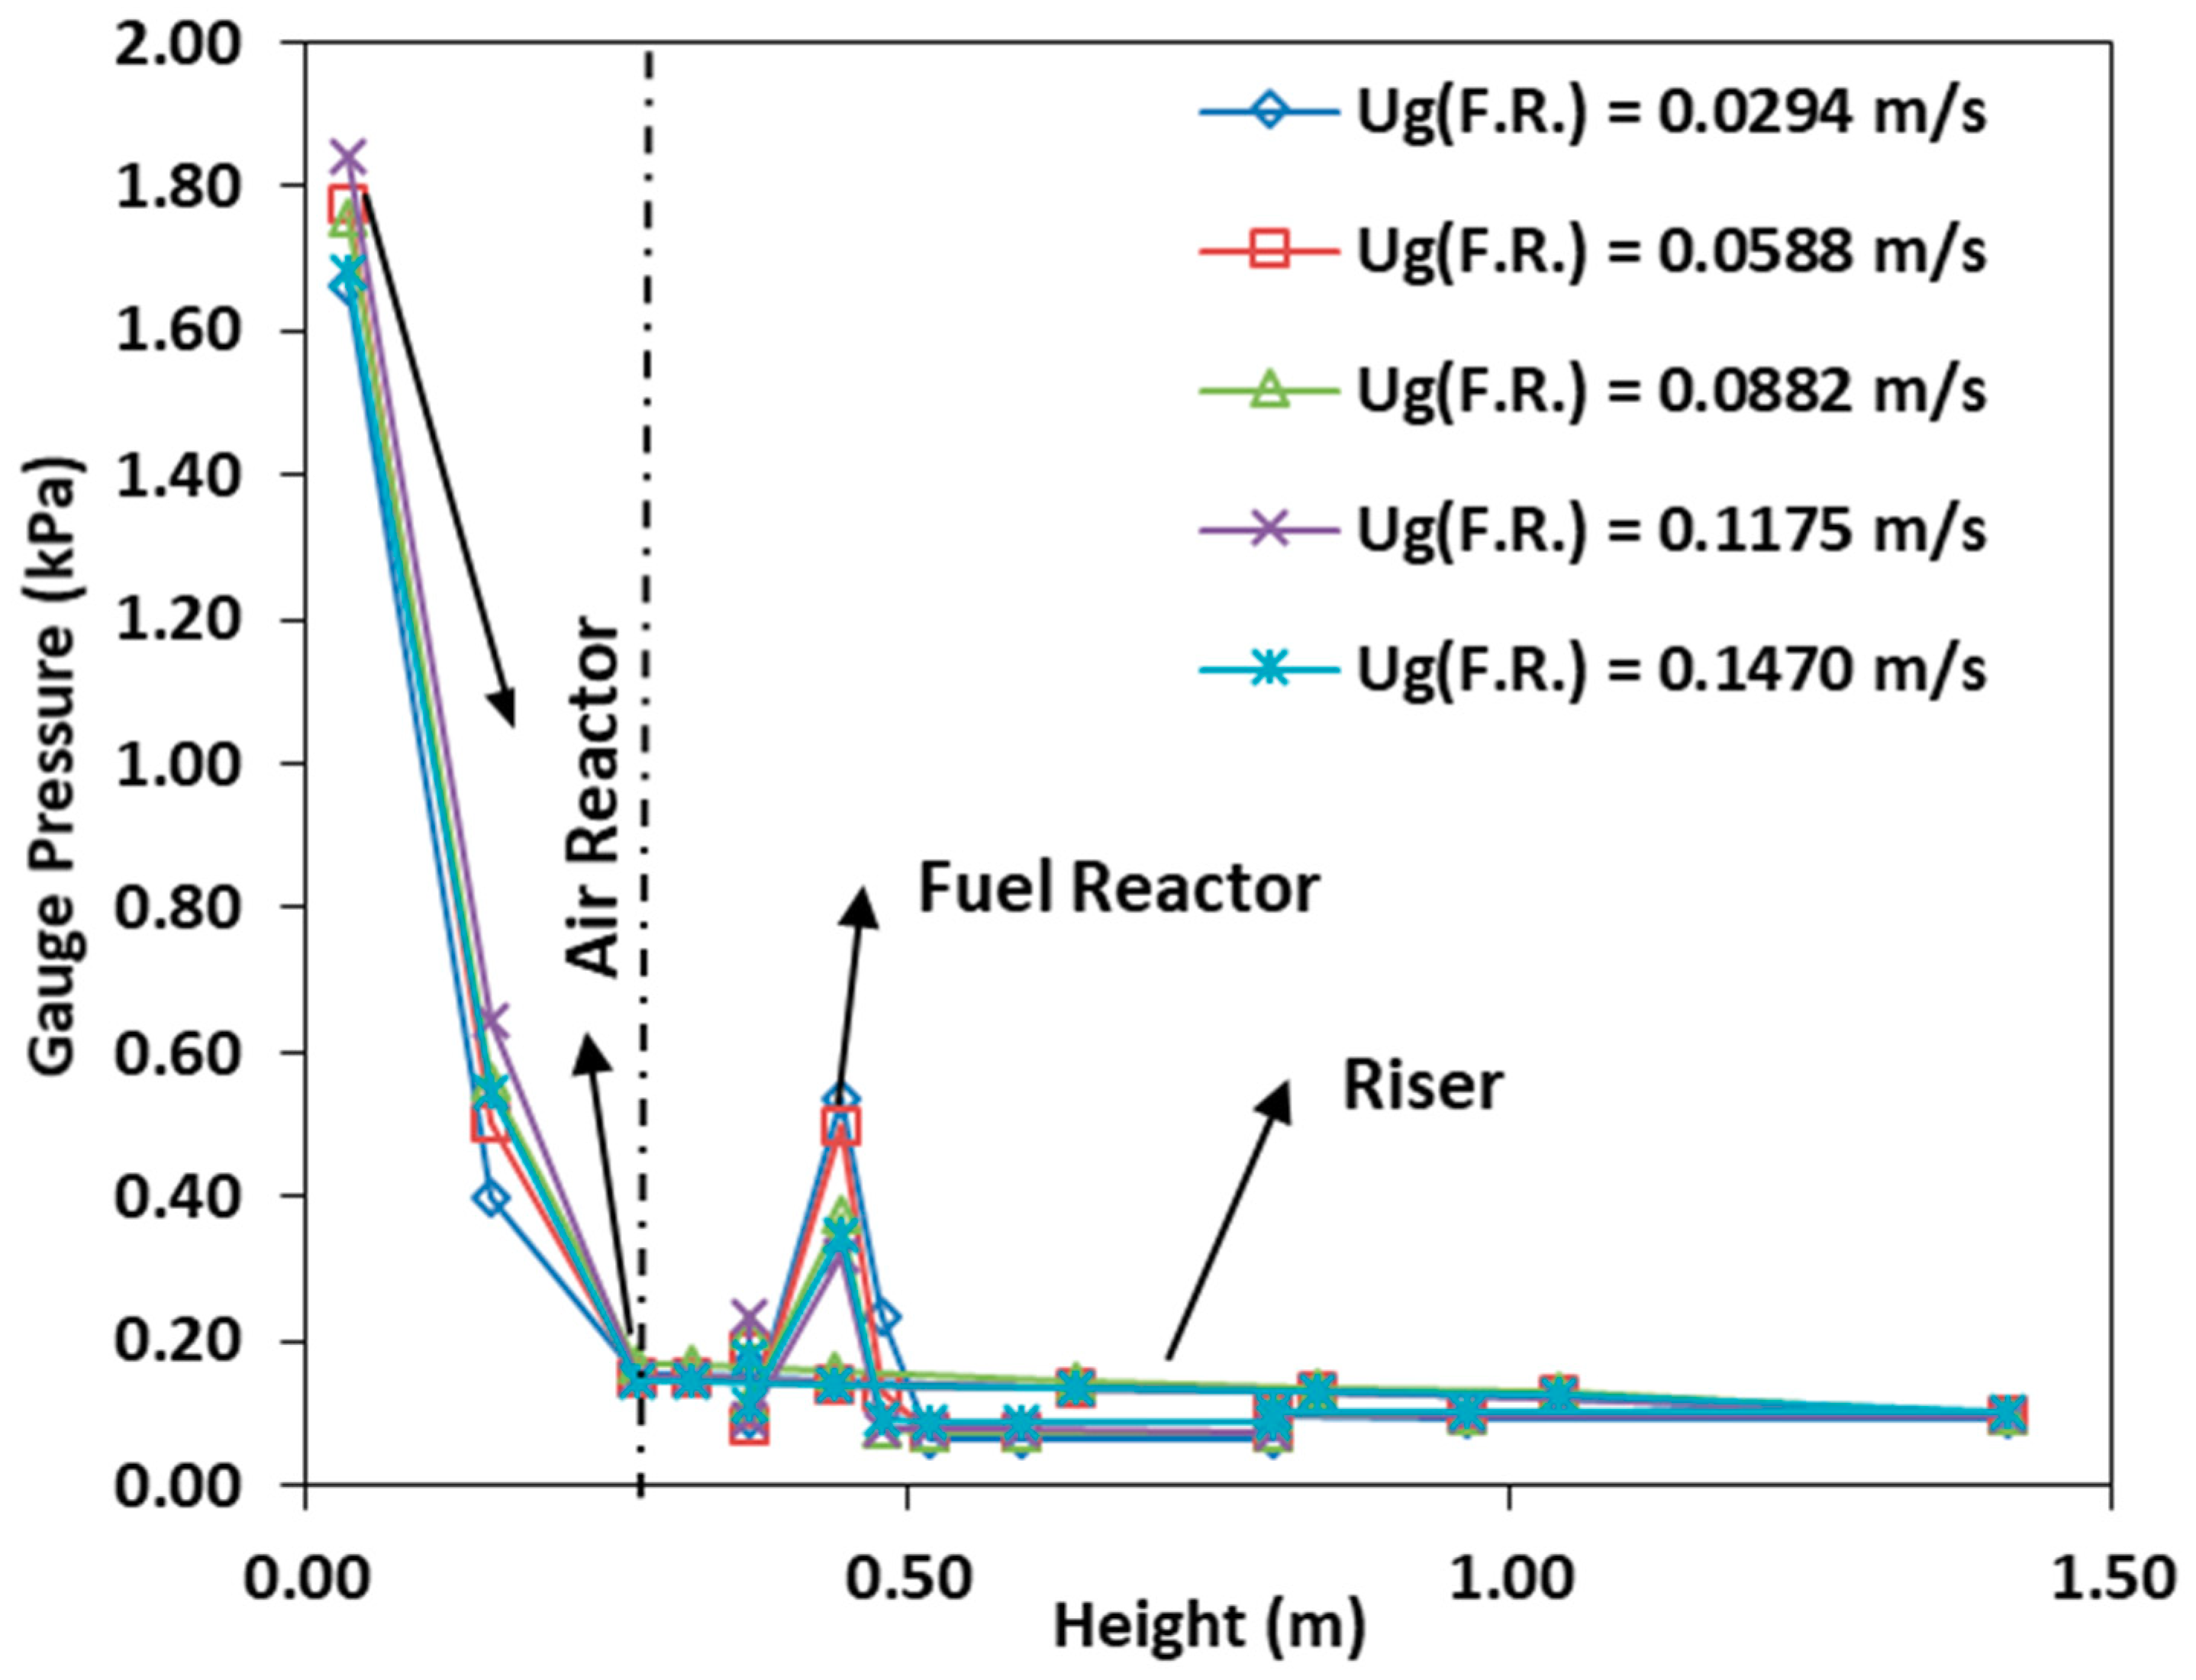
The effect of changing the fuel reactor’s superficial fluidization gas velocity on the overall pressure profile, pressure fluctuation and the solid circulation rate were investigated. Figure 14 shows the pressure profile of the BMS, which consisted of 90 wt.% of dGB = 138 µm and 10 wt.% of dPE = 328 µm at constant ug(riser) = 1.08 m/s, while altering the fluidization velocity in the fuel reactor in a range of ug(F.R.) = 0.0294–0.147 m/s. It can be observed that the overall pressure profiles were the same for different fuel reactor fluidization velocities, especially in the air reactor and the riser (i.e., points 2–5 and 6–9 in Figure 1). Still, there was a slight decrease in the fuel reactor pressure (i.e., point 17) as the fluidization velocity was increased owing to the decrease in the bed’s material height.
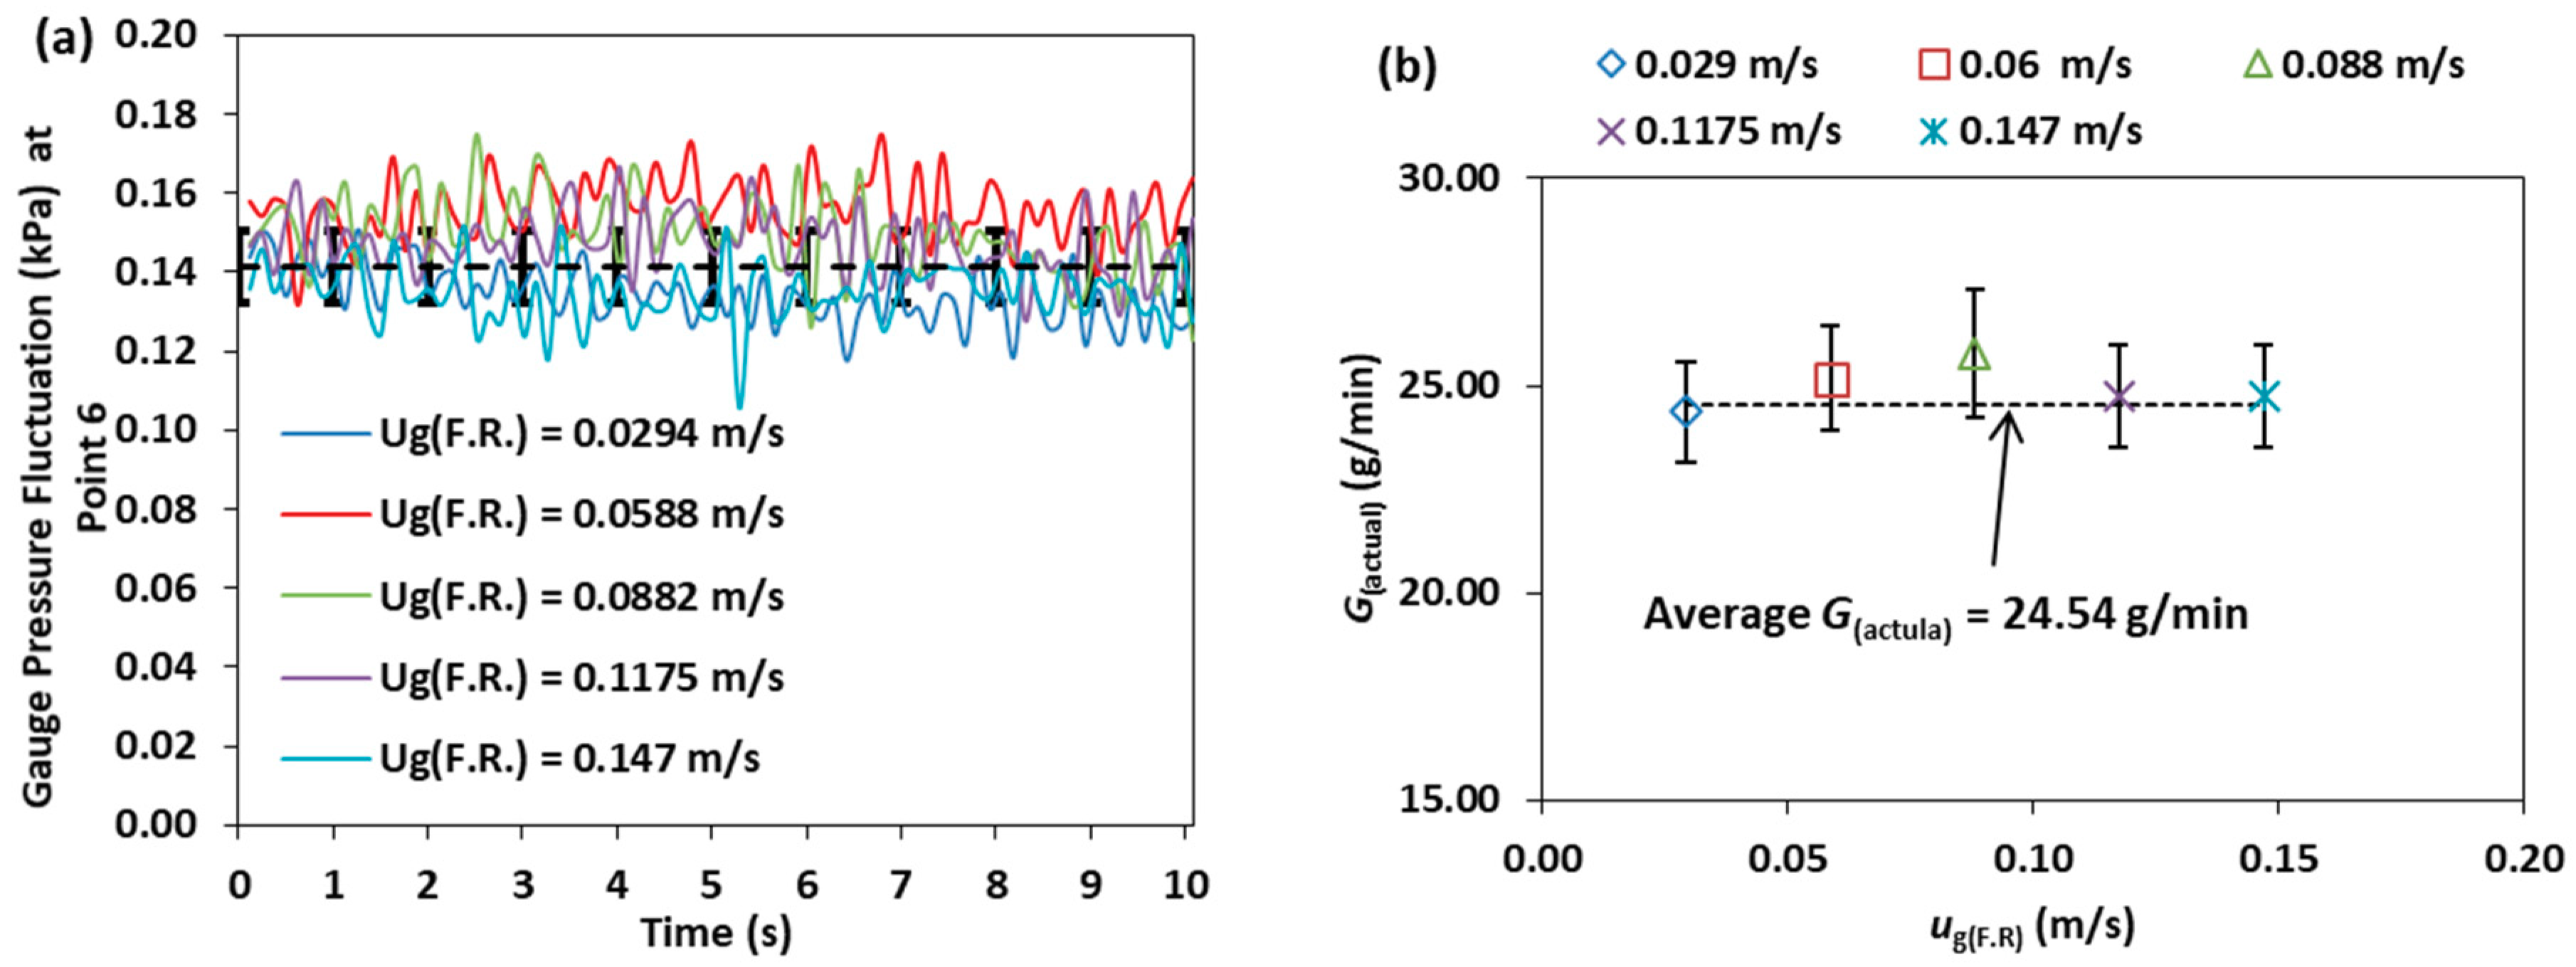
However, varying the fuel reactor fluidization velocity had no effect on the riser pressure fluctuation, as shown in Figure 15a. Additionally, it did not influence the overall solid that circulated in the system (see Figure 15b). At each fuel reactor fluidization velocity, the solid circulation rate measurement was repeated five times. The averaged solid circulation rate of each fuel reactor fluidization velocity is shown in Figure 15b as a symbol, and the overall average for all the measured values is shown as a dotted line. It can be seen that the solid circulation rate was almost around the same value; the majority of the experiments were around 24–25 g/min with ±5% deviation. Therefore, the results indicate that the air reactor and the riser but not the fuel reactor were the main CLC components influencing the global circulation of solids throughout the CLC system.

4. Conclusions

The current work reports on the systematic study of the pressure fluctuation in the riser of a 10 kWth CFM–CLC was conducted using SSS and BMS. Quantitative and qualitative analysis were provided to understand the effect of changing variables such as air/fuel reactor superficial gas velocities, total solids inventory, the particle size and BMS initial composition on the pressure measurements and its fluctuation. It was observed that the air reactor and the riser are the main components driving the global solid circulation rate. Typically, the dominant amplitude of the pressure fluctuation is commonly used as a tool in investigating the hydrodynamics of CFB (i.e., fluidization regimes characteristics). However, even though the information obtained from the amplitude of the pressure fluctuation is valuable, it cannot be useful unless studied systematically by observing the effect of varying the initial operating conditions. Therefore, further analysis was provided in this work to understand the effect of changing important variables on the riser hydrodynamic in term of time series pressure fluctuation analysis, spectral analysis, and comparison between the dominant PSD and SD of the pressure fluctuation.
With the focus on the current studied conditions, the following points were observed:
  • The introduction of a second species into the system influenced the intensity of the pressure fluctuation in the air reactor and the riser. In general, the pressure fluctuation in terms of SD and PSD are higher for BMS when compared to SSS. Increasing the wt.% (i.e., the composition of PE) increases the intensity of the pressure fluctuation and the percentage of the second species in the solid circulation rate.
  • For SSS, the solids holdup and interaction of particles increases as the velocity decreases in the air reactor, which lead to a higher SD of the pressure fluctuation and PSD amplitude. Increasing the riser velocity increases the solids holdup on the riser; however, the SD and PSD amplitude decreases because more solids are transported upwards at a higher velocity and fewer solids fall downwards. Similarly, as the air reactor superficial gas velocity decreases in the BMS, the solids holdup increases of both species, therefore, higher SD of the pressure fluctuation and dominant PSD are observed. However, in the BMS, increasing the riser velocity increases the solids holdup of the larger particles in the riser. Thus, this will lead to increasing the SD and PSD of the dominant amplitude in the riser, which will follow the opposite trend in comparison with SSS.
  • Increasing the total solids inventory for the SSS and BMS increases the pressure fluctuation in the air reactor and the riser of the CLC–CFM, because of increasing the solids holdup at constant superficial gas velocity.
  • As the diameter of the particle increases the pressure fluctuation intensity, the frequency distribution and the PSD amplitude in the air reactor increases. Conversely, it decreases in the riser because the smaller particles are transported at a higher rate into the riser than the larger particles because of the terminal velocity differences.
  • Varying the fuel reactor fluidization velocity at constant air reactor fluidization velocity does not influence the air reactor and riser pressure profile, the intensity of the pressure fluctuation and the solid circulation rate.

Author Contributions

Conceptualization, Y.A.A., B.M. and E.D.; Formal analysis, Y.A.A. and C.L.; Funding acquisition, Y.A.A., B.M. and E.D.; Investigation, Y.A.A.; Methodology, Y.A.A.; Resources, B.M.; Supervision, Z.P., B.M. and E.D.; Validation, Y.A.A.; Visualization, Y.A.A.; Writing—original draft, Y.A.A., Z.P. and Z.A.; Writing—review and editing, Y.A.A., Z.P., Z.A., B.M. and E.D.

Funding

This research and the preparation of the manuscript was funded and supported by the ministry of education (MoE) of the Kingdome of Saudi Arabia, by Moits Pty Ltd., New South Wales Coal Innovation, and the Australian Research Council (LP100200872 and MOC10/1067), Sustainable Energy Technologies centre at KSU for open access fund, respectively.

Acknowledgments

The author extends his appreciation to Deputy of Research and Innovation DRI-MOE at the Kingdom of Saudi Arabia for the Postdoctoral Fellowship Program (PFP), also acknowledge the Deanship of Scientific Research (DSR), King Saud University for their support during this program. Also, the author wishes to acknowledge the facility support by the University of Newcastle (Australia), The authors would as well like to thank Ron Robert and Mr Neil Gardner for their support in setting up the experimental facility and resolving related technical issues.

Conflicts of Interest

The authors declare no conflict of interest. The funders had no role in the design of the study; in the collection, analyses, or interpretation of data; in the writing of the manuscript, or in the decision to publish the results.

Nomenclature

Symbols
ArArchimedes number
dpparticle mean diameter (m)
din(riser) riser inner diameter (mm)
din(A.R.)air reactor inner diameter (mm)
ggravitational acceleration (m/s2)
Gactualactual solid circulation rate (g/min)
hheight (mm)
Nnumber of the sampling points
Pmonitored period (s)
Redp(A.R.)particles Reynolds number in the air reactor (–)
Redp(riser)particles Reynolds number in the riser (–)
umfthe minimum fluidization velocity (m/s)
umf(mixture)the minimum fluidization velocity of binary mixture (m/s)
utparticle terminal velocity (m/s)
ut.Hterminal velocity of the particle with the higher ut in the binary mixture (m/s)
ut.Lterminal velocity of the particle with the lower ut in the binary mixture (m/s)
uginterstitial riser gas velocity (m/s)
ug(riser)riser gas velocity (m/s)
ug(A.R.)air reactor gas velocity (m/s)
ug(F.R.)fuel reactor gas velocity (m/s)
umf(mixture)binary mixture minimum fluidization velocity (m/s)
ttime (s)
Greek letters
X and Yamplitude at the angular frequency
Δhheight between the two pressure ports (m)
ΔPpressure drop between two points (kPa)
ΔPAverageaverage pressure drop between over the entire sample (kPa)
ρffluid density (kg/m3)
ρpsolid or particle density (kg/m3)
ρdensity (kg/m3)
ϕ/ϕs solids holdup /solids holdup (−)
μfluid viscosity (Pa. s)
ωangular frequency (rad/sec)

Abbreviations

BMSBinary-mixture system
CFBCirculating fluidized bed
CFMCold-flow model
CLCChemical looping combustion
GBGlass bead
PEPolyethylene
PSDPower spectrum density (Pa2)
SSSSingle-species system
SDStandard deviation (Pa)
TSITotal solids inventory (kg)

Appendix A

Steady State Operation

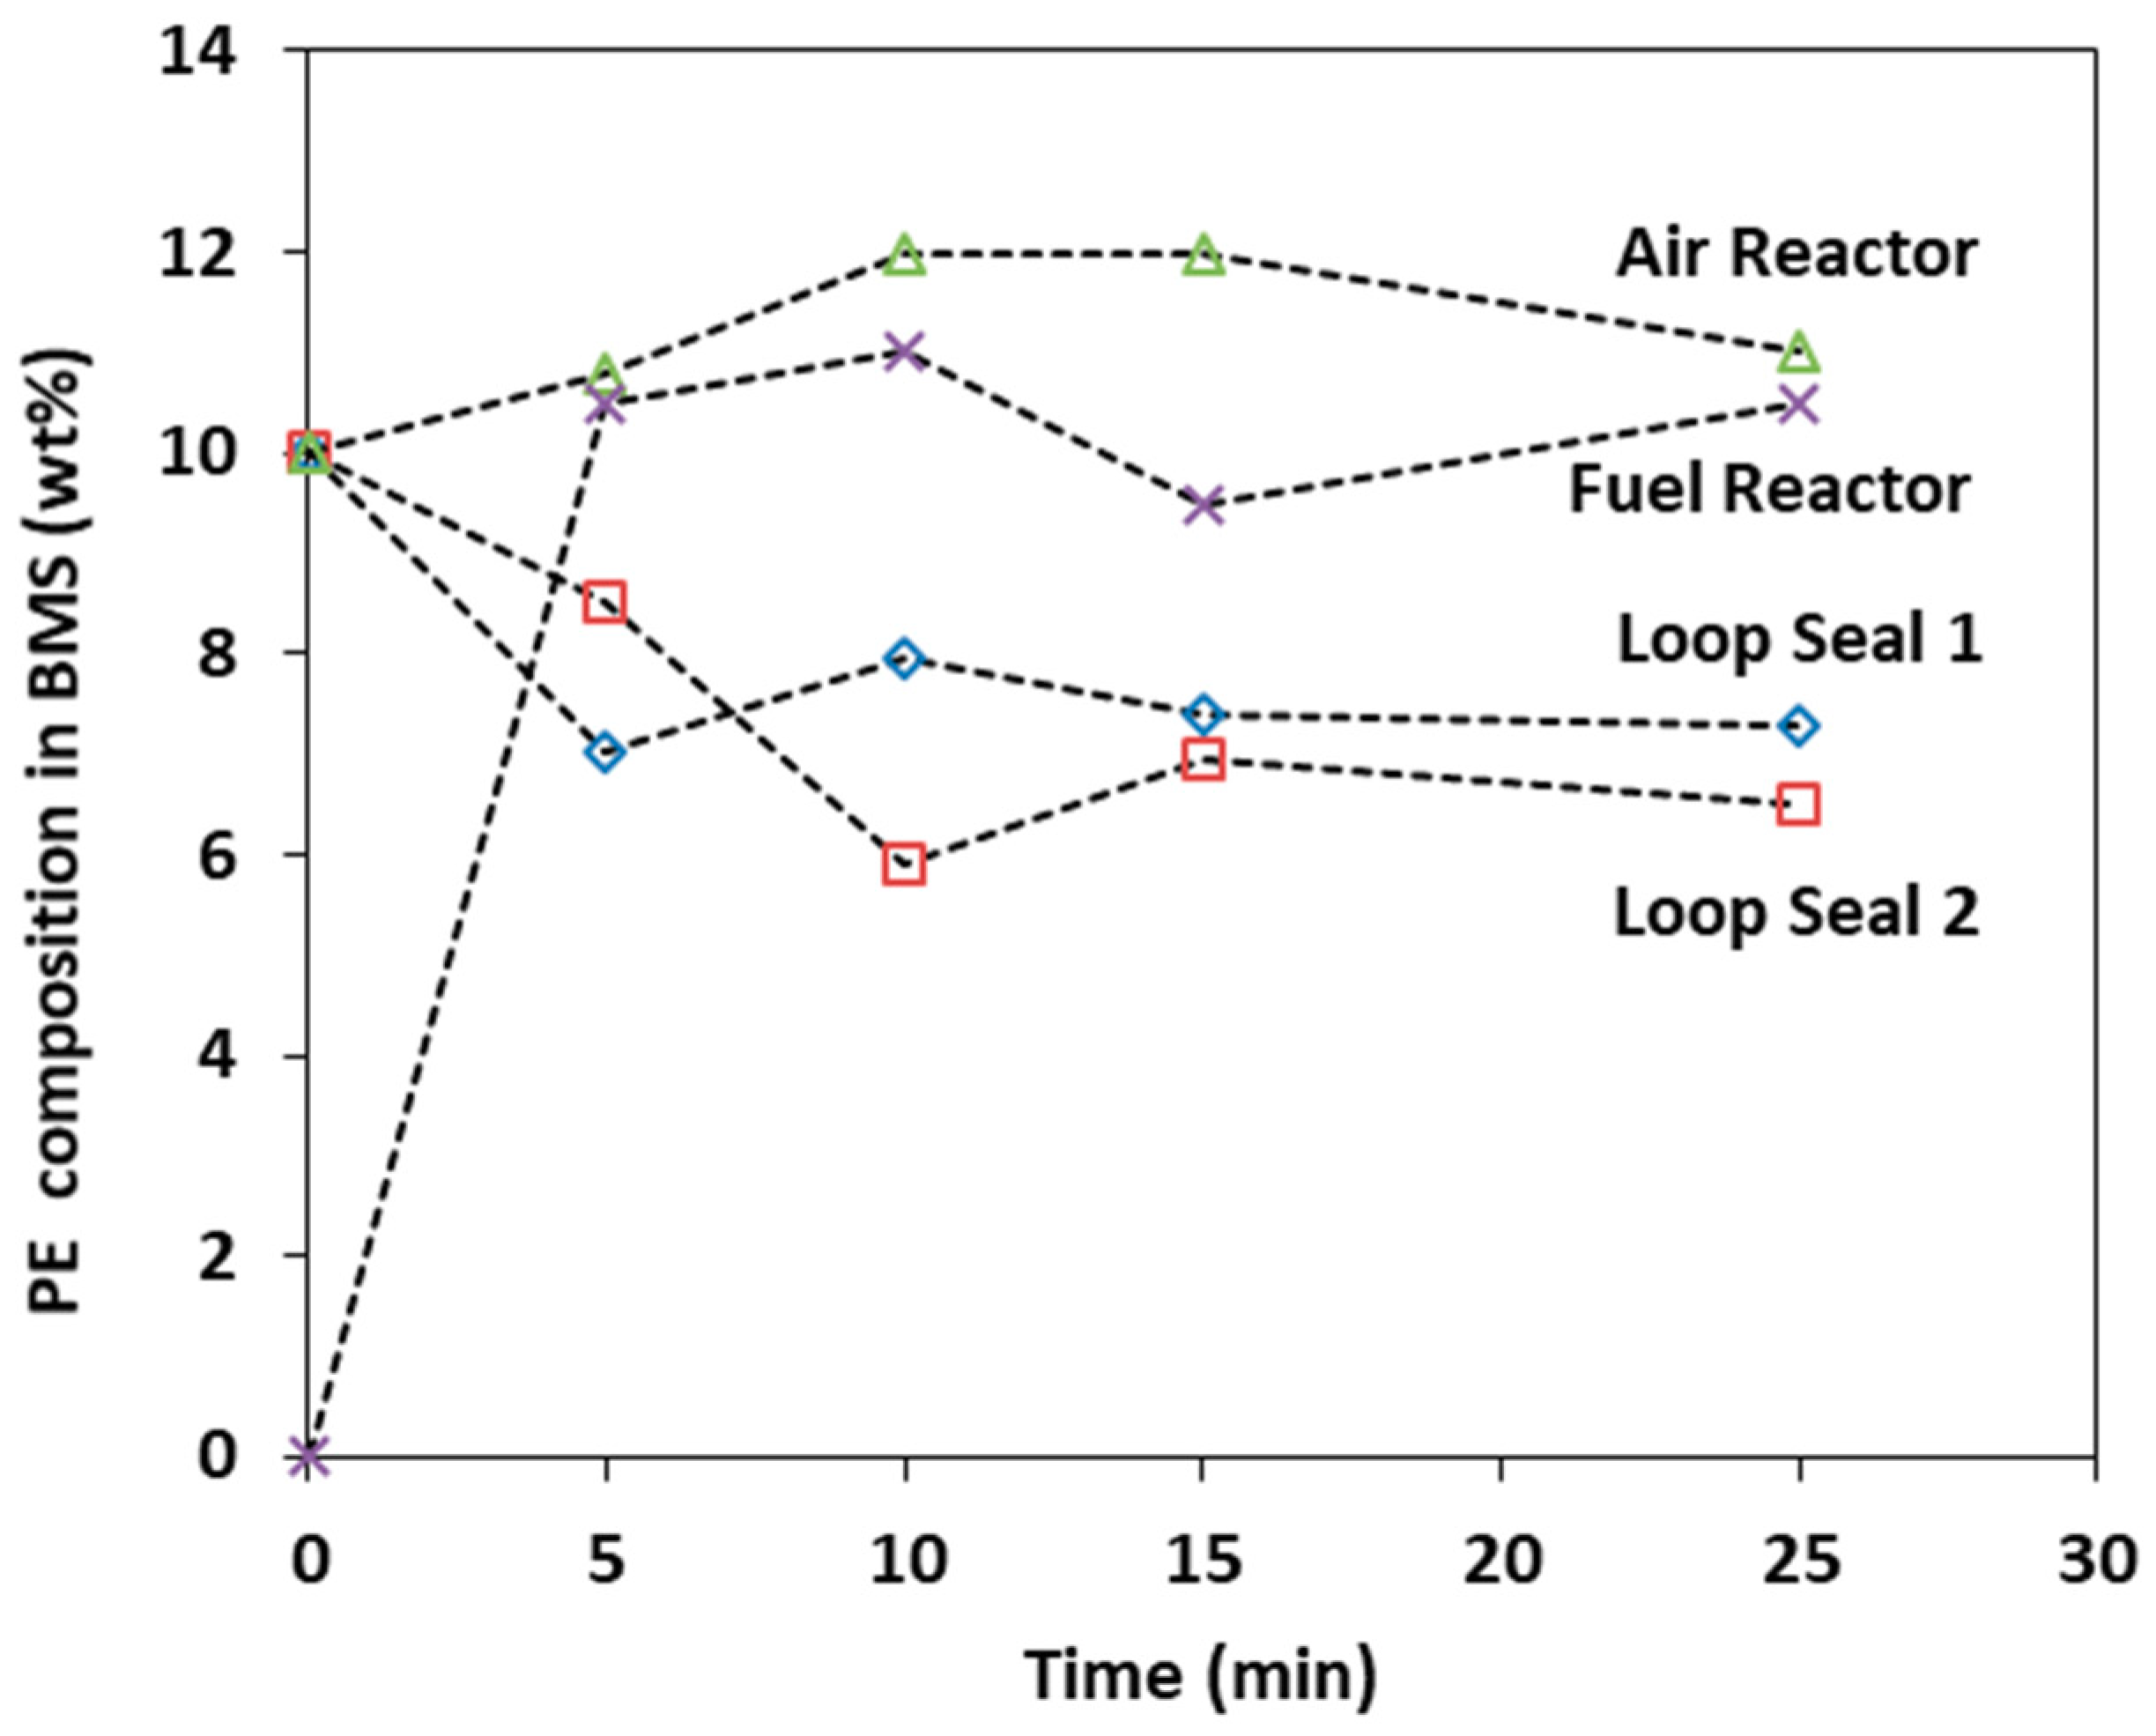
The results reported in this work were obtained under steady state operating conditions. The running time required to reach steady state was determined by observing the variation in the weight percentage of polyethylene species in the binary mixture of polyethylene and glass beads within the air reactor, fuel reactor and the loop seals as a function of time as shown in Figure A1. An explanation and more details were provided in earlier work [23].
Figure A1. Polyethylene (PE) composition evolution in BMS as a function of time, 10 wt.% polyethylene [TSI = 1 kg, dPE = 231 µm, dGB = 116 µm, ug(riser) = 1.6 m/s, ug(F.R.) = 0.088 m/s ] Reproduced with permission from [Alghamdi et al.], [Chemical Engineering journal]; published by [Elsevier], [2013] [23].
Processes 07 00890 g0a1

References

  1. Castilho, G.J.; Cremasco, M.A.; de Martín, L.; Aragón, J.M. Experimental fluid dynamics study in a fluidized bed by deterministic chaos analysis. Part. Sci. Technol. 2011, 29, 179–196. [Google Scholar] [CrossRef]
  2. Sasic, S.; Leckner, B.; Johnsson, F. Characterization of fluid dynamics of fluidized beds by analysis of pressure fluctuations. Prog. Energy Combust. Sci. 2007, 33, 453–496. [Google Scholar] [CrossRef]
  3. Xiaodong, W.; Qing, L.; Duan, W. Effect of manganese doping on oxygen storage capacity of ceria- zirconia mixed oxides. J. Rare Earths 2006, 24, 549–553. [Google Scholar]
  4. Song, H.; Doroodchi, E.; Moghtaderi, B. Redox Characteristics of Fe–Ni/SiO2 Bimetallic Oxygen Carriers in CO under Conditions Pertinent to Chemical Looping Combustion. Energy Fuels 2011, 26, 75–84. [Google Scholar] [CrossRef]
  5. Feng, Y.Q.; Yu, A.B. An analysis of the chaotic motion of particles of different sizes in a gas fluidized bed. Particuology 2008, 6, 549–556. [Google Scholar] [CrossRef]
  6. Noda, K.; Uchida, S.; Makino, T.; Kamo, H. Minimum fluidization velocity of binary mixture of particles with large size ratio. Powder Technol. 1986, 46, 149–154. [Google Scholar] [CrossRef]
  7. Huilina, L.; Yuronga, H.; Gidaspow, D.; Lidana, Y.; Yukuna, Q. Size segregation of binary mixture of solids in bubbling fluidized beds. Powder Technol. 2003, 134, 86–97. [Google Scholar] [CrossRef]
  8. Feng, Y.Q.; Yu, A.B. Effect of bed thickness on the segregation behavior of particle mixtures in a gas fluidized bed. Ind. Eng. Chem. Res. 2010, 49, 3459–3468. [Google Scholar] [CrossRef]
  9. Huilin, L.; Yunhua, Z.; Ding, J.; Gidaspow, D.; Wei, L. Investigation of mixing/segregation of mixture of particles in gas-solid fluidized beds. Chem. Eng. Sci. 2007, 62, 301–317. [Google Scholar] [CrossRef]
  10. Rowe, P.N.; Nienow, A.W.; Agbim, A.J. The mechanisms by which particles segregate in gas fluidised beds-binary systems of near-spherical particles. Trans. Instn. Chem. Eng. 1972, 50, 310–323. [Google Scholar]
  11. Jang, H.T.; Park, T.S.; Cha, W.S. Mixing–segregation phenomena of binary system in a fluidized bed. J. Ind. Eng. Chem. 2010, 16, 390–394. [Google Scholar] [CrossRef]
  12. Gibilaro, L.G.; Rowe, P.N. A model for a segregation gas fliudised bed. Chem. Eng. Sci. 1974, 29, 1403–1412. [Google Scholar] [CrossRef]
  13. Kwant, G.; Prins, W.; Swaaij, W.P.M.v. Particle mixing and separation in a binary solids floating fluidized bed. Powder Technol. 1995, 82, 279–291. [Google Scholar] [CrossRef]
  14. Nienow, A.W.; Rowe, P.N.; Cheung, L.Y.L. A quantitative analysis of the mixing of two segregating powders of different density in a gas-fluidised bed. Powder Technol. 1978, 20, 89–97. [Google Scholar] [CrossRef]
  15. Olivieri, G.; Marzocchella, A.; Salatino, P. Segregation of fluidized binary mixtures of granular solids. Am. Inst. Chem. Eng. J. 2004, 50, 3095–3106. [Google Scholar] [CrossRef]
  16. Garcia, F.; Romero, A.; Villar, J.C.; Bell, a.A. A Study of segregation in a Gas-Solid Fluidized bed: Particles of differnt Density. Powder Technol. 1989, 58, 169–174. [Google Scholar] [CrossRef]
  17. Das, M.; Banerjee, M.; Saha, R.K. Segregation and mixing effects in the riser of a circulating fluidized bed. Powder Technol. 2007, 178, 179–186. [Google Scholar] [CrossRef]
  18. Palappan, K.G.; Sai, P.S.T. Studies on segregation of binary mixture of solids in a continuous fast fluidized bed Part I. Effect of particle density. Chem. Eng. Sci. 2008, 138, 358–366. [Google Scholar] [CrossRef]
  19. Palappan, K.G.; Sai, P.S.T. Studies on segregation of binary mixture of solids in continuous fast fluidized bed Part II. Effect of particle size. Chem. Eng. Sci. 2008, 139, 330–338. [Google Scholar] [CrossRef]
  20. Palappan, K.G.; Sai, P.S.T. Studies on segregation of binary mixture of solids in continuous fast fluidized bed Part III. Quantification of performance of the segregator. Chem. Eng. J. 2008, 145, 100–111. [Google Scholar] [CrossRef]
  21. Hirschberg, B.; Werther, J. Factors affecting solids segregation in circulating fluidized-bed riser. Am. Inst. Chem. Eng. J. 1998, 44, 25–34. [Google Scholar] [CrossRef]
  22. Alghamdi, Y.A.; Peng, Z.B.; Doroodchi, E.; Moghtaderi, B. CFD-DEM Simulation of Mixing and Segregation of Fluidized Binary Mixtures of Particles with Different Sizes and Densities. In Proceedings of the 21st International Conference on Fluidized Bed Combustion (FBC), Naples, Italy, 3–6 June 2012; pp. 1058–1065. [Google Scholar]
  23. Alghamdi, Y.A.; Doroodchi, E.; Moghtaderi, B. Mixing and segregation of binary oxygen carrier mixtures in a cold flow model of a chemical looping combustor. Chem. Eng. J. 2013, 223, 772–784. [Google Scholar] [CrossRef]
  24. Peng, Z.; Doroodchi, E.; Alghamdi, Y.; Moghtaderi, B. Mixing and segregation of solid mixtures in bubbling fluidized beds under conditions pertinent to the fuel reactor of a chemical looping system. Powder Technol. 2013, 235, 823–837. [Google Scholar] [CrossRef]
  25. Bai, D.; Shibuya, E.; Nakagawa, N.; Kato, K. Characterization of gas fluidization regimes using pressure fluctuations. Powder Technol. 1996, 87, 105–111. [Google Scholar] [CrossRef]
  26. Bi, H.T. A critical review of the complex pressure fluctuation phenomenon in gas–solids fluidized beds. Chem. Eng. Sci. 2007, 62, 3473–3493. [Google Scholar] [CrossRef]
  27. Jang, H.; Kim, S.; Cha, W.; Hong, S.; Doh, D. Pressure fluctuation properties in combustion of mixture of anthracite and bituminous coal in a fluidized bed. Korean J. Chem. Eng. 2003, 20, 138–144. [Google Scholar] [CrossRef]
  28. Johnsson, F.; Zijerveld, R.C.; Schouten, J.C.; van den Bleek, C.M.; Leckner, B. Characterization of fluidization regimes by time-series analysis of pressure fluctuations. Int. J. Multiph. Flow. 2000, 26, 663–715. [Google Scholar] [CrossRef]
  29. Van Ommen, J.R.; Sasic, S.; van der Schaaf, J.; Gheorghiu, S.; Johnsson, F.; Coppens, M.-O. Time-series analysis of pressure fluctuations in gas–solid fluidized beds—A review. Int. J. Multiph. Flow 2011, 37, 403–428. [Google Scholar] [CrossRef]
  30. Zhong, W.; Zhang, M. Pressure fluctuation frequency characteristics in a spout-fluid bed by modern ARM power spectrum analysis. Powder Technol. 2005, 152, 52–61. [Google Scholar] [CrossRef]
  31. Leu, L.P.; Wu, C.N. Prediction of pressure fluctuations and minimum fluidization velocity of binary mixtures of geldart group B particles in bubbling fluidized beds. Can. J. Chem. Eng. 2000, 78, 578–585. [Google Scholar] [CrossRef]
  32. Villa Briongos, J.; Aragón, J.M.; Palancar, M.C. Phase space structure and multi-resolution analysis of gas–solid fluidized bed hydrodynamics: Part I The EMD approach. Chem. Eng. Sci. 2006, 61, 6963–6980. [Google Scholar] [CrossRef]
  33. Briongos, J.V.; Aragón, J.M.; Palancar, M.C. Phase space structure and multi-resolution analysis of gas–solid fluidized bed hydrodynamics: Part II: Dynamic analysis. Chem. Eng. Sci. 2007, 62, 2865–2879. [Google Scholar] [CrossRef]
  34. Stringer, J. Is a fluidized bed a chaotic dynamic system? In Proceedings of the 10th International Conference on Fluidized Bed Combustion, San Francisco, CA, USA, 30 April–3 May 1989; pp. 265–272. [Google Scholar]
  35. Alberto, C.; Felipe, S.; Rocha, S.C.S. Time series analysis of pressure Fluctuation in gas-solid fluidized beds. Braz. J. Chem. Eng. Chem. Sci. 2004, 21, 497–507. [Google Scholar]
  36. Saxena, S.C.; Rao, N.S.; Tanjore, V.N. Diagnostic procedures for establishing the quality of fluidization of gas-solid systems. Exp. Therm. Fluid Sci. 1993, 6, 56–73. [Google Scholar] [CrossRef]
  37. Wang, S.; Wang, G.; Jiang, F.; Luo, M.; Li, H. Chemical looping combustion of coke oven gas by using Fe2O3/CuO with MgAl2O4 as oxygen carrier. Energy Environ. Sci. 2010, 3, 1353–1360. [Google Scholar] [CrossRef]
  38. Adánez, J.; Gayán, P.; Celaya, J.; Diego, L.d.; García-Labiano, F.; Abad, A. Chemical looping combustion in a 10 kW prototype using a CuO/Al2O3 oxygen carrier: Effect of operating conditions on methane combustion. Ind. Eng. Chem. Res. 2006, 45, 6075–6080. [Google Scholar] [CrossRef]
  39. Peng, Z.; Doroodchi, E.; Alghamdi, Y.A.; Shah, K.; Luo, C.; Moghtaderi, B. CFD–DEM simulation of solid circulation rate in the cold flow model of chemical looping systems. Chem. Eng. Res. Des. 2015, 95, 262–280. [Google Scholar] [CrossRef]
  40. Moghtaderi, B. Review of the recent chemical looping process developments for novel energy and fuel applications. Energy Fuels 2011, 26, 15–40. [Google Scholar] [CrossRef]
  41. Dahl, I.M.; Bakken, E.; Larring, Y.; Spjelkavik, A.I.; Håkonsen, S.F.; Blom, R. On the development of novel reactor concepts for chemical looping combustion. Energy Procedia 2009, 1513–1519. [Google Scholar] [CrossRef] [Green Version]
  42. Ishida, M.; Zheng, D.; Akehat, T. Evaluation of a chemical looping combustion power generation system by graphic exergy analysis. Energy Int. J. 1987, 12, 147–154. [Google Scholar] [CrossRef]
  43. Pröll, T.; Rupanovits, K.; Kolbitsch, P.; Bolhàr-Nordenkampf, J.; Hofbauer, H. Cold Flow Model Study on a Dual Circulating Fluidized Bed (DCFB) System for Chemical Looping Processes. Chem. Eng. Technol. 2009, 32, 418–424. [Google Scholar] [CrossRef]
  44. Kolbitsch, P.; Bolhàr-Nordenkampf, J.; Proll, T.; Hofbauer, H. Operating experience with chemical looping combustion in a 120 kW dual circulating fluidized bed (DCFB) unit. Int. J. Greenh. Gas Control 2010, 4, 180–185. [Google Scholar] [CrossRef]
  45. Kronberger, B.; Lyngfelt, A.; Löffler, G.; Hofbauer, H. Design and Fluid Dynamic Analysis of a Bench-Scale Combustion System with CO2 Separation−Chemical-Looping Combustion. Ind. Eng. Chem. Res. 2005, 44, 546–556. [Google Scholar] [CrossRef]
  46. Charitos, A.; Hawthorne, C.; Bidwe, A.R.; Korovesis, L.; Schuster, A.; Scheffknecht, G. Hydrodynamic analysis of a 10kWth Calcium looping daul fluidized bed for post-combustion CO2 capture. Powder Technol. 2010, 200, 117–127. [Google Scholar] [CrossRef]
  47. Lyngfelt, A.; Kronberger, B.; Adanez, J.; Morin, J.X.; Hurst, P. Development of oxygen carrier particles for chemical-looping combustion esign and operation of a 10 kW chemical-combustor. In Proceedings of the 7th International Conference on Greenhouse Gas Control Technologies, Vancouver, BC, Canada, 5–9 September 2004. [Google Scholar]
  48. Alghamdi, Y.; Peng, Z.; Zanganeh, J.; Moghtaderi, B.; Doroodchi, E. Hydrodynamics similarities in cold flow model of chemical looping combustors: An experimental study. Powder Technol. 2019, 343, 542–550. [Google Scholar] [CrossRef]
  49. Glicksman, L.R.; Hyre, M.; Woloshun, K. Simplified scaling relationships for fluidized beds. Powder Technol. 1993, 77, 177–199. [Google Scholar] [CrossRef]
  50. Glicksman, L.R.; Hyre, M.R.; Farrell, P.A. Dynamic similarity in fluidization. Int. J. Multiph. Flow 1994, 20 (Suppl. 1), 331–386. [Google Scholar] [CrossRef]
  51. Cho, P.; Mattisson, T.; Lyngfelt, A. Comparison of iron-, nickel-, copper- and manganese-based oxygen carriers for chemical-looping combustion. Fuel 2004, 83, 1215–1225. [Google Scholar] [CrossRef]
  52. Alghamdi, Y.A. Transport characteristics of binary mixture of particles in chemical looping combustion applications. Ph.D. Thesis, University of Newcastle, Callaghan, Australia, April 2016. [Google Scholar]
  53. Alghamdi, Y.; Peng, Z.; Shah, K.; Moghtaderi, B.; Doroodchi, E. Predicting the solid circulation rate in chemical looping combustion systems using pressure drop measurements. Powder Technol. 2015, 286, 572–581. [Google Scholar] [CrossRef]
  54. Alghamdi, Y.A.; Peng, Z.; shah, K.; Moghtaderi, B.; Doroodchi, E. A correlation for predicting solids holdup in the dilute pneumatic conveying flow regime of circulating and interconnected fluidised beds. Powder Technol. 2016, 297, 357–366. [Google Scholar] [CrossRef]
  55. Wen, C.Y.; Yu, Y.H. A Generalized Method for Predicting the Minimum Fluidization Velocity. Am. Inst. Chem. Eng. J. 1966, 12, 610–612. [Google Scholar] [CrossRef]
  56. Haider, A.; Levenspiel, O. Drag coefficient and terminal velocity of spherical and nonspherical particles. Powder Technol. 1989, 58, 63–70. [Google Scholar] [CrossRef]
  57. Cheung, L.; Nienow, A.W.; Rowe, P.N. Minimum fluidisation velocity of a binary mixture of different sized particles. Chem. Eng. Sci. 1974, 29, 1301–1303. [Google Scholar]
Figure 1. Schematic diagram of a 10-kWth cold-flow model–chemical-looping combustion (CFM–CLC) system. (The numbers shown here are the locations of the pressure ports) Reproduced with permission from [Alghamdi et al.], [Powder Technology]; published by [Elsevier], [2019] [48].
Processes 07 00890 g001
Figure 2. Comparison between the experimental pressure drop against fast Fourier transform (FFT) predicted values.
Processes 07 00890 g002
Figure 3. Evolution of the pressure fluctuation and the spectral analysis on the air reactor (a,b) and the riser (c,d) for SSS [dGB = 98 µm, ug(riser) = 1.08 m/s and ug(F.R.) = 0.088 m/s] and BMS [10 wt.% dPE = 275 µm, 90 wt.% dGB = 98 µm, ug(riser) = 1.08 m/s and ug(F.R.) = 0.088 m/s] at total solids inventory (TSI) = 1.5 kg.
Processes 07 00890 g003aProcesses 07 00890 g003b
Figure 4. Comparison of the standard deviation (SD) of the pressure fluctuation and the power spectral density (PSD) analysis on the air reactor (a,b) and the riser (c,d) between SSS [dGB = 98 µm] and BMS [10 wt.% dPE = 231 µm (case 1–3) and 275 µm (case 4–6), 90 wt.% dGB = 98 µm] at ug(A.R.) = 0.27, ug(riser) = 1.08 m/s and ug(F.R.) = 0.088 m/s.
Processes 07 00890 g004aProcesses 07 00890 g004b
Figure 5. Evolution of the pressure fluctuation and the spectral analysis at the air reactor between points 3–4: (a,b) of SSS [dGB = 98 μm and TSI = 1 kg] and (c,d) of BMS [10 wt.% of dPE = 231 µm, 90 wt.% of dGB = 116 µm, TSI = 2 kg] as a function of ug(A.R.) = 0.27 m/s, 0.37 m/s and 0.42 m/s, and ug(F.R.) = 0.088 m/s.
Processes 07 00890 g005aProcesses 07 00890 g005b
Figure 6. Evolution of the pressure fluctuation and the spectral analysis at the riser between points 6–9: (a,b) of SSS [dGB = 98 μm and TSI = 1 kg] and (c,d) of BMS [10 wt.% of dPE = 231 µm, 90 wt.% of dGB = 116 µm, TSI = 2 kg] as a function of ug(riser) = 1.08 m/s, 1.50 m/s and 1.68 m/s, and ug(F.R.) = 0.088 m/s.
Processes 07 00890 g006
Figure 7. Comparison of the SD of the pressure fluctuation and the PSD analysis on the air reactor and the riser as a function of of ug(A.R.)/ut.H and ug(riser)/ut.H (a,b) SSS [dGB = 98 μm and TSI = 1 kg] and (c,d) BMS [10 wt.% of dPE = 231 µm, 90 wt.% of dGB = 116 µm, TSI = 2 kg].
Processes 07 00890 g007
Figure 8. Comparison of the SD of the pressure fluctuation and the PSD analysis in the air reactor and the riser as a function of TSI: (a,b) SSS [dGB = 98 µm] (c,d) BMS cases 1–3 [10 wt.% of dPE = 231 µm, 90 wt.% of dGB = 98 µm] at ug(A.R.) = 0.27 m/s and ug(riser) = 1.08 m/s ug(F.R.) = 0.088 m/s.
Processes 07 00890 g008aProcesses 07 00890 g008b
Figure 9. Evolution of the pressure fluctuation and the spectral analysis single species systems with 2 kg of dGB = 98 and 138 μm with ug(F.R.) = 0.088 m/s: (a,b) at ug(A.R.) = 0.27 m/s points 3–4, (c) and (d) at ug(riser) = 1.08 m/s points 6–9.
Processes 07 00890 g009aProcesses 07 00890 g009b
Figure 10. Comparison of the SD of the pressure fluctuation and the PSD analysis on the air reactor (a,b) and the riser (c,d) as a function of particle size.
Processes 07 00890 g010
Figure 11. Evolution of the pressure fluctuation and the spectral analysis of binary mixture system (BMS) on the air reactor (a,b) and the riser (c,d) as a function of particle size [10 wt.% of dPE = 231 and 275 µm, 90 wt.% of dGB = 98 µm, TSI = 1.5 kg, ug(riser) = 1.08 m/s, and ug(F.R.) = 0.088 m/s].
Processes 07 00890 g011
Figure 12. Comparison of the SD of the pressure fluctuation and the PSD analysis on the air reactor (a,b) and the riser (c,d) as a function of particle size [10 wt.% of dPE = 231 and 275 µm, 90 wt.% of dGB = 98 µm, TSI = 1, 1.5 and 2 kg, ug(riser) = 1.08 m/s, and ug(F.R.) = 0.088 m/s].
Processes 07 00890 g012
Figure 13. Comparison of the SD of the pressure fluctuation and the PSD analysis (a) on the air reactor and (b) the riser as a function of composition [dPE = 231 µm, dGB = 138 µm, ug(riser) = 1.68 m/s and ug(F.R.) = 0.088 m/s].
Processes 07 00890 g013
Figure 14. CFM–CLC pressure profile for BMS [10 wt.% dPE = 328 µm, 90 wt.% dGB = 138 µm, ug(riser) = 1.08 m/s and ug(F.R.) = 0.0294–0.147 m/s].
Processes 07 00890 g014
Figure 15. (a) Riser pressure fluctuation at point 6 against the fluidization velocity in the fuel reactor, and (b) the solid circulation rate in the CLC system as a function of ug(F.R.) at constant ug(A.R).
Processes 07 00890 g015
Table 1. Particles’ physical properties.
dp, min (μm)dp, max (μm)dp, mean (μm)ρp (kg/m3)umfa (m/s)utb (m/s)Particle Type
901069824620.00850.58GB
10612511624620.0120.75GB
12515013824620.0160.99GB
2122502319390.0180.89PE
2503002759390.0251.1PE
3003553289390.0361.35PE
GB: glass beads, PE: polyethylene, a calculated using Wen and Yu equation [55], b calculated using Haider and Levenspiel [56].
Table 2. Operating conditions for the single-species system (SSS) experimental cases for 10-kWth CFM–CLC.
System TypeTSI (kg)GB dp (µm)ug(A.R.) (m/s)ug(A.R.)/utug(riser) (m/s)ug(riser)/utug(F.R.) (m/s)
SSS1980.270.461.081.880.088
SSS1980.370.641.52.560.088
SSS1980.420.721.682.900.088
SSS1.5980.270.461.081.880.088
SSS1.5980.370.641.52.560.088
SSS1.5980.420.721.682.900.088
SSS2980.270.461.081.880.088
SSS2980.370.641.52.560.088
SSS2980.420.721.682.900.088
SSS1.751380.270.271.081.080.088
SSS1.751380.370.371.51.520.088
SSS1.751380.420.421.681.700.088
SSS21380.270.271.081.080.088
SSS21380.370.371.51.520.088
SSS21380.420.421.681.700.088
SSS2.251380.270.271.081.080.088
SSS2.251380.370.371.51.520.088
SSS2.251380.420.421.681.700.088
Table 3. Operating conditions for the binary-mixtures system (BMS) experimental cases for 10-kWth CFM–CLC.
System TypeCase No.TSI (kg)PE dp (µm)GB dp (µm)dp(PE)/dp(GB)PE Composition (wt%)GB Composition (wt%)ut.H/ut.Lug(A.R.) (m/s)ug(A.R.)/ut.Hug(riser) (m/s)u(riser.)/ut.Humf(mixture) (m/s) aug(F.R.) (m/s)
BMS11231982.410901.60.270.301.081.220.007690.088
BMS21.5231982.410901.60.270.301.081.220.007690.088
BMS32231982.410901.60.270.301.081.220.007690.088
BMS41275982.8109020.270.251.080.980.007720.088
BMS51.5275982.8109020.270.251.080.980.007720.088
BMS62275982.8109020.270.251.080.980.007720.088
BMS722311381.75951.10.420.421.681.700.01500.088
BMS822311381.710901.10.420.421.681.700.01500.088
BMS922311381.720801.10.420.421.681.700.01500.088
BMS102231116210901.20.270.301.081.200.01100.088
BMS112231116210901.20.370.421.51.700.01100.088
BMS122231116210901.20.420.471.681.890.01100.088
BMS1323281382.410901.40.270.201.080.800.015120.088
a Calculated using Cheung et al. equation [57].
Table 4. Summary of the effect of changing the operating variables on SSS and BMS.
Effect of IncreasingSSSBMS
Air ReactorRiserAir ReactorRiser
SDPSDSDPSDSDPSDSDPSD
ug(A.R.) and ug(riser)
TSI
dp
BMS Wt.% (5, 10, 20%)----