Abstract
The hybrid renewable energy system is a promising and significant technology for clean and sustainable island power supply. Among the abundant ocean energy sources, tidal current energy appears to be very valuable due to its excellent predictability and stability, particularly compared with the intermittent wind and solar energy. In this paper, an island hybrid energy microgrid composed of photovoltaic, wind, tidal current, battery and diesel is constructed according to the actual energy sources. A sizing optimization method based on improved multi-objective grey wolf optimizer (IMOGWO) is presented to optimize the hybrid energy system. The proposed method is applied to determine the optimal system size, which is a multi-objective problem including the minimization of annualized cost of system (CACS) and deficiency of power supply probability (DPSP). MATLAB software is utilized to program and simulate the hybrid energy system. Optimization results confirm that IMOGWO is feasible to optimally size the system, and the energy management strategy effectively matches the requirements of system operation. Furthermore, comparison of hybrid systems with and without tidal current turbines is undertaken to confirm that the utilization of tidal current turbines can contribute to enhancing system reliability and reducing system investment, especially in areas with abundant tidal energy sources.
1. Introduction
Ocean contains inexhaustible clean energy and abundant natural resources, such as oil, natural gas, minerals, biological resources, etc., which will be an important guarantee for human survival and sustainable development in future. Islands are central platforms for exploring and utilizing these marine resources. At present, island power supply mainly depends on diesel generators or the connection with mainland power grid. High cost, poor reliability, environmental pollution and other adverse factors greatly limit the further development of island microgrid []. Hybrid renewable energy system is a promising technology for clean and sustainable island power supply. Government agencies and research institutes around the world have carried out a series of studies, demonstrations and experiments on sizing optimization of island hybrid energy system. Ireland has built a 675 kW wind farm on the Aran Islands, which accounts for 39% of the island’s annual electricity demand []. Eco-grid EU project has been built and studied on the Danish island Bornholm, including a hybrid wind, biogas, photovoltaic, cogeneration, diesel, fuel cell and storage bank energy system [,]. Several representative island microgrids have been built in Australia to study the optimal system size and economic benefits [,]. France, China, Indonesia, the Philippines, and other countries have also carried out researches on sizing optimization and system construction of island hybrid energy microgrid [,,,,,].
Hybrid energy systems present lower costs and higher reliability than systems which contains only one energy source. Nevertheless, the proper sizing of system components is a key factor for a system’s techno-economic feasibility []. Due to the randomness of renewable resources and load, sizing optimization of island hybrid energy system is a multi-objective, nonlinear and complex problem. Review literatures [,] summarized the multi-objective sizing optimization methods of hybrid energy microgrid. Effective optimization techniques have been proposed to solve this kind of problem, among which commercial computer tools and intelligent optimization algorithms are most commonly utilized. Xiyuan Ma et al. proposed an improved bacterial foraging algorithm (BFA) to solve the sizing optimization problem for minimizing the total investment cost of islanded microgrid []. Abo-Elyousr et al. used the ant colony algorithm (ACO) to optimize sizing of distributed generation system, and analyzed economy, reliability and environmental influence of the system []. Duan Shuai et al. applied the differential evolution algorithm (DE) to optimize a hybrid energy system, aiming at minimizing the microgrid operating cost []. Hamanah, W.M. et al. presented a new method to optimize sizing of a hybrid PV, wind, battery and diesel system by using the lightning search algorithm (LSA) []. Many other intelligent algorithms [,,,] and HOMER software [] are also utilized to solve complex sizing optimization problems.
The existing research on sizing optimization and calculation method of island hybrid energy system has some limitations. Firstly, according to the reviews on development and research status of island power systems, most island microgrid projects that have been built or are under construction are connected to mainland power grid [], the reliability of energy supply is always guaranteed, optimization results are not applicable to the island situation. Secondly, single objective optimization mainly utilized in researches has obviously limitations considering the contradiction between different optimization objectives. There are some weaknesses such as narrow applicability, complex coding, premature convergence when using conventional intelligent algorithms or HOMER software to solve complex problems []. Thirdly, most studies focused on wind and solar energy [,], while ignoring the abundant marine energies, such as tidal current energy. Tidal current energy is one of the emerging technologies of marine renewable energies []. The exploitable tidal current energy with present technologies is estimated about 75 GW on earth and 13.9 GW in China []. Compared with other marine renewable energies, tidal current energy has obvious advantages in resource utilization because of its high predictability, high energy density and minimal environmental influence []. Review literature [] summarizes the current research of tidal current energy projects, which reflect the nowadays industrial level and the promising developments of tidal current turbine technologies. The first 500 kW OpenHydro turbine was tested near Brest, France and in operation in 2014. The 1.2 MW SeaGen S system was installed in Strangford Lough in Northern Ireland and had generated 8 GWh electricity to the grid by 2015. The SeaGen F system in Fundy Bay produced clean and reliable energy to supply up to 1800 households. Different types of large tidal current turbines such as DCNS OpenHydro, Atlantis AR1000, SeaGen S (2 MW), and Sabella D10, have been produced and tested in recent years. The majority of these turbine technologies has now achieved megawatt-level power capacity and will be utilized to supply electricity to coastal areas or remote islands in the coming years. At present, the cost of tidal current energy is slightly higher than offshore wind energy. It can be predicted that with the progress of equipment, policy oriented large-scale development, the cost of tidal current energy is able to achieve an equivalent price to offshore wind energy [].
In this paper, an island hybrid energy system is established composed of photovoltaic, wind, tidal current, battery and diesel, considering the actual natural energy sources of the studied location. Annualized cost and power supply deficiency are determined as objectives to optimize the size of the system. An improved multi-objective grey wolf optimizer (IMOGWO) is proposed to solve the sizing optimization problem. The simulation results confirm the feasibility and effectiveness of the optimization method. Moreover, comparison of a microgrid with and without tidal current turbines is analyzed to confirm that the utilization of tidal current energy can contribute to enhancing system reliability and reducing system investment.
This paper is organized as follows. Section 2 describes the mathematical model of each component of the hybrid energy system. The energy management strategy, description of objective functions and constraints are presented in Section 3. Section 4 is dedicated to the improvement of multi-objective grey wolf optimizer. The simulation results are discussed in Section 5 to illustrate the performance of the proposed method, and the conclusion is presented in the last section.
2. Models of the Hybrid System Components
The proposed island hybrid energy system is illustrated in Figure 1. It contains photovoltaic panels, wind turbines, tidal current turbines as renewable generation sources, battery storage system and diesel generators as indemnificatory generation source, inverters, controllers and other indispensable devices. The detailed modeling of the system components is presented hereafter.
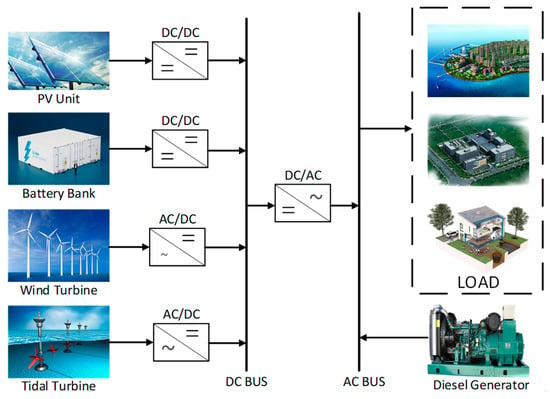
Figure 1.
Island hybrid energy system configuration.
2.1. Photovoltaic Array Model
Photovoltaic array (PV) model is discussed in many literatures [,]. The output of photovoltaic panel depends on the solar irradiation energy received by the module plane [], which depends on the local climate conditions, installation method, module type, etc. []. The output of PV can be estimated by rated power, actual irradiance and ambient temperature as below []:
where is the output power of the PV module, is the rated power of the PV module at standard test condition, is the real solar irradiance at the tilted surface of PV panels (), is the standard solar irradiance (), is the standard temperature (), is the temperature coefficient, defined by is the ambient temperature .
2.2. Wind Turbine Model
The output model of wind turbine (WT) is a piecewise function, which is determined by different wind speed intervals []. When the cut-in speed is reached, wind turbine starts to rotate and generate electricity. The output of wind turbine is the product of wind density, blade swept area and efficiency coefficient. When the rated speed is reached, the wind turbine outputs the rated power. When the cut-out speed is reached, the turbine will be terminated for self-protection []. The model of power output generated by the wind turbine is given by Equation (2) [,].
where is the wind speed, , and are the cut-in wind speed, rated wind speed and cut-out wind speed, is the rated electrical power, is the wind speed coefficient. When the wind speed is between and , can be approximately denoted as a linear function of wind speed as shown in the following equation.
2.3. Tidal Current Turbine Model
The astronomical nature of tides is determined by the gravitational interaction between the earth, the moon and the sun. There are two flood tides and two ebb tides every day. The spring tide and neap tide appear periodically [,]. The strength of tides varies according to the distance, relative position and angle between the moon, the sun and the earth. The power generated by a tidal current turbine (TCT) can be estimated by the following equation [,].
where is the power coefficient of TCT, which is essentially the ratio of the mechanical power obtained by TCT, taking into account the conversion efficiency. is the density of seawater, is the cross-sectional area of TCT, is the tidal current velocity. The periodic variation of tidal current velocity can be simplified as the following equation [].
where is the period between spring tide and neap tide, is the period of tidal current, is the average velocity of tidal current calculated by , and are the maximum velocity of spring tide and neap tide, is the wave coefficient of tidal current, calculated by
2.4. Battery Storage Model
Battery storage system (BSS) is a very important part of hybrid energy system, which can smooth the fluctuation of distributed generation, improve the schedulability and reliability of the system []. BSS is the most flexible, reliable and responsive system among various storage technologies [], In this paper, lithium-ion battery is selected as energy storage element because of its high cycle efficiency, low cost and long cycle life []. This means less maintenance and replacement costs []. The capacity of the battery storage system can be expressed by the following equation [].
where is the desired autonomy day, which means the maximum number of days that the battery can provide continuous energy without charging, is the daily power demand, is the battery efficiency, is the conversion efficiency of the inverter, is the maximum allowable depth of discharge.
SOC is the battery state of charge, which is usually used to indicate the remaining capacity of the battery. The SOC(t) at time (t) is given by []:
where and are the self-discharge rate and efficiency, is the difference between total generation power and the demand power considering the efficiency factor [], given by:
2.5. Diesel Generator Model
Diesel generator (DG) is used as the backup power supply to make up for the power shortage of the system. Diesel generator should be operated at a suitable power level, otherwise its economy and lifespan will be influenced []. DG is modelled based on the fuel consumption and efficiency which can be simplified as the following equation [].
where is the DG’s fuel consumption, is DG’s actual output power, is DG’s rated output power, and are and , respectively. DG’s fuel cost is given by the following equation.
where is fuel cost per liter.
3. Objective Functions and Constrains
3.1. Energy Management Strategy
Energy management of hybrid energy system is the basic guarantee for economical operation. The criteria for the establishment of island hybrid energy microgrid include maximum utilization of renewable energy, reliable power supply, reduction of fuel consumption and pollutant emissions, etc. Island electric power construction should be based on the principle of sustainable development and clean energy. DGs should be used as backup components to supply power to the important loads of the system in extreme cases. Therefore, the capacity of DGs is limited in the variable constraints to maximize renewable energy generation. The energy management strategy proposed in this paper is as follows.
- Renewable energy power generation is enough to match the load demand. If the BSS is not fully charged at this time, the excess power generation will charge the BSS.
- Renewable energy power generation is enough to match the load demand. If the BSS is fully charged at this time, the renewable energy output will be reduced to match the load.
- Renewable energy power generation is not enough to match the load demand. If the BSS is available at this time, the BSS will discharge to match the load demand.
- Renewable energy power generation and BSS are not enough to match the load demand. DGs will be operated to supplement generation.
3.2. Objective Functions
The major sizing optimization objective of hybrid energy system is to guarantee reliable power supply at minimum cost. It contains multiple conflicting objectives, in which system investment and reliability are most commonly used. In this paper, annualized cost of system (CACS) and deficiency of power supply probability (DPSP) are selected as objective functions.
3.2.1. Annualized Cost of System
To evaluate the annualized cost of system (CACS), the investment cost (procurement and installation cost), replacement cost, operation and maintenance cost, fuel cost of each component should be considered comprehensively. The CACS of hybrid energy system is formulated as follows [,]:
where is the number of component , is the number of component types, is the annualized capital cost, is the annualized replacement cost, is the annualized operation and maintenance cost, is the annualized fuel cost. and are calculated by the following equations.
where is the capital recovery factor and is the sinking fund factor calculated by Equations (15) and (16), respectively.
where is the discount rate, which is calculated as 6.7% according to the interest rate of the PBOC, is the lifespan of the project, which is 20 years in this paper, is the lifespan of the component.
3.2.2. Deficiency of Power Supply Probability
As a system reliability index, deficiency of power supply probability (DPSP) indicates the extent to which power generation fails to match the load demand. DPSP varies from 0% to 100%. 0% means that the load demand is completely met []. DPSP is formulated as follows:
where is the hourly load demand, is the hourly system output.
3.2.3. Optimization Objective Function
Based on the above discussion, the optimization objective function of hybrid energy microgrid based on minimum CACS and minimum DPSP is as follows:
3.3. Constraints
The objectives of sizing optimization are subjected to a number of constraints including supply-demand balance, generation unit boundaries and the BSS constraints. These constraints are explained in detail below.
3.3.1. Variable Constraints
The system variables, i.e., the number of system components (PV, WT, TCT, DG, BSS), should be defined with reasonable maximum value, expressed as:
3.3.2. Generation Unit Boundaries
The output of each generation unit at any time shall be within the range of minimum and maximum values, expressed as:
3.3.3. Supply-Demand Balance
The total power provided by the microgrid system should always match the load demand, expressed as:
3.3.4. BSS Constraints
The SOC of the BBS remains between the minimum and maximum values, expressed as:
4. Improved Multi-Objective Grey Wolf Optimizer
The sizing optimization of a hybrid energy system is a typical multi-objective optimization problem which contains mutually exclusive optimization objectives, multi variables and constraints. Multi-objective optimization can be formulated as a maximization or minimization problem. The solutions in a multi-objective space cannot be compared by the relational operators due to multi-criterion comparison metrics. In this case, a solution is better than (dominates) another solution if and only if it shows better or equal objective value on all of the objectives and provides a better value in at least one of the objective functions. The solution set of multi-objective optimization problems can be represented by Pareto optimal front, which is a set containing the corresponding objective values of Pareto optimal solutions []. In order to obtain the Pareto optimal front of the multi-objective sizing optimization problems, an improved multi-objective grey wolf optimizer (IMOGWO) is proposed.
4.1. Multi-Objective Grey Wolf Optimizer
Grey wolf optimizer (GWO), a new swarm intelligence algorithm introduced by Mirjalili et al. [], is a powerful meta-heuristic algorithm, which has competitiveness in terms of solution accuracy, minimum computational effort, and aversion of premature convergence. According to the social grade of grey wolf colony, GWO divides the wolf pack into four pyramid population hierarchies, namely, α, β, δ, and ω. The global optimization is realized by imitating the predatory behaviors of grey wolves such as searching, tracking, encircling, chasing and attacking. In the GWO, the position of a wolf is the vector of system variables, and the prey corresponds to the optimization objective function. In each iteration, the location of wolf pack (set of the variables) is updated. The algorithm simulates the hunting process by constantly updating the location of wolf pack to obtain the Pareto optimal front (non-dominated solutions set). The optimization process is mainly guided by the best three solutions (i.e., α, β, and δ). The mathematical model of predatory behaviors is expressed as follows:
where is number of iterations, and are the coefficient vectors; is the position vector of the prey, is the position vector of the wolf, is the total number of iterations allowed for the optimization, and are the random vector in .
Figure 2 illustrates the location updating mechanism of grey wolf. The mathematical model can be expressed as follows:
where , , are the positions of , , , represents the position of the wolf, , , respectively represent the distance between the current candidate and the three optimal wolves.
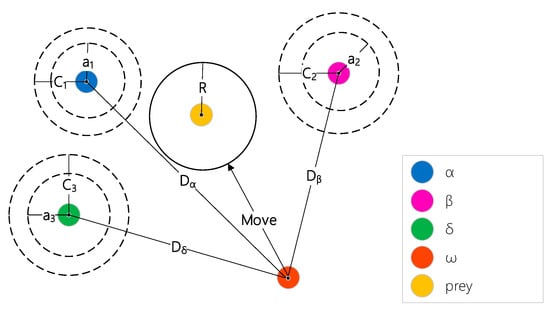
Figure 2.
The location updating mechanism of grey wolf optimizer (GWO).
In order to solve the multi-objective optimization problem, Mirjalili developed a multi-objective grey wolf optimizer (MOGWO) by integrating two new components into GWO algorithm []. The first component is the external archive, which stores the non-dominated Pareto optimal solutions obtained so far. The second component is the leader selection mechanism, which selects the appropriate leader from all the non-dominated optimal solutions obtained in the external archive by roulette.
4.2. Improvement of MOGWO
In this paper, the standard MOGWO algorithm is improved in three aspects, including the improvement of convergence factor, the differential mechanism based on the Differential Evolution Algorithm (DE) and elite selection mechanism.
4.2.1. Improvement of Convergence Factor
According to Equations (26) and (28), convergence factor a is linearly reduced from 2 to 0 during the iteration, with no pertinence in the early and late stages of the iterative process. The convergence factor is improved as follows:
Figure 3 shows the comparison between nonlinear and linear convergence of . The nonlinear convergence factor converges slowly in the early stage, which can enhance the global search to ensure the diversity of the population, and converges fast in the later stage, which can enhance the local exploration to improve the solution efficiency.
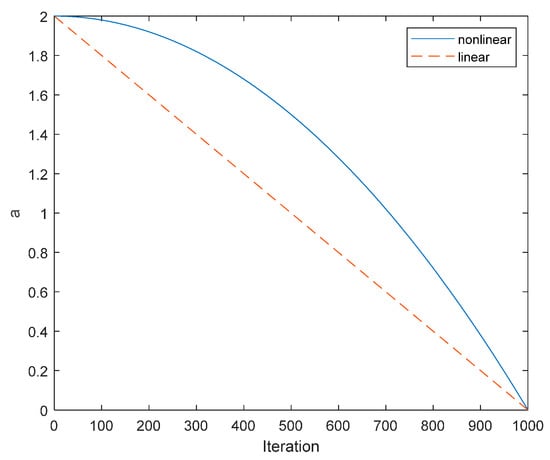
Figure 3.
Nonlinear versus linear convergence comparison.
4.2.2. Differential Mechanism Based on DE
In this paper, a differential strategy is introduced to update the position of the new individual in each iteration referenced DE algorithm [], instead of the equalization update method in Equation (31). The core idea of the improvement is to add the perturbation from the other two leaders when wolf ω approaches one of the leader wolves α, β, δ, so as to avoid falling into local optimum. The improved position update process is expressed as follows:
where is the dominance coefficient of difference mechanism, generally valued around 1, is the perturbation coefficient of differential mechanism, which is inversely adjusted according to the difference between individuals.
4.2.3. Elite Selection Mechanism
The elite selection mechanism is to ensure the individual superiority in the population. Four candidate solutions are obtained by Equations (33)–(36), and the non-dominated solution is selected to calculate the weighted sum of the objective function. The optimal solution with the minimum value of the weighted sum is selected as the individual final update position.
4.3. Verification of IMOGWO
Four standard multi-objective test problems proposed in CEC 2009 [] are selected as test functions to verify the performance of IMOGWO. The benchmark problems are provided in Table 1. These test problems are considered as the most challenging test problems that provide different multi-objective search spaces with different Pareto optimal fronts. In order to evaluate the performance of the improved algorithm, the IMOGWO is compared to the MOGWO and the well-known algorithm Multi-Objective Particle Swarm Optimization (MOPSO) with the performance index of Inverted Generational Distance (IGD). IGD can reflect the convergence and coverage of the algorithm. The smaller value of IGD indicates that the calculation result of the algorithm is closer to the real Pareto front. The calculation formula of this index is as follows.
where is the number of true Pareto optimal solutions and indicates the Euclidean distance between the true Pareto optimal solution and the closest obtained Pareto optimal solutions in the reference set.

Table 1.
Standard multi-objective test problems.
According to the test requirements of CEC 2009, the standard multi-objective test functions were independently calculated by IMOGWO, MOGWO and MOPSO 30 times. The maximal number of the solutions in the approximate set produced by each algorithm was set to 100. The averages of IGD were taken as the performance indicators of the evaluation algorithm in order to restrict the influence of random effects. The simulation results obtained by three optimization algorithms are shown in Figure 4.
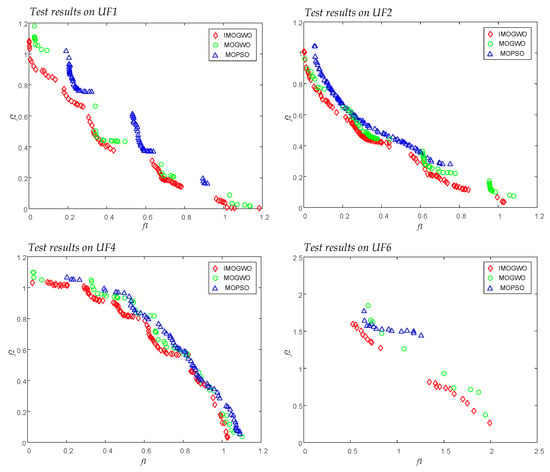
Figure 4.
Obtained Pareto optimal solutions by improved multi-objective grey wolf optimizer (IMOGWO), MOGWO and MOPSO.
Obviously, the improved IMOGWO shows better convergence and coverage than standard MOGWO and MOPSO. The Pareto optimal solutions of IMOGWO are closer to the true Pareto optimal front and highly distributed along both objectives. Although there are discontinuities on the Pareto optimal front of IMOGWO compared to that of MOPSO, the coverage of the whole front is broader on all the test functions, especially on UF1 and UF6. The solution sets provide superior convergence and uniform distribution, due to the improvement of convergence factor, position update process and the elite selection. The IGD results are listed in Table 2.

Table 2.
Test results for Inverted Generational Distance (IGD).
The convergence factor is linearly reduced in the standard MOGWO. The fast convergence speed in the early stage of iteration will lead to small search range and insufficient population diversity. The slow convergence speed in the late iteration will lead to the low efficiency of the algorithm. The improved nonlinear convergence factor adjusts the convergence weight of the population iteration, so that different iteration intervals have different pertinence. IMOGWO balances the relationship between local exploitation and global exploration well, which ensures the diversity of the solution set and improves the performance of the standard MOGWO algorithm. In the standard MOGWO, the location of wolf pack is only updated by an average formula, which will lead to local convergence and poor population diversity. For this intelligent algorithm based on population iteration, the degree of population diversity is directly related to the final solution quality and global convergence effect. In the IMOGWO improved by difference mechanism and elite strategy, three different solutions with disturbances and one conventional solution are provided to ensure the optimal solution in each iteration. This improvement further improves the balance between local exploitation and global exploration, and improves the diversity of the algorithm. These results prove that the proposed improved IMOGWO algorithm is able to provide remarkable convergence and coverage ability in solving multi-objective problems. The stability of solution sets is significantly high on these benchmark problems.
4.4. Flowchart of Optimization
The flowchart of sizing optimization using IMOGWO is shown in Figure 5. The detailed optimization process is as follows:
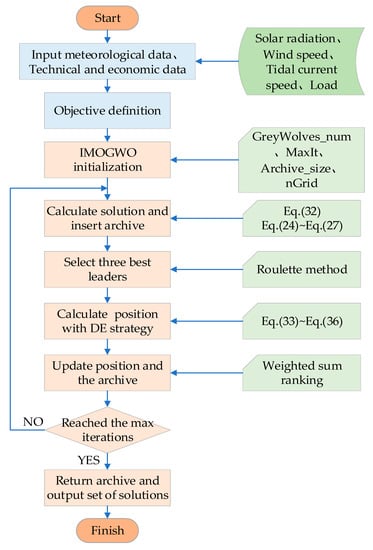
Figure 5.
Flowchart of optimization using IMOGWO.
- Input the load, irradiance, wind speed, tidal current speed and other data of the studied island. Input the economic and technical parameters of the system components.
- Determine the system optimization objectives and constraints. Determine the system variables and boundaries.
- Initialize the algorithm, set the external archive, configure the algorithm parameters and the maximum number of iterations.
- Calculate the non-dominated solution of the contemporary population, and update the external archive.
- Calculate the convergence factor according to Equation (32), and select three leaders from the external archive by roulette method.
- Calculate four candidate solutions of the current individual wolf using Equations (24)–(27) and Equations (33)–(36).
- Select all the non-dominated solutions. Select the optimal update position of the current individual wolf by elite strategy.
- Add the non-dominated solutions to the archive according to the archiving rules, and remove the dominated solutions. Remove the excess solutions when the population of external archive is full.
- Use to judge whether the algorithm should be terminated. The algorithm ends and all the non-dominated solutions are output if is reached. Conversely, return to Step 5.
5. Simulation Results and Discussion
5.1. Case Studies
The proposed algorithm has been applied to analyze a hybrid energy system of an island in the South China Sea. The hourly load of the island microgrid fluctuates in the range of 200–1000kW. The annual load curve of a typical year based on historical data is shown in Figure 6. The annual irradiance and wind speed curves of a typical year are shown in Figure 7 and Figure 8. The historical data are obtained from the database of NOAA’s National Centers for Environmental Information []. The tidal current speed curve is shown in Figure 9, which is simulated according to the historical data in reference []. The bidirectional asymmetry of tidal current is ignored in the calculation.
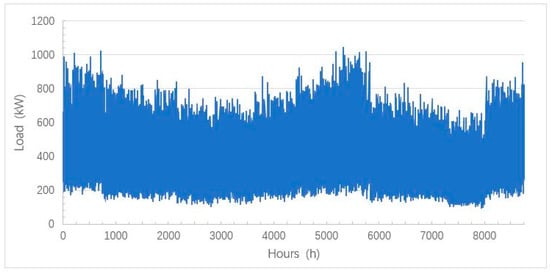
Figure 6.
Annual load demand of the studied location.
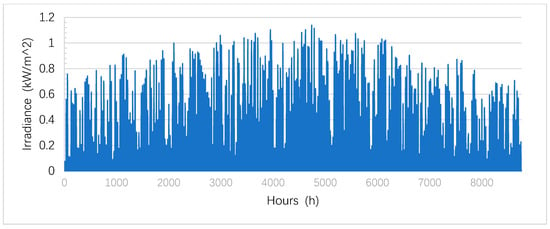
Figure 7.
Annual solar irradiance of the studied location.
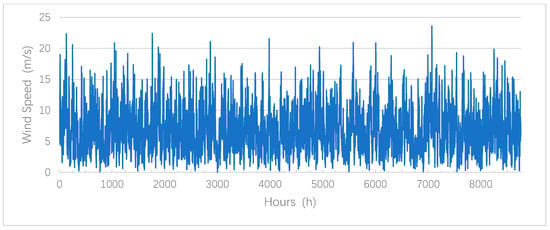
Figure 8.
Annual wind speed of the studied location.
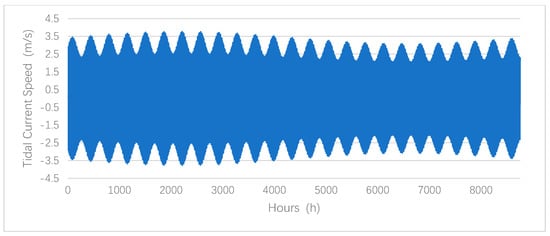
Figure 9.
Annual tidal current speed of the studied location.
As a special research object, the components of island microgrid are vulnerable to natural disasters such as typhoons. In order to ensure the reliability of the system, components with appropriate rated capacity should be considered to avoid large-scale power outage or even microgrid collapse caused by equipment failure. The economic and technical parameters of the major components are shown in Table 3.

Table 3.
Technical and economic specifications of the system components.
5.2. Results and Discussion
The sizing optimization of hybrid energy system based on IMOGWO has been implemented by the MATLAB (R2018b, MathWorks, Natick, Massachusetts, USA) simulation platform on an 8-core Lenovo computer (T490, Lenovo, Beijing, China) with 16 GB memory and 3.4 GHz CPU clock speed, running Windows 10 enterprise operating system (64-bit). The parameters of IMOGWO are shown in Table 4. Figure 10a shows the relationship between DPSP and CACS of the studied hybrid energy microgrid. DPSP decreases with the increase of CACS. Four representative solutions are selected, including CACS minimum, DPSP minimum, DPSP equal to 0.1 and 0.5, respectively. The corresponding system configuration is listed in Table 5.

Table 4.
IMOGWO Parameters.
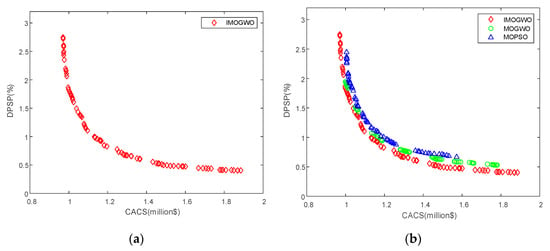
Figure 10.
(a) The Pareto front of optimization results; (b)The Pareto front obtained by IMOGWO, MOGWO, and MOPSO.

Table 5.
Sizing of hybrid energy microgrid.
The maximum CACS of the system is , the corresponding DPSP is . The minimum CACS of the system is , and the corresponding DPSP is . The trend of the Pareto front indicates that when the DPSP of the system is lower than , any slight improvement of reliability will bring unacceptable investment cost. Therefore, the contradictory relationship between investment and reliability should be reasonably evaluated and balanced according to the actual situation, so as to avoid excessive investment. Further analysis is based on the DPSP of . In this case, the components of hybrid energy system include 358 photovoltaic units, 12 wind turbines, 14 tidal current turbines, 10 battery storage units and 5 diesel generators. Figure 11 demonstrates the annual simulation results of power generation of hybrid energy system. Figure 12 and Figure 13 demonstrate the simulation results of typical month and the zoomed version for one week.
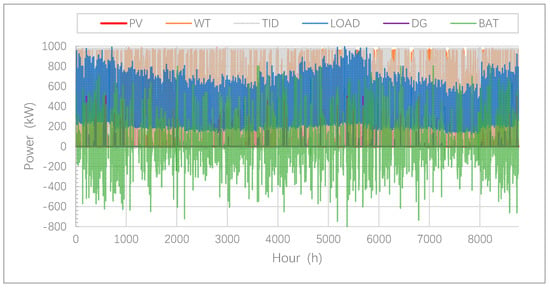
Figure 11.
Electricity generation of hybrid system for one year.
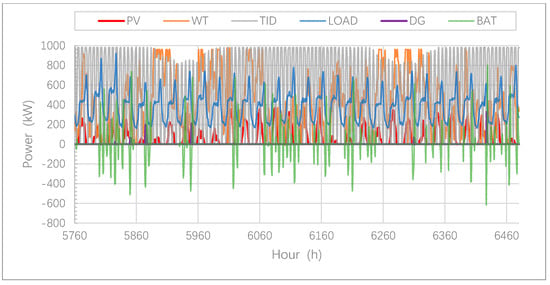
Figure 12.
Electricity generation of hybrid system for one month.
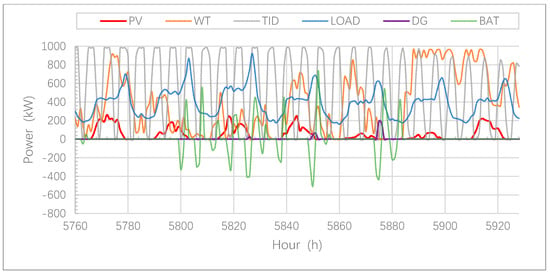
Figure 13.
Electricity generation of hybrid system for one week.
The result shows that TCTs provide stable power output, while PVs and WTs provide intermittent power output, which is determined by the characteristics of different resources. The BSS and distributed generation form an effective complementarity. When the distributed generation is sufficient, the BSS is charged to improve the utilization of renewable energy. When the distributed generation is insufficient, the BSS discharges to provide power output. The energy management strategy fully matches the operation requirement of island microgrid and ensures reliable and sustainable power supply. Due to the emission of pollutants, DGs only operate to match the basic load demand when the power supply is extremely scarce. Simulation analysis verifies the feasibility of IMOGWO to solve the sizing optimization problem of hybrid energy system.
In order to further test the performance of the algorithm, IMOGWO, MOGWO and MOPSO algorithms are utilized to solve the optimization objectives. The comparison results are shown in Figure 10b. The proposed IMOGWO shows better convergence and coverage than standard MOGWO and MOPSO. The Pareto optimal front of IMOGWO is more distributed and broader than that of MOGWO and MOPSO. IMOGWO has obvious performance advantages in optimizing system cost and reliability and provides the better DPSP with the same CACS. The result indicates that the proposed IMOGWO has good performance in solving such kind of multi-objective problems.
5.3. Economic Analysis and Discussion
Figure 14 shows the generation and CACS percentages of different components in the system. PVs contributed 5.27% power output with 11.16% investment, WTs contributed 38.11% power output with 35.37% investment, TCTs contributed 52.25% power output with 39.81% investment, BSS contributed 4.21% power output with 8.01% investment, and DGs contributed 0.16% power output with 5.65% investment. Obviously, TCTs have the best investment benefit, the investment benefit of WTs is ordinary, the investment benefits of PVs and BSS are poor, and DGs have the worst investment benefit. However. The economic benefits of BSS and DGs need to be specially considered. BSS and DGs are the necessary components to ensure the reliability of the system. In particular, DGs with sufficient capacity are indispensable as the emergency generators of the system.
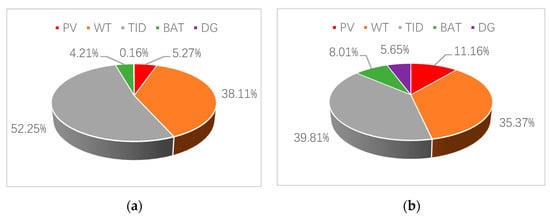
Figure 14.
(a) The generation percentages; (b) The annualized cost of system (CACS) percentages.
In order to further illustrate the economic advantages of TCTs, the system including only PVs and WTs as distributed generation is simulated. The comparison results are shown in Figure 15. Taking DPSP as 2%, 1% and 0.5% respectively, the corresponding CACS of the system is shown in Table 6. For the system without TCTs, the CACS with the same DPSP value is about twice than that with TCTs. Obviously, the utilization of TCTs as distributed generation has superior economic benefits in the studied location. TCTs should be utilized as basic generators in the hybrid energy system.
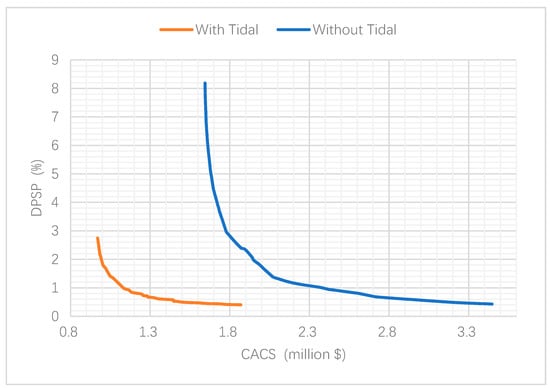
Figure 15.
Economic comparison between systems with or without tidal current turbines (TCTs).

Table 6.
System CACS with and without TCTs.
5.4. Additional Case Studies
In order to further verify the generality of the proposed sizing optimization method, another case of an island in the South China Sea (Case 2) is studied with the same objectives. The hourly parameters of load and renewable energy sources at the target location are shown in Table 7.

Table 7.
Parameters of load and renewable energy sources (Case 2).
The solutions obtained by the proposed sizing optimization method and IMOGWO with the same component parameters are shown in Table 8. The simulation results provide varied referential solutions for the construction of undeveloped island microgrid. The policymakers can choose the high reliability, high economy or equilibrium solutions from the optimal solutions set according to the actual demand. Considering the balance between economy and reliability of hybrid energy system, the power generation and CACS proportions of different components in the system are further analyzed with DPSP of 0.2% as an example. The comparison results are shown in Table 9. In this case, even if the studied location has abundant irradiation and wind resources, the TCTs still provide stable and economical power output.

Table 8.
Sizing of hybrid energy microgrid (Case 2).

Table 9.
The power generation and CACS proportions of different components (Case 2).
Simulation results show that the proposed multi-objective sizing optimization method and IMOGWO can obtain optimal solutions set in different cases. If the tidal current source reaches the appropriate level, the TCT with high utilization value will be a desirable energy supply component of the island hybrid energy microgrid. It is worth noting that uncertain load demand, solar irradiance, wind speed, and tidal current speed could lead to the uncertainty of simulation results, which can also be verified by the different solutions obtained from the different two cases. In this paper, case studies based on known historical data are carried out to verify the correctness and effectiveness of the proposed sizing optimization method. However, sufficient investigation of renewable energy sources is the prerequisite for building an economic and reliable hybrid energy system.
6. Conclusions
In this paper, an island hybrid energy system is established composed of photovoltaic, wind, tidal current, battery and diesel, considering the actual natural energy sources of the studied location. The sizing optimization of system components is studied with the objectives including economic index and reliability index. An improved multi-objective grey wolf optimizer is proposed to solve the problem. The system is modeled and simulated by MATLAB software. The major conclusions in this paper are listed as follows:
- The simulation results verify the feasibility of the proposed optimization method. The optimal size of the island hybrid energy system is obtained. BBS and DGS are closely complementary with renewable energy base on an effective and reliable energy management strategy.
- Among all the components of the system, TCTs provide the most stable power output compared with PVs and WTs. Further analysis indicates that the utilization of TCTs can contribute to improve the reliability of power supply and the system investment in areas with abundant tidal current energy sources.
- In addition, simulation analysis verifies the feasibility and advancement of the proposed IMOGWO in solving the sizing optimization problem of hybrid energy system. IMOGWO achieves better Pareto front compared with MOGWO and MOPSO.
The sizing optimization method of hybrid energy system proposed in this paper is also applied to other similar optimization problems of isolated microgrid. Sufficient investigation of renewable energy sources is the prerequisite for building an economic and reliable hybrid energy system. Accurate forecasting of renewable energy sources and load demand needs to be discussed in detail to ensure the accuracy of system sizing optimization, which is the key work in the next stage. This paper has presented a methodological study, further investigation should be carried out to maximize the generation penetration of the renewable energy sources. Furthermore, a more detailed cost analysis should be considered to optimize the effectiveness of the hybrid system operation strategy.
Author Contributions
Conceptualization, W.Z. and G.Z.; methodology, W.Z. and G.Z.; software, W.Z. and B.Z.; validation, W.Z.; investigation, W.Z.; resources, W.Z.; data curation, W.Z.; writing—original draft preparation, W.Z.; writing—review and editing, W.Z. and J.G. All authors have read and agreed to the published version of the manuscript.
Funding
Research received no external fund.
Conflicts of Interest
The authors declare no conflict of interest.
References
- Lin, X.; Chen, C.; Zhou, X.; Li, Z. Integrated energy supply system of pelagic clustering islands. Proc. CSEE 2017, 37, 98–110. [Google Scholar]
- Denny, E.; Keane, A. A smart integrated network for an offshore island. Proc. IEEE Inst. Electr. Electron. Eng. 2013, 101, 942–955. [Google Scholar] [CrossRef]
- Jorgensen, J.M.; Sorensen, S.H.; Behnke, K.; Eriksen, P.B. EcoGrid EU—A prototype for European smart grids. In Proceedings of the 2011 IEEE Power and Energy Society General Meeting, Detroit, MI, USA, 24–28 July 2011; pp. 1–7. [Google Scholar] [CrossRef]
- Ding, Y.; Nyeng, P.; Ostergaard, J.; Trong, M.D.; Pineda, S.; Kok, K.; Huitema, G.B.; Grande, O.S. Ecogrid EU—A large scale smart grids demonstration of real time market-based integration of numerous small DER and DR. In Proceedings of the 3rd IEEE PES Innovative Smart Grid Technologies Europe (ISGT Europe), Berlin, Germany, 14–17 October 2012; pp. 1–7. [Google Scholar]
- El-Bidairi, K.S.; Duc, N.H.; Jayasinghe, S.D.G.; Mahmoud, T.S.; Penesis, I. A hybrid energy management and battery size optimization for standalone microgrids: A case study for Flinders Island, Australia. Energy Convers. Manag. 2018, 175, 192–212. [Google Scholar] [CrossRef]
- Hamilton, J.; Negnevitsky, M.; Wang, X.; Lyden, S. High penetration renewable generation within Australian isolated and remote power systems. Energy 2019, 168, 684–692. [Google Scholar] [CrossRef]
- Chen, A.A.; Stephens, A.J.; Koon Koon, R.; Ashtine, M.; Mohammed-Koon Koon, K. Pathways to climate change mitigation and stable energy by 100% renewable for a small island: Jamaica as an example. Renew. Sustain. Energy Rev. 2020, 121, 109671. [Google Scholar] [CrossRef]
- Abidi, M.G.; Ben Smida, M.; Khalgui, M.; Li, Z.; Qu, T. Source resizing and improved power distribution for high available island microgrid: A case study on a tunisian petroleum platform. IEEE Access 2019, 7, 22856–22871. [Google Scholar] [CrossRef]
- Bertheau, P. Supplying not electrified islands with 100% renewable energy based micro grids: A geospatial and techno-economic analysis for the Philippines. Energy 2020, 202, 117670. [Google Scholar] [CrossRef]
- Mohammed, O.; Amirat, Y.; Benbouzid, M. Economical evaluation and optimal energy management of a stand-alone hybrid energy system handling in genetic algorithm strategies. Electronics 2018, 7, 233. [Google Scholar] [CrossRef]
- Zhao, B.; Zhang, X.; Li, P.; Wang, K.; Xue, M.; Wang, C. Optimal sizing, operating strategy and operational experience of a stand-alone microgrid on Dongfushan Island. Appl. Energy 2014, 113, 1656–1666. [Google Scholar] [CrossRef]
- Carlos, D.; Rodríguez-Gallegos, D. A multi-objective and robust optimization approach for sizing and placement of PV and batteries in off-grid systems fully operated by diesel generators An Indonesian case study. Energy 2018, 160, 410–429. [Google Scholar]
- Luna-Rubio, R.; Trejo-Perea, M.; Vargas-Vazquez, D.; Rios-Moreno, G.J. Optimal sizing of renewable hybrids energy systems: A review of methodologies. Sol. Energy 2012, 86, 1077–1088. [Google Scholar] [CrossRef]
- Chauhan, A.; Saini, R. A review on integrated renewable energy system based power generation for stand-alone applications: Configurations, storage options, sizing methodologies and control. Renew. Sustain. Energy Rev. 2014, 38, 99–120. [Google Scholar] [CrossRef]
- Sinha, S.; Chandel, S. Review of software tools for hybrid renewable energy systems. Renew. Sustain. Energy Rev. 2014, 32, 192–205. [Google Scholar] [CrossRef]
- Ma, X.; Wu, Y.; Fang, H.L.; Sun, Y.Z. Optimal sizing of hybrid solar-wind distributed generation in an islanded microgrid using improved bacterial foraging algorithm. Proc. IEEE Inst. Electr. Electron. Eng. 2011, 25, 17–25. [Google Scholar]
- Abo-Elyousr, F.K.; Elnozahy, A. Bi-objective economic feasibility of hybrid micro-grid systems with multiple fuel options for islanded areas in Egypt. Renew. Energy 2018, 128, 37–56. [Google Scholar] [CrossRef]
- Duan, S.; Liu, N.; Cai, Y.M. Optimal operation of the island microgrid with renewable energy and desalination. In Proceedings of the International Conference on Mechatronic Sciences, Electric Engineering and Computer (MEC), Shenyang, China, 20–22 December 2013; pp. 3718–3722. [Google Scholar]
- Hamanah, W.M.; Abido, M.A.; Alhems, L.M. Optimum sizing of hybrid pv, wind, battery and diesel system using lightning search algorithm. Arab. J. Sci. Eng. 2020, 45, 1871–1883. [Google Scholar] [CrossRef]
- Bukar, A.L.; Tan, C.W.; Lau, K.Y. Optimal sizing of an autonomous photovoltaic/wind/battery/diesel generator microgrid using grasshopper optimization algorithm. Sol. Energy 2019, 188, 685–696. [Google Scholar] [CrossRef]
- Mahesh, K.; Nallagownden, P.; Elamvazuthi, I. Advanced pareto front non-dominated sorting multi-objective particle swarm optimization for optimal placement and sizing of distributed generation. Energies 2016, 9, 982. [Google Scholar] [CrossRef]
- Kaabeche, A.; Diaf, S.; Ibtiouen, R. Firefly-inspired algorithm for optimal sizing of renewable hybrid system considering reliability criteria. Sol. Energy 2017, 155, 727–738. [Google Scholar] [CrossRef]
- Nadjemi, O.; Nacer, T.; Hamidat, A.; Salhi, H. Optimal hybrid PV/wind energy system sizing: Application of cuckoo search algorithm for Algerian dairy farms. Renew. Sustain. Energy Rev. 2017, 70, 1352–1365. [Google Scholar] [CrossRef]
- Ajlan, A.; Tan, C.W.; Abdilahi, A.M. Assessment of environmental and economic perspectives for renewable-based hybrid power system in Yemen. Renew. Sustain. Energy Rev. 2017, 75, 559–570. [Google Scholar] [CrossRef]
- Yang, H.; Zhao, R.; Xin, H. Development and Research Status of Island Power Systems. Trans. China Electrotech. Soc. 2013, 28, 95–105. [Google Scholar]
- Al-Falahi, M.D.A.; Jayasinghe, S.D.G. A review on recent size optimization methodologies for standalone solar and wind hybrid renewable energy system. Energy Convers. Manag. 2017, 143, 252–274. [Google Scholar] [CrossRef]
- Francisco, T.; Paulo, R.; Tiago, F. Marine renewable energy. Renew. Energy 2020, 150, 1160–1164. [Google Scholar]
- Wang, S.; Yuan, P.; Li, D.; Jiao, Y. An overview of ocean renewable energy in China. Renew. Sustain. Energy Rev. 2011, 15, 91–111. [Google Scholar] [CrossRef]
- Nachtane, M.; Tarfaoui, M.; Goda, I.; Rouway, M. A review on the technologies, design considerations and numerical models of tidal current turbines. Renew. Energy 2020, 157, 1274–1288. [Google Scholar] [CrossRef]
- Zhou, Z.; Benbouzid, M.; Charpentier, J.; Scuiller, F.; Tang, T. Developments in large marine current turbine technologies—A review. Renew. Sustain. Energy Rev. 2017, 71, 852–858. [Google Scholar] [CrossRef]
- Astariz, S.; Vazquez, A.; Iglesias, G. Evaluation and comparison of the levelized cost of tidal, wave, and offshore wind energy. J. Renew. Sustain. Energy 2015, 7, 053112. [Google Scholar] [CrossRef]
- Razman, A.; Chee, W.T. A comprehensive review on photovoltaic emulator. Renew. Sustain. Energy Rev. 2017, 80, 430–452. [Google Scholar]
- Thangamani, K.; Manickam, M.L.; Chellaiah, C. An experimental study on photovoltaic module with optimum power point tracking method. Int. Trans. Electr. Energy Syst. 2019, 30, 12175. [Google Scholar] [CrossRef]
- Thomas, H.; Ralph, G.; Hans, G.B. Mapping the performance of PV modules, effects of module type and data averaging. Sol. Energy 2010, 84, 324–338. [Google Scholar]
- Skoplaki, E.; Palyvos, J.A. On the temperature dependence of photovoltaic module electrical performance: A review of efficiency/power correlations. Sol. Energy 2009, 83, 614–624. [Google Scholar] [CrossRef]
- Hanieh, B.; Saad, M.; Velappa, G. Optimization of micro-grid system using MOPSO. Renew. Energy 2014, 71, 295–306. [Google Scholar]
- Tito, S.R.; Lie, T.T.; Anderson, T.N. Optimal sizing of a wind-photovoltaic-battery hybrid renewable energy system considering socio-demographic factors. Sol. Energy 2016, 136, 525–532. [Google Scholar] [CrossRef]
- Tang, Y.; Fang, G.; Tan, Q.; Wen, X.; Lei, X.; Ding, Z. Optimizing the sizes of wind and photovoltaic power plants integrated into a hydropower station based on power output complementarity. Energy Convers. Manag. 2020, 206, 112465. [Google Scholar] [CrossRef]
- Bhandari, B.; Lee, K.; Lee, G.; Cho, Y.; Ahn, S. Optimization of hybrid renewable energy power systems: A review. Int. J. Precis. Eng. Manuf. Technol. 2015, 2, 99–112. [Google Scholar] [CrossRef]
- Shin, J.; Lee, J.H.; Realff, M.J. Operational planning and optimal sizing of microgrid considering multi-scale wind uncertainty. Appl. Energ. 2017, 195, 616–633. [Google Scholar] [CrossRef]
- Seif, E.; Ben, E. A Simulation Model for the evaluation of the electrical power potential harnessed by a marine current turbine. IEEE J. Ocean. Eng. 2007, 32, 786–797. [Google Scholar]
- Faridnia, N.; Habibi, D.; Lachowicz, S. Optimal scheduling in a microgrid with tidal generation. Energy 2019, 171, 435–443. [Google Scholar] [CrossRef]
- Roy, A.W.; Michael, R.T.; Clayton, E.H. Estimation of tidal power potential. Renew. Energy 2013, 51, 255–262. [Google Scholar]
- El Tawil, T.; Charpentier, J.F.; Benbouzid, M. Tidal energy site characterization for marine turbine optimal installation: Case of the Ouessant Island in France. Int. J. Mar. Energy 2017, 18, 57–64. [Google Scholar] [CrossRef]
- Morstyn, T.; Hredzak, B.; Agelidis, V.G. Control strategies for microgrids with distributed energy storage systems: An overview. IEEE Trans. Smart Grid 2018, 9, 3652–3666. [Google Scholar] [CrossRef]
- Bahmani-Firouzi, B.; Azizipanah-Abarghooee, R. Optimal sizing of battery energy storage for micro-grid operation management using a new improved bat algorithm. Int. J. Electr. Power Energy Syst. 2014, 56, 42–54. [Google Scholar] [CrossRef]
- Zhang, Y.; Lundblad, A.; Campana, P.E.; Benavente, F.; Yan, J. Battery sizing and rule-based operation of grid-connected photovoltaic-battery system: A case study in Sweden. Energy Convers. Manag. 2017, 133, 249–263. [Google Scholar] [CrossRef]
- Suresh, M.; Meenakumari, R. An improved genetic algorithm based optimal sizing of Solar Photovoltaic/ Wind Turbine Generator/ Diesel Generator/ Battery connected Hybrid Energy Systems for standalone applications. Int. J. Ambient. Energy 2019, 1, 20. [Google Scholar] [CrossRef]
- Ogunjuyigbe, A.S.O.; Ayodele, T.R.; Akinola, O.A. Optimal allocation and sizing of PV/Wind/Split-diesel/Battery hybrid energy system for minimizing life cycle cost, carbon emission and dump energy of remote residential building. Appl. Energy 2016, 171, 153–171. [Google Scholar] [CrossRef]
- Guo, Y.; Dai, X.; Jermsittiparsert, K.; Razmjooy, N. An optimal configuration for a battery and PEM fuel cell-based hybrid energy system using developed Krill herd optimization algorithm for locomotive application. Energy Rep. 2020, 6, 885–894. [Google Scholar] [CrossRef]
- Guo, L.; Fu, X.; Li, X.; Wang, C. Coordinated control of battery storage and diesel generators in isolated ac microgrid systems. Proc. CSEE 2012, 25, 70–78. [Google Scholar]
- Abdelhamid, K.; Rachid, I. Techno-economic optimization of hybrid photovoltaic/wind/diesel/ battery generation in a stand-alone power system. Sol. Energy 2014, 103, 171–182. [Google Scholar]
- Sanajaoba, S.; Fernandez, E. Maiden application of Cuckoo Search algorithm for optimal sizing of a remote hybrid renewable energy System. Renew. Energy 2016, 96, 1–10. [Google Scholar] [CrossRef]
- Al-Shamma’A, A.A.; Addoweesh, K.E. Optimum sizing of hybrid PV/wind/battery/diesel system considering wind turbine parameters using Genetic Algorithm. In Proceedings of the 2012 IEEE International Conference on Power and Energy (PECon), Kota Kinabalu Sabah, Malaysia, 2–5 December 2012; pp. 121–126. [Google Scholar]
- Kasereka, N.; Jackson, G.N.; Evan, M.W. Multi-objective optimal sizing of grid connected photovoltaic batteryless system minimizing the total life cycle cost and the grid energy. Renew. Energy 2019, 148, 1256–1265. [Google Scholar]
- Mirjalili, S.; Mirjalili, S.M.; Lewis, A. Grey wolf optimizer. Adv. Eng. Softw. 2014, 69, 46–61. [Google Scholar] [CrossRef]
- Mirjalili, S.; Saremi, S.; Mirjalili, S.M.; Coelho, L.D.S. Multi-objective grey wolf optimizer: A novel algorithm for multi-criterion optimization. Expert Syst. Appl. 2016, 47, 106–119. [Google Scholar] [CrossRef]
- Storn, R.; Price, K. Differential evolution—A simple and efficient heuristic for global optimization over continuous spaces. J. Glob. Optim. 1997, 11, 341–359. [Google Scholar] [CrossRef]
- Zhang, Q.; Zhou, A.; Zhao, S.; Suganthan, P.; Liu, W.; Tiwari, S. Multi-Objective Optimization Test Instances for the CEC 2009 Special Session and Competition; Technical Report CES-487; Mechanical Engineering: New York, NY, USA, 2008. [Google Scholar]
- Data Access of National Centers for Environmental Information. Available online: https://www.ncei.noaa.gov/ (accessed on 10 June 2020).
- Hou, F.; Yu, H.M.; Bao, X.W.; Wu, H. Analysis of tidal current energy in Zhoushan sea area based on high resolution numerical modeling. Acta Energ. Sol. Sin. 2014, 35, 125–133. [Google Scholar]
Publisher’s Note: MDPI stays neutral with regard to jurisdictional claims in published maps and institutional affiliations. |
© 2020 by the authors. Licensee MDPI, Basel, Switzerland. This article is an open access article distributed under the terms and conditions of the Creative Commons Attribution (CC BY) license (http://creativecommons.org/licenses/by/4.0/).