Abstract
This paper describes a mathematical model for the convection, diffusion, and balance phenomena for predicting the depletion curves, i.e., variations in the timed surface-active molecule concentration for fractionation processes in bubbles and foam column, operated in semi-batch. The model was applied for the purification of the surfactin solution and the results were compared with experimental data. Gibbs adsorption curves were obtained for the biosurfactant at different temperatures, and then adjusted with estimated parameters, according to the Langmuir adsorption model. The gas bubble sizes were optically determined. The isotherm adsorption parameters and bubble average diameter are crucial for the attainment of the depletion curves, generated by the model described. The results demonstrate that the process is most effective when operating a column with reduced gas flow and low initial concentration. A top product with two or thirty times greater concentration than the initial one was achieved and the highest biosurfactant concentrations were attained for higher operating temperatures. It was also observed that bubble diameter increased with a higher gas flow. The adjustment obtained for the adsorption curves of Gibbs was satisfactory. Therefore, there was evidence that surfactin molecules adsorb in monolayers in the liquid–gas interface.
1. Introduction
Bubble and foam column fractionation is a separation process capable of concentrating and recovering amphiphilic molecules, including surfactant, from dilute solutions. The process is based on the adsorption of surface-active material to the gas–liquid interface phenomenon, tendering low fixed and operating costs and reduced power consumption [1,2,3,4,5,6,7].
The technique consists of the insertion of gas through the liquid column, affording the gaseous phase bubbling inside the solution containing the surface-active material to be isolated [8,9]. The gas bubbles allow the emergence of a large surface area, favoring the selective adsorption of the solute in the gas–liquid interface. As the gas bubbles ascend through the solution, molecules are adsorbed and concentrated on a gas–liquid interface, producing a foam column at the top of the liquid phase [10,11]. The use of columns for the foam phase allows its axial elevation, and consequently, the drainage of a portion of the liquid transported in the liquid phase, resulting in the concentrated solute of interest along the column [7,12]. The foam produced may be removed, and mechanically collapsed, generating an enriched surface-active material solution, called top product [13].
The first study mentioning this process was reported in 1937 by Ostwald and Sierh when they separated albumen from beet and potato juices [8,13,14]. Years later, illuminating works on the subject were discussed in the literature [15,16,17] and the process has since become the target of research [18,19,20,21,22,23,24,25,26,27,28,29,30,31].
During the bubble and foam column fractionation process, operated in semi-batch, the solution is introduced into the liquid column, then a controlled gas injection exit is initiated and the foam is continuously produced. The timed surface material removal by the foam material decreases its concentration in the solution, thus causing a liquid column height variation [14,32]. It is worth noting that, in literature, the fractionation process is reported as experimental, or as foam column models in which the concentration remains constant in the liquid column, even for semi-batch processes. Therefore, this paper describes a mathematical model with the ability to predict timed surfactant concentration depletion in the liquid column [10,33].
In the model, there is an assumption of balance between the surface-active material concentration and the layer surrounding the bubbles, and that in such layer, the surfactant concentration varies according to the axial position of the liquid column bubbles, resulting from the convective mass transfer. It is also assumed that the solution concentration remains constant, with the liquid column height for a given time, and at the interface between the liquid and foam sections, a certain amount of fluid is dragged by the bubbles, owing to the drainage effect, and a fraction of it is then returned to the liquid column. The final surfactant concentration in the bubble surface can be given according to its adsorption isotherm, the rate of mass transfer in the gas–liquid interface and the process operating parameters. The timed variation of the surfactant concentration can be obtained by mass balance equations in the liquid column [10,32,33,34,35,36,37,38].
In order to evaluate the model’s accuracy, the theoretical results were compared with experimental ones, obtained from the fractionation of bubbles and foam columns to surfactin, a natural lipopeptide biosurfactant and synthesized by the bacterium Bacillus subtilis [39,40,41].
1.1. Mathematical Modeling
The timed variation in the surface-active material concentration in the bubbles and foam column can be described by equations derived from both liquid column and bubble surface surfactants mass balance along with the overall bulk applied to the liquid column. Figure 1 shows a schematic diagram of the bubbles and foam column and some of the variables used in the model’s mass balance equations.
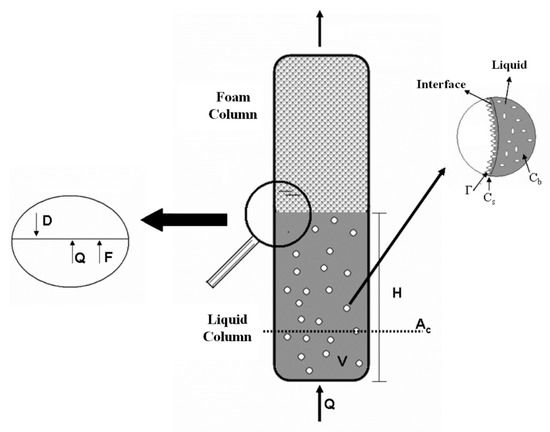
Figure 1.
Schematic diagram of the bubble and foam column and surfactant adsorption on the surface of the gas bubbles.
1.2. Overall Mass Balance in the Liquid Column
At the liquid column exit, the gas bubbles entering the foam column drag a certain fluid amount and a fraction of it is returned by the drainage effect (Figure 1). It is assumed that the gas entering the column is humidified, thus preventing evaporation, so the gas concentration remains constant throughout the column. The equation derived from the overall mass balance is given by:
1.3. Liquid Column Surfactant Mass Balance
The surfactant dragged from the liquid to the foam section is distributed in the bubble superficial and interstitial regions. A portion of the removed surfactant returns to the liquid column due to the drainage occurring in the foam column. Since the fluid volume in the interstitial region is much larger than in the bubble surface, it was assumed that the foam interstitial fluid forms the flow. Therefore, the mass balance equation can be written as:
The second term of the derivative can be neglected, because the amount of surfactant present in the liquid is much larger than the one spread on the bubble surface. The surface-active material concentrations in the interstitial fluid and column fluid are equal (CF = Cb), because the interstitial fluid is derived from the liquid column drag. Moreover, because of the low coalescence rate of the foam column bubbles, it can be said that the surface-active material concentrations present in the drainage current and in the fluid column are approximately equal (Cd ≈ Cb). Furthermore, the gas fraction, in general, is below 0.03, i.e., the term (1 − εg) can be considered equal to unity. Therefore, Equation (2) remains:
By substituting Equation (1) for (3), and rearranging it, one can show that:
The bubbles were assumed to be spherical due to the ascent low speed and their small diameters.
For the solution of Equation (4), the surface-active concentration at the liquid column exit (Γexit) needs to be known. This value can be obtained by applying a mass balance to the bubble surface.
1.4. Mass Balance for the Surfactant on the Bubble Surface
The surfactant adsorption material on the bubble surface model is similar to the one proposed in the literature [10,32,42]. Therefore, the interfacial mass balance equation can be written as:
The timed surfactant concentration variation can be converted to liquid column axial position variations.
By substituting Equation (5) for (6), and rearranging it, it is demonstrated that:
If the volumetric mass transfer coefficient (kLa) and the bubble mean diameter (db) do not vary with the height of the liquid present in the liquid column, Equation (7) can be integrated, yielding:
Therefore, by Equation (8), the surface concentration value at the exit of the liquid column can be determined. However, the full resolution of this problem not only requires knowledge of the volumetric mass transfer coefficient but also the isotherm adsorption with Γ and CS relating values.
To solve Equations (4) and (8) a pseudo-steady state was presupposed, i.e., the surfactant concentration in the bulk, liquid column height, and the bubble mean diameter were presumed to be constant. The recommended correlation for bubbles with diameters of less than 9.5 cm was used for the volumetric mass transfer coefficient estimation [43,44].
Therefore, the objective of this study was to verify the model’s mathematical accuracy, comparing the theoretical depletion curves with the experimental ones. The bubble and foam column experiments, semi-batch operated, were performed for surfactin solutions at the initial concentration of 0.7 kg m−3 at the temperatures of 15 and 35 °C, introducing gas flow rates of 3.3 × 10⁻⁷ m3 s−1 and 1.0 × 10⁻⁶ m3 s−1.
2. Materials and Methods
2.1. Surfactin
The surfactin solution was supplied by the Bioaromas Laboratory, at the Food Engineering School (FEA/UNICAMP) by fermentation process, at the concentration of 1.5 kg m−3 and pH 6.5. It was previously centrifuged for the removal of microbial cells and diluted with ultra-pure water to 40% (v/v), with an initial concentration yield of 0.7 kg m−3. The solution pH was measured in a pH meter (Digimed®/model DM-20/ São Paulo, Brazil) and adjusted to pH 7.0 by adding sodium hydroxide (PA grade) at 100 mol m−3 (Labsynth®). The analytical curve was obtained with Standard surfactin (Sigma–Aldrich, 98% purity, lot 1224932/ São Paulo, Brazil).
2.2. Bubbles and Foam Column
2.2.1. Experimental Apparatus
The fractionation column (Figure 2) was made of glass with total height of 1.2 m, consisting of two sections, the lower (bubbles or liquid column) and top (foam column) with internal diameters of 75 and 30 mm, respectively. A thermal jacket circulating water whose temperature was controlled by thermostatic bath (Endocol®/model RTE-110) surrounds the column. The solution was supplied through a glass funnel into the lower portion of the column. At the base of the bubble column there was a sintered glass distributor through which the gas was introduced. A sampling port was located five centimeters above the humidifier. Pressurized nitrogen, supplied by White Martins®, was used in the process. The gas volumetric yield was manually controlled by needle valves and measured by a calibrated rota meter (Allborg®). Prior to the introduction, the gas was bubbled in the humidifier, with distilled water.
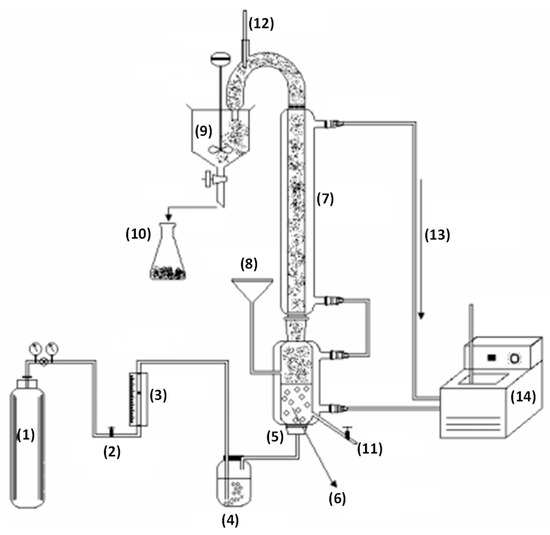
Figure 2.
Experimental apparatus used in the fractionation of surfactin in bubble and foam column operated in a semi-bath. (1) Nitrogen cylinder; (2) Valve; (3) Rotameter; (4) Humidifier; (5) Gas distributor; (6) Liquid column; (7) Foam column; (8) Feed solution; (9) Foam breaker; (10) Sample port; (11) Sample port; (12) Thermometer; (13) Water circulation; (14) Thermostatic bath.
At the foam column’s top, a strong curvature allowed dragged foam removal. A mercury thermometer was attached to the curvature’s top and underneath it there was a collection glass container. A two-bladed electric stirrer was used to break the foam and the resulting liquid (top product) was sampled.
2.2.2. Column Operation
The experimental run started by introducing 5.0 × 10⁻⁴ m3 of a biosurfactant solution into the column, forming a 0.12-m high liquid column. When the thermal balance was achieved, the gas with the specified flow rate was injected into the column base. The first bubbles reached the liquid column top at time zero, and then, at regular intervals, the sampling (1 × 10⁻⁵ m3) began. The gas dragged the continuously produced foam, and at the crowning, the top product sampling (1.5 × 10⁻⁶ m3) began at pre-set intervals. The samples were then collected in plastic tubes, subjected to surface tension measurements and then discarded. The liquid column height, surfactin concentration, temperature, and the gas flow were monitored.
The experimental run finished when only small amounts of foam were produced, making it impossible for the column to reach the top with the same gas flow. The remaining biosurfactant solution was collected and the experimental apparatus was washed with an abundance of distilled water.
2.3. Ascertainment of the Biosurfactant Concentration
The concentrations of the collected surfactin samples were indirectly determined using the KRUSS/model K-12 tensiometer. Measurements were performed at 25 °C adopting the Du Nouy ring method [45], in which the required force to detach a platinum ring from a liquid surface was measured. The samples were diluted in ultra-pure water, then surface tension measurements were carried out and their mass concentrations were determined by an analytical curve expressing surface tension in relation to biosurfactant concentration. At the end of each measurement, the tensiometer glass cell was washed with distilled water and dried in a kiln. The platinum ring was flamed in 70% (v/v) ethanol solution in ultra-pure water.
2.4. Resolution of the Mass Balance Equations: Process Simulation
The theoretical biosurfactant depletion curves were obtained using the IP/ACP version 1.0 software, developed by the Polytechnic Institute, State University of Rio de Janeiro, Brazil. The software is based on the mathematical modeling presented here. The liquid column height was considered constant in the resolutions of Equations (4) and (8). In addition, the Langmuir model was used to describe the surfactin adsorption isotherm and the volumetric mass transfer coefficient was estimated by the correlation given by [44]:
The diffusion coefficient was estimated by the correlation for organic solute diffusion in aqueous solutions [46]:
To solve the mass balance equations, the software needed the following data input: physical and chemical parameters (liquid and gas density, surface tension and water viscosity), adsorption isotherm parameters (equilibrium constant, K, and occupied area/mass relation of biosurfactant on the bubble surface, â), and finally the operational parameters (initial solution concentration, liquid column height and diameter, and bubble surface velocity).
2.5. Bubble Size Distribution in the Liquid Column
2.5.1. Experimental Apparatus
The gas bubble size distribution in the liquid column was estimated using Shadow Imaging (Figure 3), consisting of an acrylic column (dimensions: 75 × 75 × 800 mm) and lighting and image detection system. The lighting was performed by laser beam Nd: YAG neodymium-doped yttrium aluminum garnet, Nd:Y3Al5O12 issued at a 532-nm wavelength and generated by two sources coupled to two 700 volt power generators. For beam convergence, both a LaVision® collimator and diffuser 135 mm in diameter were used, consisting of a negative spherical lens with f10 mm focus aperture and fluorescent plate. The detection system files, located two meters from the column, consisted of a high-resolution camera (LaVision®) Imager Cross-Correlation Model) with CCD (charge-coupled device), equipped with Nikon Micro 60 mm focal length objective lens, f/2.8, f4 mm focus aperture able to detect bubble sizes from 5 to 500 µm. For experimental data gathering, an INTEL core 2 quad high-performance computer was used, and the analysis was performed by LaVision® Davis® software version 7.2, resulting in image processing and the statistical results on the gas bubble diameters.
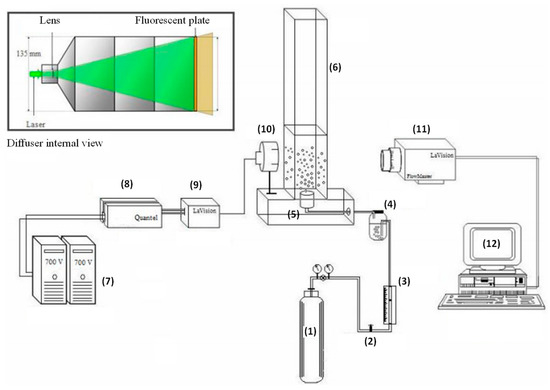
Figure 3.
Experimental apparatus for determining the diameter distribution of gas bubbles. (1) Nitrogen cylinder; (2) Valve; (3) Rotameter; (4) Humidifier; (5) Gas distributor; (6) Column; (7) Power generation; (8) Laser source; (9) Collimator; (10) Diffuser; (11) CCD Camera; (12) Data acquisition.
2.5.2. Experimental Procedure
The systems for lighting and detecting images were calibrated through camera lens focal plane adjustment and emitted laser beam intensity. For calibration, the conversion factor (0.0600962 pixels mm−1) pixel unit converted to millimeters was defined for the use of the software. Reference imagery of bubble-free biosurfactant solution was also obtained, to avoid systematic dissimilar lighting errors in the system.
A volume of 5 × 10⁻⁴ m3 of surfactin (initial concentration 0.7 kg m−3) was added to the column, forming a 0.12-m high liquid column. For bubble creation, humidified nitrogen gas with a specified flow rate was then injected through a sintered glass distributor located at the column base. The lighting and image detecting systems were operated in complete darkness. The laser beam light, emitted by the diffuser, swept the entire column region containing the surfactin boiling solution. The images of bubble shadows captured by the camera were sent immediately to the software for processing. For each experiment, five images per second were obtained.
At the end of each experiment, the surfactin solution was removed and the column was washed with an abundance of ultra-pure water. The lighting and detecting image systems were re-calibrated. Finally, with the gas bubble diameters, it was possible to obtain the bubble size distribution, and thus, calculate the average diameter.
2.6. Obtaining the Isotherms
A 2 × 10⁻² kg m−3 prepared surfactin solution was diluted in ultra-pure water at the concentrations of 0.4 to 1.8 kg m−3 and stored in tubes. The tubes were incubated in baths kept at the temperatures of 15 and 35 °C. Surface tensions at the respective temperatures were measured by the ring method, as described above, using a KSV/model Sigma 701 tensiometer/Germany. Following the method described in the literature [47], it was possible to attain the adsorption isotherms related to the surplus biosurfactant concentration in the surface (Γ) with its molar concentration using the Gibbs adsorption equation for diluted systems, given by:
The Gibbs adsorption isotherm curves were adjusted according to the Langmuir adsorption isotherm model, given by the equation:
3. Results and Discussion
3.1. Biosurfactant Concentration in the Liquid Column
Figure 4 and Figure 5 show the timed variation of the surfactin concentration according to the gas flow for different temperatures. The variation of the biosurfactant concentration in the liquid column between the first and second experimental points occurred at a decreased rate. In this short timed interval, some of the elevated bubbles in the foam column were ruptured due to the foam–air interface and dryness in the column glass walls. Therefore, the high rates of ruptured bubbles in the foam column possibly accounted for the low surfactin concentration reduction rate, in the liquid column. The rupture of bubbles favors the increased concentration of surface-active material in the interstitial regions. Then, a portion of the departing surface-active material adsorbed during the gas–liquid interface returns through the drained liquid.
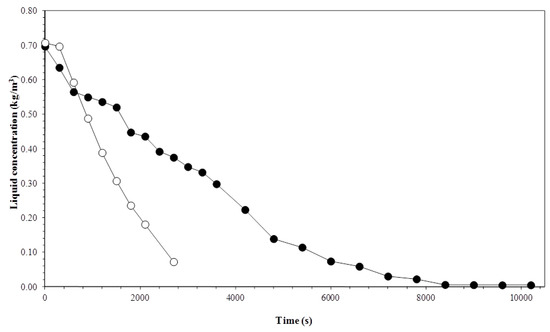
Figure 4.
Variation in the liquid column concentration with time and gas flow rate. Experiment conditions: initial biosurfactant concentration of 0.7 kg m−3 and temperature of 15 °C. Gas flow rate: (●) 3.3 × 10⁻⁷ m3 s−1; (○) 1 × 10⁻⁶ m3 s−1.
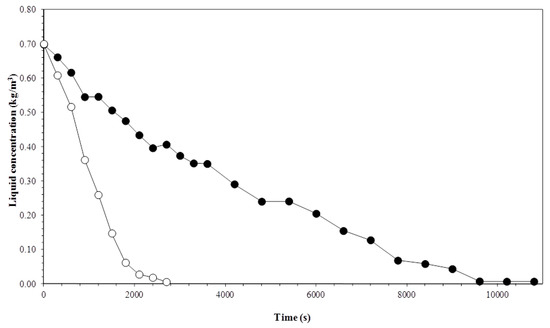
Figure 5.
Variation in the liquid column concentration with time and gas flow rate. Experiment conditions: initial biosurfactant concentration of 0.7 kg m−3 and temperature of 35 °C. Gas flow rate: (●) 3.3 × 10⁻⁷ m3 s−1; (○) 1 × 10⁻⁶ m3 s−1.
In the course of the experimental runs, there was a decrease in bubble rupturing, and marked reductions in surfactin concentration. Therefore, the biosurfactant was being removed from the solution and this removal results in higher rates of mass transfer due to the development of concentration gradients between the gas–liquid interface and the bulk solution. In the liquid column, the higher gas flow accelerated the surfactin concentration rate of reduction. Higher flow rates cause a greater number of bubbles in the liquid column, increasing the rate of formation of a gas–liquid surface area. Bubble surface area is very important for column operation, since surface materials become adsorbed in this region [10,32]. As for the thermal effect, there is a more rapid decrease in surfactin concentration when the column is operated at a lower temperature. This effect happens when the column operates with lower gas flows, because of the longer stay of the bubbles in the column, together with temperature, favoring the adsorption phenomenon.
3.2. Liquid Foam Concentration
Figure 6 and Figure 7 show the timed variation for the surfactin concentration at different temperatures, according to the gas flow. The average biosurfactant concentration in the foam was greater when the column operated with reduced gas flow. While the highest flow rates produced surfactin concentrations ranging from 1.5 to 3.0 kg m−3, for the lowest flows, the concentration varied from 6.0 to 20.0 kg m−3. Reduced gas flow rates allow the bubbles a longer stay in the foam column, therefore causing the least amount of solution drag by the bubbles. The top products obtained were two to thirty times more concentrated than the surfactin solution initially fed into the column.
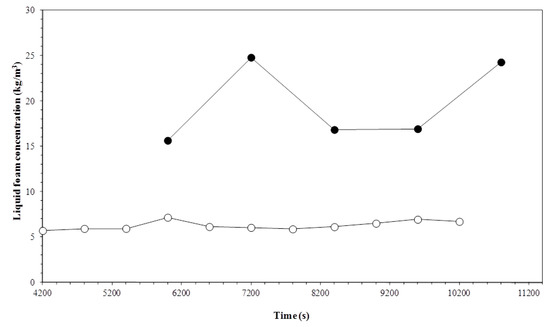
Figure 6.
Variation in the liquid foam concentration with time and temperature. Experiment conditions: Initial biosurfactant concentration of 0.7 kg m−3 and gas flow rate of 3.3 × 10⁻⁷ m3 s−1. Temperatures: (○) 15 °C; (●) 35 °C.
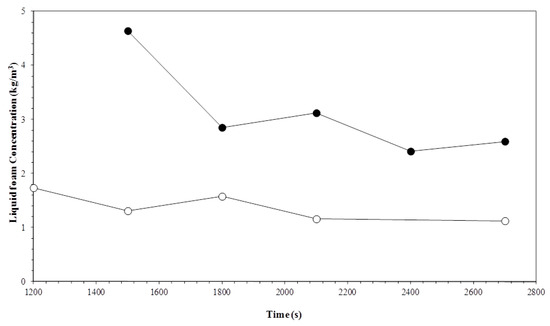
Figure 7.
Variation in the liquid foam concentration with time and temperature. Experiment conditions: Initial biosurfactant concentration of 0.7 kg m−3 and gas flow rate of 1 × 10⁻⁶ m3 s−1. Temperatures: (○) 15 °C; (●) 35 °C.
The highest operating temperatures produced the highest biosurfactant concentrations. Increased temperature reduces the viscosity of the solution containing the surfactin, which facilitates the drainage of the foam interstitial fluid. The increased drainage rate leads to drier foaming, increasing the importance of a surface-active material layer in the gas-liquid interface [32].
It is worth noting that, when operating the column with high gas flow (Figure 7), the first experimental point, referring to the initial surfactin concentration in the foam, appears to be higher during the entire run. This may be explained by the high bubble rupturing rate in the foam column, favoring the release of surfactin molecules adsorbed at the gas–liquid interface associated with high gas flow rates, enabling the higher biosurfactant dragging to the foam and consequently increasing its concentration in the bulk interstices.
3.3. Adsorption Isotherm
The Gibbs equation was used to calculate the biosurfactant surface concentration Γ in the liquid Cb, deriving polynomial equations adjusted in surface tension versus surfactin concentration graphs, at temperatures of 15 and 35 °C given in logarithmic scale [14]. Surface concentration curves for surfactin were plotted, acquiring Gibbs isotherms representing the equilibrium established between the biosurfactant molecules in liquid gas surface and those present in the solution [47,48]. The experimental points were adjusted according to the Langmuir adsorption isotherm model and the equation parameters Γmax (biosurfactant maximum concentration adsorbed on the liquid–gas surface) and Kd (equilibrium constant) were estimated.
For a system consisting of only one surface-active concentration, the equation describing the Langmuir model can be written for [47]:
It can be shown mathematically that the parameters â and K are equal to the inverse of the parameters Γmax and Kd, respectively. The isotherm parameters are shown in Table 1. The values â and K were used to input IP/ACF® software, indispensable for the acquisition of biosurfactant depletion curves in the liquid column.

Table 1.
Parameters â and K calculated from the parameters Γmax and Kd, estimated by the Langmuir adsorption model.
In Figure 8, the experimental points adjusting to the Langmuir adsorption curves can be observed, satisfactorily describing the isotherm. The curves show the natural tendency of the adsorption layers for reaching the saturation state, which is when the surface loses the ability to adsorb molecules from the biosurfactant. The loss of the adsorption capacity may be associated with temperature, which affects the adsorption mechanism of surfactin molecules. Table 1 shows that an increase of 20 °C in the temperature range was enough to reduce the maximum concentration of biosurfactant adsorption (Γmax) by approximately 1.2 times, thus justifying the exothermic nature of the adsorption mechanism of the surface-active molecule. It is worth mentioning that the values estimated for Γmax showed a magnitude order of 10−5 mol m−2. Monolayers adsorbing surfactants, describing the Langmuir isotherm model, commonly present the Γmax values in the order of 10−6 to 10−5 mol m−2 [16].
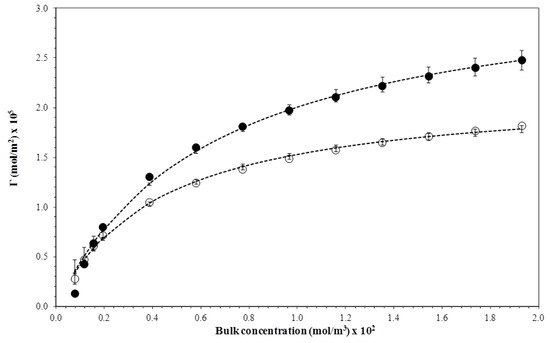
Figure 8.
Gibbs adsorption isotherms for the biosurfactant obtained at temperatures of (●) 15 °C and (○) 35 °C. Curves fitted by the Langmuir adsorption model.
3.4. Bubble Size Distribution in the Liquid Column
In order to obtain the depletion curves generated by the software IP/ACF®, an experimental determination of the gas bubble average diameter was necessary as entry parameter. The 18,000 and 60,000 bubble diameters were measured from digital images, obtained by optical Shadow Imaging for gas flows of 1 × 10⁻⁶ and 3.3 × 10⁻⁷ m3 s−1, respectively. Only the images with good definition were analyzed, and only the limpid bubbles were statistically treated. Figure 9 and Figure 10 show the bubble diameter distributions, obtained for different gas flows. With the bubble diameter distribution, it was possible to determine an average diameter of bubbles representing the group of images analyzed.
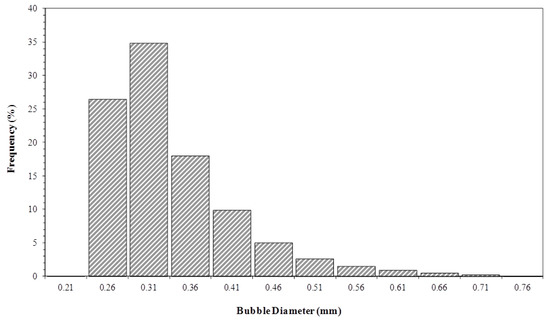
Figure 9.
Bubble size distribution in the liquid column. Initial biosurfactant concentration of 0.7 kg m−3 and gas flow rate of 3.3 × 10⁻⁷ m3 s−1.
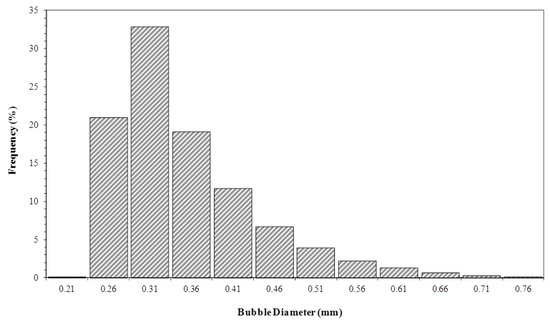
Figure 10.
Bubble size distribution in the liquid column. Initial biosurfactant concentration of 0.7 kg m−3 and gas flow rate of 1.0 × 10⁻⁶ m3 s−1.
The Sauter mean diameter was used to calculate the average size of bubbles and is defined as:
The Sauter mean diameter represents the relationship between the volume and the gas bubble area.
Respectively, the mean Sauter diameters of 0.37 and 0.39 mm for 3.3 × 10⁻⁷ and 1 × 10⁻⁶ m3 s−1 flow rates were obtained. It was observed that the average diameter of the bubbles showed a slight increase with the volumetric flow of gas. The increased flow expands the number of bubbles in the gas distributor, generating higher rates of coalescence, and consequently, leading to an upsurge in bubble diameter [32]. The constant value of balance surface tension may be responsible for the slight increase in bubble diameter [10], because the size distribution was obtained at the start of the experiment, when the biosurfactant solution balance surface tension was fairly constant, amounting to 27 mN m−1.
3.5. Comparison between Experimental and Simulated Data
Equations (4) and (8) were solved using volumetric mass transfer (kLa) determined by the Ozturk correlation [44]. The correlation is recommended for liquid columns with diameters inferior to 95 mm [32,43]. The column in this study had a 75-mm internal diameter. For kLa calculation, the Geankoplis correlation describing the diffusion of organic solutes in aqueous solution was used to determine the surfactin diffusion coefficient [46]. The values calculated were 2.35 × 10⁻¹⁰ and 3.98 × 10⁻¹⁰ m2 s−1 at 15 °C and 35 °C, respectively. The Langmuir adsorption model described the surfactin isotherm and its parameters experimentally estimated.
The model was solved considering that the biosurfactant concentration and the liquid column height were constant. This factor can be applied because the bubbles rise rapidly, therefore disregarding any variation in the process. Surface tension, density, and viscosity of the surfactin solution were also considered constant and equal to pure water. The physicochemical parameters were determined in the function of the bubbles and foam column operating temperatures. By the Sauter’s mean diameters for bubble size distribution, the bubble diameters were experimentally acquired.
Figure 11, Figure 12, Figure 13 and Figure 14 show a comparison between the experimental data and curves obtained by the model. The process was operated in semi-batch in 3.3 × 10⁻⁷ and 1 × 10⁻⁶ m3 s−1 gas flows and at the temperatures of 15 °C and 35 °C. The mathematical model satisfactorily described the experimental data, despite some small deviations arising from considerations taken to solve the mass balance equations.
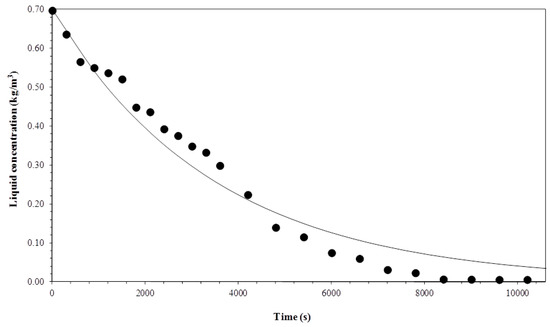
Figure 11.
Comparison between experimental data and the model for a gas flow rate of 3.3 × 10⁻⁷ m3 s−1 and temperature of 15 °C.
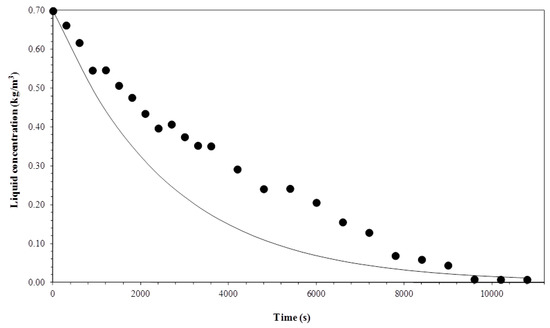
Figure 12.
Comparison between experimental data and the model for a gas flow rate of 3.3 × 10⁻⁷ m3 s−1 and temperature of 35 °C.
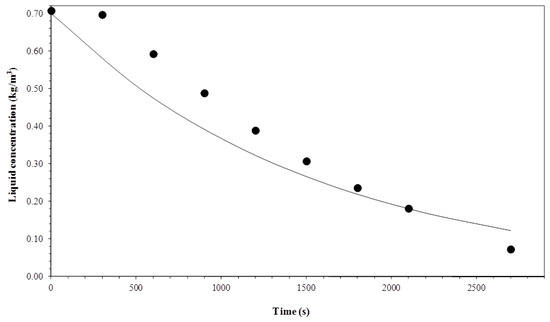
Figure 13.
Comparison between experimental data and the model for a gas flow rate of 1 × 10⁻⁶ m3 s−1 and temperature of 15 °C.
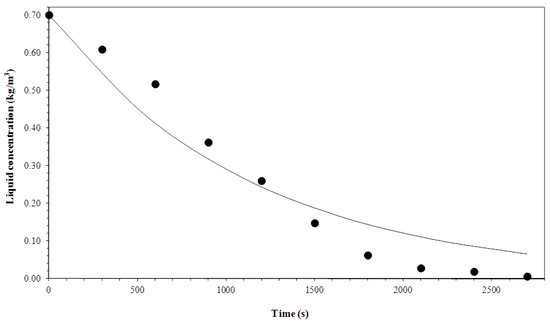
Figure 14.
Comparison between experimental data and the model for a gas flow rate of 1 × 10⁻⁶ m3 s−1 and temperature of 35 °C.
4. Conclusions
Surfactin fractionation in bubbles and foam column proved to be a viable process, a promising step to separate, concentrate, and recover amphiphilic molecules from diluted solutions. The process is effective when operating the column with reduced gas flows and low initial concentration. Under the experimental conditions used in this work, top products with two or thirty times greater concentration than the initial one was achieved. The highest biosurfactant concentrations were attained for higher operating temperatures.
The optical method allowed bubble size distribution ascertainment, and consequently, the Sauter mean diameter. It was observed that due to greater coalescence rates, bubble diameter increased with a higher gas flow.
It was possible to acquire and adjust the Gibbs adsorption isotherm curves for different temperatures according to the Langmuir adsorption isotherm model. The fit was satisfactory and the equation parameters were estimated. Therefore, there was evidence that surfactin molecules adsorb in monolayers in the liquid–gas interface.
The mathematical model presented in this paper can satisfactorily represent the experimental data for the biosurfactant concentration timed variation in the liquid column.
Author Contributions
R.F.P. conceived and designed the experiments, performed the experients, analyzed the data and wrote the paper; M.C.P.G. wrote the paper; C.C.S. conceived and designed the experiments, contributed reagents/materials and analyze the data.
Funding
This research was funded by the Coordination for the Improvement of Higher Education Personnel (CAPES).
Acknowledgments
The authors wish to thank the Coordination for the Improvement of Higher Education Personnel (CAPES) for their financial support.
Conflicts of Interest
The authors declare no conflict of interest.
Nomenclature
| Â | monolayer area/molecule (m2 kg−1) |
| Ab | gas bubble area (m2) |
| Ac | cross-sectional area (m2) |
| Cb | surfactant bulk concentration (kg m−3) |
| Cd | drainage liquid surfactant concentration (kg m−3) |
| CF | surfactant concentration in the interstitial liquid foam (kg m−3) |
| Cs | surfactant concentration in the layer around the bubbles (kg m−3) |
| D | foam column drainage fluid volumetric flow (m3 s−1) |
| db | diameter of bubbles (m) |
| Di | diffusion coefficient (m2 s−1) |
| F | liquid column dragged fluid volumetric flow (m3 s−1) |
| g | gravity acceleration (m s−2) |
| H | liquid column height (m) |
| K | equilibrium constant (m3 kg−1) |
| Kd | equilibrium constant (mol m−3) |
| kLa | volumetric mass transfer coefficient (s−1) |
| Mi | solute molar mass (kg mol−1) |
| ni | number of bubbles (-) |
| Q | gas flow rate (m3 s−1) |
| R | gas constant (J K−1 mol−1) |
| T | temperature (K) |
| V | liquid column volume (m3) |
| Vb | gas bubble volume (m3) |
| Vg | gas surface velocity (m s−1) |
| Greek Letters | |
| µl | liquid viscosity (Pa s) |
| Γ | surface concentration (mol m−2) |
| Γ | surface tension (mN m−1) |
| Γexit | surface concentration at the liquid column exit (mol m−2) |
| Γm | average surface concentration in the liquid column (mol m−2) |
| Γmax | maximum concentration in the adsorbed liquid gas interface (mol m−2) |
| εg | liquid column gas fraction (-) |
| ρg | gas density (kg m−3) |
| ρl | liquid density (kg m−3) |
| τ | bubble ascent time (s) |
| υ | bubbles ascent velocity (m s−1) |
References
- Atlaa, S.B.; Chen, C.Y.; Yang, J.; Chen, C.C.; Sun, A.C.; Lin, K.H.; Maity, J.P.; Pan, W.; Cheng, K.C. Foam fractionation of crystal growth for nanotechnology. Chem. Eng. J. 2012, 184, 333–341. [Google Scholar] [CrossRef]
- Brown, A.K.; Kaul, A.; Varley, J. Continuous foaming for protein recovery: Part II. Selective recovery of proteins from binary mixtures. Biotechnol. Bioeng. 1999, 62, 291–300. [Google Scholar] [CrossRef]
- Brown, L.; Narsimhan, G.; Wankat, P.C. Foam fractionation of globular proteins. Biotechnol. Bioeng. 1990, 036, 947–959. [Google Scholar] [CrossRef] [PubMed]
- Huang, D.; Liu, W.; Wu, Z.; Zhao, Y.; Yin, H.; Ding, L.; Hu, N.; Li, H.; Zheng, H. The separation of catechol and phenol with each other by two-stage batch foam fractionation. Chem. Eng. J. 2017, 308, 683. [Google Scholar] [CrossRef]
- Kamalanathan, I.D.; Martin, P.J. Competitive adsorption of surfactant–protein mixtures in a continuous stripping mode foam fractionation column. Chem. Eng. Sci. 2016, 146, 291–301. [Google Scholar] [CrossRef]
- Lu, K.; Li, R.; Wu, Z.; Hou, K.; Du, X.; Zhao, Y. Wall effect on rising foam drainage and its application to foam separation. Sep. Purif. Technol. 2013, 118, 710. [Google Scholar] [CrossRef]
- Lucena, S.L. Efeito do Refluxo Externo no Fracionamento de Soluções Diluídas de Proteínas em Colunas de Bolhas e Espuma. Master’s Thesis, University of Campinas, Campinas, Brazil, 1995. [Google Scholar]
- Santana, C.C. Separação cromatográfica. Braz. J. Chem. Eng. 1994, 5, 1. [Google Scholar]
- Silva, M.T.S.; Soares, C.M.F.; Lima, A.S.; Santana, C.C. Integral production and concentration of surfactin from Bacillus sp. ITP-001 by semi-batch foam fractionation. Biochem. Eng. J. 2015, 104, 91–97. [Google Scholar] [CrossRef]
- Rosa, P.T.V.; Santana, C.C.; Carbonell, R.G. Determination of the liquid pool surfactant and protein concentration for semi-batch foam fractionation columns. Braz. J. Chem. Eng. 2007, 24, 1. [Google Scholar] [CrossRef]
- Tobin, S.T.; Weaire, D.; Hutzler, S. Theoretical analysis of the performance of a foam fractionation column. Proc. R. Soc. A 2014, 470, 470. [Google Scholar] [CrossRef]
- Huang, D.; Liu, W.; Wu, Z.; Liu, G.; Yin, H.; Chen, Y.; Hu, N.; Jia, L. Removal of pyridine from its wastewater by using a novel foam fractionation column. Chem. Eng. J. 2017, 321, 151. [Google Scholar] [CrossRef]
- Lucena, S.L.; Santana, C.C. Separation of bovine serum albumin and cytochrome c using gas-liquid interface adsorption. Hungar. J. Ind. Chem. 2000, 28, 81–84. [Google Scholar]
- Perna, R.F. Fractionation of Surfactin on a Bubble and Foam Column. Master’s Thesis, University of Campinas, Campinas, Brazil, 2010. [Google Scholar]
- Grieves, R.B. Treatise on Analytical Chemistry, 2nd ed.; Wiley: New York, NY, USA, 1982; Volume 5, p. 371. [Google Scholar]
- Lemlich, R. Adsorptive Bubble Separation Techniques; Academic Press: New York, NY, USA, 1972. [Google Scholar]
- Thomas, A.; Winkler, A. Topics in Enzyme and Fermentation Biotechnology; John Wiley and Sons, Inc.: Hoboken, NJ, USA, 1977. [Google Scholar]
- Chen, C.; Baker, S.C.; Darton, R.C. Batch production of biosurfactant with foam fractionation. J. Chem. Tech. Biotechnol. 2006, 81, 1923. [Google Scholar] [CrossRef]
- Davis, D.A.; Lynch, H.C.; Varley, J. The application of foaming for the recovery of Surfactin from B. subtilis ATCC 21332 cultures. Enzyme Microb. Technol. 2001, 28, 346–354. [Google Scholar] [CrossRef]
- Guo, S.; Wu, Z.; Liu, W.; Huang, D.; Li, H.; Hu, N.J. Enrichment and isolation of phenol from its aqueous solution using foam fractionation. Ind. Eng. Chem. 2016, 36, 180. [Google Scholar] [CrossRef]
- Huang, D.; Wu, Z.L.; Liu, W.; Hu, N.; Li, H.Z. A novel process intensification approach of recovering creatine from its wastewater by batch foam fractionation. Chem. Eng. Process. 2016, 104, 13–21. [Google Scholar] [CrossRef]
- Kang, S.; Li, R.; Wu, Z.; Guo, S.; Gao, Y. Effective improvement of defoaming efficiency using foam breaker with synthetic sponge cylinders in foam fractionation. Chem. Eng. Process. 2016, 106, 26. [Google Scholar] [CrossRef]
- Krishna, R.; Van Baten, J.M. Mass Transfer in Bubble Column. Catal. Today 2003, 67, 79–80. [Google Scholar] [CrossRef]
- Li, R.; Zhang, Y.; Chang, Y.; Wu, Z.; Wang, Y.; Chen, X.; Wang, T. Role of foam drainage in producing protein aggregates in foam fractionation. Colloids Surf. B 2017, 158, 562. [Google Scholar] [CrossRef]
- Liu, W.; Zhang, M.; Lv, Y.; Tian, S.; Li, N.; Wu, Z.J. Foam fractionation for recovering whey soy protein from whey wastewater: Strengthening foam drainage using a novel internal component with superhydrophobic surface. Taiwan Inst. Chem. Eng. 2017, 78, 39. [Google Scholar] [CrossRef]
- Mouza, A.A.; Dalakoglou, G.K.; Paras, S.V. Effect of liquid properties on the performance of bubble column reactors with fine pore spargers. Chem. Eng. Sci. 2005, 60, 1465–1475. [Google Scholar] [CrossRef]
- Pohorecki, R.; Moniuk, W.; Bielski, P.; Sobieszuk, P.; Dabrowiecki, G. Bubble diameter correlation via numerical experiment. Chem. Eng. J. 2005, 113, 35–39. [Google Scholar] [CrossRef]
- Tian, S.; Wu, Z.; Liu, W.; Zhang, M.; Lv, Y.; Xu, Y.; Liu, G.; Zhao, Y.J. Effective recovery of casein from its highly diluted solution by using a technology of foam fractionation coupled with isoelectric precipitation. Food Eng. 2018, 216, 72. [Google Scholar] [CrossRef]
- Vandu, C.O.; Krishna, R. Influence of scale on the volumetric mass transfer coefficients in bubble columns. Chem. Eng. Process. 2004, 43, 575–579. [Google Scholar] [CrossRef]
- Veera, U.P.; Kataria, K.L.; Joshi, J.B. Effect of superficial gas velocity on gas hold-up profiles in foaming liquids in bubble column reactors. Chem. Eng. J. 2004, 99, 53–58. [Google Scholar] [CrossRef]
- Zhang, Z.; Wu, Z.; Liu, G.J. Interfacial adsorption of methyl orange in liquid phase of foam fractionation using dodecyl dimethyl betaine as the collector. Ind. Eng. Chem. 2015, 28, 184. [Google Scholar] [CrossRef]
- Rosa, P.T.V. Fracionamento de Proteínas e Outros Tensoativos em Colunas de Bolhas e Espumas. Ph.D. Thesis, University of Campinas, Campinas, Brazil, 1996. [Google Scholar]
- Lugon, J., Jr.; Silva Neto, A.; Santana, C.C. A hybrid approach with artificial neural networks, levenberg-marquardt and simulated annealing methods for the solution of gas-liquid adsorption inverse problems. Inverse Probl. Sci Eng. 2009, 17, 85–96. [Google Scholar] [CrossRef]
- Alhseinat, E.; Amr, M.; Jumah, R.; Banat, F. Removal of MDEA foam creators using foam fractionation: Parametric study coupled with foam characterization. J. Nat. Gas Sci. Eng. 2015, 26, 502–509. [Google Scholar] [CrossRef]
- Li, R.; Chen, X.; Chang, Y.; Zhang, L.; Zhang, Y.; Zhu, Y.; Wang, T. Increase of bubble size playing a critical role in foam-induced protein aggregation: Aggregation of BSA in foam fractionation. Chem. Eng. Sci. 2017, 174, 387. [Google Scholar] [CrossRef]
- Li, R.; Ding, L.; Wu, Z.; Wang, Y.; Liu, W.; Wang, Y. β-cyclodextrin assisted two-stage foam fractionation of bromelain from the crude extract of pineapple peels. Ind. Crops Prod. 2016, 94, 233. [Google Scholar] [CrossRef]
- Liu, W.; Wu, Z.; Wang, Y.; Li, R.; Huang, D. Isolation of soy whey proteins from isoflavones in the concentrated solution using foam fractionation. Sep. Purif. Technol. 2015, 149, 31. [Google Scholar] [CrossRef]
- Rienzo, M.A.D.; Kamalanathan, I.D.; Martin, P.J. Comparative study of the production of rhamnolipid biosurfactants by B. thailandensis E264 and P. aeruginosa ATCC 9027 using foam fractionation. Process Biochem. 2016, 51, 820. [Google Scholar] [CrossRef]
- Arima, K.; Kakinuma, A.; Tamura, G. Surfactin, a crystalline peptidelipid surfactant produced by Bacillus subtilis: Isolation, characterization and its inhibition of fibrin clot formation. Biochem. Biophys. Res. Commun. 1968, 31, 488. [Google Scholar] [CrossRef]
- Mulligan, C. Environmental applications for biosurfactants. Environ. Pollut. 2005, 133, 183. [Google Scholar] [CrossRef]
- Peypoux, F.; Bonmatin, J.M.; Wallach, J. Recent trends in the biochemistry of surfactin. J. Appl. Microbiol. Biotechnol. 1999, 51, 553. [Google Scholar] [CrossRef]
- Ward, A.F.H.; Tordai, L.J. Time-Dependence of Boundary Tensions of Solutions I. The Role of Diffusion in Time-Effects. Chem. Phys. 1946, 14, 453. [Google Scholar]
- Deckwer, W.D.; Schumpe, A. Improved tools for bubble column reactor design and scale-up. Chem. Eng. Sci. 1993, 48, 889. [Google Scholar] [CrossRef]
- Ozturk, S.S.; Schumpe, A.; Deckwer, W.D. Organic liquids in a bubble column: Holdups and mass transfer coefficients. AIChe J. 1987, 33, 1473. [Google Scholar] [CrossRef]
- Du Nouy, P.L. A new apparatus for measuring surface tension. J. Gen. Physiol. 1919, 5, 521. [Google Scholar] [CrossRef]
- Geankoplis, C.J. Transport Processes and Unit Operations; Prentice-Hall International: Upper Saddle River, NJ, USA, 1993. [Google Scholar]
- Hamilton, M. Competitive Adsorption of Ethoxylated Alcohol Surfactants to Air-Water Interfaces. Master’s Thesis, North Carolina State University, Raleigh, NV, USA, 1989. [Google Scholar]
- Florence, A.T.; Attwood, D. Physicochemical Principles of Pharmacy; Royal Pharmaceutical Society of Great Britain, Pharmaceutical Press: London, UK, 2006. [Google Scholar]
© 2019 by the authors. Licensee MDPI, Basel, Switzerland. This article is an open access article distributed under the terms and conditions of the Creative Commons Attribution (CC BY) license (http://creativecommons.org/licenses/by/4.0/).