3.1. Residual Moisture Content of Dried Mexican Kefir Grains
The residual moisture content of dried MKG is an important factor that affects the long-term stability of the product and its shelf life. Our analysis of the % RMC of the dried MKG is shown in
Table 3. The results show that freezing time, freezing temperature, and pressure in the four selected levels did not have a significant effect on this response variable, but lyophilization time did have a significant effect for all four levels (
p = 0.00163 < 0.1 and
F = 9.62136 >
Fcrit = 2.605525;
p = 0.00163 < 0.05, and
F = 9.62136 >
Fcrit 3.490295). This finding is consistent with the conclusions of other researchers [
34,
35,
36,
37,
38], who indicated that secondary drying (desorption) in the freeze-drying process plays a significant role in the desired moisture content of the final product.
The max changing range (173.03) of the lyophilization time in this analysis was the largest among the range of the four variables (R′). This indicates that the lyophilization time plays an important role in affecting the % RMC of dried MKG. The range (76.39) for freezing time was larger than those of the remaining two factors. This shows that freezing time is the second-most important factor that affects the residual moisture in the dried product.
According to the multiple regression analysis of the L
164
4 orthogonal experiments results, the regression equation for the residual moisture content of dried MKG is obtained as follows.
In this equation, the square of the correlation coefficient (R2) was 0.9974. The coefficient (38.85) of lyophilization time was the largest among the coefficients of the four variables. This also indicates that the lyophilization time plays an important role in affecting the % RMC of dried MKG. On the other hand, the coefficients 36.60 and 12.70 for pressure and freezing time, respectively, were the largest than those of the remaining factors it can be showed with p-values for each coefficient.
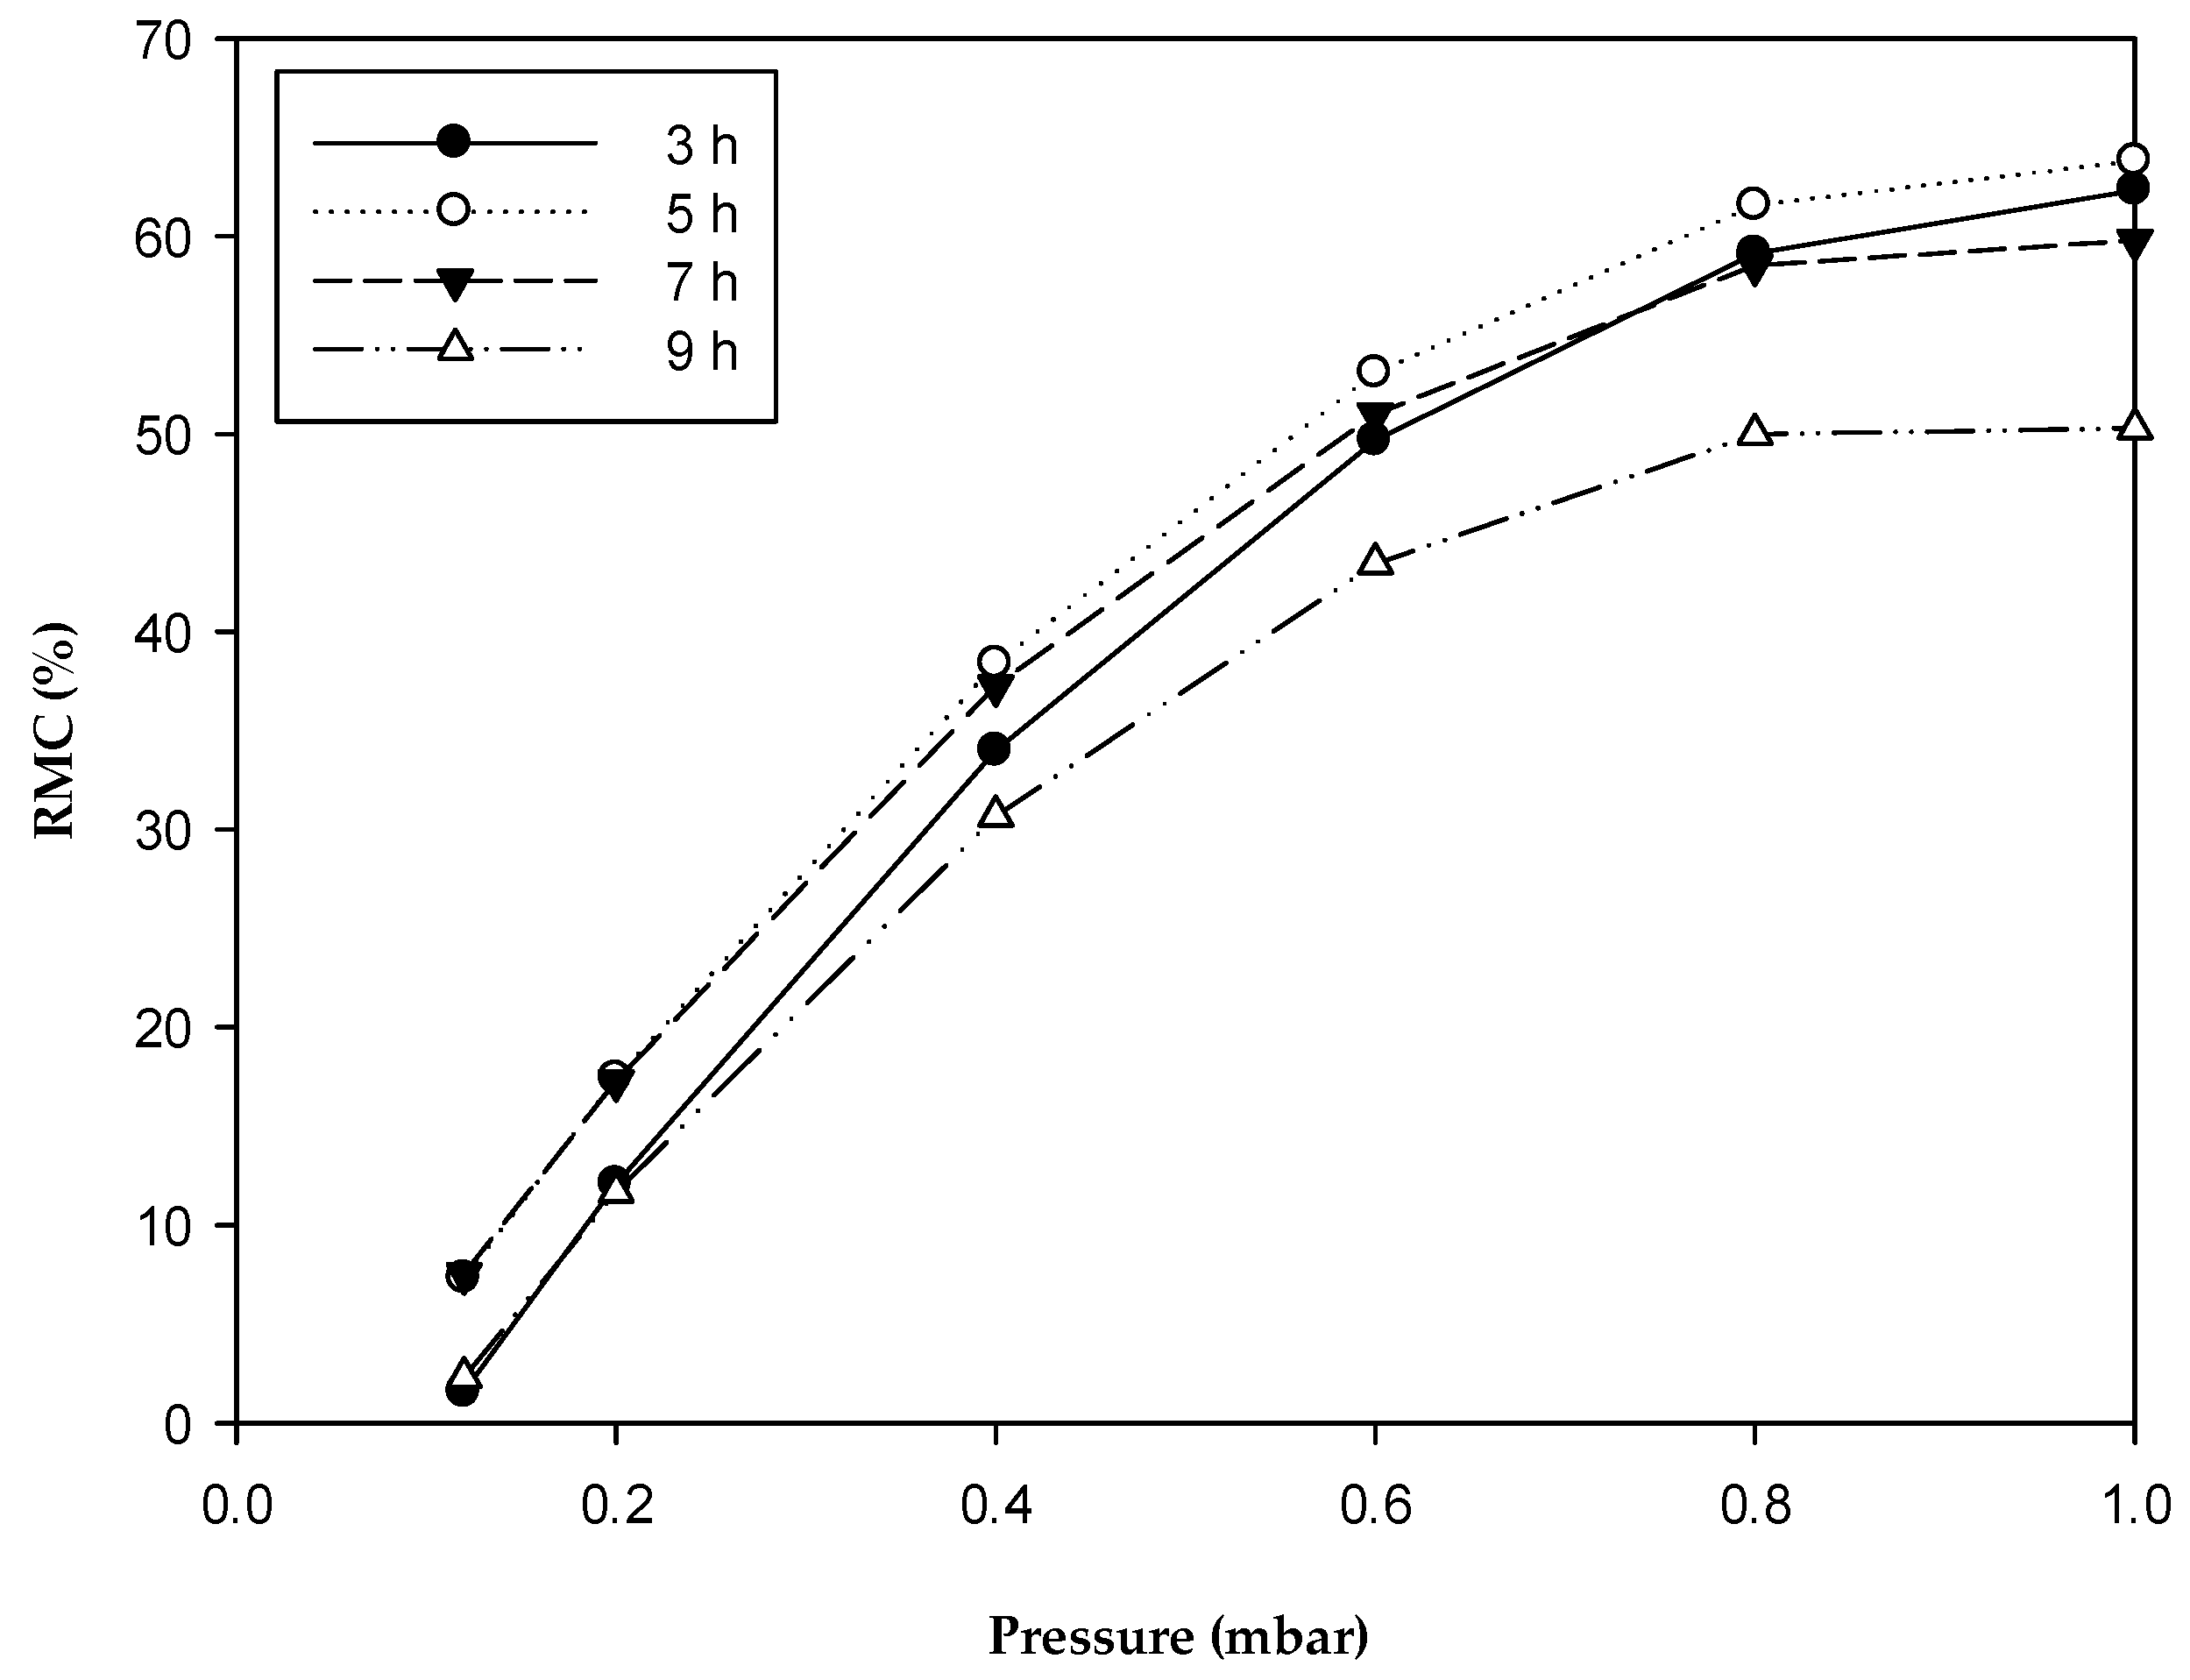
According to Equation (1), the predicted % RMC values of dried MKG with different freezing times and pressures are shown in
Figure 1. The lyophilization time and freezing temperature in the equation were 5 h and −20 °C, respectively.
Figure 1 shows that % RMC increases more with increased pressure and with a freezing time of 5 h. However, we observed that as when the pressure was less than 0.1, the % RMC decreased.
Table 4 shows the experimental and predicted % RMC of dried MKG and the error differences. The smallest value obtained in the experimental results was 2.38 with a freezing time of 5 h, freezing temperature of −40 °C, pressure of 0.2 mbar, and lyophilization time of 20 h. The error relative difference between the experimental and predicted % RMC was −15.29%.
3.2. Water Activity of Dried Mexican Kefir Grains
Water activity (a
w) in the dried MKG is one the most important factors that affect the quality and probiotic viability during the storage of the dried product because, during the drying processes, the decrease in water activity damages the bacterial structures, decreasing their viability [
39]. If the a
w is below 0.60, complete inhibition of microbial growth and lipid oxidation are assured in food products during storage [
40]. The water activity is provided in
Table 4. For most of the experiments, the water activity was below 0.6.
The data obtained in this study are analyzed in
Table 5. The water activity of the dried MKG was significantly influenced (
p < 0.1 and
F = 6.64924 >
Fcrit = 2.605525 and
p = 0.00163 < 0.05 and
F = 6.64924 >
Fcrit 3.490295) by the four levels of the lyophilization time. This finding is consistent with previous research showing that during freeze-drying, extremely low water activity values are obtained because free water is frozen and low drying temperatures prevent thermal and enzymatic degradation of the final product [
41,
42].
The maximum rate of change (2.603) for the lyophilization time in this analysis was the largest among the range of the four variables. This indicates that the lyophilization time plays an important role in affecting the aw of dried MKG. The range (1.402) obtained for pressure was larger than those of the remaining two factors shown, which means that pressure is another factor that significantly affects this response variable.
The equation for the water activity using multiple regression is
The
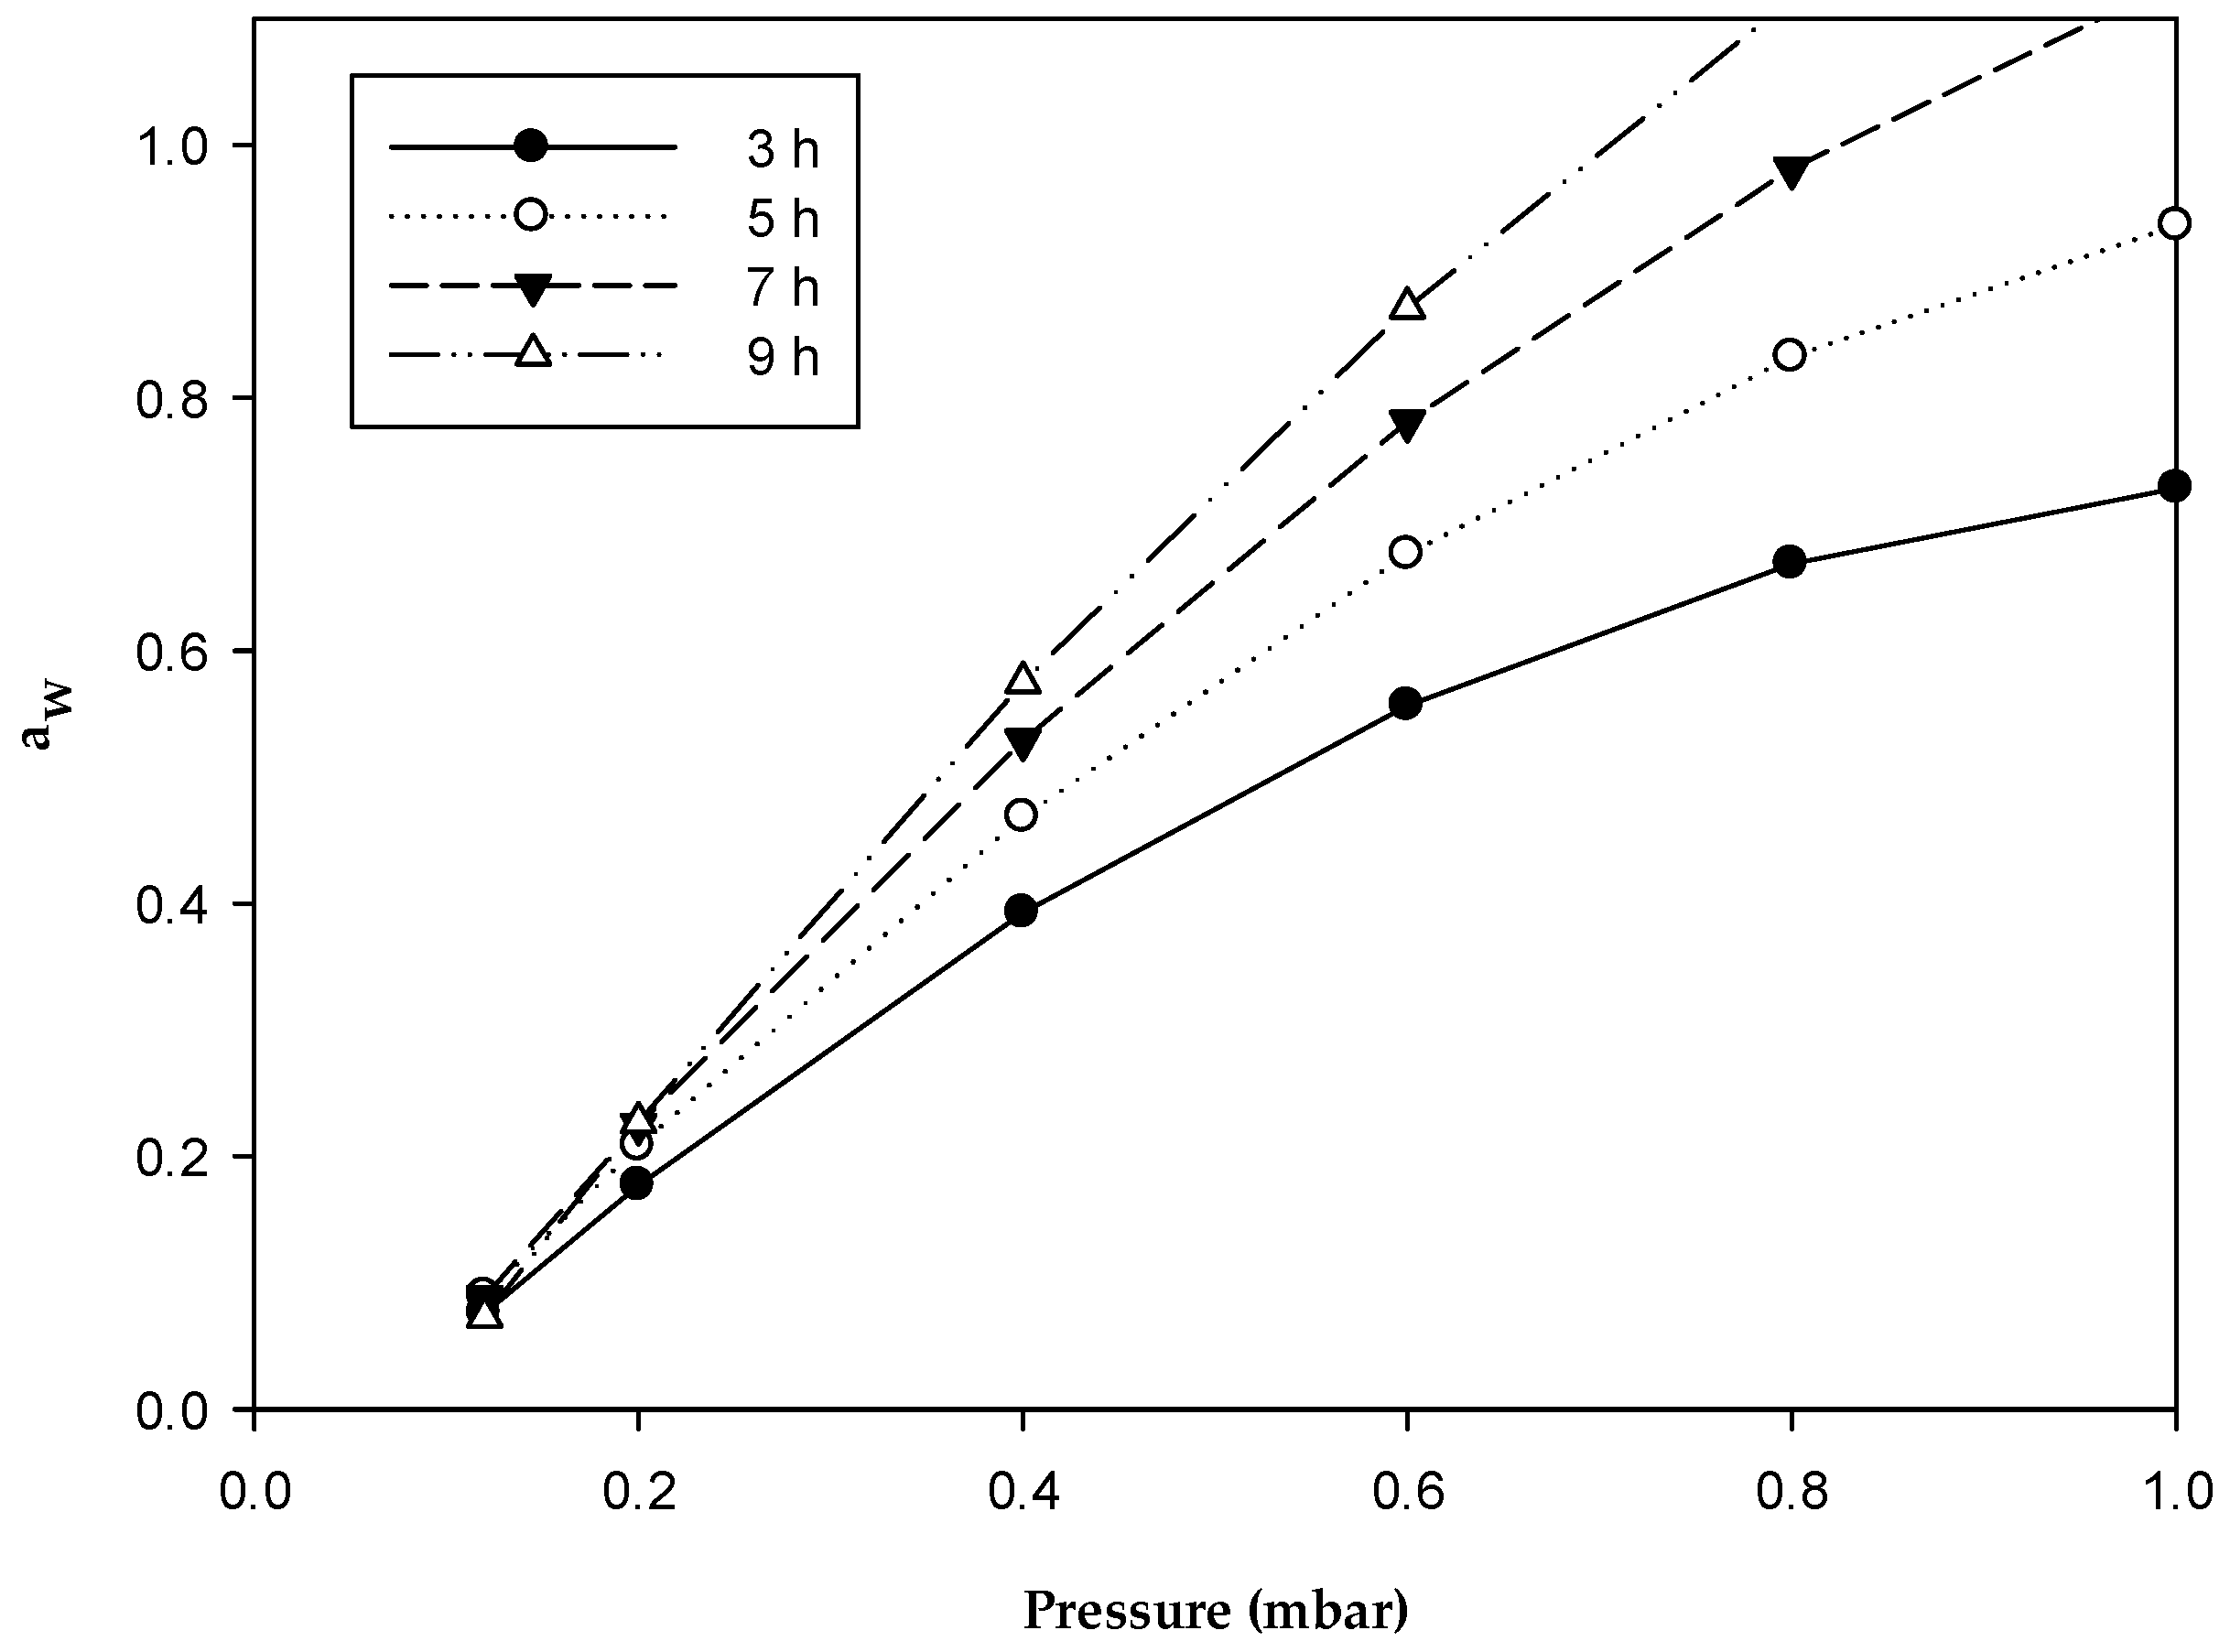
R2 for Equation (2) was 0.9979. The coefficient of the lyophilization time (0.3560) indicates that the lyophilization time plays the most important role in affecting the water activity of the dried MKG. The relationship between freezing time and pressure was obtained using Equation (2) when the freezing temperature and lyophilization time were
20 °C and 5 h, respectively (
Figure 2). We found that the water activity decreased to almost zero under low pressure and a freezing time of 3 h when the other two factors were kept constant.
In
Table 4, the experimental water activity is compared with the predicted water activity. The smallest value obtained in the experimental result was 0.076 with a freezing time of 9 h, freezing temperature of −80 °C, pressure of 0.2 mbar, and lyophilization time of 15 h. The error relative difference between the experimental and predicted a
w was −22.63% in test number 16.
3.3. Color Difference of Dried Mexican Kefir Grains
Color is the first judgment and major quality attribute in dried foods, because its change indicates that certain components in the product might have deteriorated [
43,
44,
45]. In this study, the reference standard was a fresh sample of MKG, for which the
L*,
a*, and
b* values were 35.28, −1.15, and 2.84, respectively. The analysis of color data is shown in
Table 6. In this table,
R′ is the maximum difference among the four levels for each factor. The larger the
R′, the more significant the effects.
Table 6 shows that lyophilization time affects the lightness (
L* value), whereas
a* is mostly affected by pressure. However, yellowness (
b* value) is more influenced by lyophilization time and pressure than the other two variables: freezing temperature and lyophilization time. These results differ from those reported in other studies that reported that color parameters are affected by freezing and drying time [
46].
The results in
Table 6 reveal that
L*,
a*,
b*, and ΔE (color difference) of dried MKG are affected by pressure. This can be noted, for example, in the analysis of the color difference influenced by pressure (
p = 0.07176 < 0.1 and F = 3.01767 > Fcrit = 2.605525), whereas the other three parameters were not significant (
p < 0.1 and
F >
Fcrit = 2.605525 and
p < 0.05 and
F >
Fcrit = 3.490295) for this response variable. This change is seen in
R′.
The equation for color difference (ΔE) of the dried product using the multiple regression analysis is
The
R2 for Equation (3) is 0.9666.
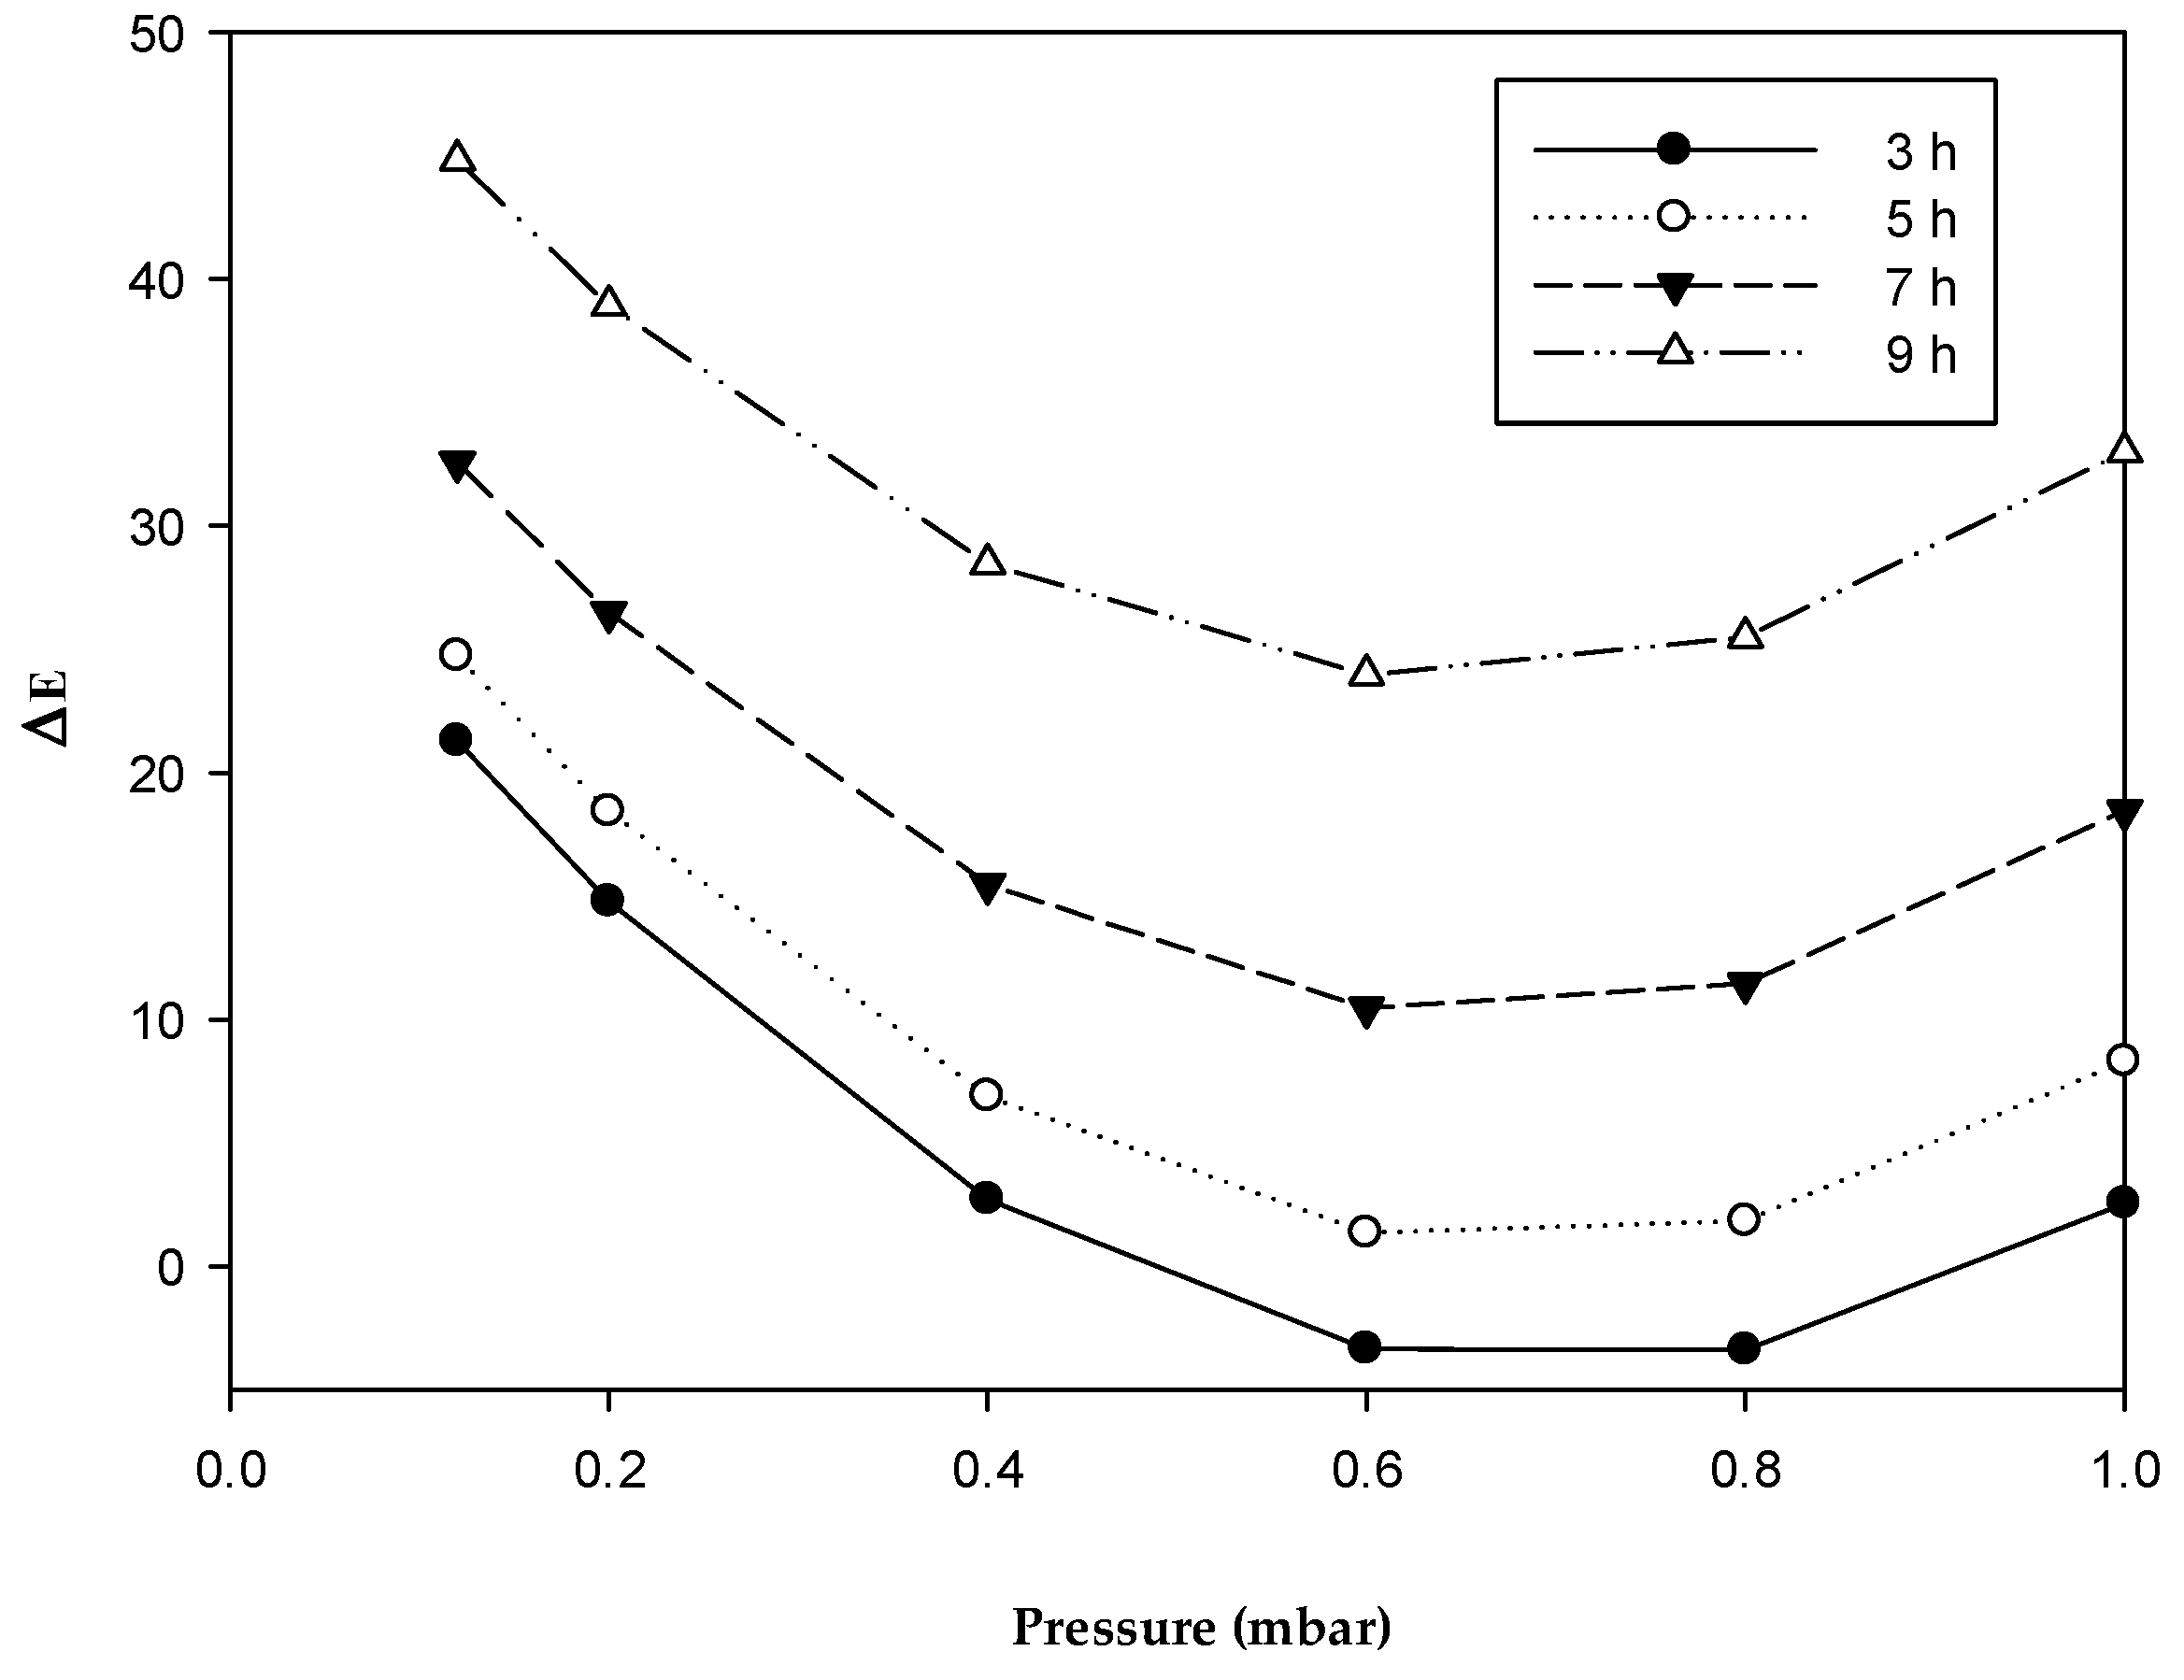
Figure 3 provides the relationship among color difference (ΔE), freezing time, and pressure at freezing temperature −20 °C and lyophilization time of 5 h. At the same freezing time, the predicted color difference decreases with pressure increase until a pressure of 0.6 mbar, and remains constant up to a pressure of 0.8. The minimum ΔE is obtained with freezing time from 3 h. The coefficient of pressure, 21.51, indicates that the pressure plays the most important role in affecting color difference of the dried MKG.
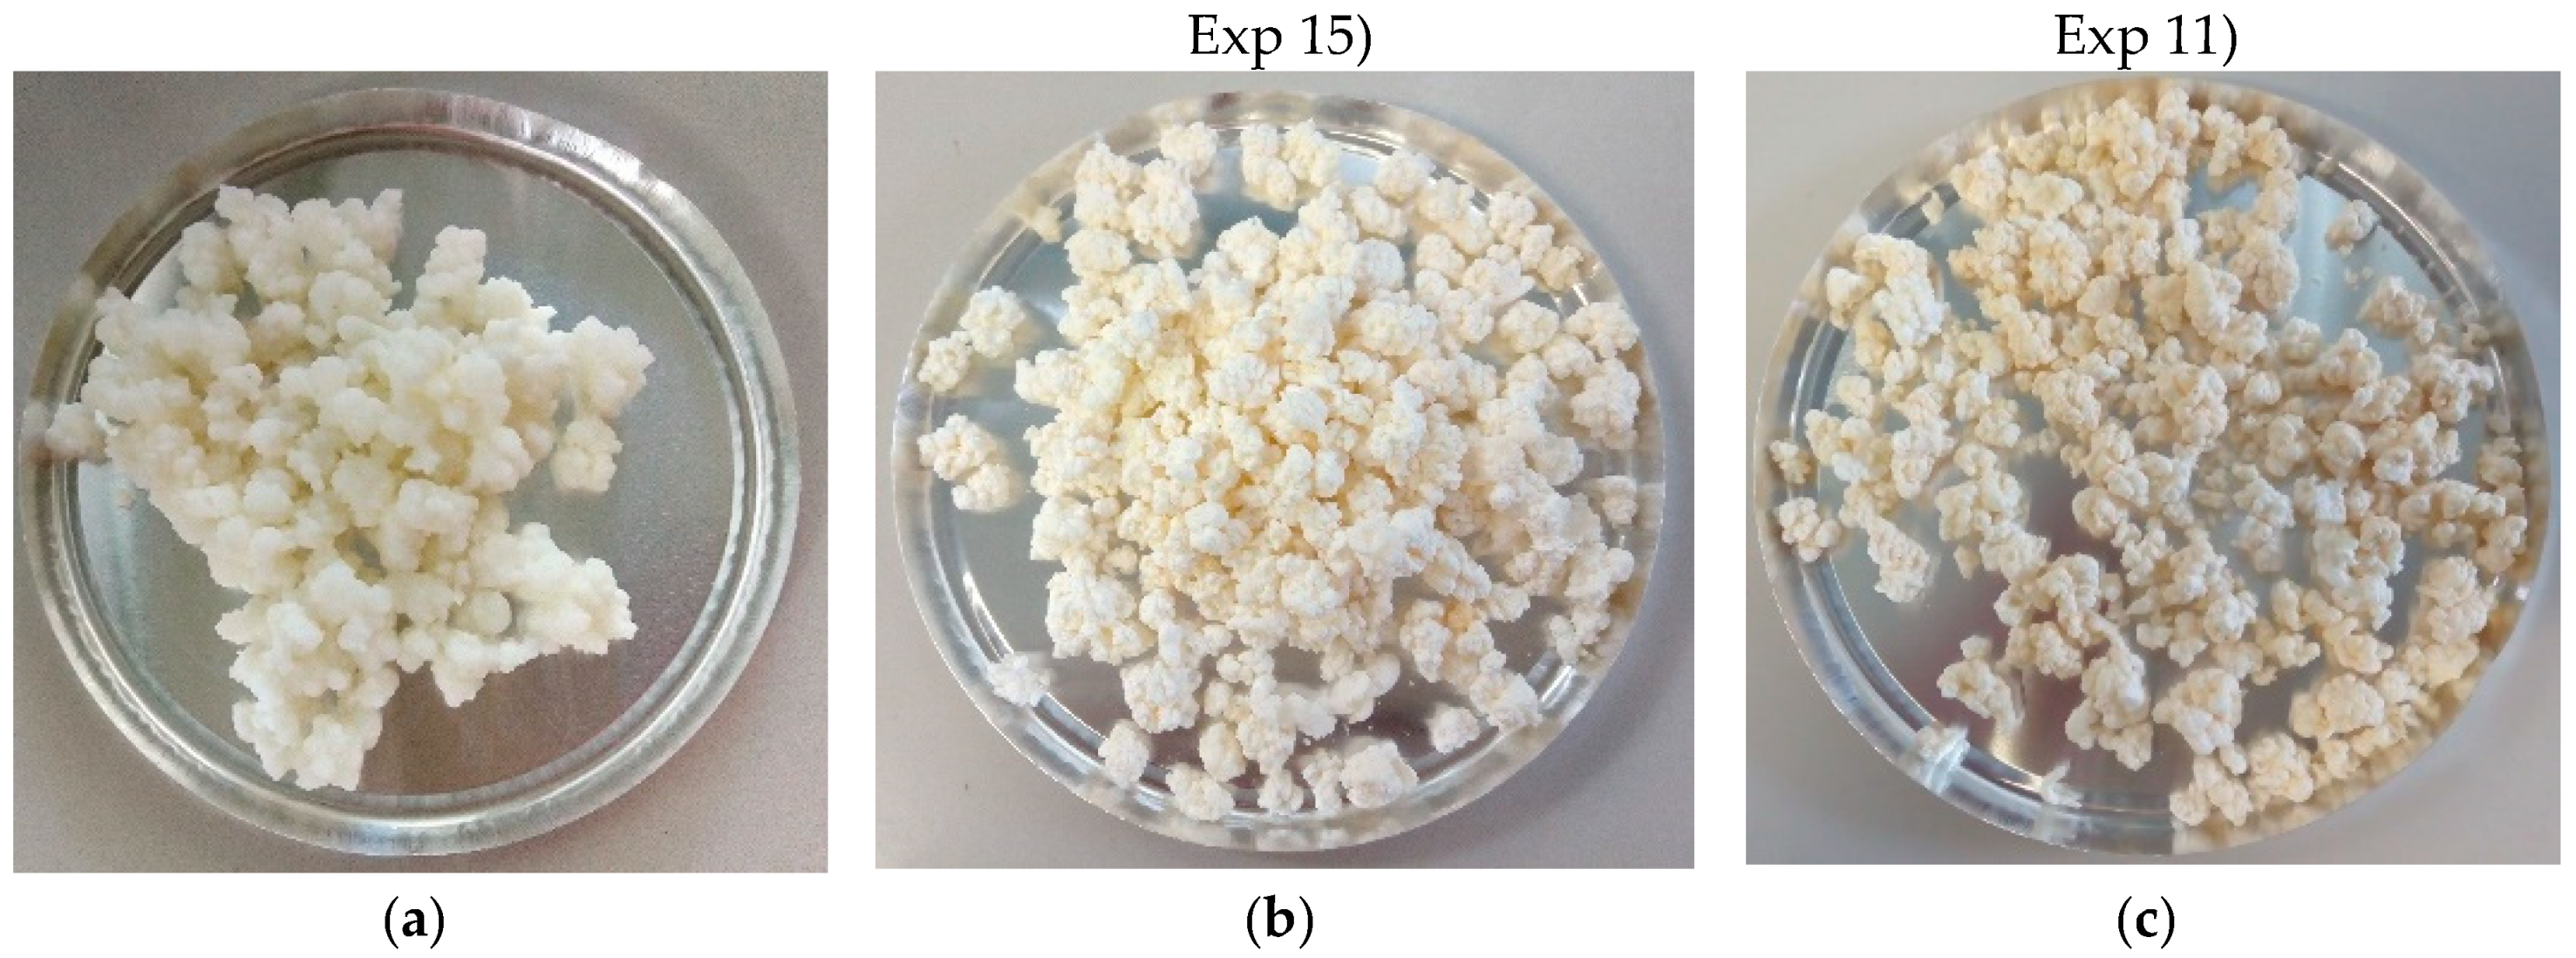
Table 4 compares the experimental ΔE of dried MKG with the predicted ΔE. The lowest ΔE was 3.80 (Experiment 15) at freezing time 9 h, freezing temperature −60 °C, pressure 0.4 mbar, and lyophilization time 20 h. The maximum ΔE was 22.17 (Experiment 11).
Figure 4 shows visual color images of MKG; the color of dried MKG with the lowest ΔE (Experiment 15) was very close to that of the fresh sample.
3.4. Survival of Probiotic Microorganism of Dried Mexican Kefir Grains
The survival rate of microorganisms after freeze-drying requires adequate stabilization processes to avoid bacterial damage or death [
47]. This is the most important requirement for a product to be considered probiotic. However, the survival rate of microorganisms easily decreases due to the stress to which bacteria are subjected during freeze-drying. For a food to be considered probiotic, it must contain at least 10
6 colony forming units per gram (6 log cfu/g) of food. Counts above 8 log (cfu/g) have been suggested to ensure probiotic effects [
48,
49,
50]. In this research, the survival rate of microorganisms was investigated under different experimental drying conditions. In this analysis, the initial value of survival of probiotic microorganisms in the fresh sample of MKG was 9.05 and log (cfu/g) for LAB and 8.90 log (cfu/g) for yeasts.
The results in
Table 7 show that
R′ is the maximum difference among the four levels for each factor. The max changing range (6.57) of pressure was the largest among the range of the four variables. This indicates that pressure plays an important role in affecting the survival LAB of dried MKG. The range (5.60) for freezing time was larger than those of the remaining two factors. This shows that freezing time is another important factor that affects the survival LAB in the dried product.
Table 7 shows that although the four factors do not have a significant influence (
p < 0.1 and
F <
Fcrit = 2.605525, neither
p > 0.05 nor F < Fcrit = 3.490295) on the survival log (cfu/g) of yeasts of dried MKG, the greatest effect was observed in
R′, as this variable was affected by the pressure and freezing time.
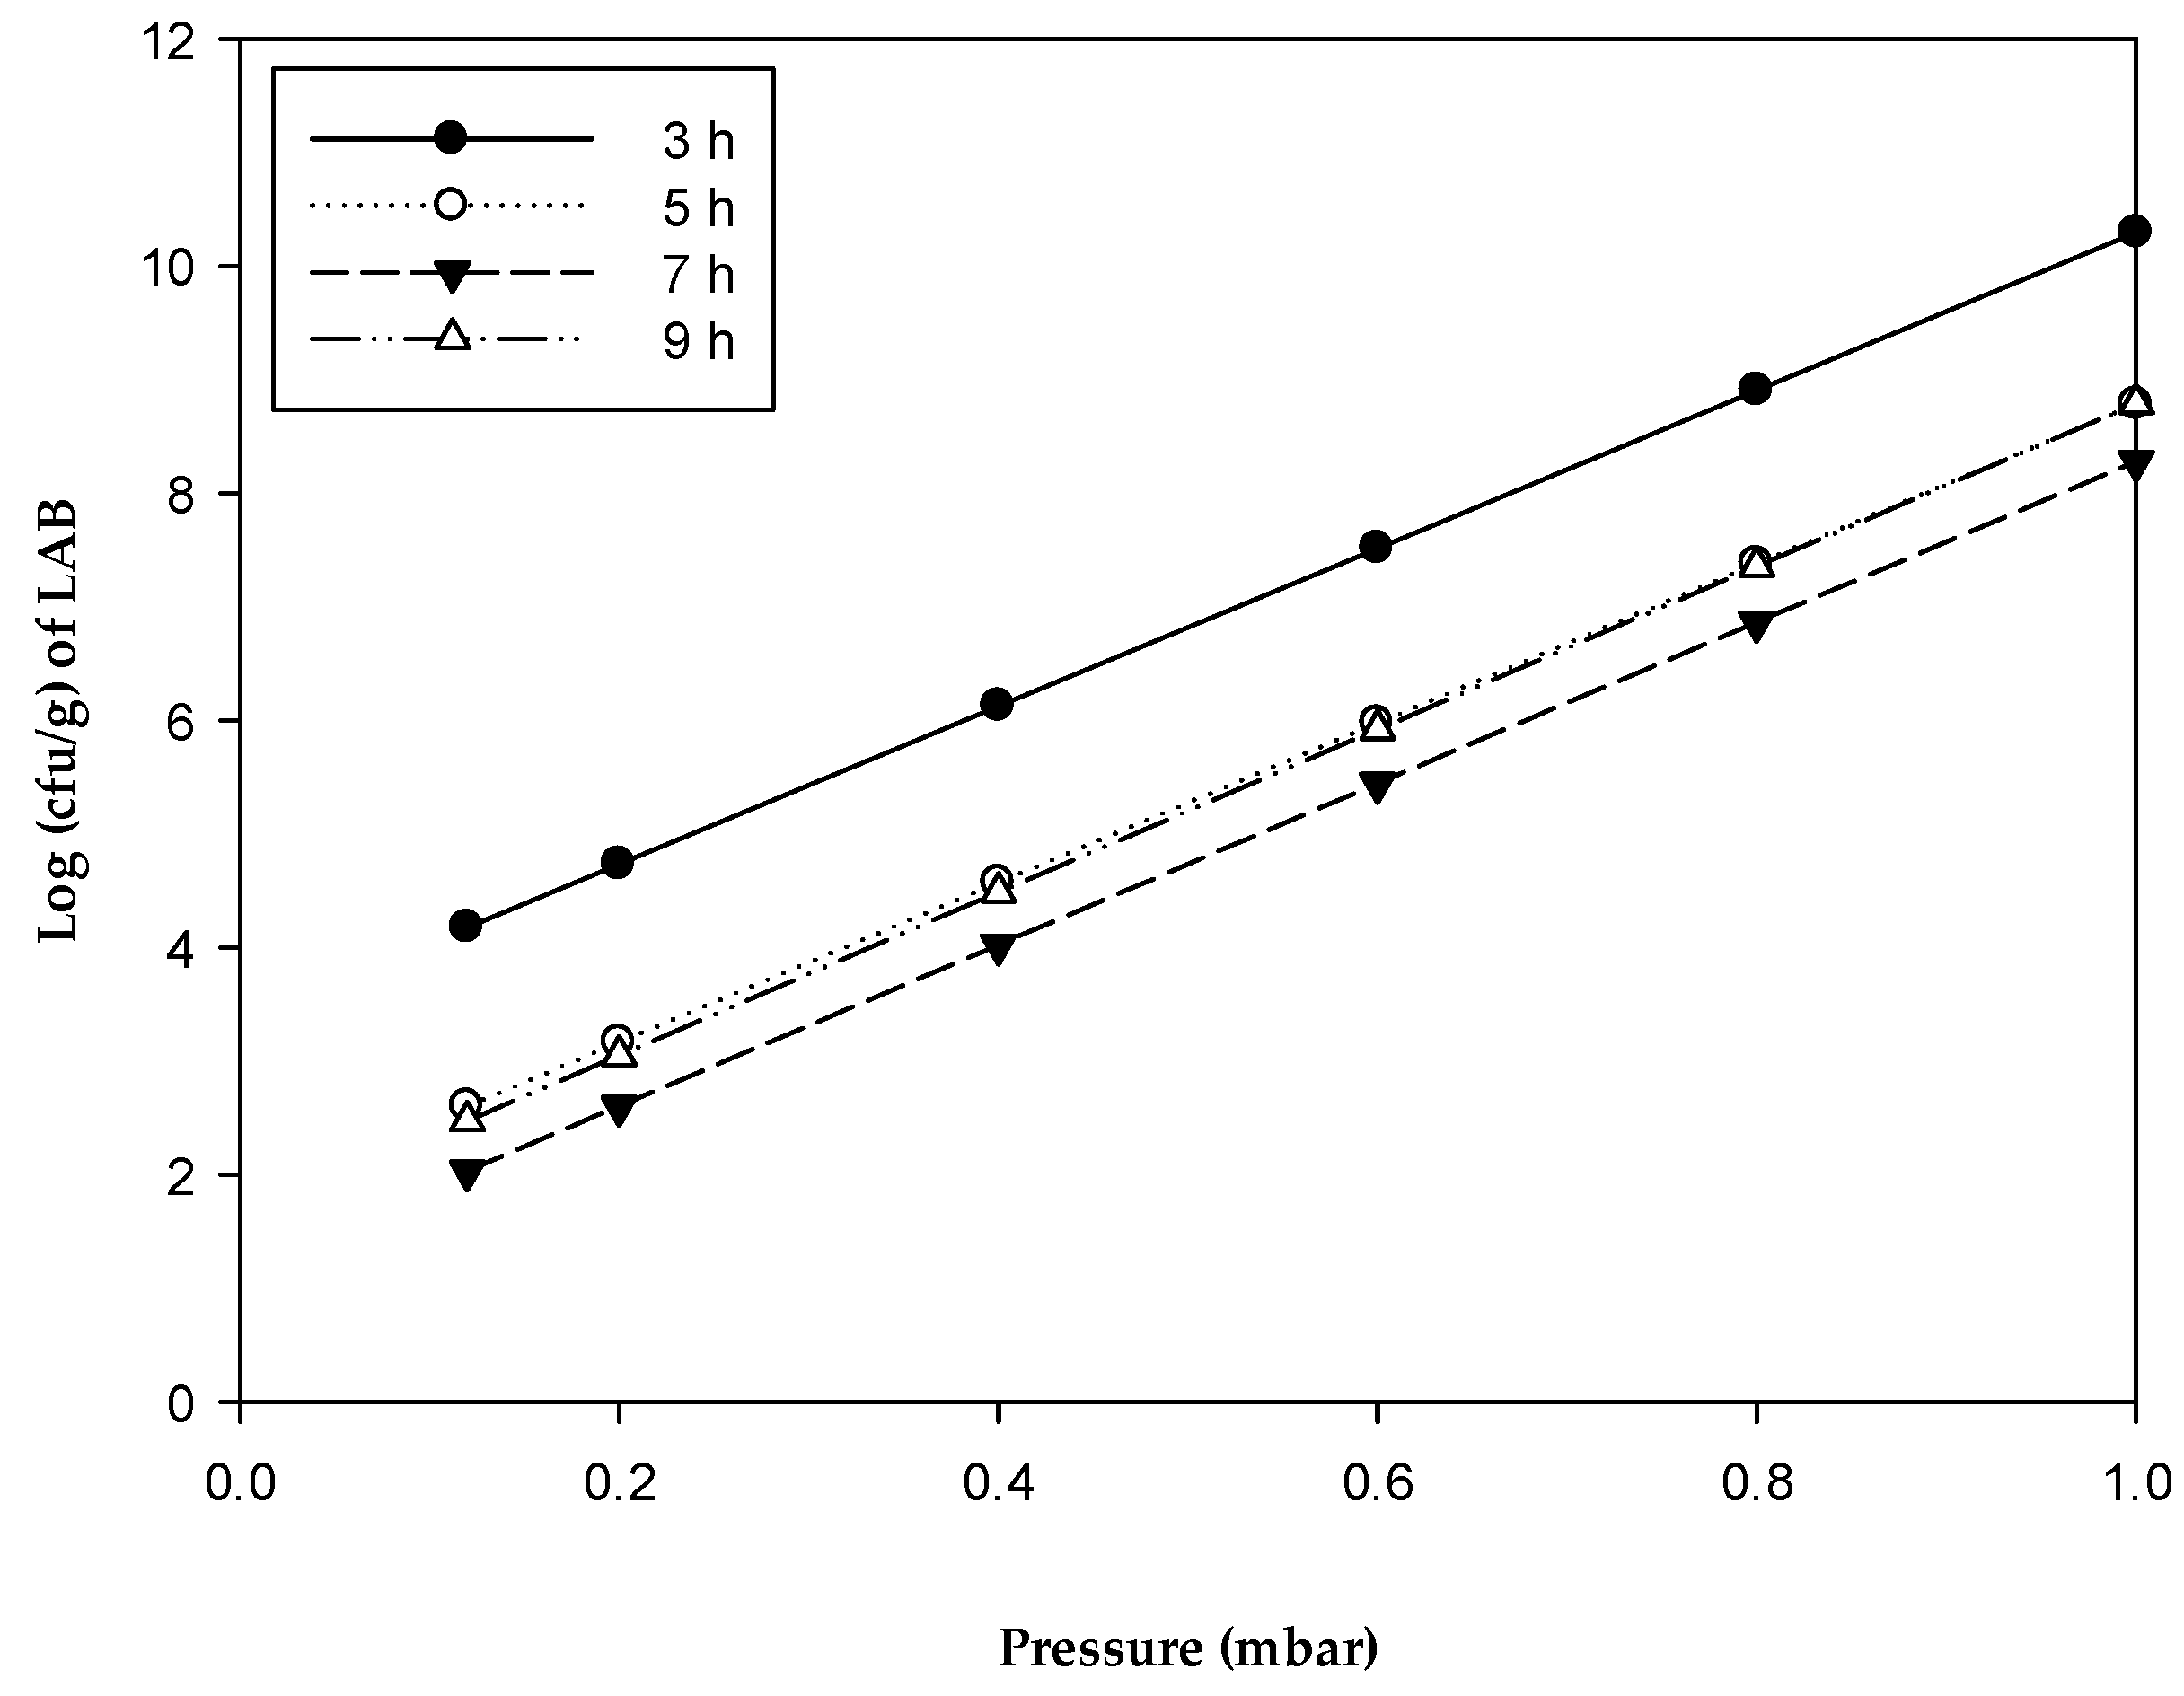
The equation for log (cfu/g) LAB of the dried MKG using multiple regression analysis is
In this equation,
R2 is 0.8851. The relationship between the log (cfu/g) LAB and pressure was obtained using Equation (4) when freezing temperature and lyophilization time were maintained at
20 °C and 5 h, respectively. The predicted log (cfu/g) of LAB is shown in
Figure 5. The log (cfu/g) of LAB increases with increasing pressure increases and decreasing freezing time. The maximum value was obtained for a pressure of 1 mbar and 3 h freezing time. With higher pressures, the survival of LAB increases more than two logarithmic cycles.
The experimental and predicted log (cfu/g) of LAB values of dried MKG are shown in
Table 4. The highest value was 8.64 log (cfu/g) of LAB, less than 0.5 cycle logarithmic of the fresh sample before drying (9.05 log (cfu/g) of LAB). This was obtained at a freezing time 7 h, freezing temperature of
20 °C, pressure of 0.6 mbar, and lyophilization time of 20 h. The relative error difference between the experimental and predicted log (cfu/g) of LAB was 7.56%. Freeze-drying had a negative effect on the survival rate of 4.53%. This result is different from other researchers who reported a negative effect of 7% on the viability of LAB without the use of cryoprotectants during the freeze-drying process [
51,
52].
From the results presented in
Table 8 for yeasts show that
R′ is the maximum difference among the four levels for each factor. The max changing range (9.83) of pressure was the largest among the ranges of the four variables. This indicates that pressure plays an important role in yeast survival in dried MKG. The range of 8.83 for freezing time was larger than those of the remaining two factors. This shows that freezing time is another important factor affecting the survival of the yeasts in the dried product.
Table 8 shows that although the four factors do not have a significant influence (
p > 0.1 and
F <
Fcrit = 2.605525, neither
p > 0.05 nor
F <
Fcrit = 3.490295) on the survival log (cfu/g) of yeasts of dried MKG, the greatest effect can be observed in
R′, where this variable is affected by the pressure and freezing time.
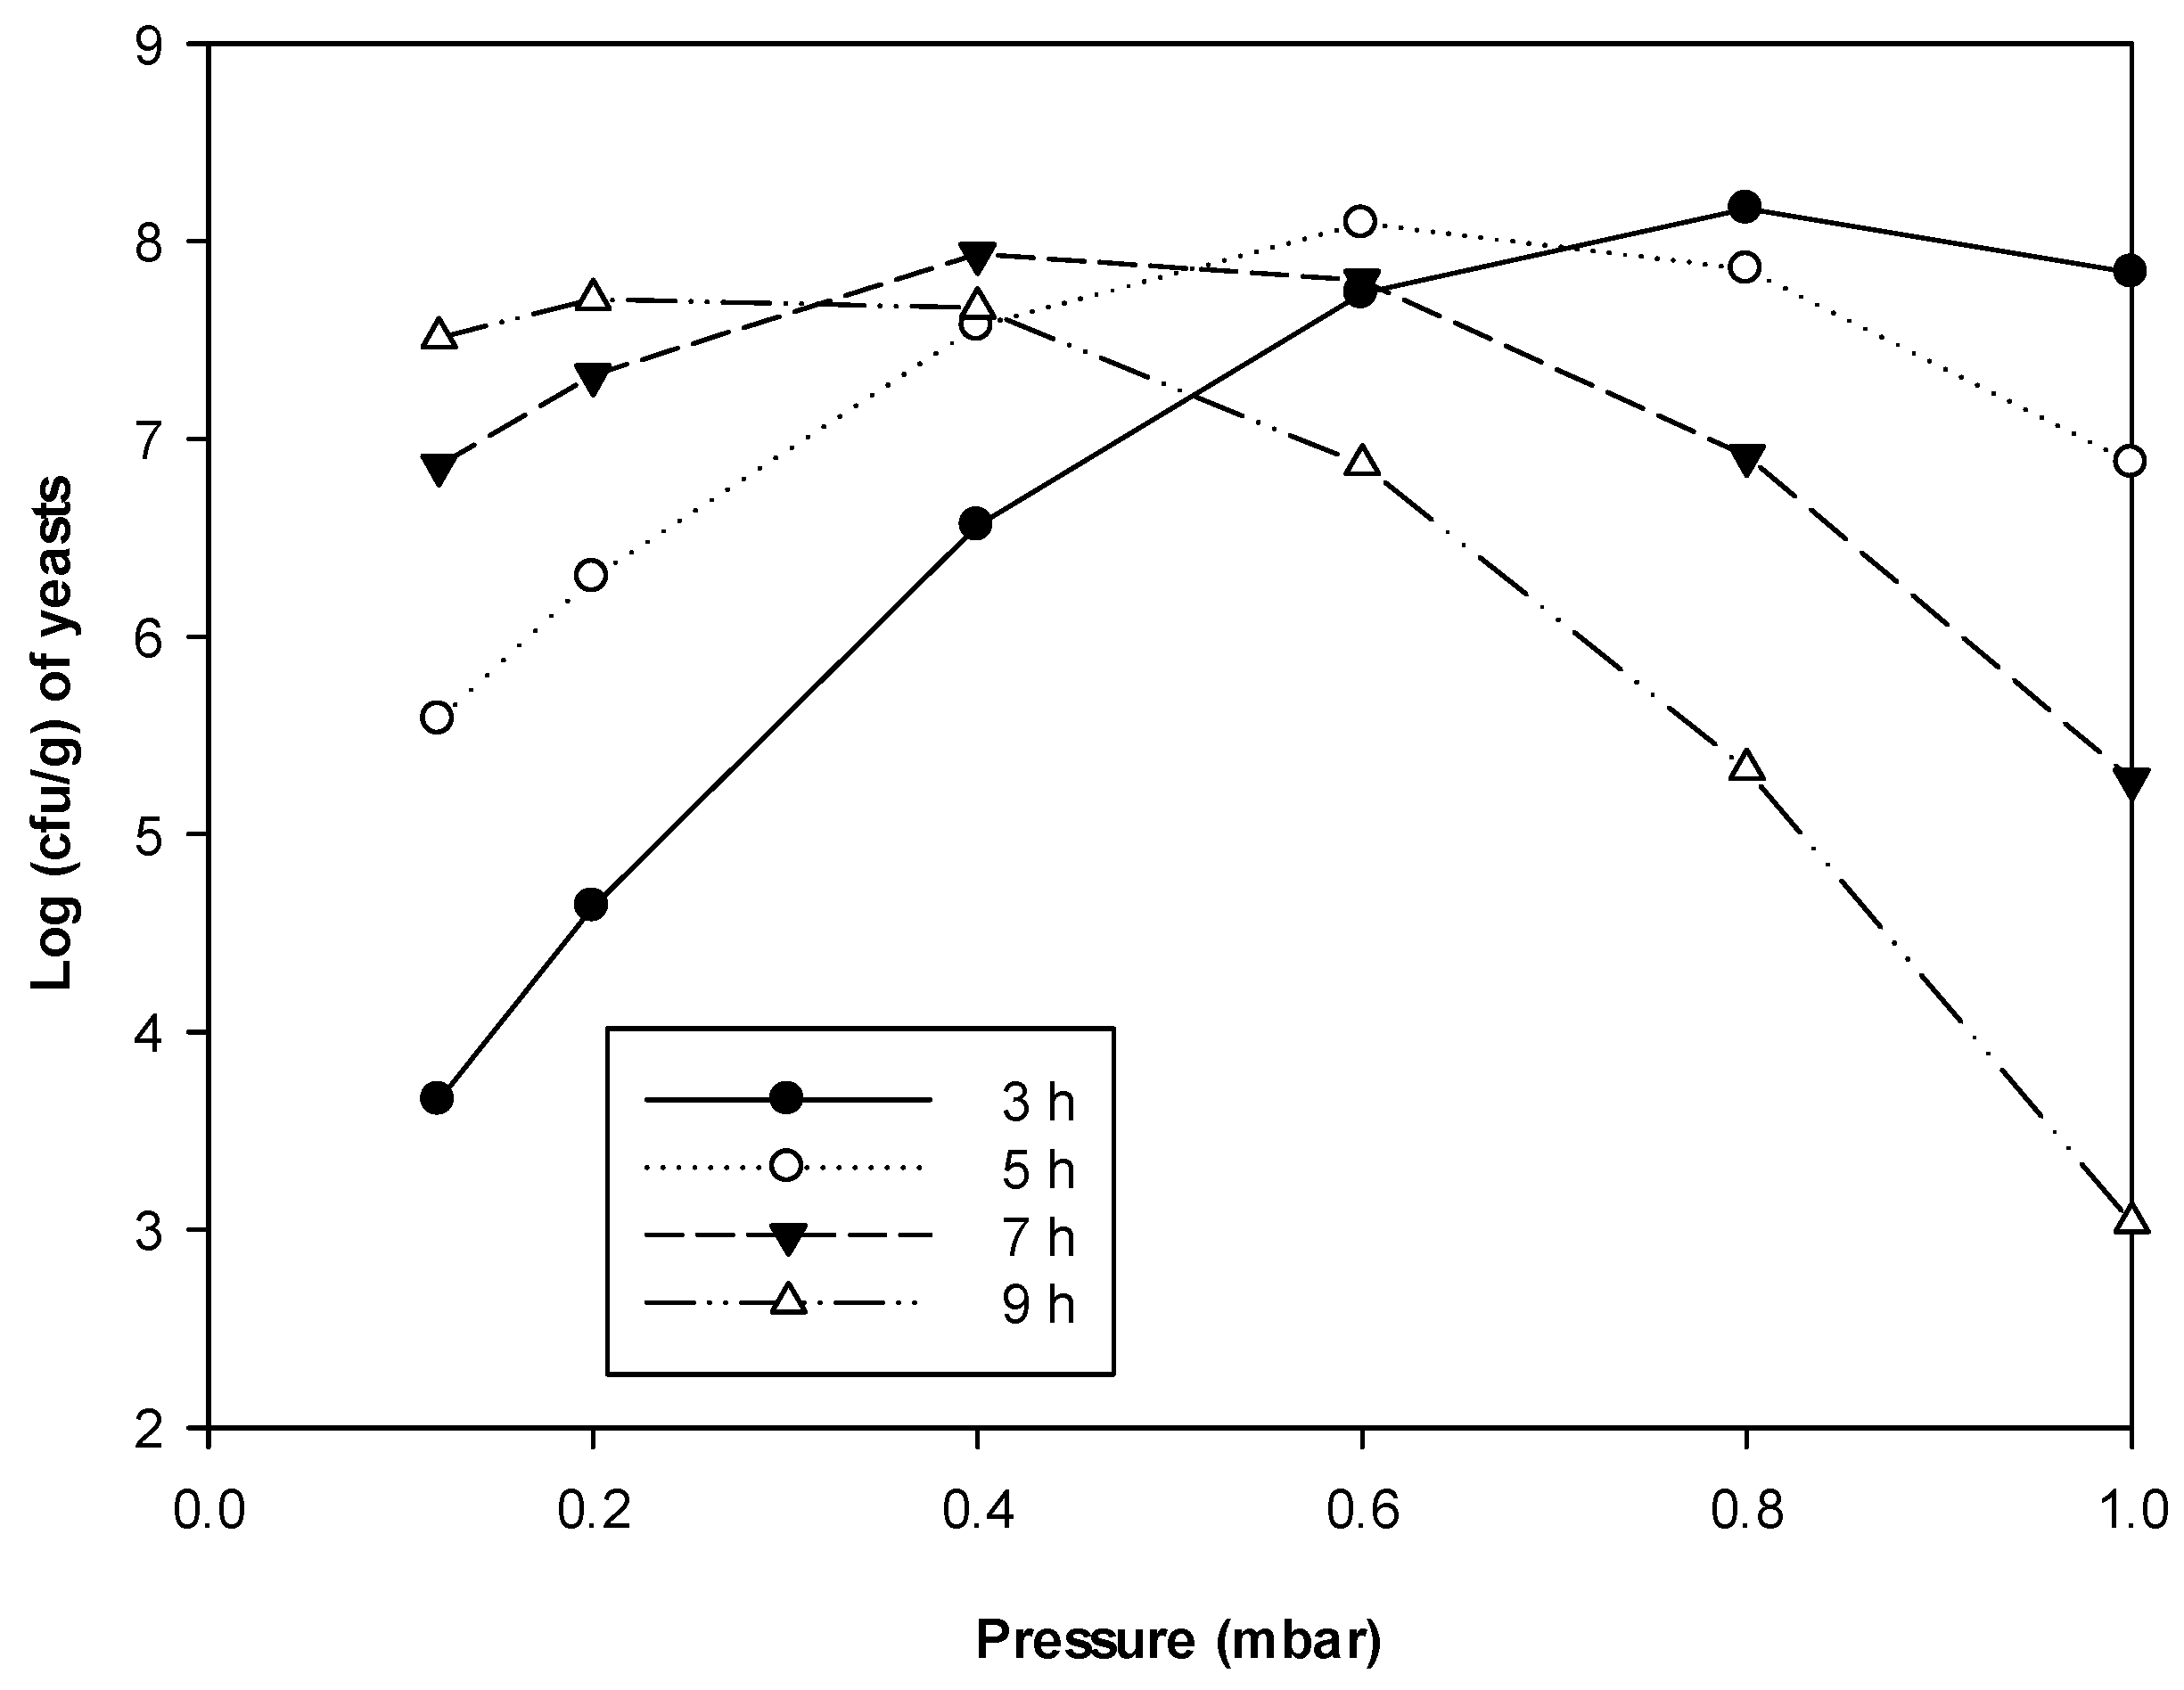
Multiple regression analysis for log (cfu/g) of yeasts is as follows
In this equation, the
R2 was 0.8017. The log (cfu/g) of yeast determined using Equation (5) is shown in
Figure 6. The freezing temperature was set to
20 °C and lyophilization time to 5 h.
Figure 6 shows that the maximum predicted survival of the yeast is reached when the pressure increases to 0.8 mbar and freezing temperature is 3 h. With higher values of pressure and a higher freezing time of 3 h, the survival of the yeast decreases more than two logarithmic cycles.
The experimental and predicted log (cfu/g) values of yeasts of dried MKG are shown in
Table 4. The highest value of 8.67 log (cfu/g) for yeasts is less than 0.5 cycle logarithmic of the fresh sample before drying (8.90 log (cfu/g) of yeasts). This was obtained at freezing times of 3 to 7 h, freezing temperatures of −20 to −60 °C, pressure of 0.6 mbar, and lyophilization time of 15 to 20 h. The relative error differences between the experimental and predicted log (cfu/g) of yeasts were 14.24 and 7.36% for tests No. 3 and 9, respectively. Freeze-drying had a negative effect on the survival rate of 2.60%; this result is similar to that reported in other studies, which also reported a negative effect, even with the use of cryoprotectants [
53,
54].
3.5. Optimization of the Freeze-Drying Parameters for Dried Mexican Kefir Grains
Because the residual moisture, water activity, and survival of probiotic bacteria are the most important factors for dried MKG, optimization of the freeze-drying considers these three factors, with the goal of obtained values for % RMC below 6, a
w below 0.60, and at least 10
6 colony forming units per gram (6 log cfu/g) of probiotic microorganism. The optimum process for desirable moisture, water activity, and survival of probiotic microorganisms is shown in
Table 9. Optimal levels for those parameters are the same: freezing time of 3 h, freezing temperature of −20 °C, pressure 0.6 mbar, and lyophilization time of 15 h. The residual moisture in the dried product needs to be below 6% [
55]. In this study, a residual moisture content in dried MKG of less than 6% was obtained. As shown in
Table 4, the pressure of 0.6 mbar was chosen as optimal to prevent probiotic bacterial loss. At a pressure of 0.2 mbar, we observed a lower survival in LAB and yeasts, with the lowest value being 4.99 log (cfu/g) for LAB and 5.22 log (cfu/g) for yeasts. Therefore, the pressure of 0.6 mbar was selected as optimal. Under these optimal conditions, the properties of dried MKG were: residual moisture 5.03%, a
w 0.167, ΔE 7.79, LAB 8.5 log (cfu/g), and yeasts 8.6 log (cfu/g).

 ,
, 
