The Effect of Fines on Hydraulic Conductivity of Lawrencepur, Chenab and Ravi Sand

 ,
,
Abstract
:1. Introduction
2. Materials and Methods
- (a)
- Grain size analysis (ASTM D-422);
- (b)
- Standard Proctor test (ASTM D-422);
- (c)
- Atterberg limits (ASTM D-4318);
- (d)
- Constant head permeability test (ASTM-D 2434);
- (e)
- Falling head permeability test.
3. Results and Discussion
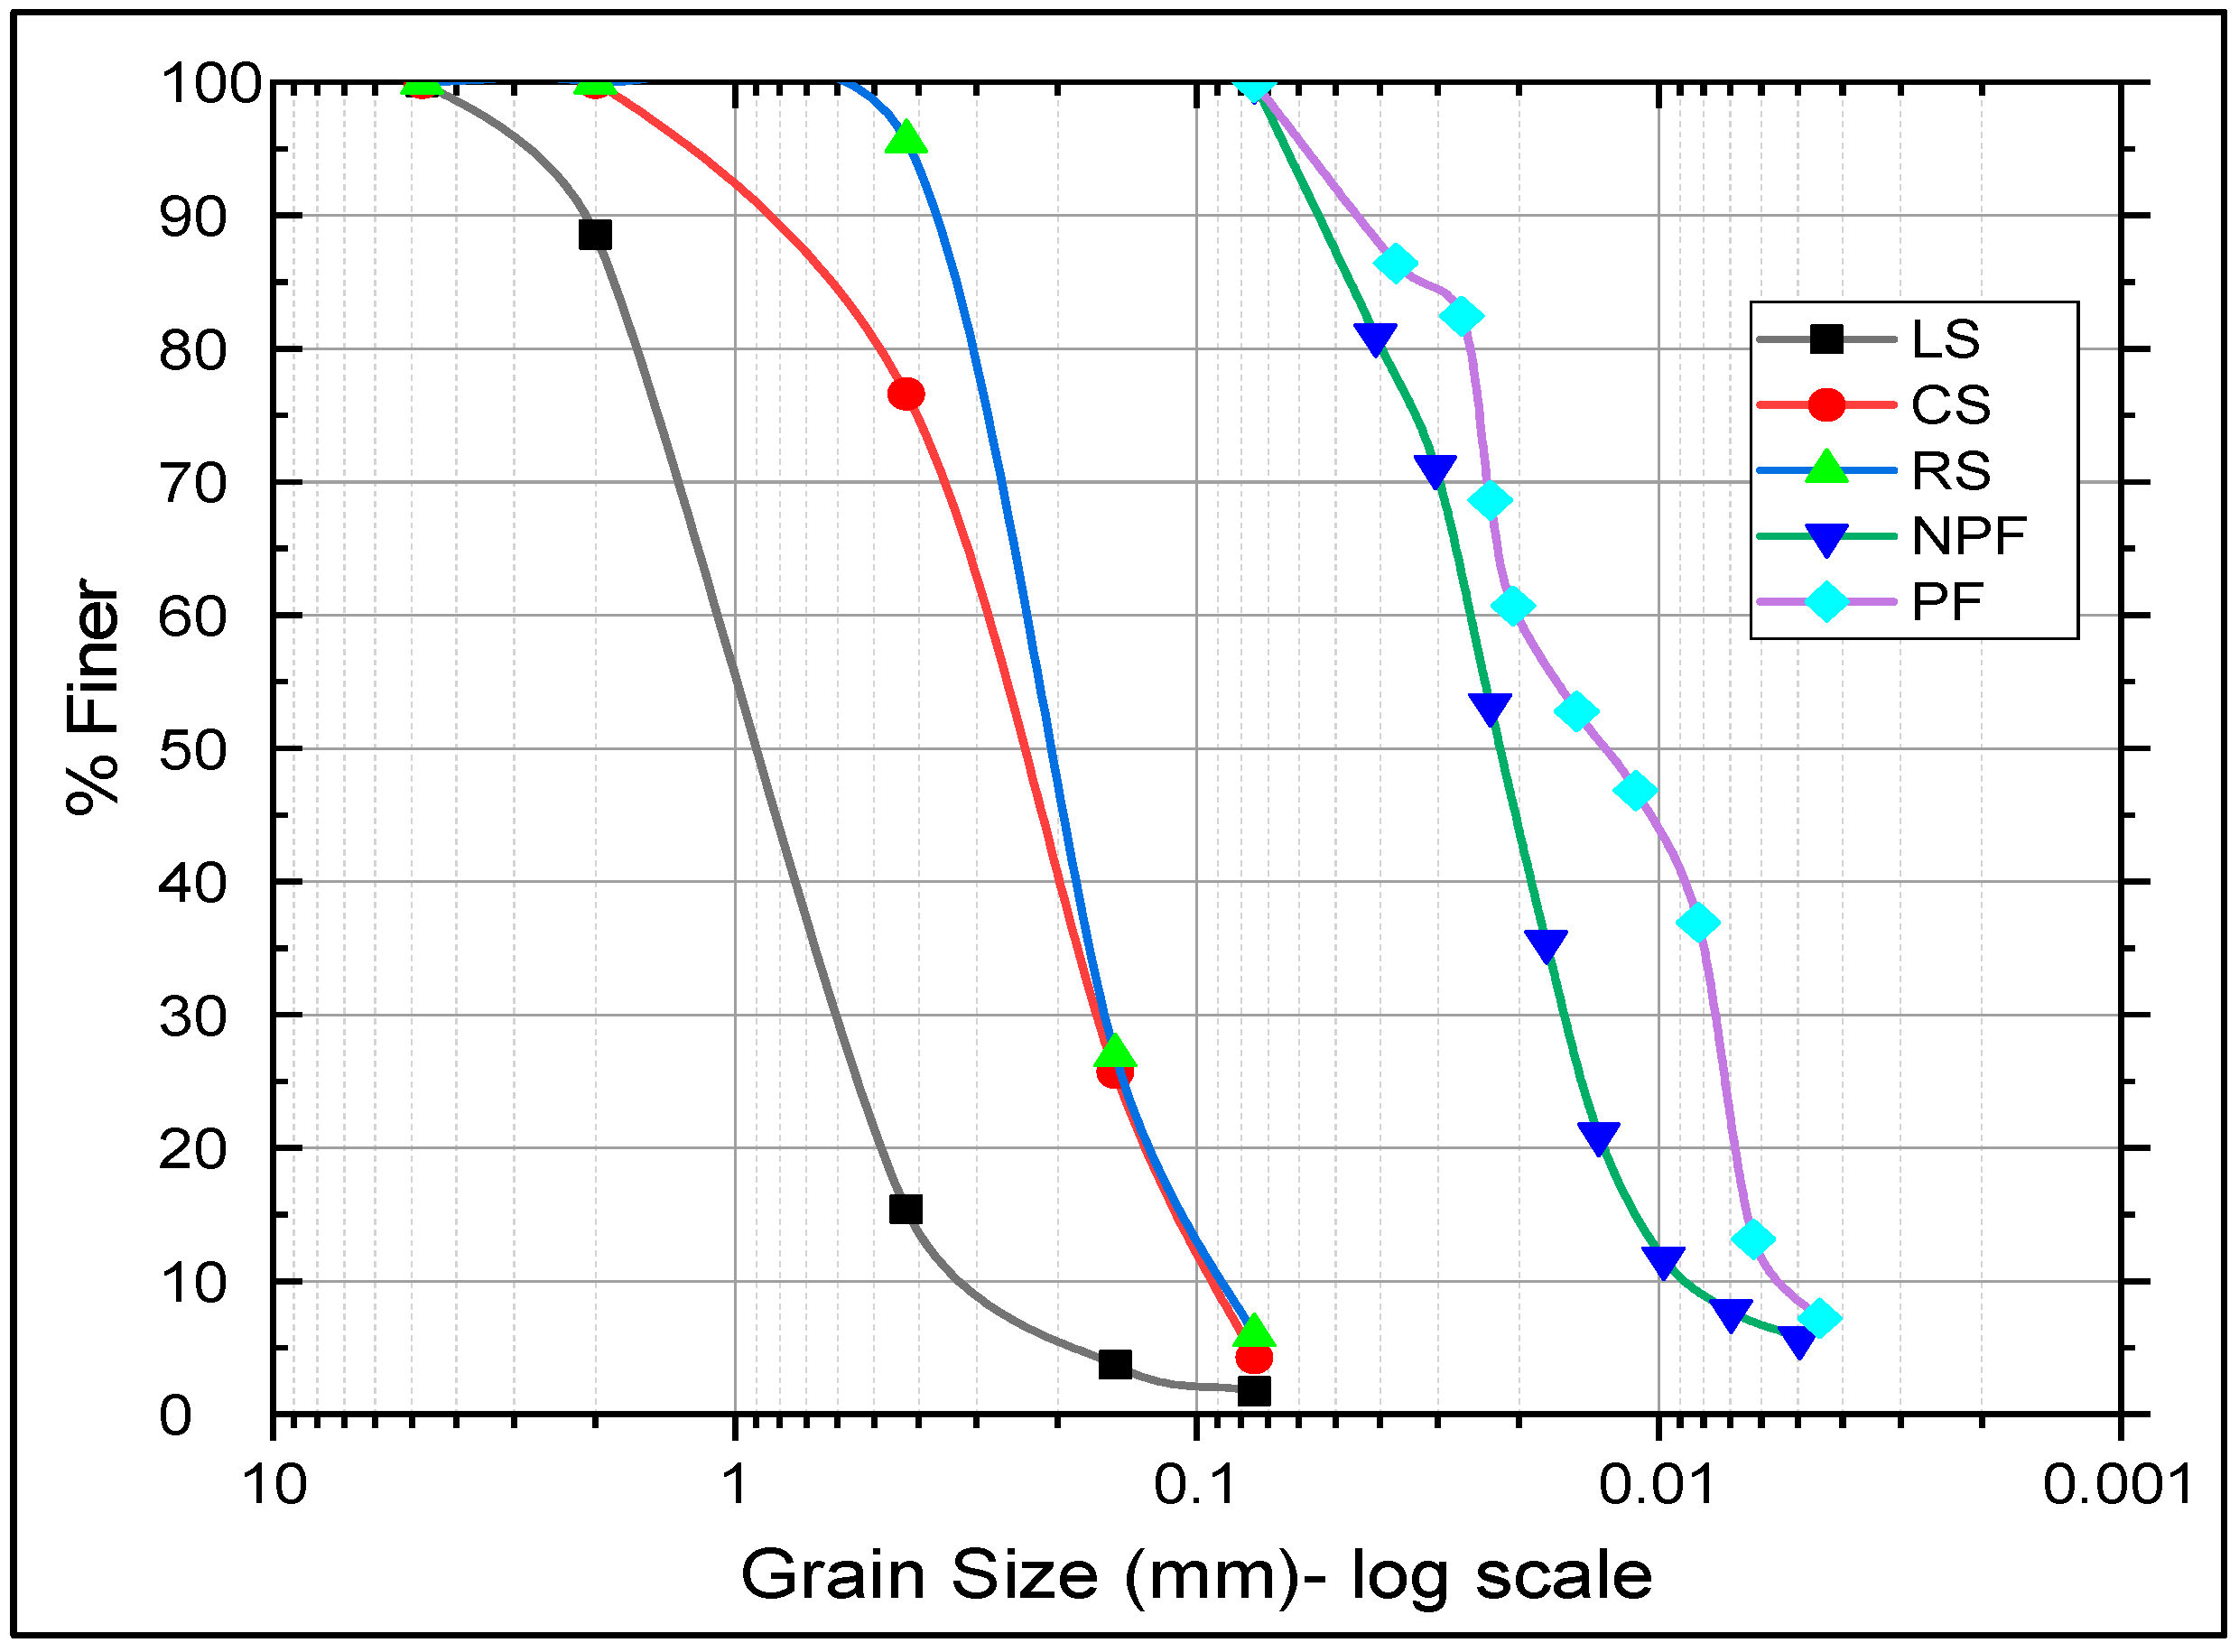
3.1. Grain Size Analysis
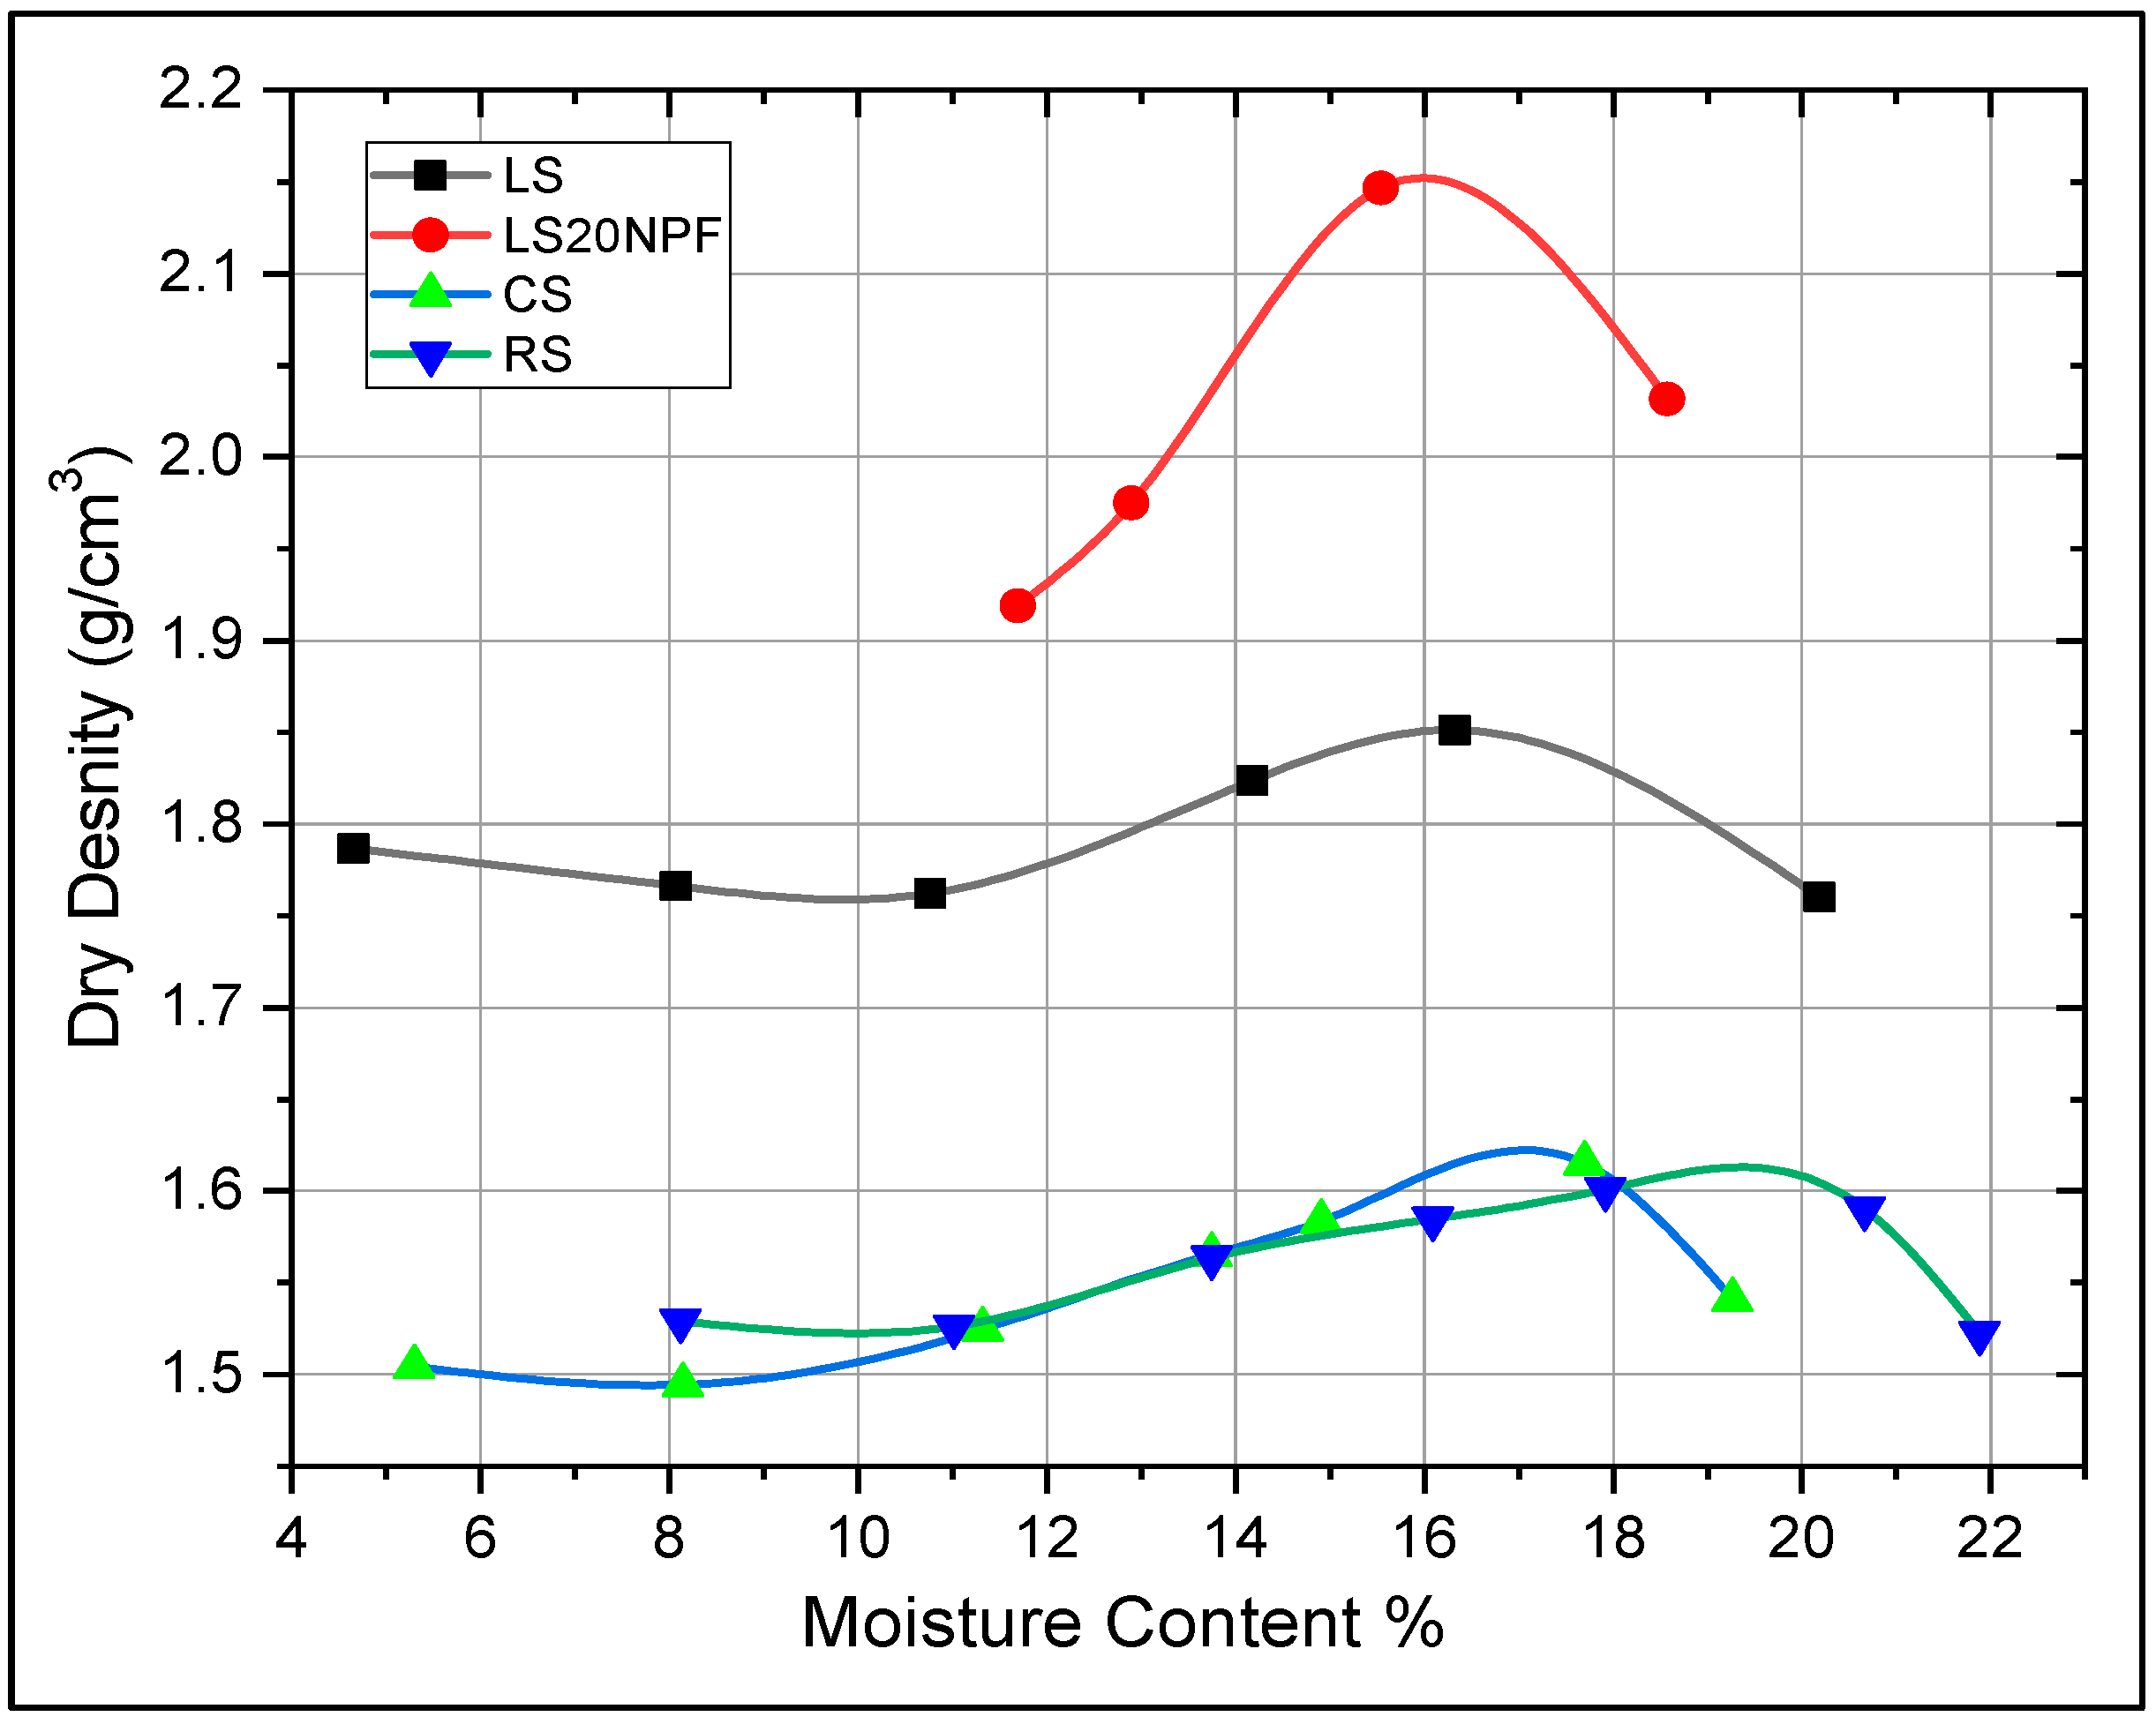
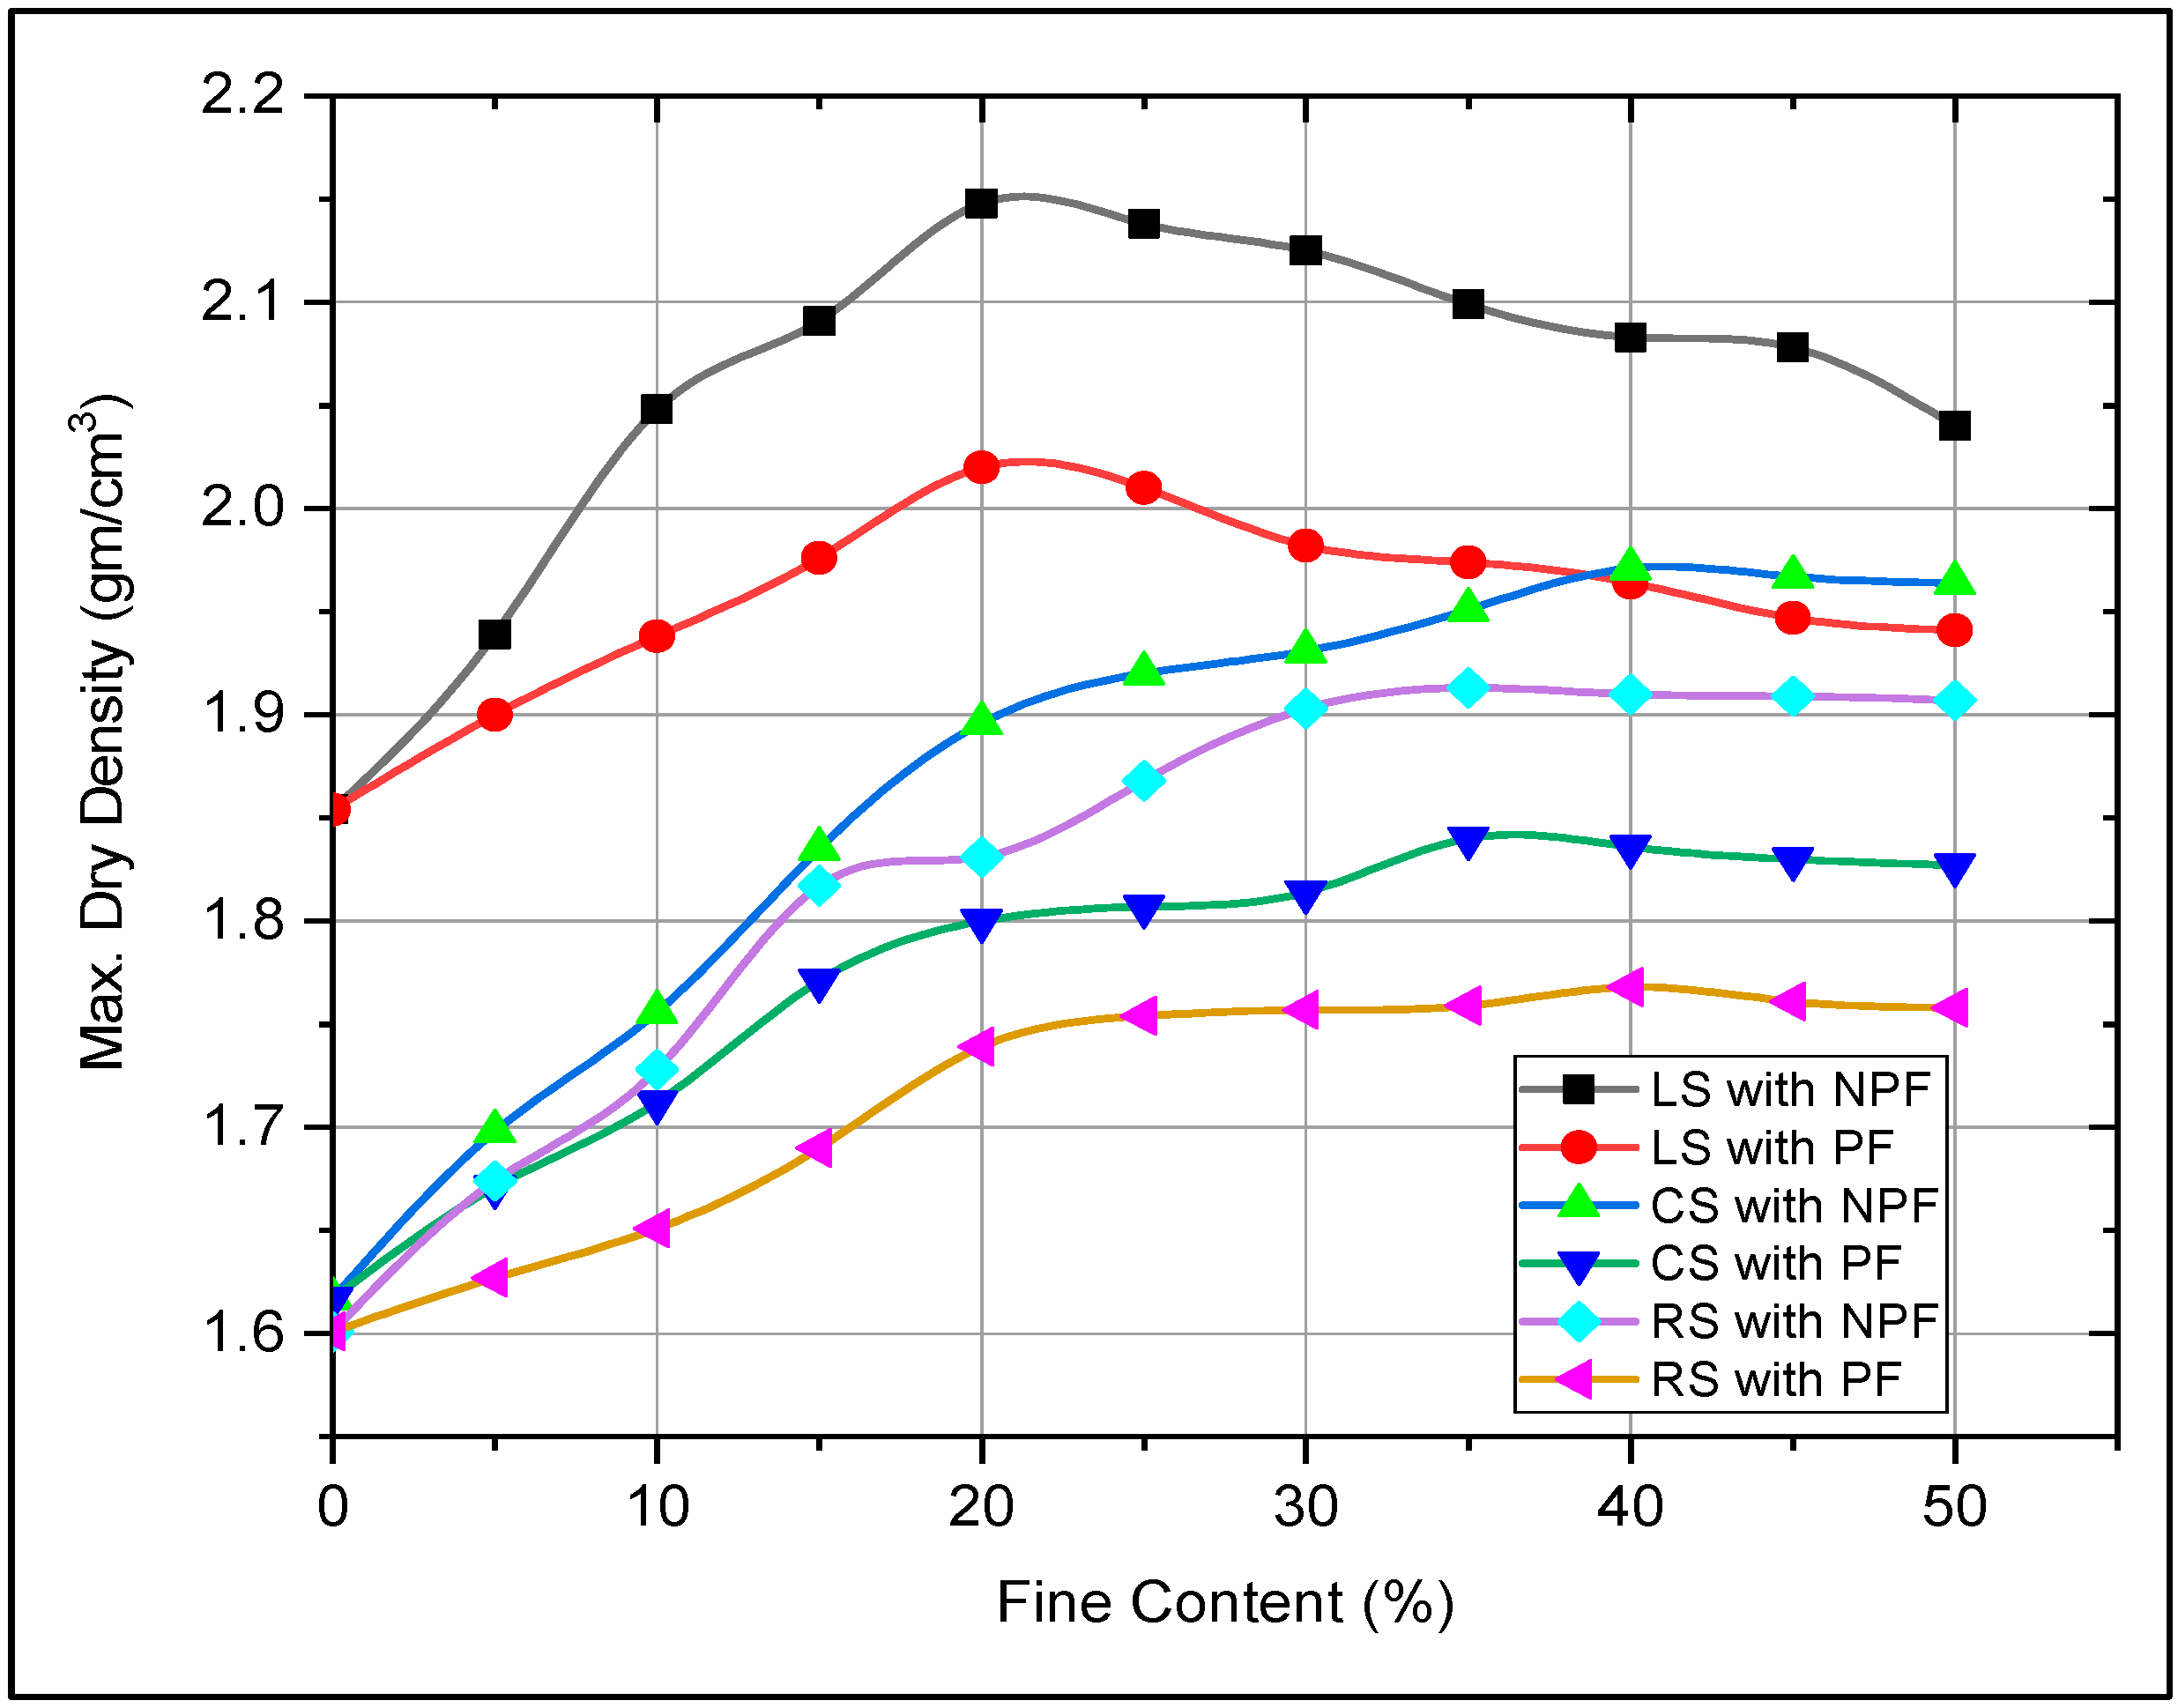
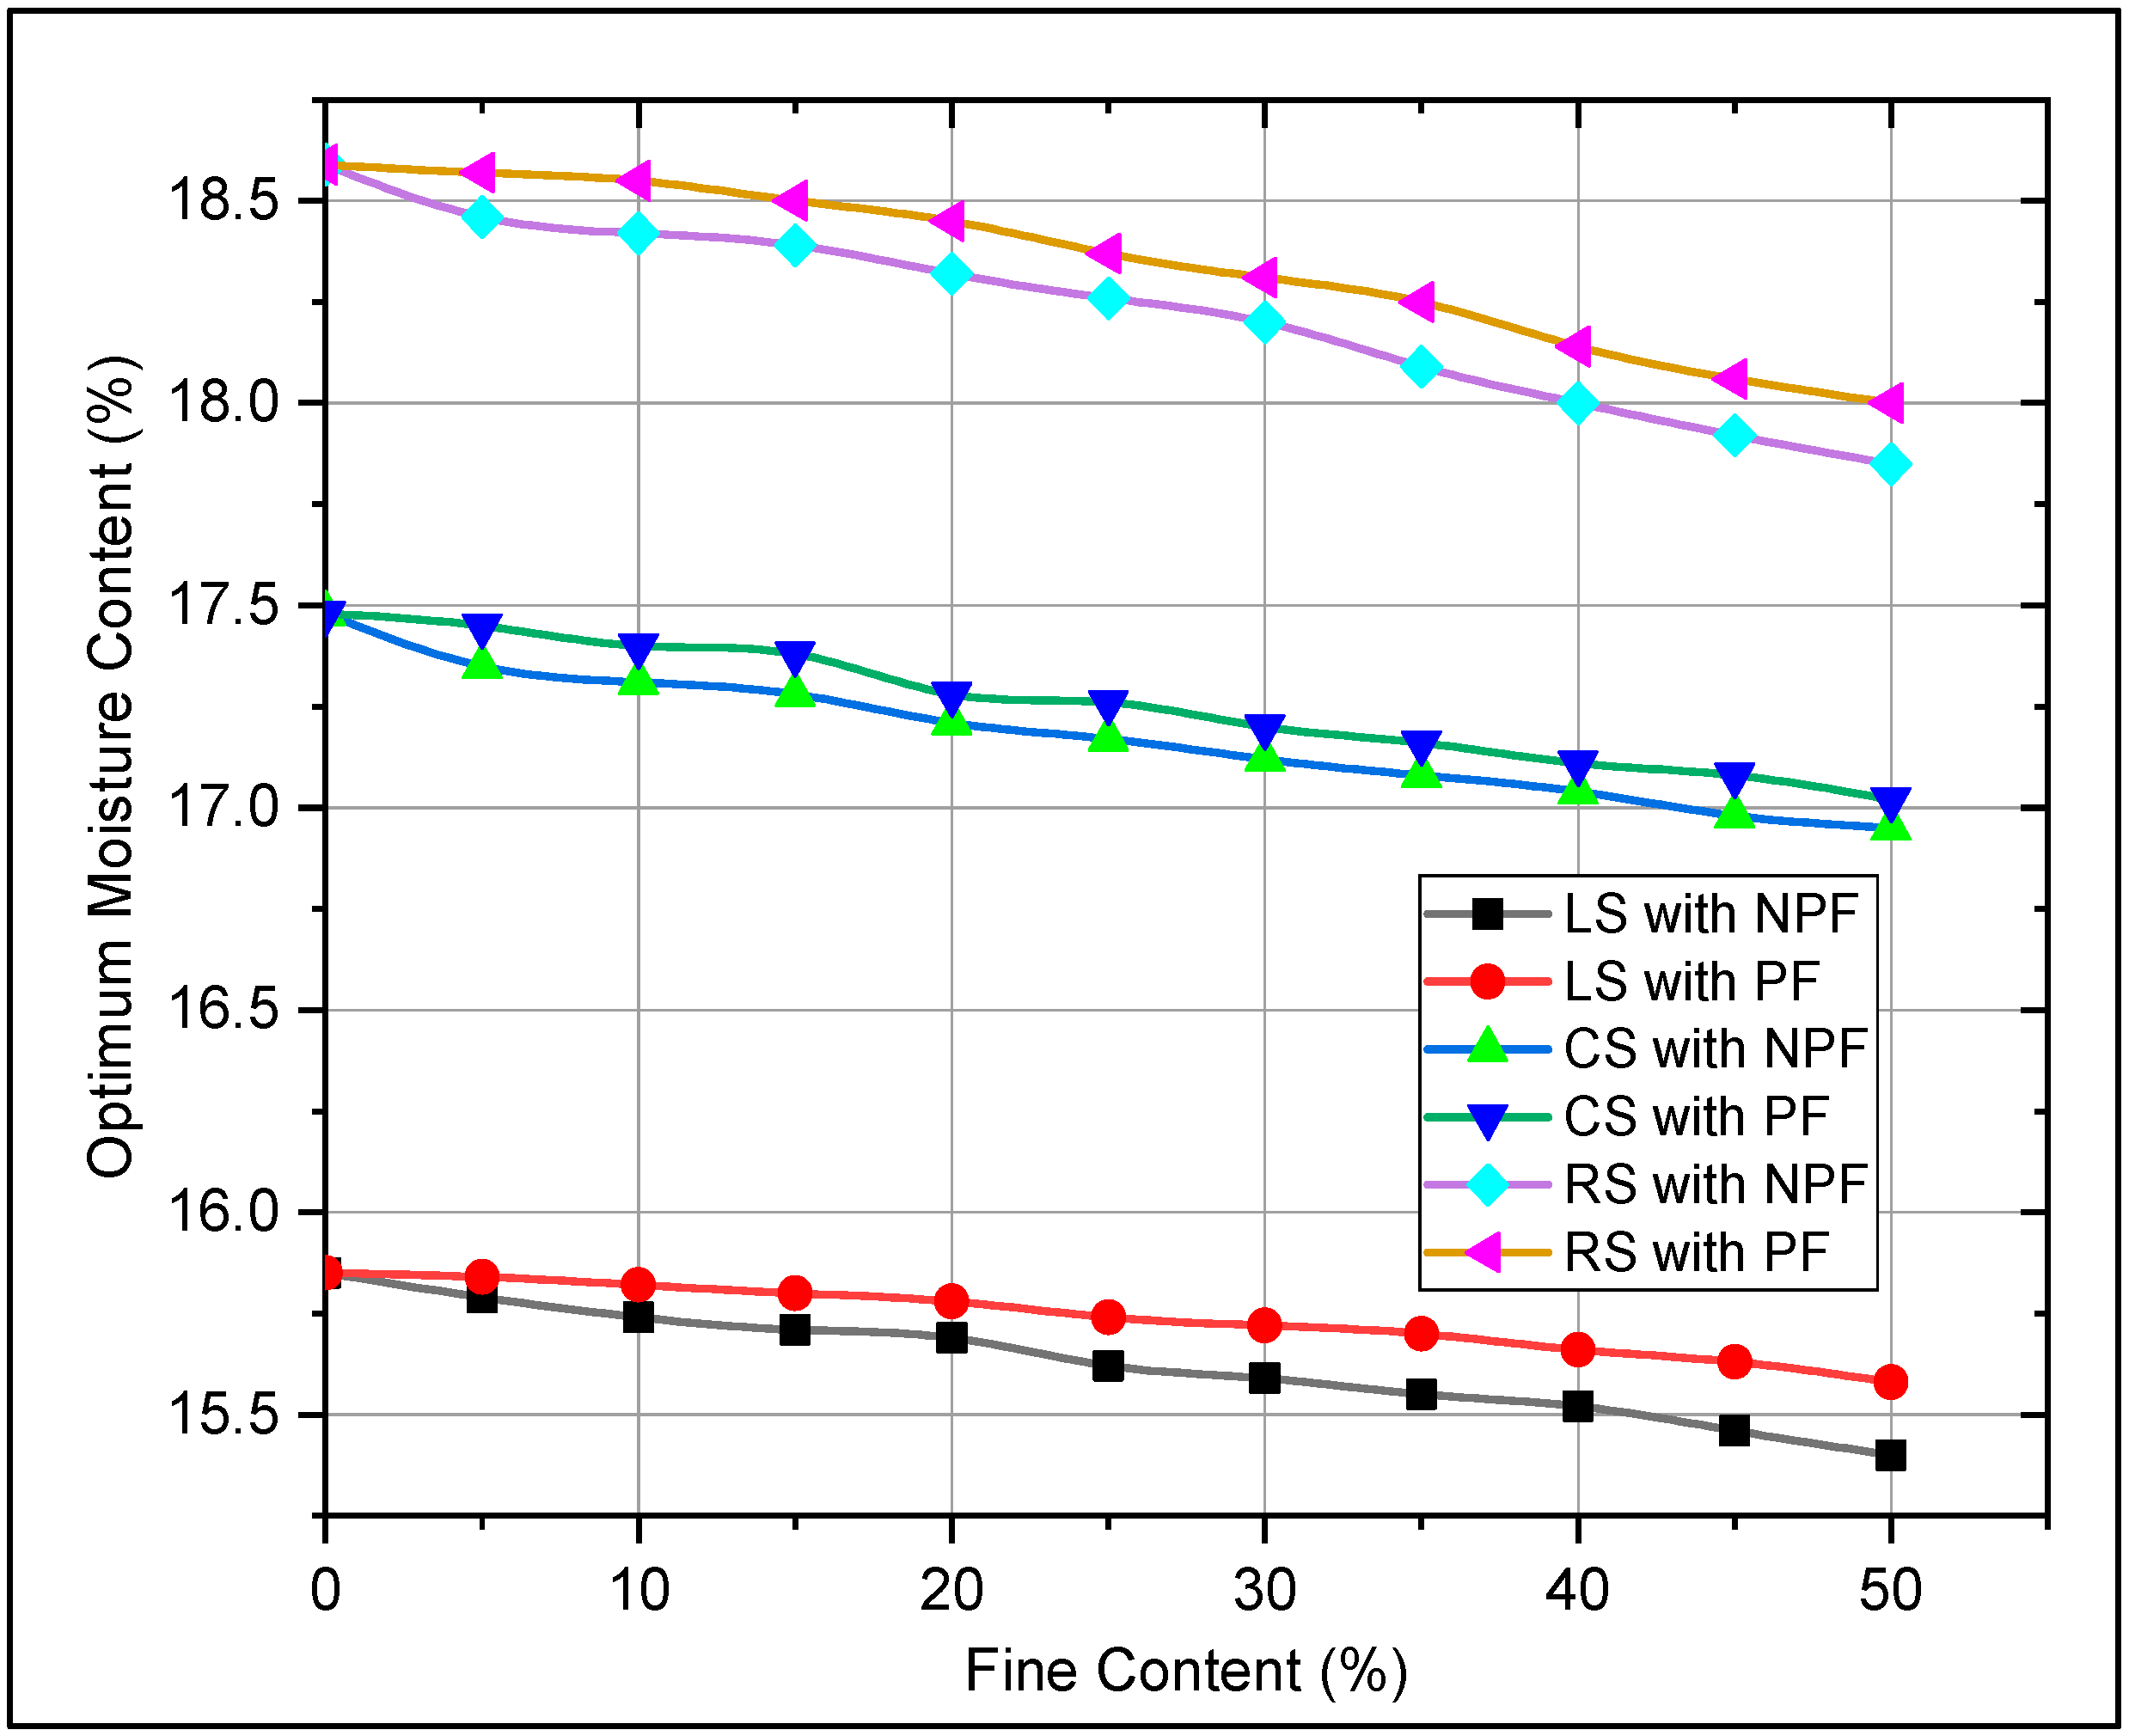
3.2. Compaction Tests
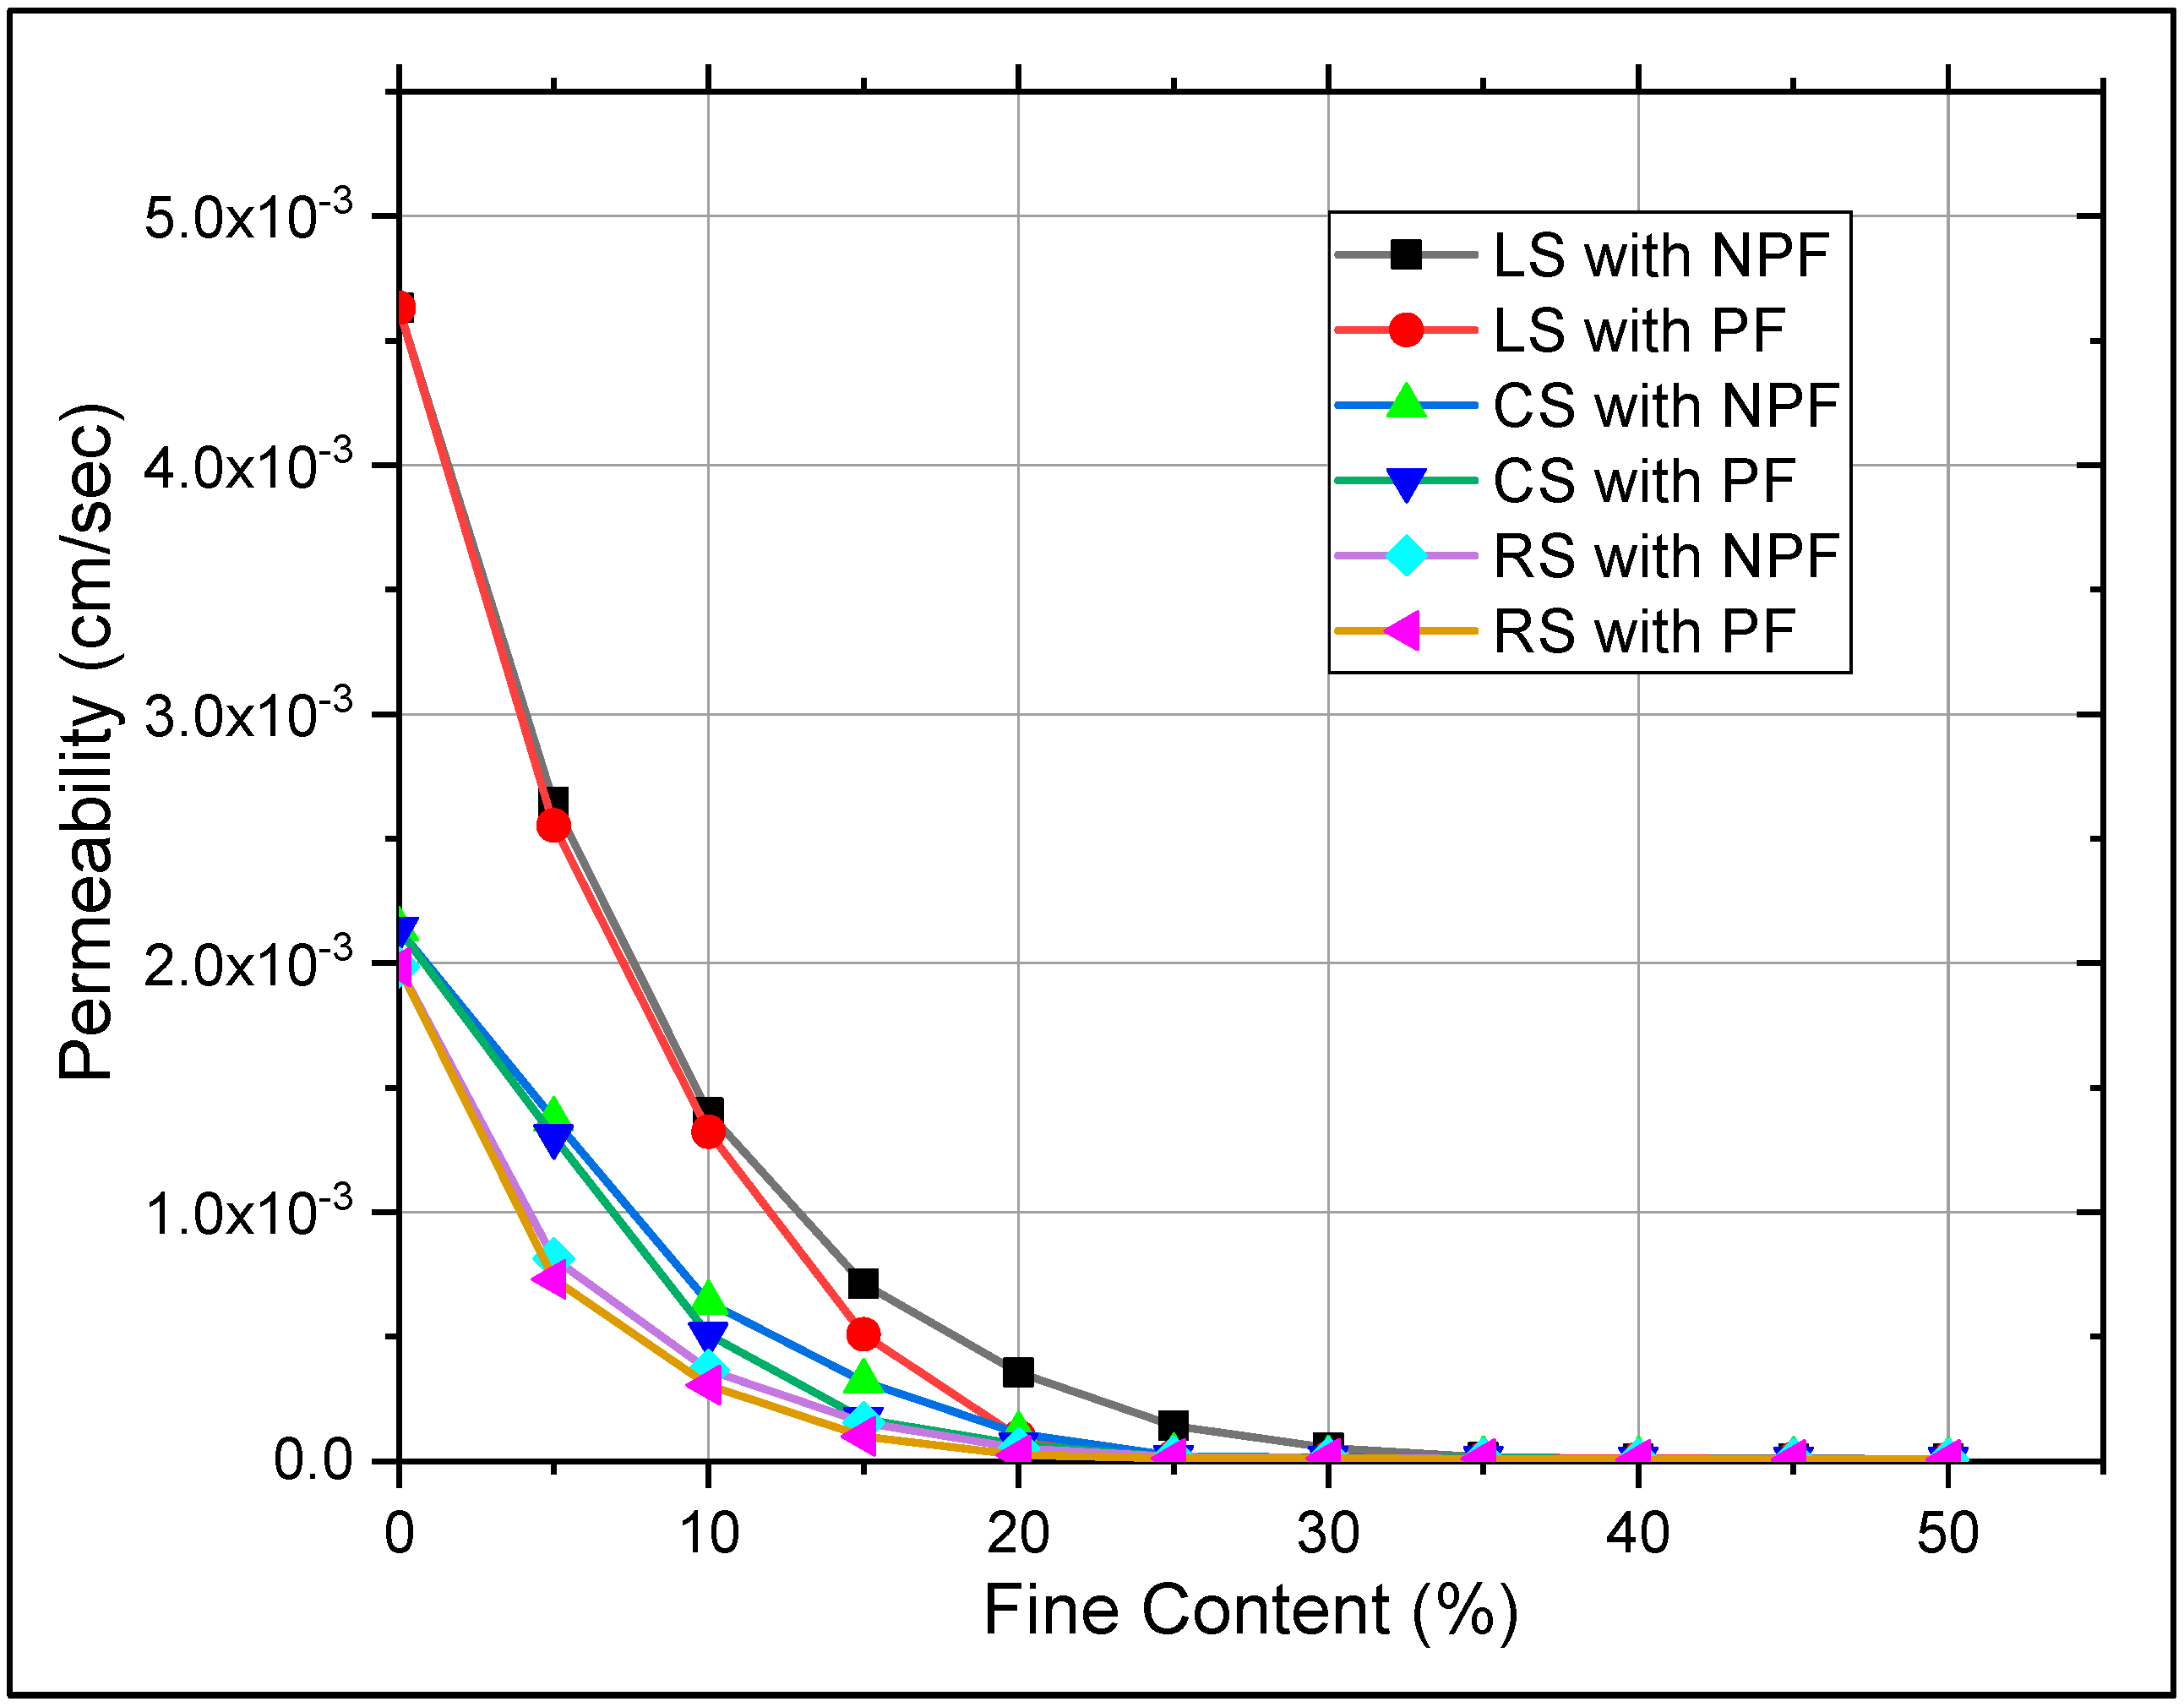
3.3. Permeability
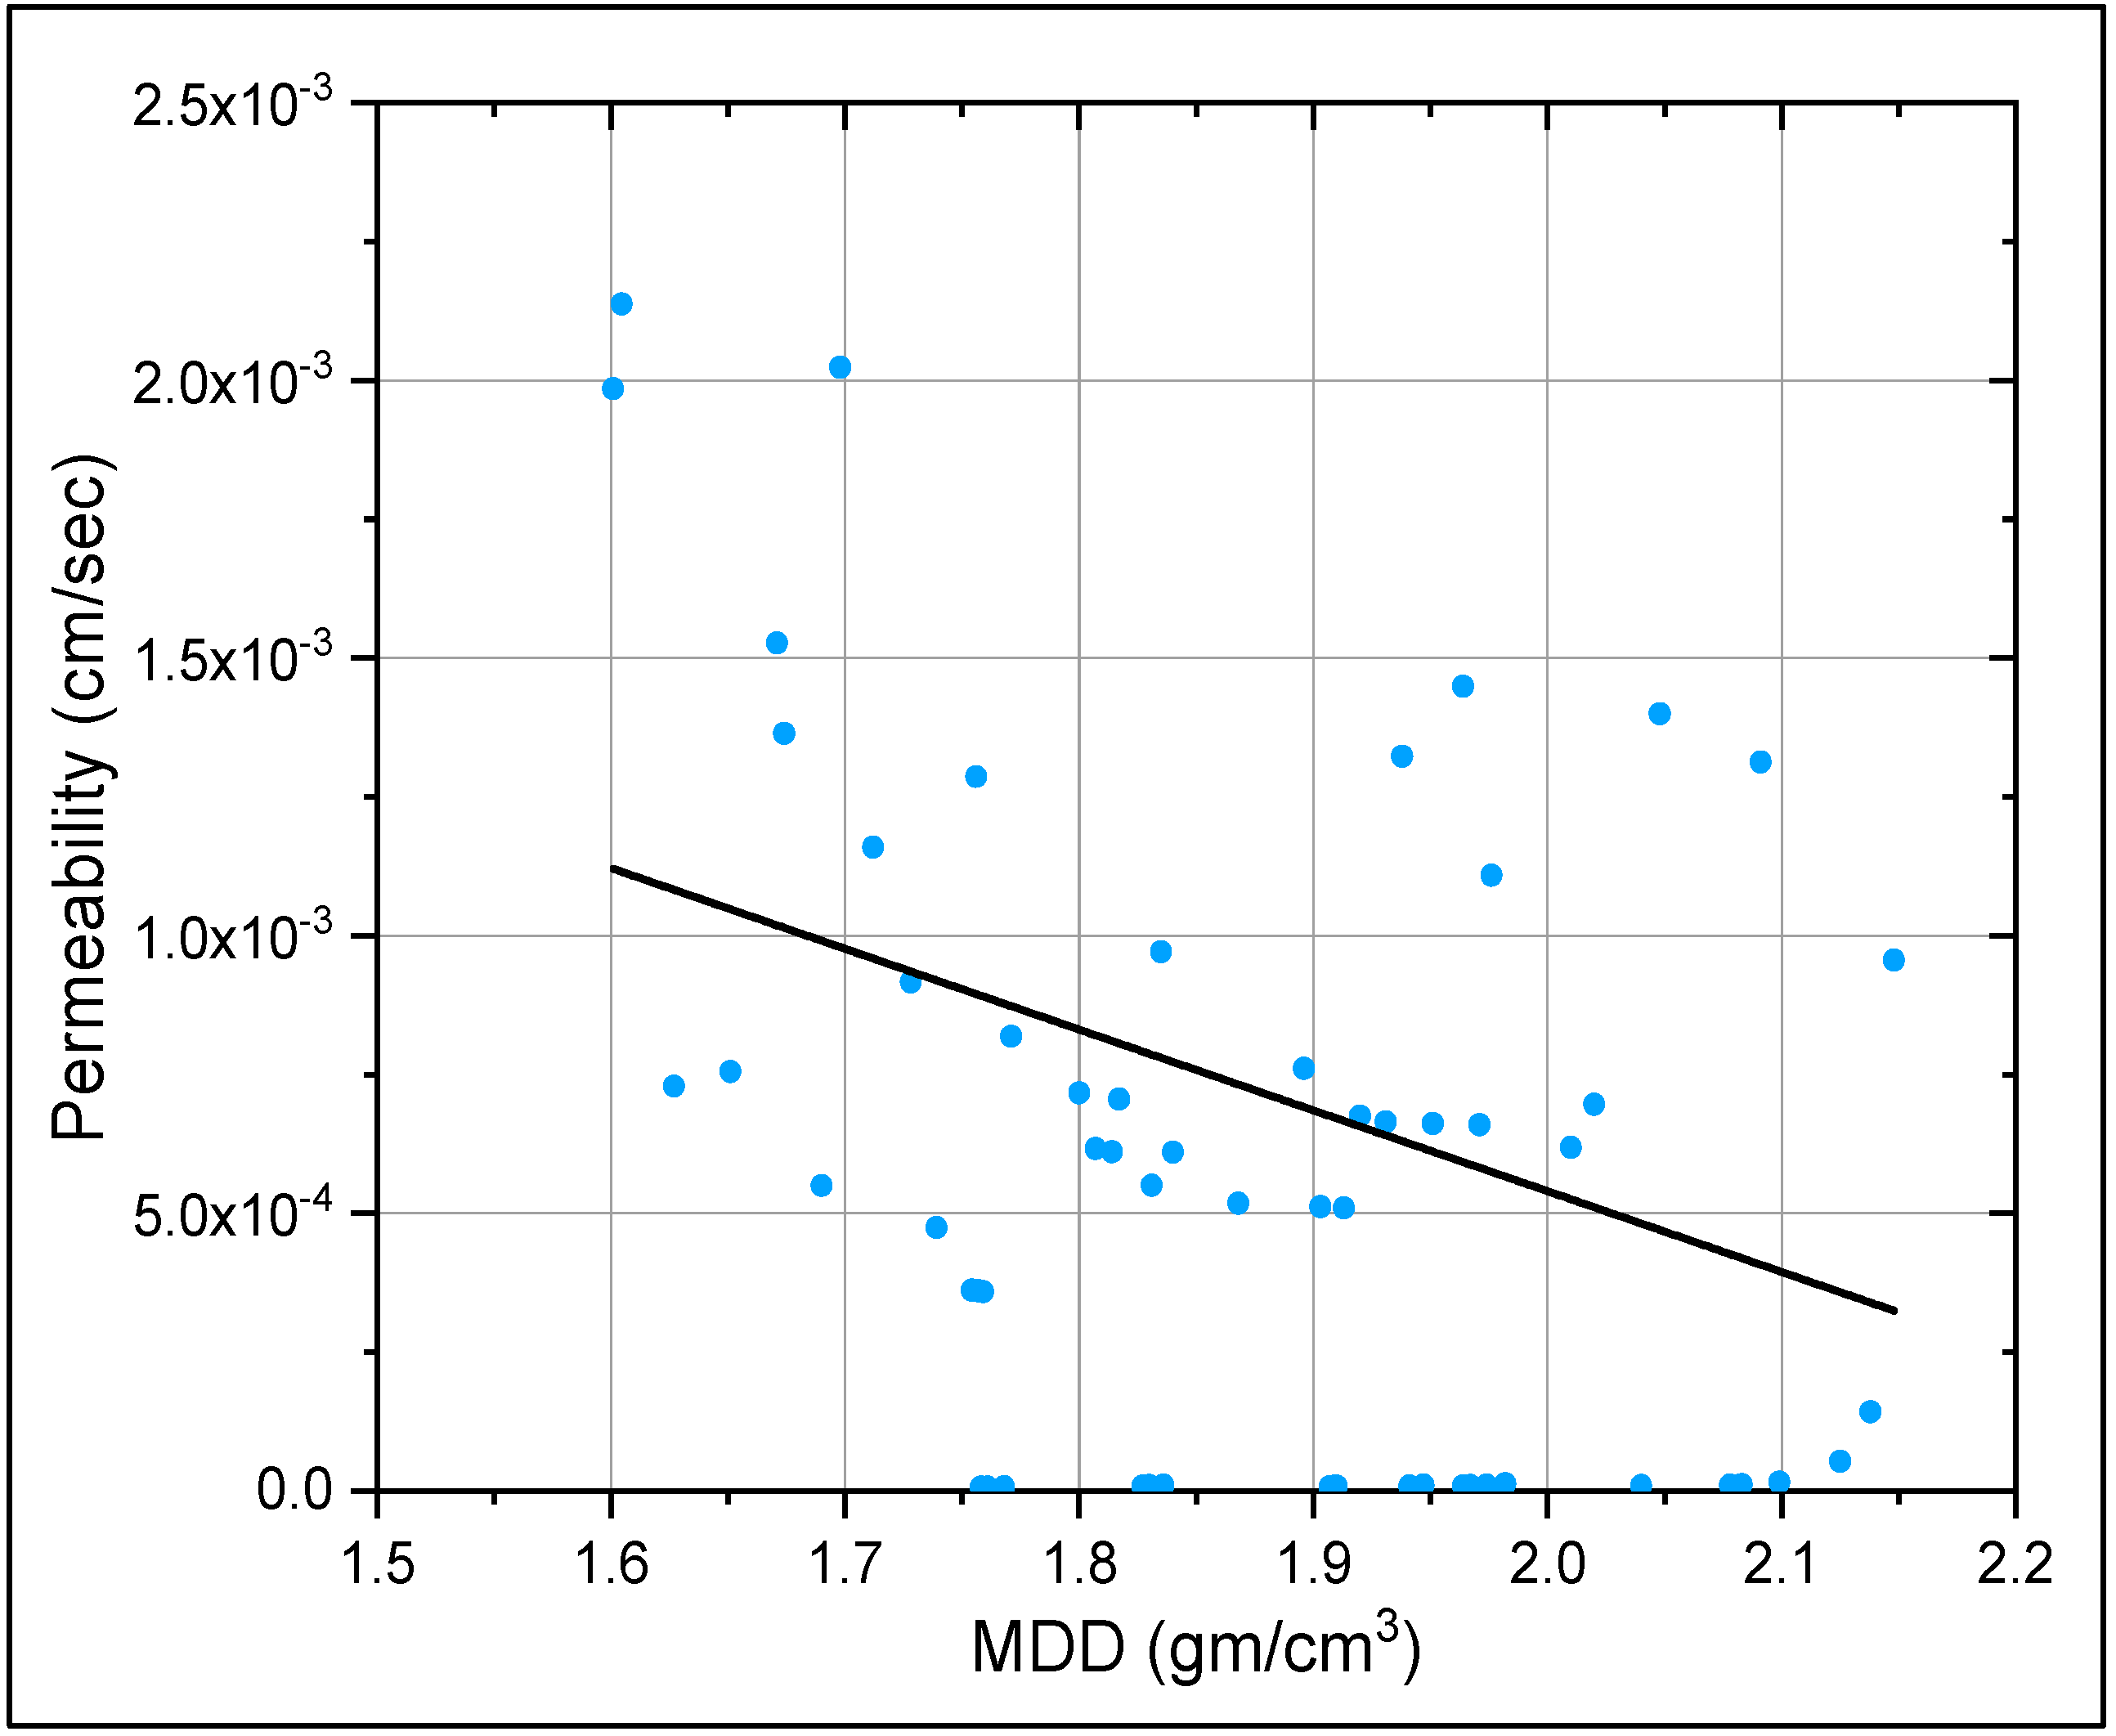
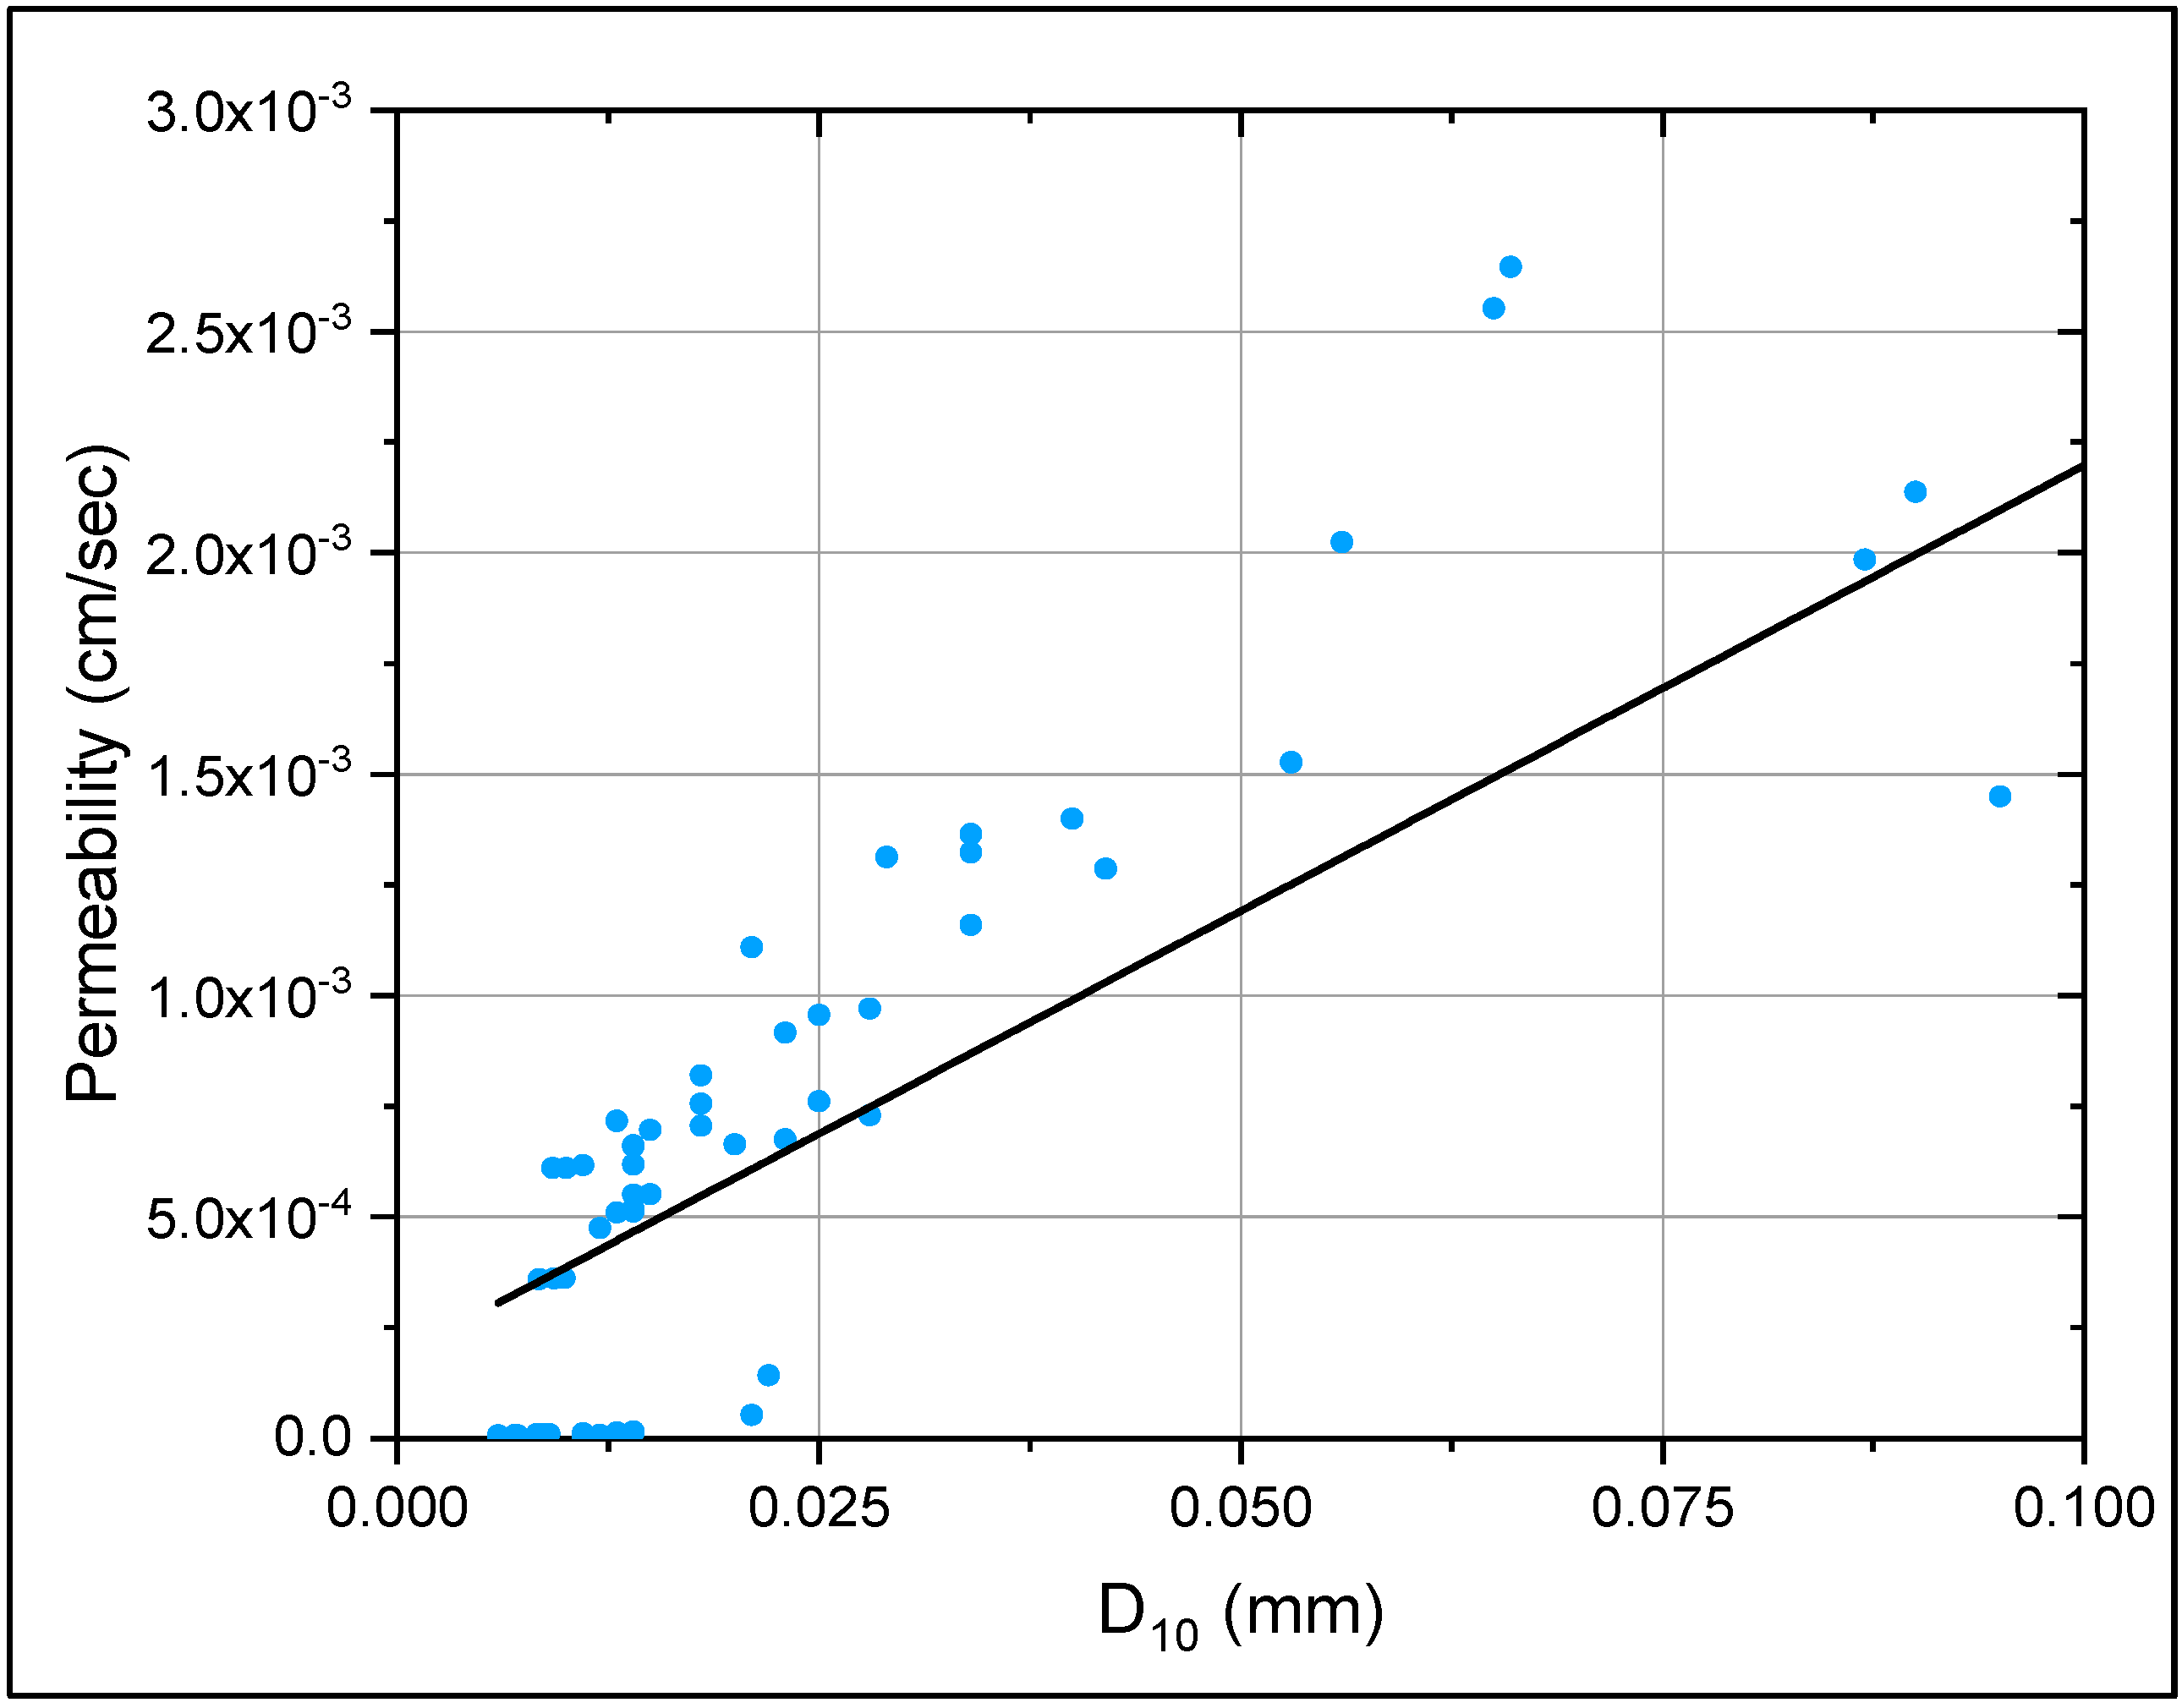
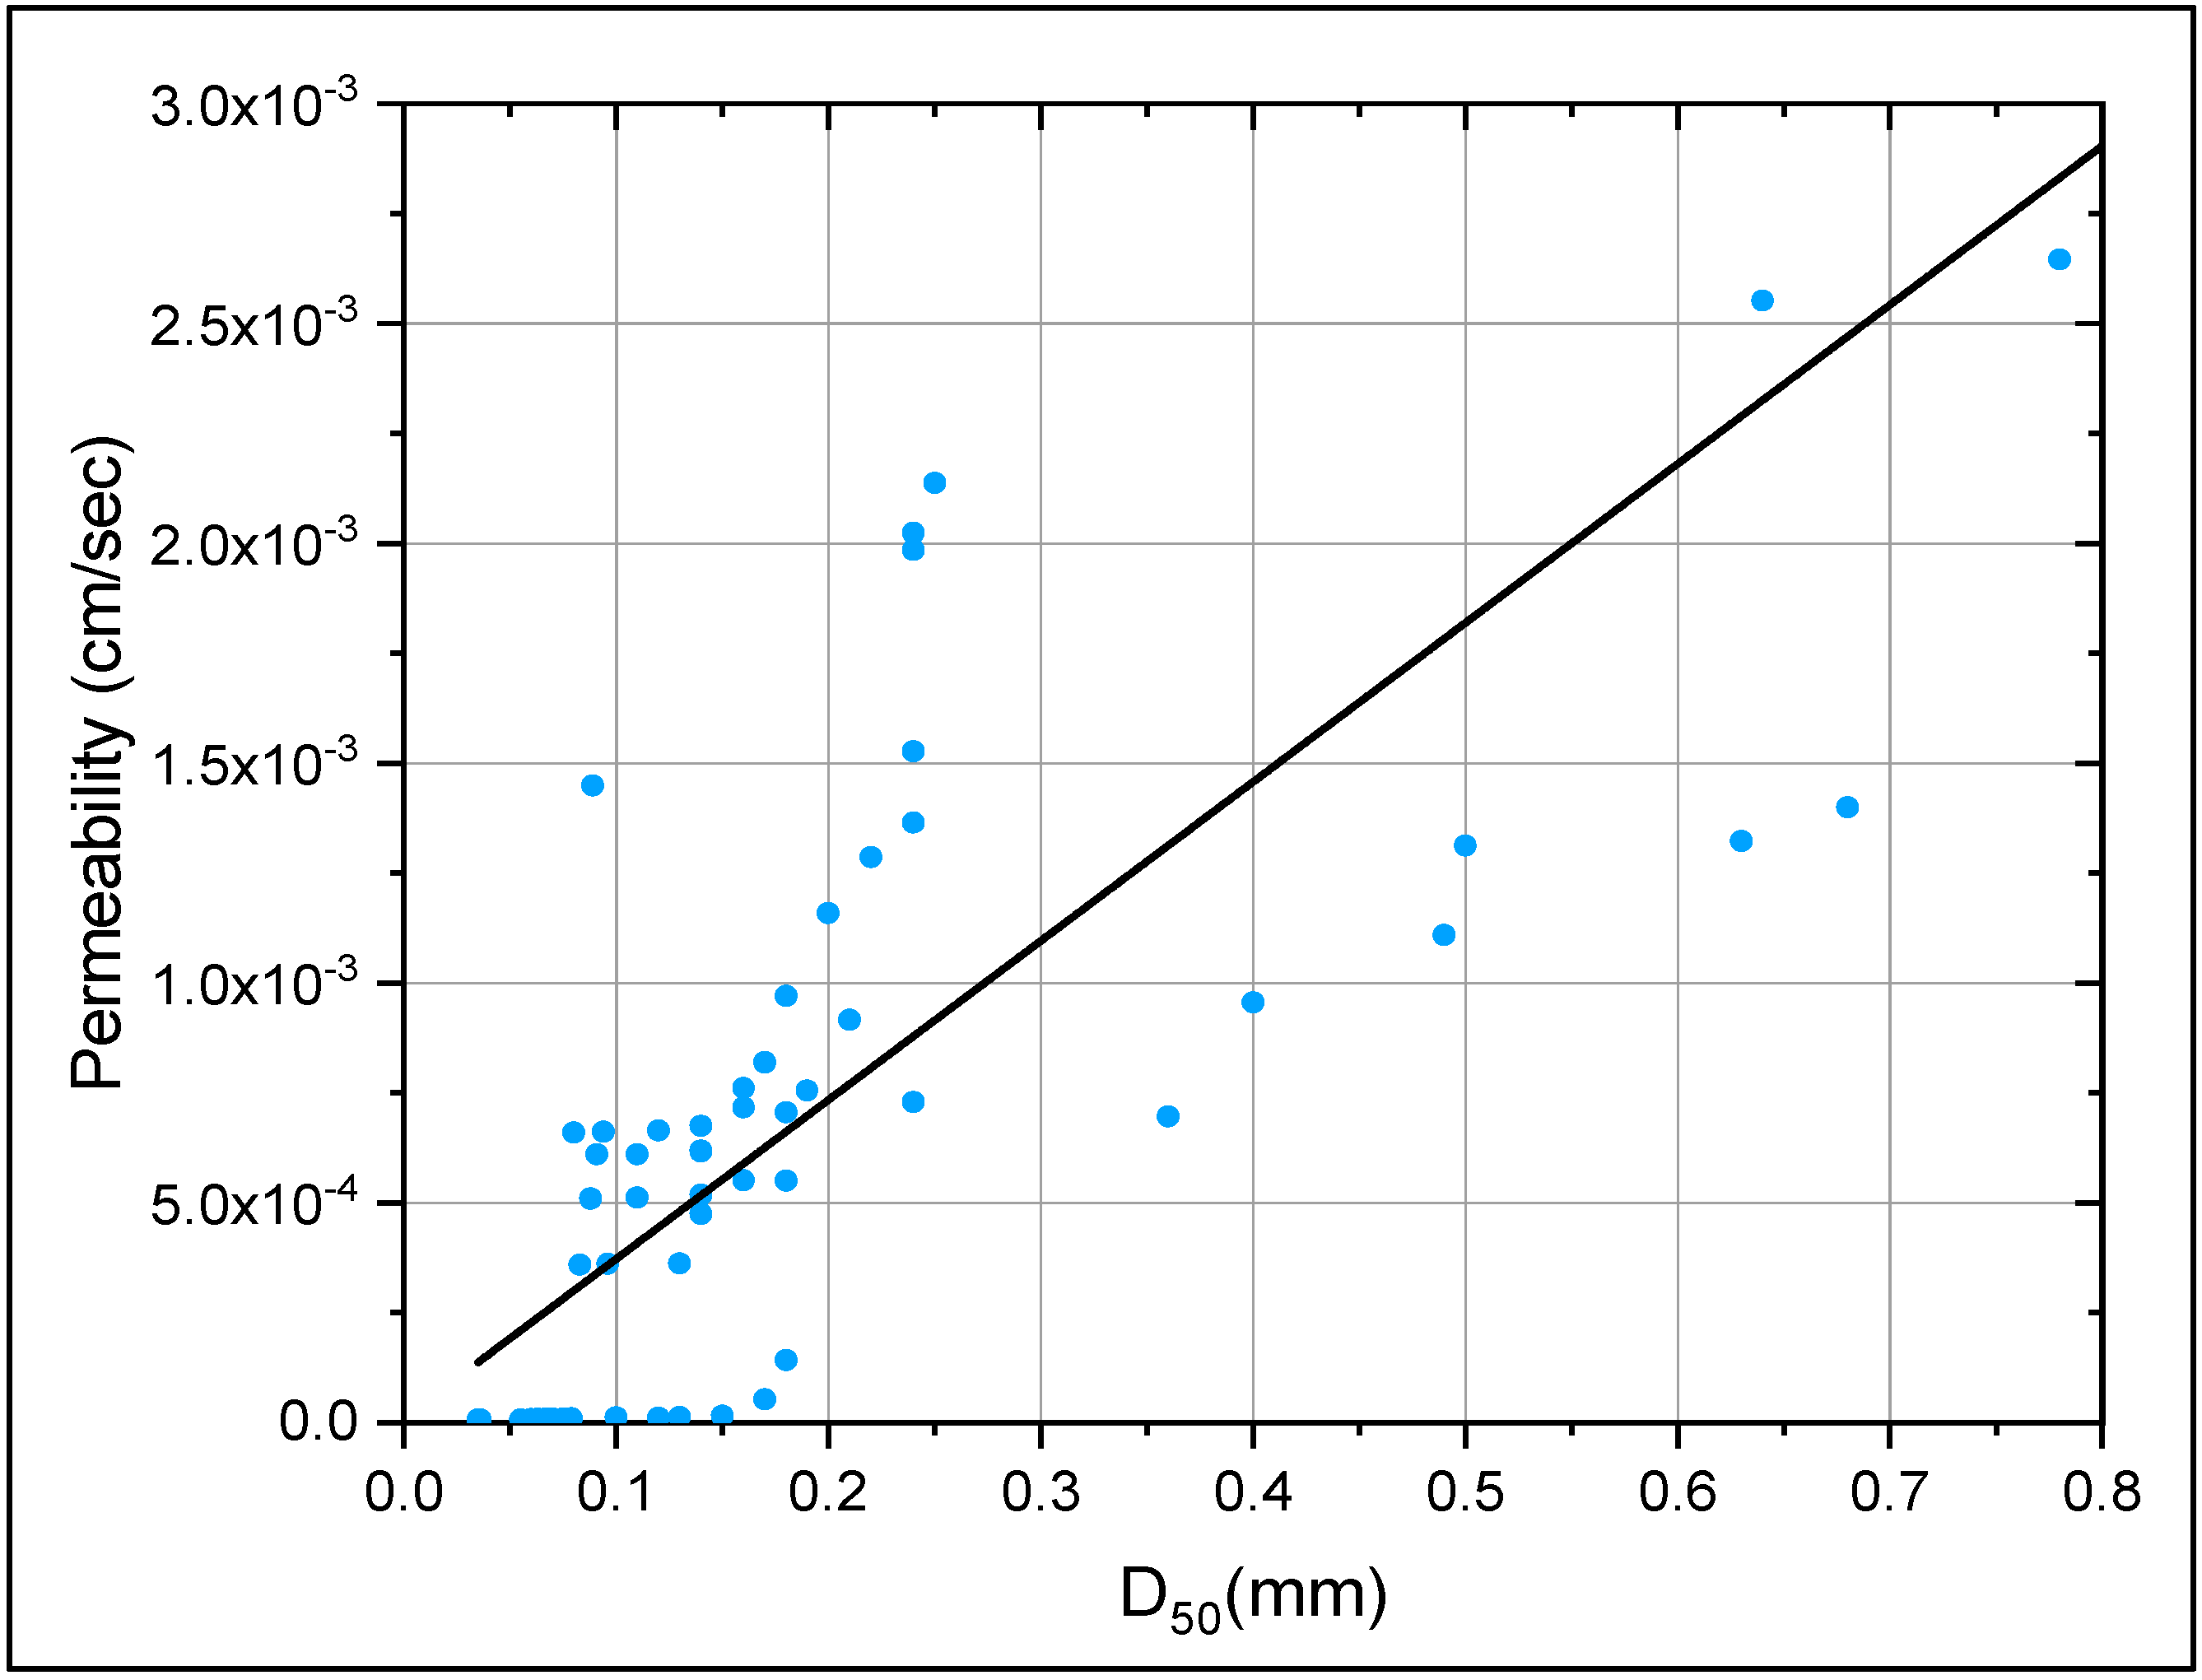
3.4. The Development of Correlations
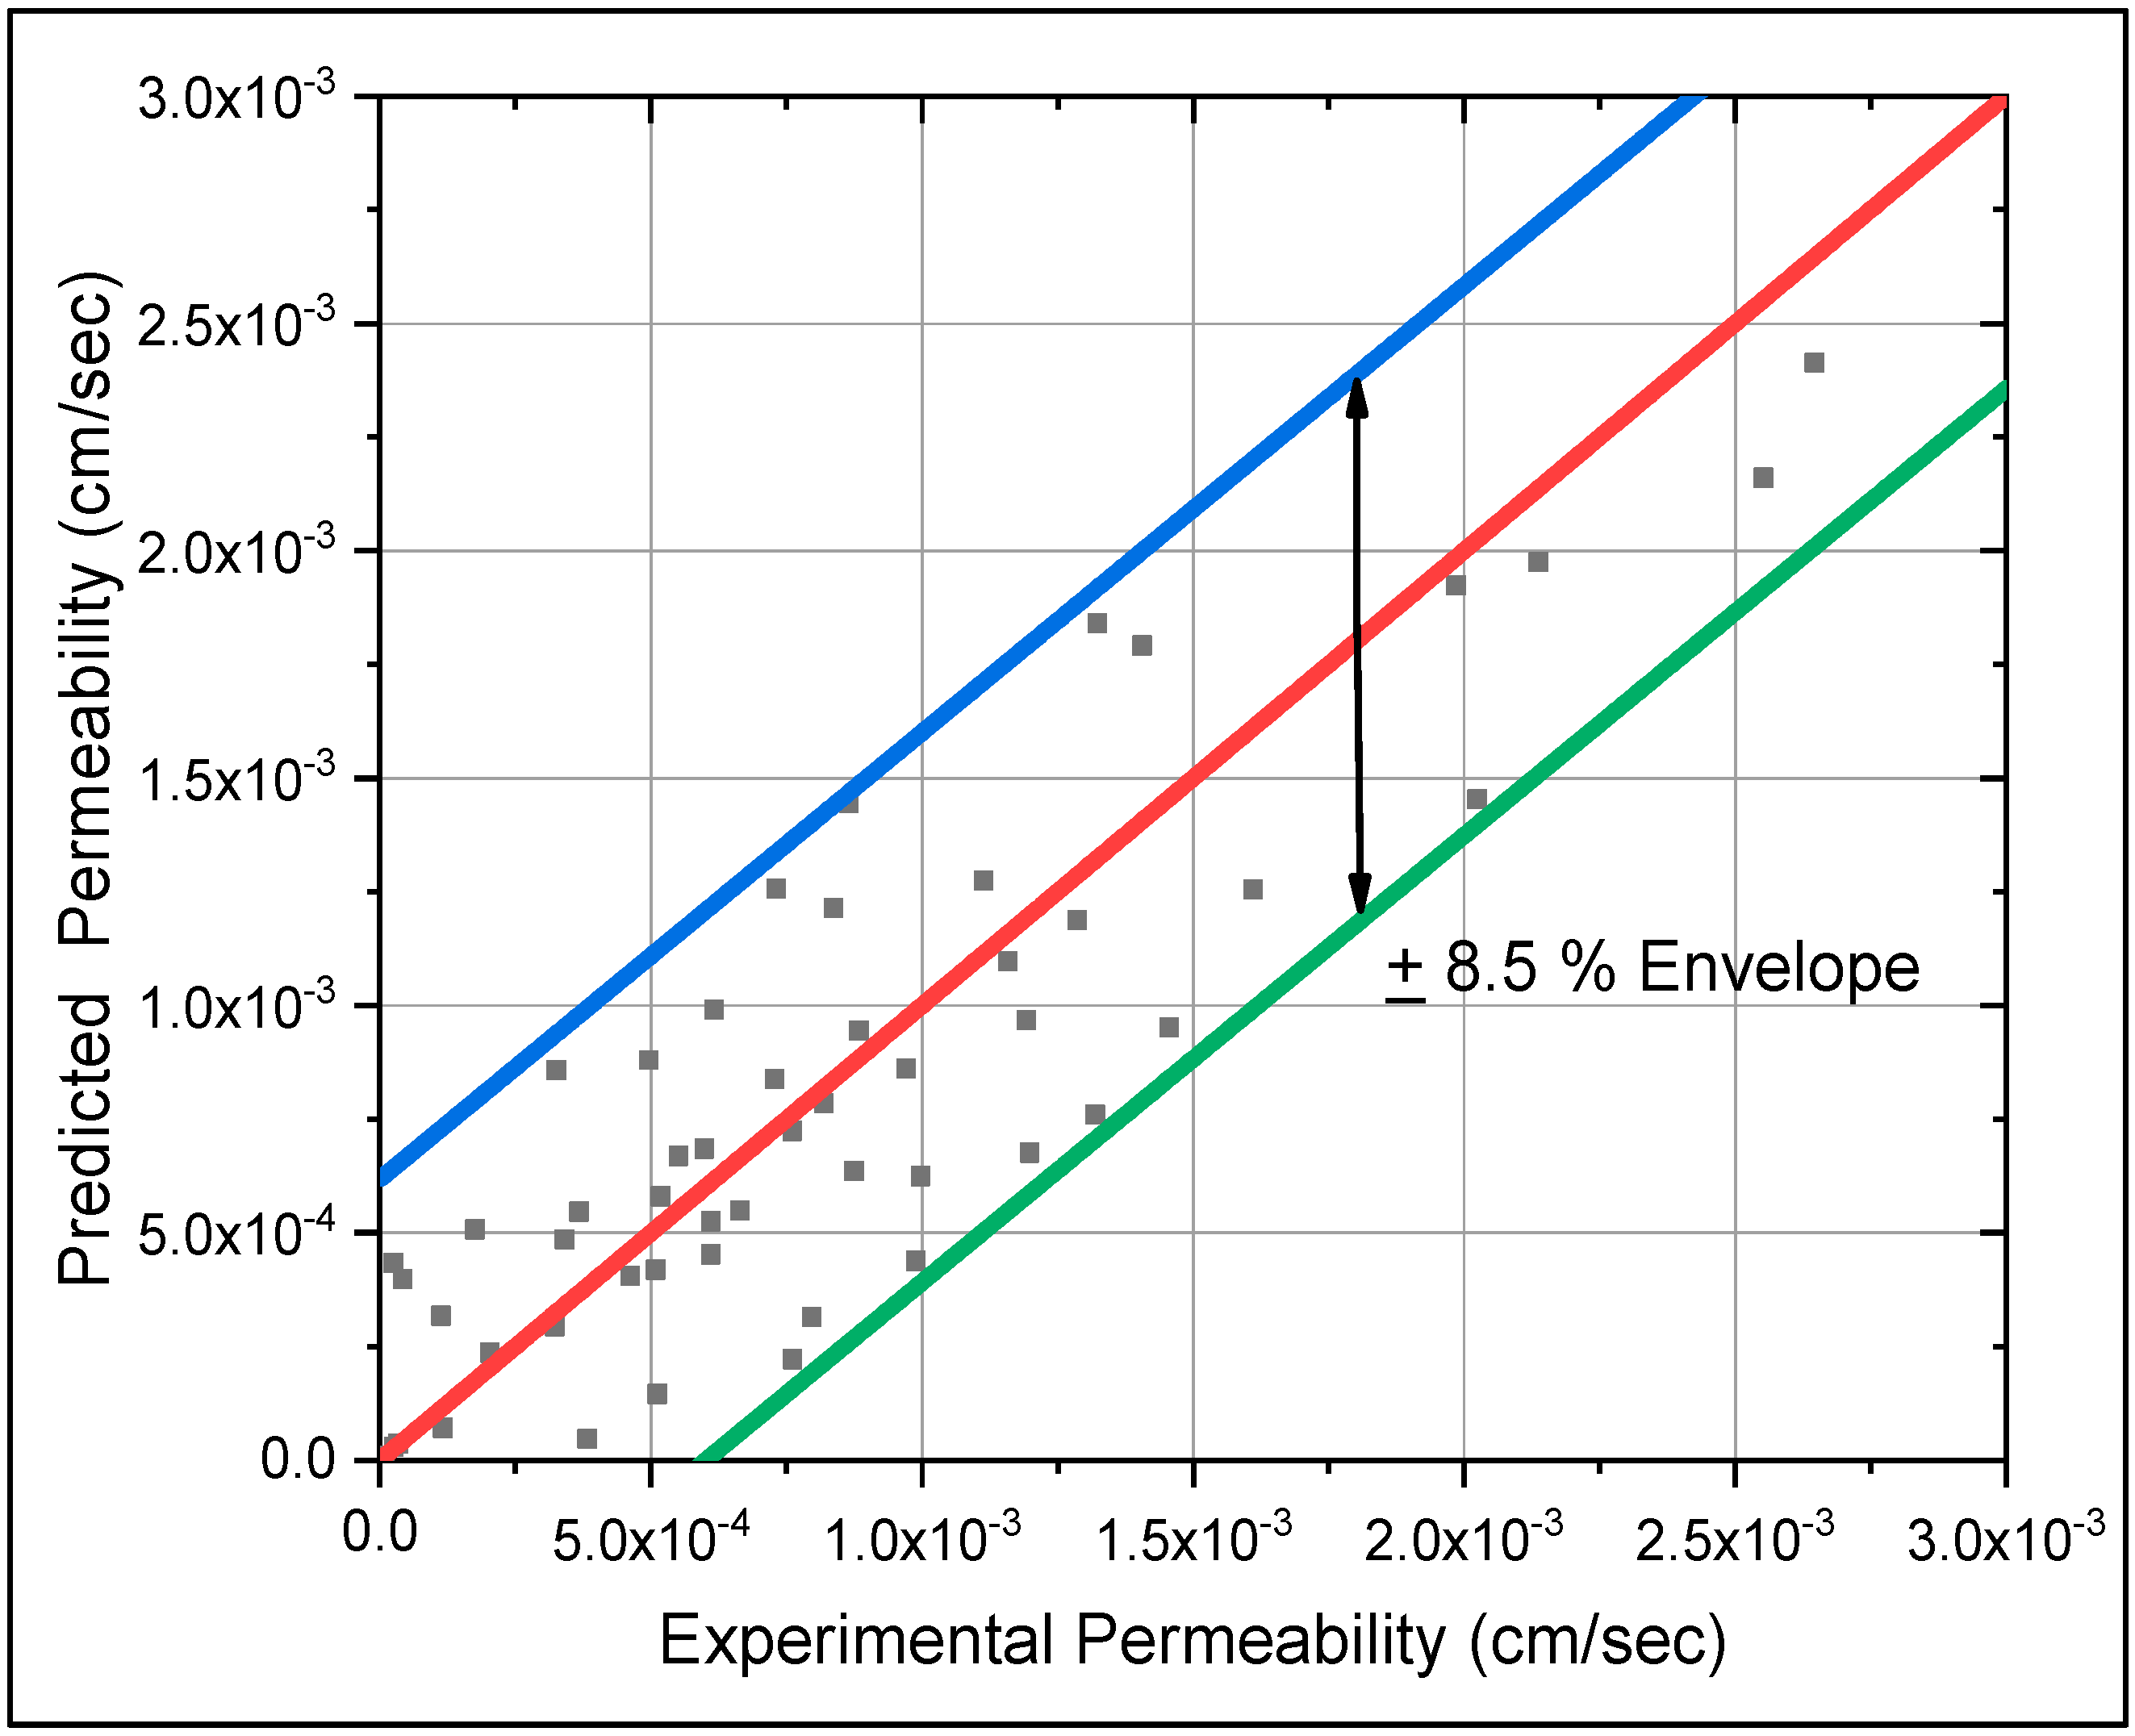
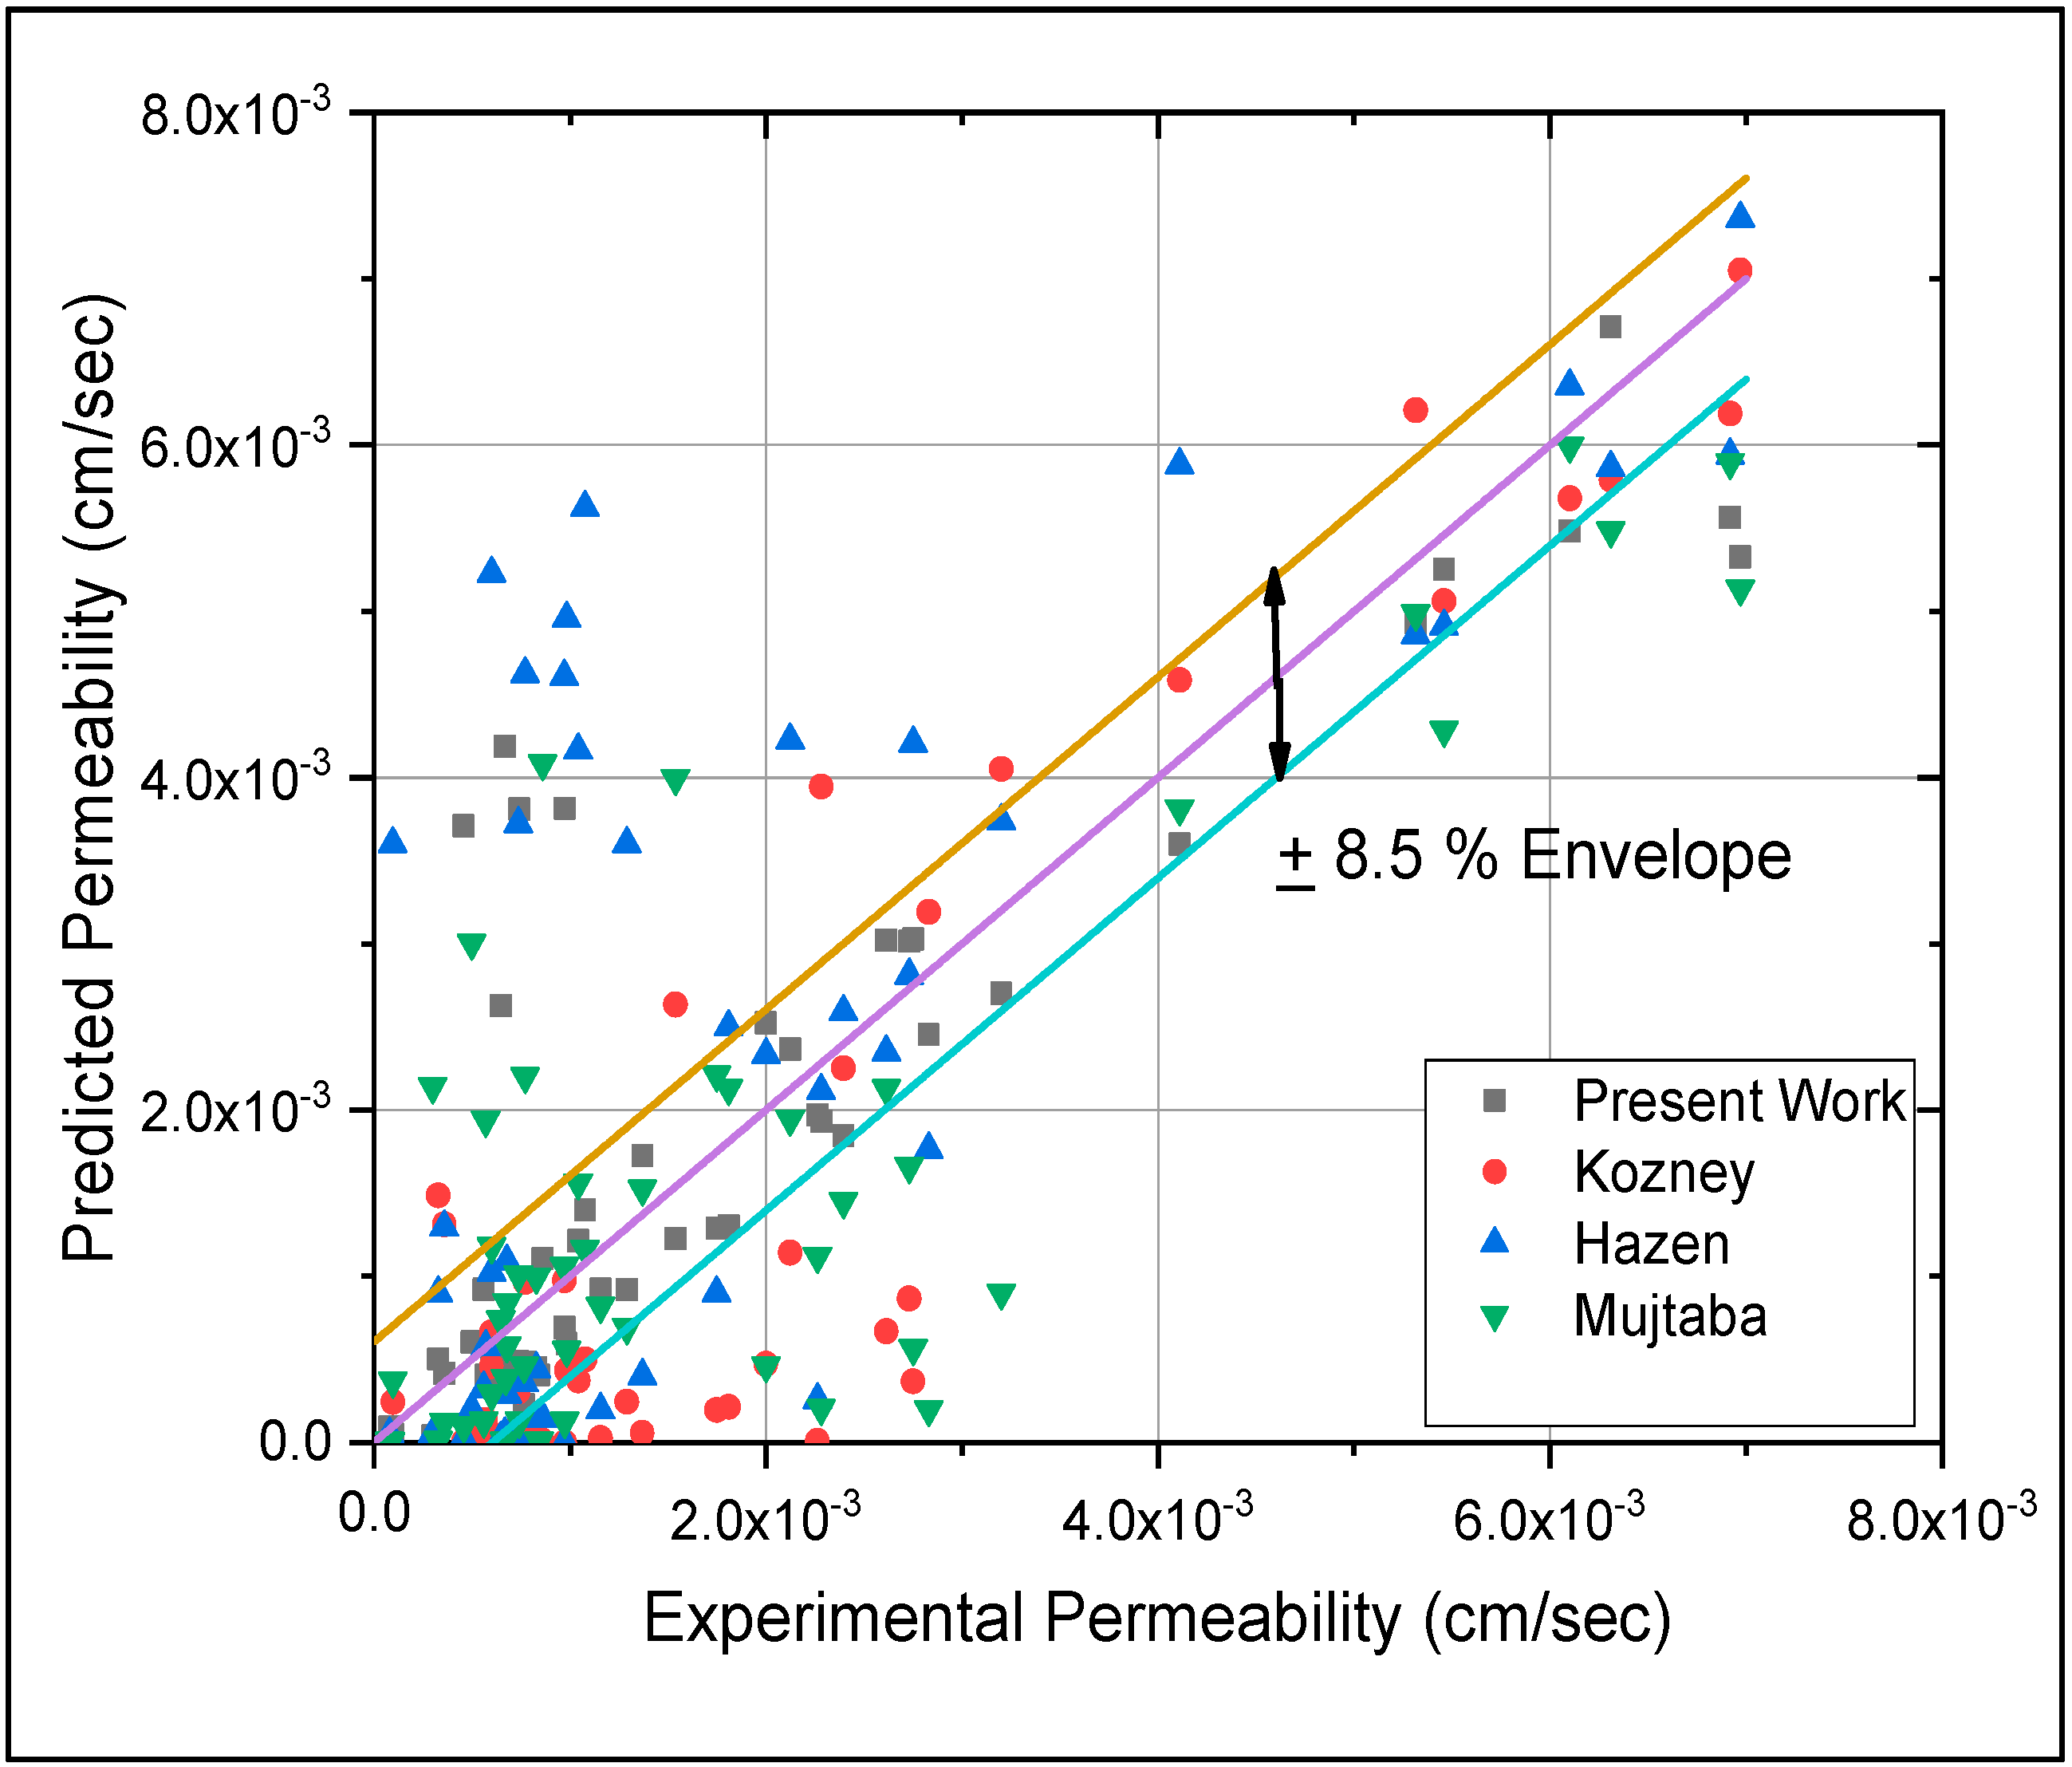
3.5. Data Validation
4. Conclusions
- The study of literature indicates that most equations developed for predicting the permeability are for granular soils with little effort being made for fine-grained soils. Analysis showed that the equation developed in this research is very much suitable for soils of local formations when fine content ranges from 0% to 50%.
- The equation formulated with the experimental data was compared with three empirical equations and it was found that this equation predicted better with fine-grained soils (hydraulic conductivity value less than 3 × 10⁻³ cm/sec) than the other three. The analysis also demonstrated that at lower ranges of fine contents, other equations perform well; however, as the percentages of fine content increases, their adaptability is questioned.
Author Contributions
Funding
Acknowledgments
Conflicts of Interest
References
- Sivapullaiah, P.; Sridharan, A.; Stalin, V. Hydraulic conductivity of bentonite-sand mixtures. Can. Geotech. J. 2011, 37, 406–413. [Google Scholar]
- Tizpa, P.; Chenari, R.J.; Fard, M.K.; Machado, S.L. ANN prediction of some geotechnical properties of soil from their index parameters. Arab. J. Geosci. 2015, 8, 2911–2920. [Google Scholar]
- Alhassan, M. Permeability of lateritic soil treated with lime and rice husk ash. Assumpt. Univ. J. Thail. 2008, 12, 115–120. [Google Scholar]
- Roy, S.; Bhalla, S.K. Role of geotechnical properties of soil on civil engineering structures. Resour. Environ. 2017, 7, 103–109. [Google Scholar]
- Elhakim, A.F. Estimation of soil permeability. Alex. Eng. J. 2016, 55, 2631–2638. [Google Scholar] [CrossRef] [Green Version]
- Barzegari, G. Geotechnical evaluation of dam foundation with special reference to in situ permeability: A case study. Geotech. Geol. Eng. 2017, 35, 991–1011. [Google Scholar] [CrossRef]
- Hazen, A. Discussion: Dams on sand foundations. Trans. Am. Soc. Civ. Eng. 1911, 73, 190–207. [Google Scholar]
- Zunker, F. Das verhalten des bodens zum wasser. In Die Physikalische Beschaffenheit des Bodens; Springer: Berlin, Germany, 1930; pp. 66–220. [Google Scholar]
- Carman, P.C. Fluid flow through granular beds. Trans. Inst. Chem. Eng. 1937, 15, 150–166. [Google Scholar] [CrossRef]
- Burmister, D. Principles of permeability testing of soils. In Symposium on permeability of soils; ASTM International: West Conshohocken, PA, USA, 1955; pp. 3–26. [Google Scholar]
- Michaels, A.S.; Lin, C. Permeability of kaolinite. Ind. Eng. Chem. 1954, 46, 1239–1246. [Google Scholar] [CrossRef]
- Olsen, H.W. Hydraulic flow through saturated clays. Clays Clay Miner. 1960, 9, 131–161. [Google Scholar]
- Mitchell, J.K.; Hooper, D.R.; Campenella, R.G. Permeability of compacted clay. J. Soil Mech. Found. Division 1965, 91, 41–66. [Google Scholar]
- Wang, M.; Huang, C. Soil compaction and permeability prediction models. J. Environ. Eng. 1984, 110, 1063–1083. [Google Scholar] [CrossRef]
- Alyamani, M.S.; Şen, Z. Determination of hydraulic conductivity from complete grain-size distribution curves. Groundw. 1993, 31, 551–555. [Google Scholar] [CrossRef]
- Koltermann, C.E.; Gorelick, S.M. Fractional packing model for hydraulic conductivity derived from sediment mixtures. Water Resour. Res. 1995, 31, 3283–3297. [Google Scholar] [CrossRef]
- D’Andrea, R.; Boadu, F.K. Hydraulic Conductivity of Soils from Grain-Size Distribution: New Models. J. Geotech. Geoenviron. Eng. 2001, 127, 899–900. [Google Scholar] [CrossRef]
- Chapuis, R.P. Predicting the saturated hydraulic conductivity of sand and gravel using effective diameter and void ratio. Can. Geotech. J. 2004, 41, 787–795. [Google Scholar] [CrossRef]
- Sinha, S.K.; Wang, M.C. Artificial neural network prediction models for soil compaction and permeability. Geotech. Geol. Eng. 2008, 26, 47–64. [Google Scholar] [CrossRef]
- Côté, J.; Fillion, M.-H.; Konrad, J.-M. Estimating hydraulic and thermal conductivities of crushed granite using porosity and equivalent particle size. J. Geotech. Geoenviron. Eng. 2011, 137, 834–842. [Google Scholar] [CrossRef]
- Cabalar, A.F.; Akbulut, N. Evaluation of actual and estimated hydraulic conductivity of sands with different gradation and shape. SpringerPlus 2016, 5, 820. [Google Scholar] [CrossRef]
- van Ginkel, M.; Olsthoorn, T.N. Distribution of grain size and resulting hydraulic conductivity in land reclamations constructed by bottom dumping, rainbowing and pipeline discharge. Water Res. Manag. 2019, 33, 993–1012. [Google Scholar] [CrossRef]
- Carrier, W.D., III. Goodbye, hazen; hello, kozeny-carman. J. Geotech. Geoenviron. Eng. 2003, 129, 1054–1056. [Google Scholar] [CrossRef]
- Göktepe, A.B.; Sezer, A. Effect of particle shape on density and permeability of sands. Proc. the Inst. Civ. Eng.-Geotech. Eng. 2010, 163, 307–320. [Google Scholar] [CrossRef]
- Jabro, J. Estimation of saturated hydraulic conductivity of soils from particle size distribution and bulk density data. Trans. ASAE 1992, 35, 557–560. [Google Scholar] [CrossRef]
- Holtz, R.D.; Kovacs, W.; Sheahan, T. An Introduction to Geotechnical Engineering, 2nd. 2011; Pearson plc: London, UK, 1981. [Google Scholar]
- DeGroot, D.; Ostendorf, D.; Judge, A. In situ measurement of hydraulic conductivity of saturated soils. Geotech. Eng. J. SEAGS AGSSEA 2012, 43, 63–72. [Google Scholar]
- Kalkan, E.; Akbulut, S. The positive effects of silica fume on the permeability, swelling pressure and compressive strength of natural clay liners. Eng. Geol. 2004, 73, 145–156. [Google Scholar] [CrossRef]
- Ameta, N.; Wayal, A.S. Effect of bentonite on permeability of dune sand. Electron. J. Geotech. Eng. 2008, 13, 1–7. [Google Scholar]
- Muhammad, M. Experimental Study on Permeability Characteristics of Sand Mixed with Fine Grained Soils. MS Thesis, University of Engineering & Technology, Lahore, Pakistan, 2016. [Google Scholar]
- Mujtaba, H. Development of correlations between various geotechnical parameters for granular soils in Punjab. Ph.D Thesis, University of Engineering and Technology, Lahore, Pakistan, 2015. [Google Scholar]
- Kozeny, J. Uber Kapillare Leitung Des Wassers in Boden. R. Acad. Sci. 1927, 73, 271–306. [Google Scholar]
- Carman, P.C. The determination of the specific surface of powders. I. J. Soc. Chem. Ind. 1938, 57, 225. [Google Scholar]
- Carman, P.C. Flow of gases through porous media; Butterworths Scientific Publications: London, UK, 1956. [Google Scholar]
- Hazen, A. Some physical properties of sands and gravels, with special reference to their use in filtration, 24th annual report; Massachusetts State Board of Health: Boston, MA, USA, 1983; pp. 539–556. [Google Scholar]

| Sample No | Sand Type | FINES TYPE | Fines (%) | D10 (mm) | D30 (mm) | D60 (mm) | D50 (mm) | Cu | Cc | Liquid Limit | Plastic Limit | Plasticity Index | Soil Classification |
|---|---|---|---|---|---|---|---|---|---|---|---|---|---|
| 1 | CS | --- | --- | 0.09 | 0.16 | 0.31 | 0.25 | 3.44 | 0.92 | - | - | NP | SP |
| 2 | CS | NPF | 5 | 0.076 | 0.16 | 0.28 | 0.25 | 3.68 | 1.20 | - | - | NP | SP-SM |
| 3 | CS | NPF | 10 | 0.055 | 0.15 | 0.28 | 0.23 | 5.09 | 1.46 | - | - | NP | SM |
| 4 | CS | NPF | 15 | 0.043 | 0.13 | 0.27 | 0.21 | 6.28 | 1.46 | - | - | NP | SM |
| 5 | CS | NPF | 20 | 0.025 | 0.098 | 0.22 | 0.16 | 8.80 | 1.75 | - | - | NP | SM |
| 6 | CS | NPF | 25 | 0.026 | 0.081 | 0.23 | 0.18 | 8.85 | 1.10 | - | - | NP | SM |
| 7 | CS | NPF | 30 | 0.024 | 0.067 | 0.22 | 0.17 | 9.17 | 0.85 | - | - | NP | SM |
| 8 | CS | NPF | 35 | 0.016 | 0.05 | 0.19 | 0.14 | 11.88 | 0.82 | - | - | NP | SM |
| 9 | CS | NPF | 40 | 0.015 | 0.042 | 0.18 | 0.12 | 12.00 | 0.65 | 16.85 | - | NP | SM |
| 10 | CS | NPF | 45 | 0.013 | 0.033 | 0.17 | 0.077 | 13.08 | 0.49 | 18.25 | - | NP | SM |
| 11 | CS | NPF | 50 | 0.013 | 0.028 | 0.14 | 0.067 | 10.77 | 0.43 | 19.30 | - | NP | ML |
| 12 | CS | PF | 5 | 0.053 | 0.16 | 0.28 | 0.24 | 5.28 | 1.73 | - | - | NP | SP-SM |
| 13 | CS | PF | 10 | 0.051 | 0.14 | 0.28 | 0.22 | 5.49 | 1.37 | - | - | NP | SM |
| 14 | CS | PF | 15 | 0.03 | 0.13 | 0.26 | 0.22 | 8.67 | 2.17 | - | - | NP | SM |
| 15 | CS | PF | 20 | 0.018 | 0.098 | 0.26 | 0.18 | 14.44 | 2.05 | - | - | NP | SM |
| 16 | CS | PF | 25 | 0.017 | 0.077 | 0.23 | 0.17 | 13.53 | 1.52 | - | - | NP | SM |
| 17 | CS | PF | 30 | 0.013 | 0.055 | 0.22 | 0.17 | 16.92 | 1.06 | - | - | NP | SM |
| 18 | CS | PF | 35 | 0.012 | 0.039 | 0.19 | 0.14 | 15.83 | 0.67 | - | - | NP | SM |
| 19 | CS | PF | 40 | 0.0094 | 0.03 | 0.18 | 0.13 | 19.15 | 0.53 | 18.80 | - | NP | SM |
| 20 | CS | PF | 45 | 0.0085 | 0.027 | 0.17 | 0.087 | 20.00 | 0.50 | 19.75 | 18.14 | 1.61 | SM |
| 21 | CS | PF | 50 | 0.0078 | 0.023 | 0.14 | 0.058 | 17.95 | 0.48 | 20.25 | 17.97 | 2.28 | ML |
| 22 | LS | --- | --- | 0.26 | 0.57 | 1.2 | 0.87 | 4.62 | 1.04 | - | - | NP | SP |
| 23 | LS | NPF | 5 | 0.17 | 0.54 | 1.1 | 0.86 | 6.47 | 1.56 | - | - | NP | SP-SM |
| 24 | LS | NPF | 10 | 0.06 | 0.49 | 1 | 0.78 | 16.67 | 4.00 | - | - | NP | SM |
| 25 | LS | NPF | 15 | 0.046 | 0.45 | 0.94 | 0.74 | 20.43 | 4.68 | - | - | NP | SM |
| 26 | LS | NPF | 20 | 0.039 | 0.41 | 0.9 | 0.7 | 23.08 | 4.79 | - | - | NP | SM |
| 27 | LS | NPF | 25 | 0.029 | 0.26 | 0.87 | 0.67 | 30.00 | 2.68 | - | - | NP | SM |
| 28 | LS | NPF | 30 | 0.026 | 0.17 | 0.8 | 0.6 | 30.77 | 1.39 | 14.30 | - | NP | SM |
| 29 | LS | NPF | 35 | 0.016 | 0.066 | 0.7 | 0.51 | 43.75 | 0.39 | 15.40 | - | NP | SM |
| 30 | LS | NPF | 40 | 0.015 | 0.041 | 0.6 | 0.41 | 40.00 | 0.19 | 16.70 | - | NP | SM |
| 31 | LS | NPF | 45 | 0.014 | 0.028 | 0.51 | 0.17 | 36.43 | 0.11 | 18.72 | - | NP | SM |
| 32 | LS | NPF | 50 | 0.013 | 0.028 | 0.45 | 0.07 | 34.62 | 0.13 | 19.80 | - | NP | ML |
| 33 | LS | PF | 5 | 0.18 | 0.55 | 1.1 | 0.84 | 6.11 | 1.53 | - | - | NP | SP-SM |
| 34 | LS | PF | 10 | 0.07 | 0.49 | 1 | 0.77 | 14.29 | 3.43 | - | - | NP | SM |
| 35 | LS | PF | 15 | 0.032 | 0.45 | 0.94 | 0.73 | 29.38 | 6.73 | - | - | NP | SM |
| 36 | LS | PF | 20 | 0.023 | 0.4 | 0.9 | 0.7 | 39.13 | 7.73 | - | - | NP | SM |
| 37 | LS | PF | 25 | 0.019 | 0.26 | 0.87 | 0.66 | 45.79 | 4.09 | 16.80 | 16.17 | 0.63 | SM |
| 38 | LS | PF | 30 | 0.016 | 0.17 | 0.8 | 0.6 | 50.00 | 2.26 | 17.85 | 16.87 | 0.98 | SM |
| 39 | LS | PF | 35 | 0.013 | 0.05 | 0.7 | 0.5 | 53.85 | 0.27 | 19.60 | 17.88 | 1.72 | SM |
| 40 | LS | PF | 40 | 0.01 | 0.034 | 0.62 | 0.42 | 62.00 | 0.19 | 20.30 | 17.84 | 2.46 | SM |
| 41 | LS | PF | 45 | 0.0092 | 0.028 | 0.52 | 0.18 | 56.52 | 0.16 | 22.77 | 19.57 | 3.20 | SM |
| 42 | LS | PF | 50 | 0.0085 | 0.024 | 0.46 | 0.068 | 54.12 | 0.15 | 23.20 | 20.03 | 3.17 | ML |
| 43 | RS | --- | --- | 0.085 | 0.17 | 0.26 | 0.22 | 3.06 | 1.31 | - | - | NP | SP-SM |
| 44 | RS | NPF | 5 | 0.066 | 0.16 | 0.26 | 0.21 | 3.94 | 1.49 | - | - | NP | SP-SM |
| 45 | RS | NPF | 10 | 0.036 | 0.14 | 0.24 | 0.19 | 6.67 | 2.27 | - | - | NP | SM |
| 46 | RS | NPF | 15 | 0.027 | 0.13 | 0.23 | 0.18 | 8.52 | 2.72 | - | - | NP | SM |
| 47 | RS | NPF | 20 | 0.017 | 0.09 | 0.22 | 0.18 | 12.94 | 2.17 | - | - | NP | SM |
| 48 | RS | NPF | 25 | 0.017 | 0.075 | 0.2 | 0.17 | 11.76 | 1.65 | - | - | NP | SM |
| 49 | RS | NPF | 30 | 0.014 | 0.05 | 0.19 | 0.16 | 13.57 | 0.94 | - | - | NP | SM |
| 50 | RS | NPF | 35 | 0.013 | 0.038 | 0.18 | 0.15 | 13.85 | 0.62 | - | - | NP | SM |
| 51 | RS | NPF | 40 | 0.013 | 0.031 | 0.017 | 0.11 | 1.31 | 4.35 | 17.70 | - | NP | SM |
| 52 | RS | NPF | 45 | 0.013 | 0.029 | 0.16 | 0.084 | 12.31 | 0.40 | 18.90 | - | NP | SM |
| 53 | RS | NPF | 50 | 0.013 | 0.021 | 0.14 | 0.048 | 10.77 | 0.24 | 19.70 | - | NP | ML |
| 54 | RS | PF | 5 | 0.066 | 0.16 | 0.24 | 0.2 | 3.64 | 1.62 | - | - | NP | SP-SM |
| 55 | RS | PF | 10 | 0.03 | 0.12 | 0.24 | 0.19 | 8.00 | 2.00 | - | - | NP | SM |
| 56 | RS | PF | 15 | 0.021 | 0.14 | 0.23 | 0.18 | 10.95 | 4.06 | - | - | NP | SM |
| 57 | RS | PF | 20 | 0.014 | 0.09 | 0.22 | 0.18 | 15.71 | 2.63 | - | - | NP | SM |
| 58 | RS | PF | 25 | 0.013 | 0.075 | 0.2 | 0.17 | 15.38 | 2.16 | - | - | NP | SM |
| 59 | RS | PF | 30 | 0.011 | 0.047 | 0.18 | 0.16 | 16.36 | 1.12 | - | - | NP | SM |
| 60 | RS | PF | 35 | 0.0084 | 0.032 | 0.18 | 0.15 | 21.43 | 0.68 | - | - | NP | SM |
| 61 | RS | PF | 40 | 0.0088 | 0.028 | 0.17 | 0.12 | 19.32 | 0.52 | 17.90 | - | NP | SM |
| 62 | RS | PF | 45 | 0.0083 | 0.025 | 0.16 | 0.084 | 19.28 | 0.47 | 19.50 | 18.32 | 1.18 | SM |
| 63 | RS | PF | 50 | 0.0063 | 0.019 | 0.13 | 0.045 | 20.63 | 0.44 | 20.10 | 17.94 | 2.16 | ML |
| Sample No. | Gravel | Sand | Fines | Soil Class. | γd | Field Permeability |
|---|---|---|---|---|---|---|
| % | % | % | USCS | gm/cm3 | cm/sec | |
| S1 | 0 | 89 | 11 | SP-SM | 1.727 | 2.00 × 10⁻³ |
| S2 | 0 | 65 | 35 | SM | 1.688 | 2.83 × 10⁻³ |
| S3 | 0 | 91 | 9 | SP-SM | 1.748 | 7.37 × 10⁻⁴ |
| S4 | 0 | 81 | 19 | SM | 1.794 | 9.69 × 10⁻⁵ |
| S5 | 0 | 94 | 6 | SP-SM | 1.827 | 1.0 × 10⁻³ |
| S6 | 0 | 92 | 8 | SP-SM | 1.764 | 5.99 × 10⁻⁴ |
| S7 | 0 | 93 | 7 | SP-SM | 1.589 | 3.60 × 10⁻⁴ |
| S8 | 0 | 86 | 14 | SM | 1.836 | 1.29 × 10⁻³ |
| S9 | 0 | 90 | 10 | SP-SM | 1.735 | 1.08 × 10⁻³ |
| S10 | 0 | 57 | 43 | SM | 1.769 | 8.38 × 10⁻⁵ |
| S11 | 0 | 3 | 97 | ML | 1.782 | 7.42 × 10⁻⁴ |
| S12 | 0 | 2 | 98 | ML | 1.79 | 9.73 × 10⁻⁴ |
| S13 | 0 | 92 | 8 | SP-SM | 1.621 | 1.37 × 10⁻³ |
| S14 | 0 | 85 | 15 | SM | 1.6 | 5.59 × 10⁻⁴ |
| S15 | 0 | 85 | 15 | SM | 1.651 | 1.16 × 10⁻³ |
| S16 | 0 | 92 | 8 | SP-SM | 1464 | 2.12 × 10⁻³ |
| S17 | 0 | 97 | 3 | SP | 1.534 | 7.72 × 10⁻⁴ |
| S18 | 0 | 97 | 3 | SP | 1.596 | 1.81 × 10⁻³ |
| S19 | 0 | 91 | 9 | SP-SM | 1.526 | 1.54 × 10⁻³ |
| S20 | 0 | 88 | 12 | SP-SM | 1.527 | 1.75 × 10⁻³ |
| S21 | 0 | 91 | 9 | SP-SM | 1.675 | 2.61 × 10⁻³ |
| S22 | 0 | 85 | 15 | SM | 1.576 | 5.31 × 10⁻³ |
| S23 | 0 | 54 | 46 | SM | 1.775 | 6.92 × 10⁻³ |
| S24 | 3 | 11 | 86 | CL | 1.528 | 6.47 × 10⁻⁴ |
| S25 | 0 | 4 | 96 | CL | 1.625 | 4.58 × 10⁻⁴ |
| S26 | 0 | 93 | 7 | SP-SM | 1.499 | 2.39 × 10⁻³ |
| S27 | 2 | 87 | 11 | SP-SM | 1.479 | 5.71 × 10⁻⁴ |
| S28 | 1 | 95 | 4 | SP | 1.97 | 2.75 × 10⁻³ |
| S29 | 0 | 75 | 26 | SM | 1.719 | 5.46 × 10⁻³ |
| S30 | 0 | 49 | 41 | SM | 1.485 | 6.70 × 10⁻⁴ |
| S31 | 0 | 82 | 18 | SM | 1.79 | 5.00 × 10⁻⁴ |
| S32 | 0 | 73 | 27 | SM | 1.77 | 8.60 × 10⁻⁴ |
| S33 | 0 | 95 | 5 | SP-SM | 1.822 | 4.11 × 10⁻³ |
| S34 | 0 | 87 | 13 | SM | 1.777 | 3.20 × 10⁻³ |
| S35 | 1 | 94 | 5 | SP-SM | 1.698 | 9.720 × 10⁻⁴ |
| S36 | 0 | 80 | 20 | SM | 1.858 | 6.80 × 10⁻⁴ |
| S37 | 0 | 70 | 30 | SM | 1.82 | 8.43 × 10⁻⁴ |
| S38 | 0 | 83 | 17 | SM | 1.837 | 6.78 × 10⁻⁴ |
| S39 | 0 | 79 | 21 | SM | 1.988 | 5.99 × 10⁻⁴ |
| S40 | 0 | 59 | 41 | SM | 1.871 | 8.28 × 10⁻⁴ |
| S41 | 0 | 92 | 8 | SP-SM | 1.8 | 9.83 × 10⁻⁴ |
| S42 | 0 | 82 | 18 | SM | 1.821 | 2.99 × 10⁻⁴ |
| S43 | 0.5 | 84 | 15.5 | SM | 1.883 | 3.28 × 10⁻⁴ |
| S44 | 0.7 | 6.2 | 93.1 | CL-ML | 2.104 | 7.94 × 10−05 |
| S45 | 0 | 82.6 | 17.4 | SM | 1.901 | 2.28 × 10−03 |
| S46 | 0 | 85.3 | 14.7 | SM | 1.792 | 2.73 × 10−03 |
| S47 | 4.5 | 8.2 | 87.3 | CL | 2.056 | 6.68 × 10⁻⁴ |
| S48 | 0 | 86.8 | 13.2 | SM | 1.867 | 6.31 × 10⁻³ |
| S49 | 0 | 80 | 20 | SM | 1.849 | 6.97 × 10⁻³ |
| S50 | 0 | 79 | 21 | SM | 1.837 | 6.10 × 10⁻³ |
| S51 | 0 | 73.4 | 26.6 | SM | 1.816 | 7.66 × 10⁻⁴ |
| S52 | 0 | 73 | 27 | SM | 1.898 | 2.26 × 10⁻³ |
© 2019 by the authors. Licensee MDPI, Basel, Switzerland. This article is an open access article distributed under the terms and conditions of the Creative Commons Attribution (CC BY) license (http://creativecommons.org/licenses/by/4.0/).
Share and Cite
Khan, T.A.; Farooq, K.; Muhammad, M.; Khan, M.M.; Shah, S.A.R.; Shoaib, M.; Aslam, M.A.; Raza, S.S. The Effect of Fines on Hydraulic Conductivity of Lawrencepur, Chenab and Ravi Sand. Processes 2019, 7, 796. https://doi.org/10.3390/pr7110796
Khan TA, Farooq K, Muhammad M, Khan MM, Shah SAR, Shoaib M, Aslam MA, Raza SS. The Effect of Fines on Hydraulic Conductivity of Lawrencepur, Chenab and Ravi Sand. Processes. 2019; 7(11):796. https://doi.org/10.3390/pr7110796
Chicago/Turabian StyleKhan, Tanveer Ahmed, Khalid Farooq, Mirza Muhammad, Mudasser Muneer Khan, Syyed Adnan Raheel Shah, Muhammad Shoaib, Muhammad Asif Aslam, and Syed Safdar Raza. 2019. "The Effect of Fines on Hydraulic Conductivity of Lawrencepur, Chenab and Ravi Sand" Processes 7, no. 11: 796. https://doi.org/10.3390/pr7110796
APA StyleKhan, T. A., Farooq, K., Muhammad, M., Khan, M. M., Shah, S. A. R., Shoaib, M., Aslam, M. A., & Raza, S. S. (2019). The Effect of Fines on Hydraulic Conductivity of Lawrencepur, Chenab and Ravi Sand. Processes, 7(11), 796. https://doi.org/10.3390/pr7110796